Abstract
Current tests for plane stress characterization of fracture in automotive sheet metals include simple shear, uniaxial, plane strain, and biaxial tension, but there is a significant gap between shear and uniaxial tension. Presently, it remains uncertain whether the fracture strain experiences a reduction between simple shear and uniaxial tension or undergoes an exponential increase as the triaxiality decreases. Fracture in combined simple shear and tension is complicated by premature edge cracking in tension along with a strong sensitivity of fracture strain to the measurement lengthscale. To address these issues, several existing simple shear geometries were modified and evaluated, with a focus on obtaining approximately linear strain paths corresponding to combined uniaxial tension and simple shear suitable for experimental fracture characterization using digital image correlation (DIC). An experimental and numerical investigation was conducted using two planar geometries that do not require through-thickness machining and can be easily tested on a universal test frame. Finite-element analysis was used to investigate the influence of the notch eccentricity on the stress state and predicted fracture location. The most promising geometry in each coupon type was then selected and tested for a dual-phase advanced high-strength steel, DP1180. The performance of the two planar geometries was evaluated based on the linearity of strain and stress state, along with the location of fracture initiation. The best geometry was then used to evaluate and recalibrate the modified Mohr-Coulomb (MMC) fracture locus with data in combined shear and tension. The initial MMC calibration using four fracture tests that suppressed necking provided an accurate estimate for the fracture strain in combined uniaxial tension and simple shear. The MMC model correctly predicted a valley in the fracture strain between these two loading conditions.
1. Introduction
The past decade has seen tremendous improvements in the characterization and modeling of fracture in advanced high-strength steels (AHSS), aluminum, and other alloys used for lightweighting automotive structural components. Stress–state–dependent fracture criteria, such as the Modified Mohr-Coulomb (MMC) fracture model of Bai and Wierzbicki [1] and its variants, have been successful in predicting fracture across a variety of loading conditions [2,3,4,5]. Recently, an emphasis has been placed on improving the accuracy of experimental fracture characterization at tensile–dominated loadings required to calibrate the fracture models. Novel test methods have been developed to suppress necking instabilities and obtain proportional loading until fracture. Examples include the conical hole expansion and hole tension tests for uniaxial tension [6,7,8], the VDA238–100 v–bend and dihedral punch tests for plane strain tension [9,10], and miniature biaxial punch tests [11,12]. Fracture characterization in simple shear has been challenging due to its high fracture strains and propensity for premature edge cracking in tension [13]. Roth and Mohr [14] developed optimized shear test geometries to minimize the potential for edge cracking. The in–plane torsion test [12,15] is also being adopted since it avoids issues with edge cracking but requires a specialized test frame. Furthermore, advances in DIC have enabled investigations into strain delocalization and its influence on the mechanical properties and fracture [16,17,18,19].
Experimental fracture characterization in ductile sheet metals subjected to combined simple shear and tension remains a challenging topic. Simple shear is the most common form of shear loading in sheet metal, as pure shear is not possible. In pure shear, the directions of principal stress and the cumulative strain remain aligned while they diverge in simple shear due to the induced rotation. Simple shear induces unique microstructural changes compared to pure shear, leading to non–uniqueness in fracture loci that define the stress state using invariants such as the stress triaxiality and Lode parameter. The divergence between pure shear and simple shear fracture strains, which have the same applied triaxiality and Lode parameter of zero, can be seen in the voided unit cell studies of Tvergaard [20,21] and was discussed in detail by Butcher and Abedini [22] with respect to MMC–based fracture models. The same non–uniqueness applies to all other cases of combined loading involving simple or pure shear. Even when restricted to plane stress combined loading with simple shear, the same triaxiality can be obtained for shear with a superimposed uniaxial tension, plane strain tension, biaxial tension, and all other permutations.
In–plane shear–tension tests, such as those proposed by Shouler and Allwood [23], can help differentiate between these loading modes by following a path from simple shear to uniaxial tension. Jawale et al. [24] used a geometry similar to that of Shouler and Allwood [23] and reported that changing the distance (eccentricity) between the notches can vary the strain condition from simple shear to uniaxial tension. The experiments were performed on copper and brass, which have different properties than dual-phase steels and considerably higher ductility. Tension–torsion tests of tubes [25,26], Arcan tests [27,28] butterfly tests of sheet metals [29,30] provide a loading condition of simple shear with a superimposed plane strain tension. Materials possessing relatively low ductility can approximate a pure shear condition through simple shear when exposed to major strains around 50% [31]. The dual-phase (DP) advanced high strength steel, DP1180, considered in this study, has relatively low ductility, and it is assumed that the triaxiality can be sufficient to describe its plane stress fracture behavior.
The aim of this study is to conduct an experimental and numerical investigation into the characterization of fracture under combined loading of uniaxial tension and simple shear using planar geometries without the need for through-thickness machining like the Arcan and Butterfly tests and can also be tested on a universal test frame. Two test geometry are considered. The first geometry is a modified version of the one proposed by Shouler and Allwood [23] for formability characterization. The second geometry selected is a version of the so–called mini–shear of Peirs et al. [32] with the eccentricity removed to increase the triaxiality within the gauge region. Finite element analysis (FEA) was employed to validate the stress state within the coupons. Subsequently, the numerical results obtained from the FEA were compared to the experimental data acquired through digital image correlation (DIC) strain measurement [8,33,34,35,36]. The proportional fracture locus of the DP1180 steel was then calibrated and lengthscale effects of the finite-elements model and DIC discussed.
2. Plasticity Characterization
A detailed characterization of anisotropy for the same lot of DP1180 steel was performed by Abedini et al. [37] and Fast–Irvine et al. [38] using uniaxial tension, simple shear, disc compression, and plane strain tension tests. Table 1 reports the normalized stress ratios and R–values in various directions and stress states. The stress values were normalized by uniaxial tensile stress in the rolling direction (RD). The material has a mild anisotropy in the stress response, whereas the R–values are within the range of 0.82–1.00.

Table 1.
Normalized tensile, shear, and plane strain yield stresses and average R–values of DP1180 [37,38] at a plastic work level of 61.11 MJ/m3. The R–values were determined by measuring a range of major strains from 2% up to the onset of diffuse necking. The values given in the parentheses show the standard deviation.
In accordance with the collaborative nature of this research project involving multiple steel companies via the Auto/Steel Partnership (A/SP), the specific supplier, chemical composition, and microstructure of the DP1180 were not disclosed to ensure a blind study. It is emphasized that the DP1180 steel used in the study is commercially available. Additional information regarding the characterization of the same lot of DP1180, encompassing its shear behavior, formability, and constitutive properties, can be found in the following works: Khameneh et al. [39], Fast–Irvine et al. [38], Butcher et al. [40], Noder et al. [9], and Abedini et al. [37,41]. Furthermore, an extensive volume of test data for the same lot of DP1180 steel is publicly available as part of the Numisheet 2022 fracture benchmark on non–linear strain paths [42].
2.1. Anisotropic Yield Criterion
Table 2 presents the calibrated parameters of the anisotropic Yld2004 yield function [43], which were obtained by Fast–Irvine [44] using the data provided in Table 1. The yield function exponent of m = 19.34 was applied during calibration. The resulting calibrated yield surface is depicted in Figure 1a, while Figure 1b presents the comparison of the yield function predictions and experimental data.
Table 2.
Yld2004 parameters for DP1180 from Fast–Irvine et al. [38].
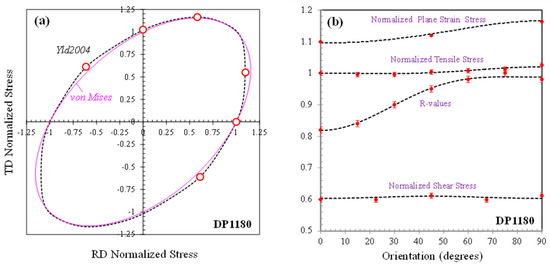
Figure 1.
(a) The von Mises calibrated Yld2004 yield surfaces and (b) normalized stress ratios and R–values of Yld2004 in various directions for DP1180 with regards to the rolling direction. Symbols indicate the experimental data used for calibration.
It is worth noting that, for tensile loading in the transverse direction, which corresponds to the DP1180’s lowest fracture limits, the von Mises yield function is a close approximation to the Yld2004. For further details on the yield function, as well as its implementation as material type 199 (*MAT_BARLAT_YLD2004) in the LS–DYNA finite-element code, readers are referred to Barlat et al. [43].
2.2. Hardening Behavior
The hardening behavior of the DP1180 was evaluated up to large strains using a miniature tensile specimen (Figure 2a) and the area–reduction method (ARM) of Abedini et al. [41] that uses stereo DIC to measure the area of the minimum cross–section and obtain the true stress with a set of empirical correction factors to account for triaxial effects. A modified Hockett–Sherby (MHS) model was calibrated to the hardening data, as shown in Equation (1). The Considère criterion was enforced as a calibration constraint, the coefficients of the model are provided in Table 3 and compared to the test data in Figure 2b.
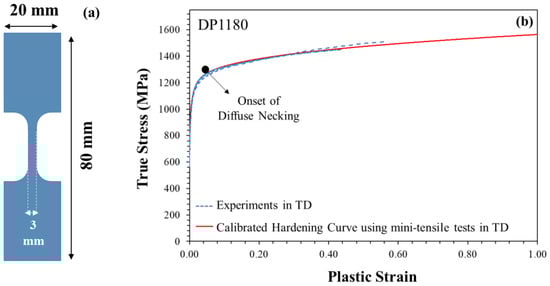
Figure 2.
(a) Miniature tensile geometry used for hardening curve evaluation of DP1180 from Abedini et al. [41]. (b) Calibrated hardening curve for DP1180, obtained from the miniature tensile experiments, with the modified Hockett–Sherby (MHS) model (Equation (1)) and its coefficients reported in Table 3.
Table 3.
The modified Hockett–Sherby model coefficients calibrated for DP1180 in transverse direction (TD).
2.3. Fracture Modelling
The process of fracture in ductile metals involves the nucleation, growth, and coalescence of microscopic voids, leading to a rapid drop in load–bearing capacity and ultimately causing fracture. Modelling of ductile fracture can be divided into physical and phenomenological approaches. In phenomenological approaches, fracture is considered a sudden event that occurs when the stress and strain states of an undamaged material reach a critical level. They are known as uncoupled models because the effect of damage on the plastic behavior is not considered [45]. These models are popular in industrial applications because they can be paired with any desired metal plasticity model, are easy to calibrate from physical tests, and can be efficiently implemented into finite element codes. Modified Mohr-Coulomb (MMC) type fracture models are built upon the existence of a proportional failure locus in plane stress, or failure surface in 3D loading, along with a damage accumulation function to account for non–linear load histories. Generally, the equivalent plastic strain is employed as the failure metric, and the stress state is identified by the stress triaxiality and Lode parameter [46].
2.3.1. Strain State and Stress State Characterization
Ideally, stress–state–dependent fracture models are calibrated using test data obtained under a constant stress state. This is more reliable than relying on the principal strain path in loadings with a simple shear component because the cumulative principal strain directions may not remain aligned with the principal stress directions (non–coaxial). However, the strain path can still be useful in understanding the linearity of the strain history and is defined as the incremental ratio of the minor–to–major in–plane principal strain:
For simple shear, the ideal strain path is −1, which follows from the applied deformation gradient, while the path for uniaxial tension depends upon the tensile R–value. For the DP1180 in transverse direction (TD), the ideal strain path for uniaxial tension is approximately −1/2.
The stress state can be characterized using the stress triaxiality, η, and the normalized Lode angle parameter, L, defined as
where J2 and J3 represent the second and third deviatoric stress invariants, respectively. The theoretical values of stress triaxiality and Lode parameter for uniaxial tension are 1/3 and 1, respectively. In simple and pure shear loading, both values are zero. In the plane stress condition, the triaxiality and Lode parameter are interrelated, thus, only one is used, typically the triaxiality.
2.3.2. Damage Accumulation
A damage accumulation function is used to account for non–linear loading histories where the stress triaxiality and Lode parameter change with deformation. The evolution of the damage parameter is modeled by integrating a stress–state–dependent weighting function f(σij) along with the equivalent plastic strain () as presented in Equation (5)
In the present work, the generalized incremental stress–state–dependent damage model (GISSMO) in Equation (7) is utilized within LS–DYNA software [47].
where dD is incremental damage, D is the current damage, dεeq is the incremental plastic strain, and n is the damage exponent. By choosing an exponent n = 1, Equation (6) reverts to the linear Johnson–Cook [48] damage accumulation function.
2.3.3. Calibration of the Fracture Locus of DP1180
Functional forms are required to describe the stress–state–dependent fracture locus to interpolate between the experimental stress states since many load cases are not feasible for experimental testing of sheet metals such as fracture in compression. Bai and Wierzbicki [1] revisited the Mohr-Coulomb fracture criterion [49,50] to develop a model for describing ductile fracture in uncracked bodies. The Mohr-Coulomb criterion has been widely utilized in rock and solid mechanics, as it accurately captures the impact of both hydrostatic pressure and the Lode parameter on fracture. Although the plastic yielding of ductile metals is relatively independent of the hydrostatic stress, fracture is not, and the MC model can describe the experimental trends of the fracture strain in metals [51]. The modified Mohr-Coulomb (MMC) model was established by Bai and Wierzbicki [1] by using the MC model as a fracture envelope that bounds an isotropic yield surface that expands with hardening. The plastic strain at which the surfaces intersect is defined as the fracture strain for that stress state.
Equation (7) is a variant of the uncoupled MMC fracture locus from Bai and Wierzbicki [1] in the space of ().
There are five calibration parameters () to determine in Equation (7). The preliminary fracture locus of the DP1180 was calibrated using four experimental points in shear, uniaxial, plane strain, and biaxial loading conditions. The fracture data was adapted from recent studies by the authors on the same lot of DP1180 as part of the Numisheet 2022 [42] non–linear fracture benchmark [39]. The experimental fracture strains and stress triaxialities for plane stress loading conditions are provided in Table 4.
Table 4.
Stress triaxialities and equivalent fracture strains of DP1180 in four loading conditions described in Khameneh et al. [39]. The values in the parentheses are the standard deviation of the repeated tests.
Figure 3 presents the plane stress MMC fracture locus of DP1180, including the four fracture points and assuming . The corresponding MMC coefficients are reported in Table 5. Due to there being no test data between shear and uniaxial tension, the model predicts a trough or valley in the fracture strain in combined tension and shear. Additional data is required to confirm if this trend is physical. Although the biaxial fracture point is poorly predicted, the calibration in shear and uniaxial tension is reasonable and corresponds to the region of stress states encountered locally in the coupon simulations in Section 4.
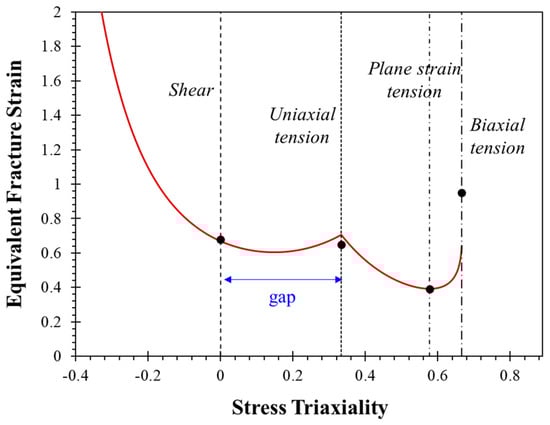
Figure 3.
Four–point plane stress MMC fracture locus of DP1180 in TD using Equation (7). The coefficients are provided in Table 5.
Table 5.
Coefficients of the fracture locus in Equation (7) and shown in Figure 3.
3. Fracture Characterization of Combined Shear–Tensile Loading Condition
3.1. Geometry Selection
Figure 4a,b shows the initial design of the Shouler and Allwood [23] geometry, who performed a finite element analysis to predict the strain evolution in the gauge area. They then added the side tabs shown in Figure 4c to improve the linearity of the strain path. These tabs were designed to avoid failure in uniaxial extension before the gauge area fails in shear. The upper central tab was added to keep the sample in–plane using tests with a hemispherical punch and will be removed in the present work, which will use a universal tensile test frame.
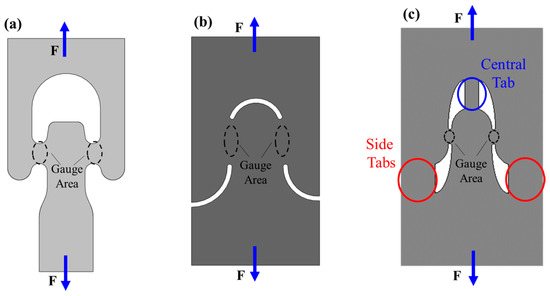
Figure 4.
Sample development stages of Shouler and Allwood [23]. (a) Initial design of the sample for strain evolution prediction. (b) Improved sample with simplified geometry, facilitating ease of fabrication and compatibility with various test machines. (c) Modified sample suitable for experiments, featuring side and central tabs designed for compatibility with both tensile machines and hemispherical punch tests.
Shouler and Allwood [23] reported that the offset between the notches affects the strain path. Consequently, the design in Figure 4c without the central tab and with various vertical and horizontal offset sizes to achieve a range of stress and strain states is evaluated numerically. The modified Shouler and Allwood geometry, referred to as the SA geometry in this study, is depicted in Figure 5a. For the SA + 1 configuration, an offset of 1 mm between the notches was introduced. Additional details on the geometry modifications and their influence on the strain state are provided in Appendix A.1. A negative offset is defined as moving the notches towards each other, while the positive offset indicates their separation.
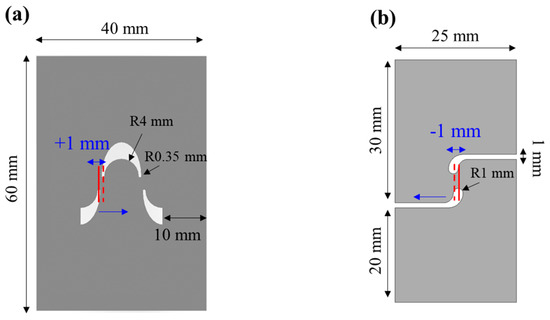
Figure 5.
(a) Modified Shouler and Allwood [23], SA geometry showing the offset between the notches (SA + 1). (b) Mini–shear specimen geometry (MS) adopted from Peirs et al. [52]. The zero–offset mini–shear (MS–ZO) geometry is obtained by removing the −1 mm offset between the notches.
The second geometry considered for combined shear and tensile loading is the modified mini–shear geometry of Peirs et al. [52], which has previously been investigated for the same lot of DP1180 by Khameneh et al. [39], with fracture appearing to initiate in the gauge region and not at the edges. Therefore, the eccentricities in the geometry of Peirs et al. [53] can be varied to determine if a combined state of uniaxial tension and simple shear can be obtained. The geometry with an offset between the notches of zero is referred to as mini–shear zero–offset (MS–ZO) throughout this study. The advantage of Peirs et al. [52] geometry is its simplicity compared to the Shouler and Allwood geometry, which has two gauge regions.
Figure 5b illustrates the original mini–shear geometry of Peirs et al. [52], where there is a −1 mm offset or eccentricity between the center of notches. The finite element evaluations of both geometries are provided in Section 3.2.
3.2. Finite Element Analysis
3.2.1. Details of Finite Element Simulation
Finite element (FE) models of the test geometries were developed in LS–DYNA R11.1. Hexahedral solid elements were used in the gauge region with a size of 0.10 mm. A mesh convergence study was performed and is summarized in Appendix A.2. The elements were formulated using a fully integrated approach that involved selectively reduced formulation (element type of −1 in LS–DYNA). Hourglass control was implemented using a coefficient of 0.15 and the Puso formulation [53]. Explicit time integration was utilized with the invariant node numbering option (INN) activated for updating the material axes. The mesh patterns used in the simulations are depicted in Figure 6a,b for SA + 1 and MS–ZO, respectively.
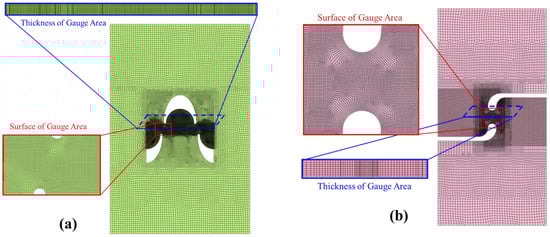
Figure 6.
Discretized models of (a) SA + 1 and (b) MS–ZO geometries showing the elements of the gauge area in both surface and through-thickness views.
The damage accumulation model of GISSMO was activated in the FE model to observe element deletion and fracture initiation in the revised geometries. This represents a preliminary fracture locus of Section 2.3.3, where the predicted behavior between shear and uniaxial tension is an outcome of the MMC model. The fracture locus will be revised in Section 4 based on the outcome of the experimental tests.
3.2.2. Results of Finite Element Simulation
The numerical simulations were performed to investigate the optimal horizontal offset dimensions for modified SA and Peirs et al. [52] geometries that result in the desired stress and strain states. Figure 7a shows the different versions of SA geometry considered. The fracture initiation location or the first failed element is used to evaluate the performance of the geometry. Ideally, fracture will initiate within the center of the gauge region instead of near the edge, which implies a tensile–dominated failure. The fracture initiation locations are shown in Figure 7b, and the corresponding stress triaxiality, Lode parameter, and strain paths are shown in Figure 8. As the size of the offset increases, the stress and strain states move towards the uniaxial condition. Unfortunately, all geometries show fracture near the edge. The geometry with an offset of +1 mm was selected for experimental investigation due to its stress state being approximately mid–way between shear and uniaxial tension.
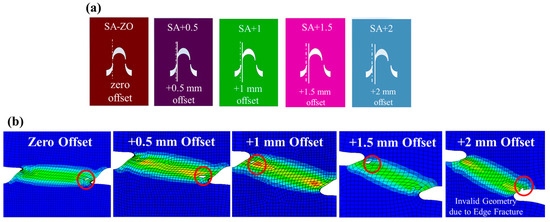
Figure 7.
(a) Modified SA geometries based on horizontal offset between the notches (increasing offset size from left to right). (b) Equivalent strain contour of the Finite Element model depicting fracture initiation and the first failed element in the geometries of part (a).
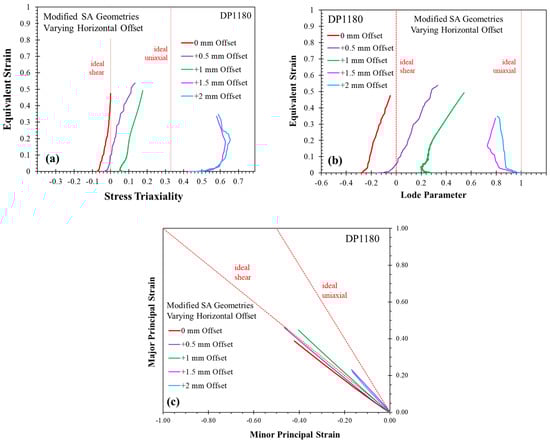
Figure 8.
Stress and strain states of geometries of Figure 7: (a) Stress Triaxiality and (b) Lode Parameter of the first failed elements in each geometry. (c) Strain path of the first failed element in each geometry.
Figure 9a presents the modified Peirs et al. [52] geometries with horizontal offsets ranging from −1 to 1.5 mm. The stress and stress state of the first failed elements are presented in Figure 10a–c with their locations shown in Figure 11b. The mini–shear geometry (MS) shows an approximately linear strain path in simple shear with fracture initiation predicted to occur at the center of the gauge area. The zero–offset geometry (MS–ZO) provides a relatively constant stress state and linear strain path, with fracture predicted to initiate within the center of the gauge region. The stress and strain states in other geometries are closer to uniaxial tension. Consequently, the MS–ZO geometry was chosen for experimental evaluation in a combined shear–tension loading. The MS geometry was also evaluated experimentally in conjunction with the two shear–tension geometries to provide a reference for the shear fracture strain.
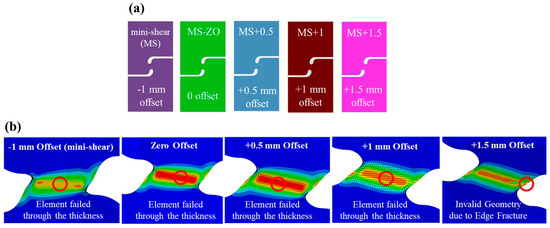
Figure 9.
(a) Modified mini–shear geometries based on the offset size between the notches. (b) Equivalent strain contour of the Finite Element model depicting fracture initiation and the first failed element in the geometries of part (a).
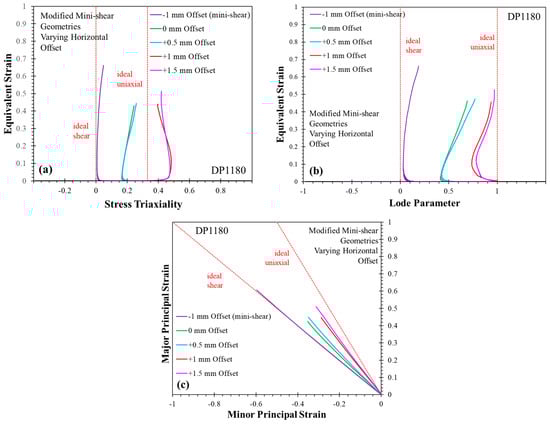
Figure 10.
Stress and strain states of geometries of Figure 9: (a) Stress triaxiality and (b) Lode parameter of the failed element in each geometry. (c) Strain path of the failed element in each geometry.
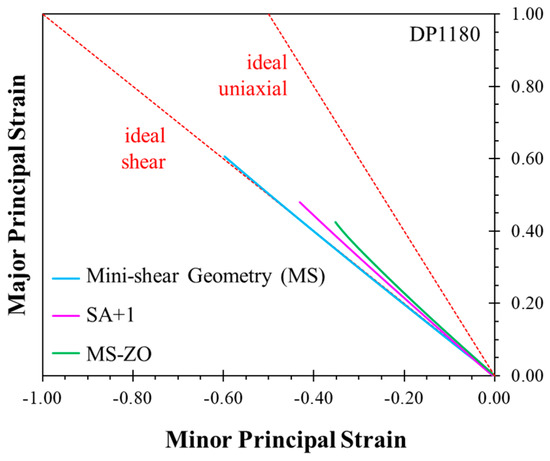
Figure 11.
Comparison of strain path in the first failed element until fracture.
The following plots (Figure 11 and Figure 12) compare the numerical stress and strain states for the SA and MS geometries selected for experimental characterization. Although the strain paths appear linear, the stress triaxiality and Lode parameter of the first failed element evolve in an approximately linear manner with the equivalent strain. The largest evolution is in the Lode parameter.
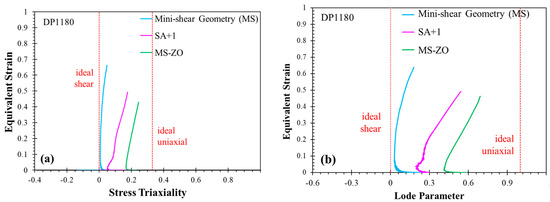
Figure 12.
Comparison of (a) Stress triaxiality and (b) Lode parameter of the first failed elements of the geometries up to fracture.
3.3. Experimental Evaluation
3.3.1. Procedure
The experiments were conducted using a 50 kN electromechanical test frame, with a constant crosshead velocity set at 0.003 mm/s under room temperature conditions. The nominal shear strain rate in the gauge region was 0.001 s−1 due to the gauge region length of 3 mm in the three geometries. The strain fields and displacement were measured using Vic–9 3D DIC software from Correlated Solutions Inc. (Irmo, SC, USA). A Gazelle Point Grey® camera was used with a TAMRON® SP (Di) lens and a focal length of 180 mm. The stand–off distance between the camera and the sample was 750 mm. The engineering strain in all geometries was measured with extensometers lengths of 10 mm. It is worth noting that a point inspector tool is utilized to extract data in the experimental evaluations. The DIC virtual strain gauge (VSG) that amalgamates the image resolution, subset size, filter, and step size is outlined by Jones and Iadicola [54] as:
To select the appropriate parameter values for the DIC investigations, a VSG convergence study was performed, with a summary provided in Figure 13. The image scale for the tensile tests was 0.012 mm/pixel, and since the speckle pattern governs the subset size, the subset was fixed at 31 pixels for both geometries. The step size and strain filter were then varied to obtain different VSG sizes using Equation (9). The DIC camera frame rate is especially important in fracture characterization to capture the fracture location. According to the DIC Good Practice Guide [54], the displacement between frames should be lower than or equal to one subset size. Consequently, the frame rate of 5 Hz is used in all analyses for consistency and obtaining the requirements. A detailed analysis of the VSG and DIC parameters on shear testing is provided by Khameneh et al. [39]. A strain filter of 7, step size of 2 pixels, and subset size of 29 pixels result in a VSG value of 0.625 mm. As shown in Figure 13, the strains for both tests appear to converge for VSGs between 0.48 and 0.625 mm. Consequently, the step size of 3 pixels and strain filter of 9 were used for the fracture investigations, which resulted in a VSG of 0.588 mm. The size of the VSG is compared to the element size in the FE model in Figure 13.
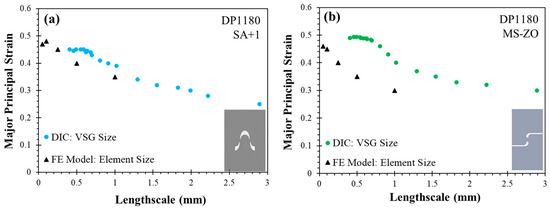
Figure 13.
The effect of lengthscale in experiment (VSG) and in FE model (element size) on the major principal strain of the (a) SA + 1 and (b) MS–ZO geometries.
3.3.2. Comparative Study of Experimental and Numerical Data
Figure 14a,b compares the experimental and numerical stress responses of MS–ZO and SA + 1 geometries until the onset of fracture. The nominal or engineering stress is calculated by dividing the force by the gauge area as in Equation (10). In this equation, τ represents the average stress, F denotes the applied force, t signifies the sheet thickness, and L corresponds to the length of the shear region, which is set to 3 mm. For the SA + 1 configuration, with two gauges present, the gauge area is doubled in Equation (10). Overall, the stress response was well predicted in all cases, which attests to the accurate calibration of the Yld2004 yield function and hardening model. Figure 15 illustrates the DIC and FE contours of the major principal strain before fracture in conjunction with the extensometer and point tools to extract the global and local responses of the geometries, respectively.
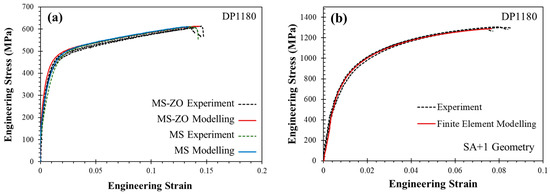
Figure 14.
Global response of experiments compared to the simulation results in (a) MS–ZO and (b) SA + 1 geometries.
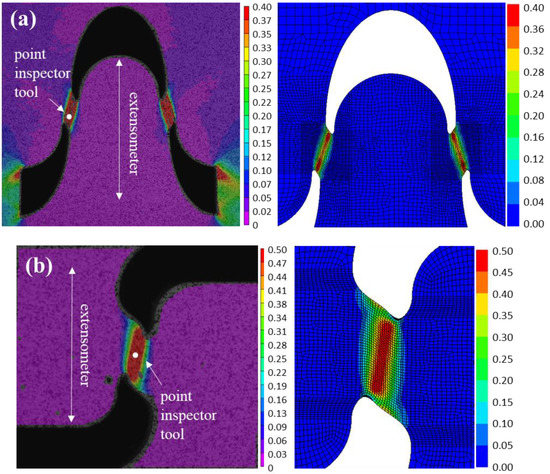
Figure 15.
DIC and FE contours of major principal strain before fracture (a) in SA + 1 and (b) MS–ZO geometry. In the DIC evaluation, the point inspector tool was used to extract the local strain history as it was the maximum strain location.
The strain history and stress state of the tests at the center of the gauge region measured using DIC are compared with the simulation data from the first element to fail in Figure 16 and Figure 17. The experimental equivalent strain and triaxiality were integrated using von Mises yield function and the incremental strain path under a plane stress assumption and compared with the element data in Figure 17. The mini–shear sample exhibits a strain path that is close to ideal, and the MS–ZO geometry, on the other hand, demonstrates an approximately linear strain path in the desired area, and there is a slight deviation from ideal shear towards uniaxial path in SA + 1 geometry. The comparison of the results obtained from the SA + 1 and MS–ZO experiments indicates that the MS–ZO geometry displays a more linear behavior in both strain path and stress triaxiality. Furthermore, the stress and strain states in the MS–ZO geometry fall within the desired range between tension and shear, whereas the SA + 1 geometry is situated closer to the tension condition. The experimental equivalent fracture strain and the triaxiality of both geometries are reported in Table 6, along with their standard deviation. To make a comprehensive comparison, the location of fracture initiation is evaluated for both geometries in the next section.
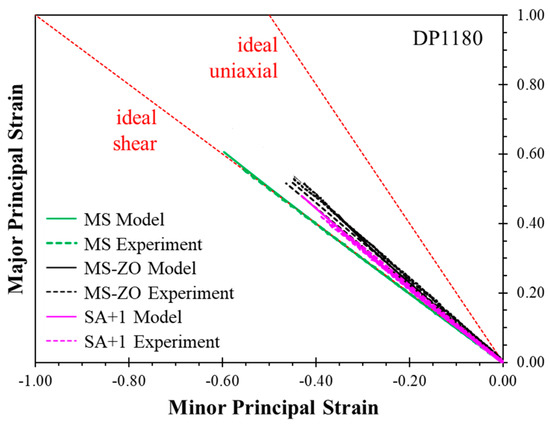
Figure 16.
Evaluation of strain state at experiments and FE models. The center of gauge area at the experiments and first failed elements at FE models used.
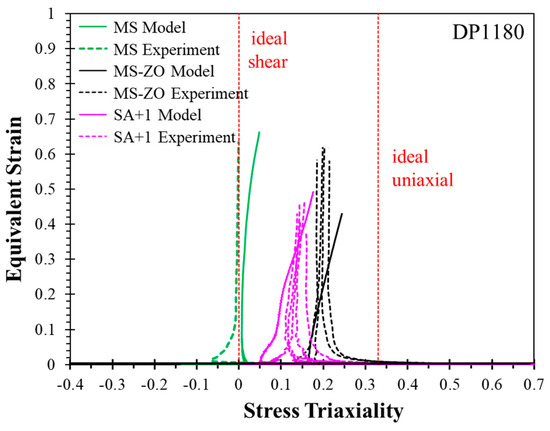
Figure 17.
Evaluation of stress state at experiments and FE models. The center of gauge area at the experiments and first failed elements at FE models used.
Table 6.
Equivalent strains and triaxialities of DP1180 in newly developed combined shear–tension experiments. The value in parenthesis shows the standard deviation of different repeats.
3.3.3. Location of Fracture Initiation
Identifying the location of fracture initiation in shear–dominated tests is challenging since the crack does not open as in tensile loading. To gain insight into the likely location of the fracture, two tests were halted after load drop and prior to rupture. The gauge region was then extracted from the coupons, mounted, polished, and viewed under an optical microscope to observe signs of microscopic void damage.
The optical micrograph of the SA + 1 geometry is shown in Figure 18 where there is significant void nucleation and coalescence within the gauge region. It appears that fracture is initiating near the lower notch leading to lower fracture strains compared to the MS–ZO.
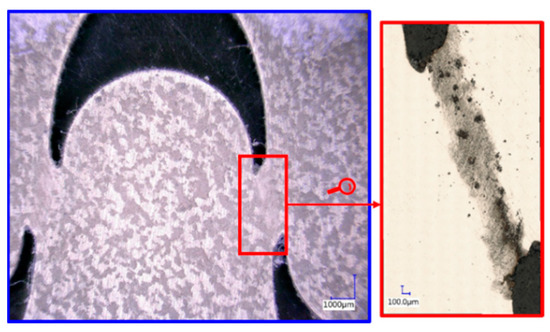
Figure 18.
Optical micrograph of the interrupted SA + 1 sample revealing significant void nucleation and coalescence in the gauge region. It appears fracture initiated from the lower notch.
In contrast to the SA + 1 geometry, the micrograph of the interrupted MS–ZO presented in Figure 19 shows significant void damage localized within the center of the gauge region rather than at the edge. While edge cracking cannot be completely ruled out as it may occur at a higher strain level, it appears likely that fracture is initiating within the center of the gauge region for DP1180 steel.
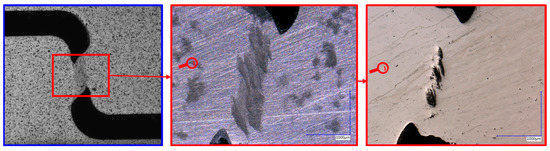
Figure 19.
Optical micrograph of the interrupted MS–ZO sample revealing significant void nucleation concentrated in the center of the gauge region where fracture likely initiated.
Overall, the MS–ZO geometry was most successful in characterizing fracture in a state of combined uniaxial tension and simple shear for DP1180 steel. This test can now be included in the evaluation of the MMC fracture locus calibrated using only simple shear, uniaxial tension, plane strain tension, and biaxial tension data.
4. Recalibration of the Fracture Locus
The DP1180 fracture locus of Section 2.3.3 is revisited to include the fracture strain of the MS–ZO in calibration of the MMC model in Equation (7). Figure 20a,b depicts the recalibrated plane stress fracture locus and 3D fracture surface, respectively. The five coefficients in the MMC model were identified using the five experimental fracture strains and are provided in Table 7. The predicted fracture strain and stress triaxiality of both combined geometries are shown in Figure 20a. The GISSMO damage model with the damage exponent of n = 2 was used to integrate the strain path of combined geometries. Although the SA geometry exhibited noticeable edge fracture, its fracture strain and average triaxiality offer conservative estimations for the fracture locus in combined simple shear and uniaxial tension. The experimental results of MS–ZO demonstrate a remarkable alignment with the recalibrated fracture locus, as illustrated. Moreover, the utilization of five data points for calibrating the fracture locus enabled a more accurate calibration in all of the stress states. It is noted that the fracture locus improved in equal biaxial tension as a consequence of the additional flexibility allowed by removing the constraint on used to reduce the MMC to four parameters in the original calibration.
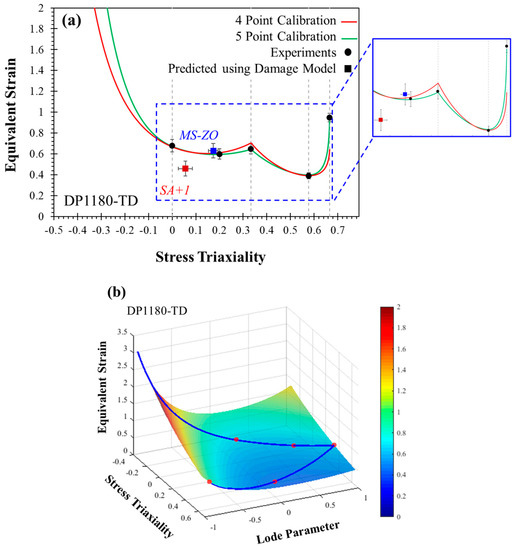
Figure 20.
(a) Comparison of the plane stress fracture locus using MMC models calibrated with four and five fracture strains. The coefficients of four–point and five–point loci reported in Table 5 and Table 7, respectively. (b) 3D fracture surface of DP1180 in TD calibrated using five fracture points.
Table 7.
Updated coefficients of Equation (7) calibrated using five data points and five parameters. The fracture locus and surface are shown in Figure 20a,b.
5. Conclusions
The primary objective of this study was to develop an experimental method for investigating the fracture behavior of DP1180 steel subjected to combined simple shear and uniaxial tension. To this end, two different geometries were evaluated that can be conveniently tested on a universal test frame and do not require through-thickness machining. The following are the primary conclusions of this study, which pertain specifically to DP1180 steel but may also be relevant for similar steels:
- The SA + 1 geometry, based on the model by Shouler and Allwood [23], exhibited an average triaxiality value of approximately 0.15. There was a high likelihood of fracture initiation at the edge of the specimen. Consequently, the SA + 1 geometry provided a conservative estimate of the fracture strain in combined uniaxial tension and shear.
- The MS–ZO geometry, a modified mini–shear geometry inspired by Peirs et al. [52], maintained a triaxiality value of approximately 0.20. Significant void damage was observed within the center of the gauge region during the DP1180 steel tests. In addition, the MS–ZO geometry demonstrated a more constant stress–state compared to the SA + 1. The simple MS–ZO with a single gauge region appears attractive for combined shear and tensile fracture characterization of materials with similar ductility to DP1180.
- The MMC fracture locus was initially calibrated based on four data points obtained from characterization tests in which necking was suppressed. The MMC fracture locus closely predicted the observed behavior between shear and uniaxial tension. This was not expected, given the phenomenological nature of the MMC model and that no data for combined shear and tension was used in its calibration. The inclusion of the fracture strain at the intermediate triaxiality of 0.20 from the MS–ZO test was crucial to confirm the predicted MMC fracture locus for DP1180. The addition of five test points allowed for the use of a five–parameter version of the MMC model with a markedly improved calibration from shear to biaxial tension.
- It is recommended that future studies include combined tension and shear tests such as the MS–ZO to evaluate the predictive accuracy of the MMC model. For the DP1180, the MMC model accurately predicted the fracture strain of the MS–ZO, but it remains unclear if this would hold for other AHSS.
- For the DIC and finite-element lengthscales considered in this work, there does appear to be a valley or trough in the fracture strain of DP1180 sheet in a combined loading of simple shear with a superimposed uniaxial tension. It is possible that the trend could be different in other loading scenarios with the same nominal triaxiality and Lode parameters, such as in simple shear with a superimposed plane strain tension in tension–torsion tests of tubes, as discussed in Butcher and Abedini [22].
Author Contributions
Conceptualization, F.K., A.A. and C.B.; Methodology, F.K. and A.A.; Formal analysis, A.A.; Investigation, F.K.; Writing–original draft, F.K., A.A. and C.B.; Project administration, C.B.; Funding acquisition, C.B. All authors have read and agreed to the published version of the manuscript.
Funding
This research was primarily funded by the Auto/Steel Partnership (ASP–CFMT–2021).
Data Availability Statement
Contact the authors if interested in accessing the test data.
Acknowledgments
The authors would like to thank Thomas Stoughton of General Motors and members of the Non–linear Strain Path Project Team of the Auto/Steel Partnership (A/SP) for technical and financial support. In addition, this work was financially supported in part by the Natural Sciences and Engineering Research Council of Canada (NSERC) and Ontario Graduate Scholarship (OGS) and is gratefully acknowledged. The authors would also like to thank Amir Zhumagulov from the University of Waterloo for many valuable conversations on experiments and DIC analysis.
Conflicts of Interest
The authors declare no conflict of interest.
Appendix A
Appendix A.1. Investigation of Combined Geometries
Preliminary simulations were conducted to achieve the modified SA geometry appropriate for fracture characterization in combined geometry. The effect of eccentricity, notch radius, and arc sizes were investigated. The presence of side tabs in the design shown in Figure A1 helps to prevent rotation and create proportional stress and strain states, however, it should be noted that the size of these tabs may need to be adjusted to accommodate the size of the test machine or the test region.

Figure A1.
The initial combined shear–tension geometry proposed by Shouler and Allwood [23].
Figure A1.
The initial combined shear–tension geometry proposed by Shouler and Allwood [23].

Figure A2a depicts geometric configurations that were obtained by altering different factors. The location of fracture initiation in the FE models is shown in Figure A2b and Figure A3a,b illustrate the stress and strain states of the geometries, respectively. Geometry 4 exhibited an appropriate stress and strain state, and the fracture did not initiate from the edge, making it a suitable candidate for further investigations.

Figure A2.
(a) The modified geometries changing different parameters. (b) Equivalent strain contour of the Finite Element model depicting fracture initiation and the first failed element in the geometries of part (a).
Figure A2.
(a) The modified geometries changing different parameters. (b) Equivalent strain contour of the Finite Element model depicting fracture initiation and the first failed element in the geometries of part (a).


Figure A3.
(a) The stress state and (b) strain states of geometries 1 to 4 from Figure A2.
Figure A3.
(a) The stress state and (b) strain states of geometries 1 to 4 from Figure A2.

Appendix A.2. Evaluation of Mesh Size Convergence
The mesh profiles of the combined shear–tension geometries are presented in Figure A4, where cubic solid elements with aspect ratios of unity were utilized. The effect of mesh size on the global and local results of the tensile experiments is shown in Figure A5 and Figure A6. These figures reveal that convergence in the global response is more easily achieved than convergence in the local strains. However, both global response and local strains appear to converge at the mesh size of 0.1 mm in the gauge area.

Figure A4.
Comparison of different mesh sizes relative to the geometries: (a) SA + 1 and (b) MS–ZO geometry, illustrating the scale of mesh refinement in the models.
Figure A4.
Comparison of different mesh sizes relative to the geometries: (a) SA + 1 and (b) MS–ZO geometry, illustrating the scale of mesh refinement in the models.


Figure A5.
The effect of mesh size on the (a) global and (b) local properties of SA + 1 tests.
Figure A5.
The effect of mesh size on the (a) global and (b) local properties of SA + 1 tests.


Figure A6.
The effect of mesh size on the (a) global and (b) local properties of MS–ZO tests.
Figure A6.
The effect of mesh size on the (a) global and (b) local properties of MS–ZO tests.

References
- Bai, Y.; Wierzbicki, T. Application of extended Mohr–Coulomb criterion to ductile fracture. Int. J. Fract. 2010, 161, 1–20. [Google Scholar] [CrossRef]
- Rahmaan, T.; Butcher, C.; Kim, S.; Worswick, M. Characterization and prediction of fracture in 6000– and 7000–series aluminum alloy sheet under various stress states. Thin–Walled Struct. 2022, 173, 108958. [Google Scholar] [CrossRef]
- Wei, X.; Liu, Y.; Zhang, X. Effect of non–linear tension–compression loading reversal on the hardening behavior and initiation fracture strain of a cold–rolled TRIP780 steel sheet. Mater. Today Commun. 2022, 30, 103076. [Google Scholar] [CrossRef]
- Lim, S.; Huh, H. Ductile fracture behavior of BCC and FCC metals at a wide range of strain rates. Int. J. Impact Eng. 2022, 159, 104050. [Google Scholar] [CrossRef]
- Chandran, S.; Liu, W.; Lian, J.; Munstermann, S.; Verleysen, P. Strain rate dependent plasticity and fracture of DP1000 steel under proportional and non–proportional loading. Eur. J. Mech. A/Solids 2022, 92, 104446. [Google Scholar] [CrossRef]
- Pathak, N.; Butcher, C.; Worswick, M.J.; Bellhouse, E.; Gao, J. Damage evolution in complex–phase and dual–phase steels during edge stretching. Materials 2017, 10, 346. [Google Scholar] [CrossRef]
- Erice, B.; Roth, C.C.; Mohr, D. Stress–state and strain–rate dependent ductile fracture of dual and complex phase steel. Mech. Mater. 2018, 116, 11–32. [Google Scholar] [CrossRef]
- Narayanan, A.; Abedini, A.; Khameneh, F.; Butcher, C. An Experimental Methodology to Characterize the Uniaxial Fracture Strain of Sheet Metals Using the Conical Hole Expansion Test. J. Mater. Eng. Perform. 2022, 32, 4456–4482. [Google Scholar] [CrossRef]
- Noder, J.; Gutierrez, J.; Zhumagulov, A.; Khameneh, F. Constitutive, Formability, and Fracture Characterization of 3rd Gen AHSS with an Ultimate Tensile Strength of 1180 MPa. SAE Tech. 2021, 3, 1395–1407. [Google Scholar] [CrossRef]
- Beerli, T.; Grolleau, V.; Mohr, D.; Roth, C.C. Axisymmetric V–Bending of Sheet Metal: Determining the Fracture Strain and the Weakest Material Direction for Plane Strain Tension in One Test. IOP Conf. Ser. Mater. Sci. Eng. 2022, 1238, 012052. [Google Scholar] [CrossRef]
- Roth, C.C.; Mohr, D. Ductile fracture experiments with locally proportional loading histories. Int. J. Plast. 2016, 79, 328–354. [Google Scholar] [CrossRef]
- Grolleau, V.; Roth, C.C.; Mohr, D. Characterizing plasticity and fracture of sheet metal through a novel in–plane torsion experiment. IOP Conf. Ser. Mater. Sci. Eng. 2019, 651, 012101. [Google Scholar] [CrossRef]
- Narayanan, A.; Abedini, A.; Weinschenk, A.; Worswick, M.; Butcher, C. Evaluation of Simple Shear Test Geometries for Constitutive Characterization using Virtual Experiments. IOP Conf. Ser. Mater. Sci. Eng. 2021, 1157, 012066. [Google Scholar] [CrossRef]
- Roth, C.C.; Mohr, D. Determining the strain to fracture for simple shear for a wide range of sheet metals. Int. J. Mech. Sci. 2018, 149, 224–240. [Google Scholar] [CrossRef]
- Traphöner, H.; Clausmeyer, T.; Tekkaya, A.E. Methods for measuring large shear strains in in–plane torsion tests. J. Mater. Process. Technol. 2021, 287, 116516. [Google Scholar] [CrossRef]
- Wei, S.; Kim, J.; Tasan, C. In–situ investigation of plasticity in a TI–Al–V–Fe (α+β) alloy: Slip mechanisms, strain localization, and partitioning. Int. J. Plast. 2022, 148, 103131. [Google Scholar] [CrossRef]
- Wu, H.; Huang, M.; Xia, Y.; Li, X.; Li, R.; Liu, C.; Gan, W.; Xiao, T.; Geng, L.; Liu, Q.; et al. The importance of interfacial stress–affected zone in evading the strength–ductility trade–off of heterogeneous multi–layered composites. Int. J. Plast. 2023, 160, 103485. [Google Scholar] [CrossRef]
- Weinder, A.; Biermann, H. Review on Strain Localization Phenomena Studied by High–resolution digital image correlation. Adv. Eng. Mater. 2021, 23, 2001409. [Google Scholar]
- Tang, A.; Liu, H.; Liu, G.; Zhong, Y.; Wang, L.; Lu, Q.; Wang, J.; Shen, Y. Normal distribution of local strain: A universal law of plastic deformation in material. Phy. Rev. Lett. 2020, 124, 155501. [Google Scholar] [CrossRef]
- Tvergaard, V. Effect of stress–state and spacing on voids in a shear–field. Int. J. Solids Struct. 2012, 49, 3047–3054. [Google Scholar] [CrossRef]
- Tvergaard, V. Behaviour of porous ductile solids at low stress triaxiality in differentmodes of deformation. Int. J. Solids Struct. 2015, 60–61, 28–34. [Google Scholar] [CrossRef]
- Butcher, C.; Abedini, A. On Phenomenological Failure Loci of Metals under Constant Stress States of Combined Tension and Shear. Metals 2019, 9, 1052. [Google Scholar] [CrossRef]
- Shouler, D.R.; Allwood, J.M. Design and use of a novel sample design for formability testing in pure shear. J. Mater. Process. Technol. 2010, 210, 1304–1313. [Google Scholar] [CrossRef]
- Jawale, K.; Duarte, J.F.; Reis, A.; Silva, M.B. Characterizing fracture forming limit and shear fracture forming limit for sheet metals. J. Mater. Process. Technol. 2018, 255, 886–897. [Google Scholar] [CrossRef]
- Scales, M.; Tardif, N.; Kyriakides, S. Ductile failure of aluminum alloy tubes under combined torsion and tension. Int. J. Solids Struct. 2016, 97–98, 116–128. [Google Scholar] [CrossRef]
- Scales, M.; Chen, K.; Kyriakides, S. Material response, localization, and failure of an aluminum alloy under combined shear and tension: Part i experiments. Int. J. Plast. 2019, 120, 340–360. [Google Scholar] [CrossRef]
- Ferreira, I.; Jesus, A.; Machado, M.; Pereira, J.; Alves, J.L.; Xavier, J. Experimental characterisation of fused filament fabrication printed parts under tension, shear, and combined shear–tension loads via Arcan test. Proc. Inst. Mech. Eng. Part L J. Mater. Des. Appl. 2020, 234, 835–850. [Google Scholar] [CrossRef]
- Kumar, A.; Singha, M.K.; Tiwari, V. Structural response of metal sheets under combined shear and tension. Structures 2020, 26, 915–933. [Google Scholar] [CrossRef]
- Mohr, D.; Henn, S. Calibration of stress–triaxiality dependent crack formation criteria: A new hybrid experimental–numerical method. Exp. Mech. 2007, 47, 805–820. [Google Scholar] [CrossRef]
- Dunand, M.; Mohr, D. Optimized butterfly specimen for the fracture testing of sheet materials under combined normal and shear loading. Eng. Fract. Mech. 2011, 78, 2919–2934. [Google Scholar] [CrossRef]
- Butcher, C.; Abedini, A. Shear confusion_ Identification of the appropriate equivalent strain in simple shear using the logarithmic strain measure. Int. J. Mech. Sci. 2017, 134, 273–283. [Google Scholar] [CrossRef]
- Peirs, J.; Verleysen, P.; Van Paepegem, W.; Degrieck, J. Determining the stress–strain behaviour at large strains from high strain rate tensile and shear experiments. Int. J. Impact Eng. 2011, 38, 406–415. [Google Scholar] [CrossRef]
- Noder, J.; Gutierrez, J.; Abedini, A.; Zhumagulov, A.; Dykeman, J.; Ezzat, H.; Butcher, C. A comparative evaluation of third–generation advanced high–strength steels for automotive forming and crash applications. Materials 2021, 14, 4970. [Google Scholar] [CrossRef]
- Samadian, P.; O’keeffe, C.; Butcher, C.; Worswick, M. Fracture Response in Hot–Stamped Tailor–Welded Blanks of Ductibor® 500-AS and Usibor® 1500-AS: Experiments and Modelling. Eng. Fract. Mech. 2021, 253, 107864. [Google Scholar] [CrossRef]
- Renault, C.; Churyumov, A.; Pozdniakov, A. Microstructure and hot deformation behavior of FeMnAlCMo steel. J. Mater. Res. Technol. 2020, 9, 4440–4449. [Google Scholar] [CrossRef]
- Shaikh, A.; Churyumov, A.; Pozdniakov, A.; Churyumova, T. Simulation of the hot deformation and fracture behavior of reduced activation ferritic/martensitic 13CrMoNbV Steel. Appl. Sci. 2020, 10, 530. [Google Scholar] [CrossRef]
- Abedini, A.; Noder, J.; Kohar, C.P.; Butcher, C. Accounting for Shear Anisotropy and Material Frame Rotation on the Constitutive Characterization of Automotive Alloys using Simple Shear Tests. Mech. Mater. 2020, 148, 103419. [Google Scholar] [CrossRef]
- Fast–Irvine, C.; Abedini, A.; Noder, J.; Butcher, C. An Experimental Methodology to Characterize the Plasticity of Sheet Metals from Uniaxial to Plane Strain Tension. Exp. Mech. 2021, 61, 1381–1404. [Google Scholar] [CrossRef]
- Khameneh, F.; Abedini, A.; Butcher, C. Lengthscale effects in optical strain measurement for fracture characterization in simple shear. Int. J. Fract. 2021, 232, 153–180. [Google Scholar] [CrossRef]
- Butcher, C.; Khameneh, F.; Abedini, A.; Connolly, D.; Kurukuri, S. On the experimental characterization of sheet metal formability and the consistent calibration of the MK model for biaxial stretching in plane stress. J. Mater. Process. Technol. 2021, 287, 116887. [Google Scholar] [CrossRef]
- Abedini, A.; Narayanan, A.; Butcher, C. An Investigation into the Characterization of the Hardening Response of Sheet Metals using Tensile and Shear Tests with Surface Strain Measurement. Forces Mech. 2022, 7, 100090. [Google Scholar] [CrossRef]
- Numisheet, The 12th International Conference and Workshop on Numerical Simulation of 3D Sheet Metal Forming Processes, Toronto, ON, Canada, 10–14 July 2022. Available online: https://www.tms.org/portal/Meetings___Events/2021/NUMISHEET2021/default.aspx (accessed on 10 July 2022).
- Barlat, F.; Aretz, H.; Yoon, J.W.; Karabin, M.E.; Brem, J.C.; Dick, R.E. Linear transformation–based anisotropic yield functions. Int. J. Plast. 2005, 21, 1009–1039. [Google Scholar] [CrossRef]
- Fast–Irvine, J.C. Experimental Methods for the Constitutive Characterization of Sheet Materials in Generalized Plane Strain. Master’s Thesis, University of Waterloo, Waterloo, ON, Canada, 2022. [Google Scholar]
- Heibel, S.; Dettinger, T.; Nester, W.; Clausmeyer, T.; Tekkaya, A.E. Damage mechanisms and mechanical properties of high–strength multiphase steels. Materials 2018, 11, 761. [Google Scholar] [CrossRef] [PubMed]
- Bai, Y.; Wierzbicki, T. A new model of metal plasticity and fracture with pressure and Lode dependence. Int. J. Plast. 2008, 24, 1071–1096. [Google Scholar] [CrossRef]
- Neukamm, F.; Feucht, M.; Haufe, A.; Roll, K. A Generalized incremental stress state dependent damage model for forming and crashworthiness simulations. In Proceedings of the Numisheet: 7th International Conference and Workshop on Numerical Simulation of 3D Sheet Metal Forming Processes, Interlaken, Switzerland, 1–5 September 2008. [Google Scholar]
- Johnson, G.R.; Cook, W.H. Fracture characteristics of three metals subjected to various strains, strain rates, temperatures and pressures. Eng. Fract. Mech. 1985, 21, 31–48. [Google Scholar] [CrossRef]
- Coulomb, C. Essai sur une application des regles des maximis et minimis a quelues problemes de statique relatifs a l’architecture. Mem. Acad. Roy. Des Sci. 1773, 7, 343–382. [Google Scholar]
- Mohr, O. Abhandlungen Aus Dem Gebiete Der Technischen Mechanik, 2nd ed.; Forgotten Books: Berlin, Germany, 1914. [Google Scholar]
- Korkolis, Y.; Kyriakides, S. Inflation and burst of aluminum tubes. Part II: An advanced yield function including deformation–induced anisotropy. Int. J. Plast. 2008, 24, 1625–1637. [Google Scholar] [CrossRef]
- Peirs, J.; Verleysen, P.; Degrieck, J. Novel Technique for Static and Dynamic Shear Testing of Ti6Al4V Sheet. Exp. Mech. 2012, 52, 729–741. [Google Scholar] [CrossRef]
- Puso, M.A. A highly efficient enhanced assumed strain physically stabilized hexahedral element. Int. J. Numer. Methods Eng. 2000, 49, 1029–1064. [Google Scholar] [CrossRef]
- Jones, E.M.C.; Iadicola, M.A. A Good Practices Guide for Digital Image Correlation Standardization, Good Practices, and Uncertainty Quantiication Committee. iDICs 2018, 10, 1–110. [Google Scholar]


Disclaimer/Publisher’s Note: The statements, opinions and data contained in all publications are solely those of the individual author(s) and contributor(s) and not of MDPI and/or the editor(s). MDPI and/or the editor(s) disclaim responsibility for any injury to people or property resulting from any ideas, methods, instructions or products referred to in the content. |
© 2023 by the authors. Licensee MDPI, Basel, Switzerland. This article is an open access article distributed under the terms and conditions of the Creative Commons Attribution (CC BY) license (https://creativecommons.org/licenses/by/4.0/).