Abstract
Erosion seriously threatens the safety of high-speed rotating mechanical components in very harsh service environments, particularly for lightweight titanium alloy matrix material. In order to improve the erosion resistance of titanium alloy, TiAlSiN coatings with different phase compositions are deposited on TC6 titanium alloy using a high-power pulse magnetron sputtering discharge (HPPMS) system under various discharge voltages. The componential and microstructural evolution as well as mechanical properties of the TiAlSiN coatings are evaluated by X-ray diffraction, scanning electron microscopy, and nanoindentation, respectively. The erosion performance relative to titanium alloy is investigated by a sand blasting tester. With the increase in discharge voltage from −500 to −600 V, the peak of discharge current increases from 105 to 225 A. The prepared TiAlSiN coatings show a shift of the preferred crystallographic orientation from (220) to (200), but all of them have a dense nanocomposite structure. Their hardness (H) and elastic modulus (E) gradually increase before decreasing, arriving at maximum values of 35.34 and 360.5 GPa at −570 V. The erosion resistance of the TiAlSiN coatings dependent on the discharge voltage is consistent with the H/E ratio change. The TiAlSiN coatings prepared at −560 V exhibit the optimal erosion resistance, which is 15 times that of the TC6 substrate. The erosion behavior of the coatings is positively correlated with their hardness and toughness. Adjusting the discharge voltage of the HPPMS pulse is finally proved to be an effective way of tailoring the coating phase compositions to improve the erosion resistance of titanium alloy.
1. Introduction
Erosion is caused by the impact of fluids with entrained solid particles, including dust, salty fog, volcano ashes, ice pellets, and slurries [1,2,3]. It is a major factor that causes the failure of high-speed rotating mechanical components, especially for structural materials made of lightweight titanium alloy [4,5,6]. Depositing a hard ceramic coating on the surface of components by physical vapor deposition has been demonstrated to be a necessary and protective approach [7,8]. However, with the extensive progress in the area of manufacturing, the working components present a significantly increased rotational speed and endure a very harsh service environment. The protective hard ceramic coatings were susceptible to damage and fracture and could not protect the substrate for a long duration [9,10,11]. There is an urgent need for a hard coating with more excellent mechanical properties.
As part of the surface engineering exploitations in past decades, super hardness coatings with nanocomposite, super-lattice, multilayered, or multi-component constituent structures have been designed and prepared [12,13,14,15,16]. Among them, nanocomposite TiAlSiN coating has attracted increasing attention because of its high hardness, strong fracture toughness, good thermal stability, and first-class abrasion resistance in severe environments [17,18,19,20]. It has been successfully used as a protective coating for machining tools of difficult-to-cut materials [21,22,23]. Based on these extraordinary performances, TiAlSiN coating is a promising candidate for an anti-erosion protective coating. Nevertheless, certain performance requirements of protective coatings for eroded high-speed rotating machinery are different from those for worn machining tools. In the erosion environment, especially when the hardness of a hard coating is higher than that of the particles, the demand for coating toughness grows as much as the demand for its hardness [24,25,26].
In order to further improve the hardness and toughness of nanocomposite TiAlSiN coating, it is crucial to understand its microstructures. According to our previous reports [21,26,27,28] and relevant studies [29,30,31], the TiAlSiN coating is characterized by isolated nanocrystallites of (Ti, Al) N, TiN, or AlN dispersed in an amorphous Si3N4 (a-Si3N4) matrix. Its mechanical properties were determined by the composition and distribution of constituent phases. As reported [32,33,34], when the grain size was refined, the increased density of the grain boundaries decreased the number of dislocation pile-ups and concomitantly increased coating strength, as well as blocked crack propagation in the amorphous Si3N4 phase. Moreover, the preferred growth orientation of the dense planes in the grains can further increase coating hardness and toughness, derived from the larger elastic constant between the nanocrystalline and amorphous phases [13]. Meanwhile, the fractions of the amorphous phase should also be well controlled [33,35], or the interfacial layer between grains will degrade the coherence between the nanocrystalline and amorphous phases, resulting in a decrease in hardness and toughness. It has been reported that at a composition of 15%~20 at% a-Si3N4, the nanocomposite coating showed the most stable configuration with super hardness and high crack resistance [36,37]. For many ceramic hard coatings, their microstructural and mechanical properties can be tailored by the ion energy flux of bombardment and the adatoms’ mobility on the substrate during deposition, which can be effectively regulated by some plasma processing parameters [38,39].
Consequently, in this paper, to achieve effective protection of the TC6 substrate against sand erosion, the phase compositions of TiAlSiN coatings synthesized on its surface are tailored by a home-made, high-power pulse magnetron sputtering (HPPMS) system under various discharge voltages. The effect of the discharge voltage of the HPPMS pulse on the componential and microstructural evolution as well as the mechanical properties and erosion performance of the prepared coatings are all studied. The erosion behavior is tested with angular Al2O3 solid particles at impingement angles of 30° and 90°. Furthermore, based on the eroded morphologies, we uncover the erosive failure mechanism and the dependence of the erosion rate on TiAlSiN coating properties in different test conditions.
2. Experimental Methods
2.1. Coating Preparation
TiAlSiN coatings were prepared on a titanium alloy TC6 substrate by a high-power pulse magnetron sputtering discharge system in a home-made hybrid deposition apparatus. This chamber was equipped with a magnetron sputtering system and a cathodic arc evaporation scheme, which has a high efficiency in pumping, heating, or deposition processes. Two targets, the sintered Ti0.46Al0.45Si0.09 mosaic target and Cr target, were used in our deposition. The sintered Ti0.46Al0.45Si0.09 mosaic target, as described in our previous reports [20,21,28], was vertically installed in front of magnets and controlled by a magnetron sputtering system. The effective work area of the target was an ellipse of ~95 cm2 (12 cm in the major axis × 10 cm in the minor axis). The magnetic field was designed with a Type II unbalanced structure, where the maximum strength parallel to the target surface was ~50 mT. The sintered Cr target was positioned opposite the Ti0.46Al0.45Si0.09 mosaic target and equipped with a cathodic arc evaporation scheme, as shown in the schematic diagram in Figure 1. The distances of the substrate-to-Ti0.46Al0.45Si0.09 target and substrate-to-Cr target were ~8 and ~10 cm, respectively. Before coating deposition in the vacuum chamber, the TC6 substrates were mechanically polished to be a mirror with a roughness Ra of less than 0.02 μm. After that, the TC6 substrates were cleaned with acetone and alcohol in an ultrasonic bath for 10 min successively. They were then dried by compressed air. Glow discharge etching was first carried out at 1.5 Pa Ar pressure, and a direct current bias with 1 kV voltage and duration of 30 min removed contaminants and oxidations from the substrate surface. To enhance the adhesion between the TiAlSiN coatings and TC6 substrates, Cr + CrNx buffer layers were deposited on the substrates by the cathodic arc evaporation scheme with the sintered Cr target. For the translation layers deposition, the substrate bias voltage, arc current of target, and working pressure were maintained at −100 V, 80 A, 0.8 Pa. The thickness of the Cr + CrNx buffer layers was approximately 500 nm. After this process, the substrate was rotated around the center central rotary table to the right, ahead of the Ti0.46Al0.45Si0.09 target to start the deposition process of the TiAlSiN coatings. The TiAlSiN coatings were prepared at a gas pressure of 0.8 Pa, pulse frequency of 150 Hz, pulse width of 125 μs, and substrate bias voltage of −150 V. A direct current (dc) power with a constant value of 0.1 kW was applied on the cathode target during the pulse-off time (a home-made supply) shown in the schematic diagram in Figure 1 to reduce the gas breakdown delay during the glow discharge. During the TiAlSiN coatings deposition, the total pressure of the mixed gas equaled the summation of the partial pressure of the argon (Ar, 99.999% in purity) and nitrogen (N2, 99.999% in purity) gases, where Ar and N2 served as working and reactive gas, respectively. The discharge voltage magnitude of the high-power impulse used in the synthesis of the TiAlSiN coatings varied from −500 to −600 V (−500 V, −560 V, −570 V, and −600 V). These prepared samples were designated as TiAlSiN-500, TiAlSiN-560, TiAlSiN-570, and TiAlSiN-600. The thicknesses of the TiAlSiN coatings were almost the same at around 2 μm. The deposition rate of the TiAlSiN coating was dependent on the variation of the discharge voltage of the HPPMS. To obtain a consistent thickness of ~2 μm for all the coatings, the total deposition time was adjusted according the discharge voltage, as shown in Table 1. During the deposition period of the buffer layer or TiAlSiN coating, the sample holders were stationary facing the corresponding target. The detailed process parameters of the buffer layer and TiAlSiN coatings on the TC6 substrate are listed in Table 2.
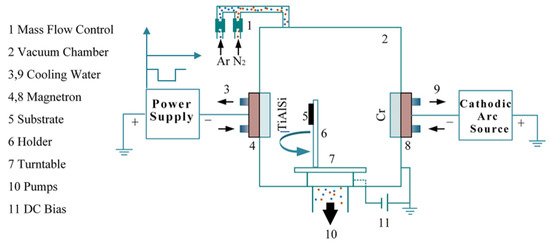
Figure 1.
Schematic diagram of the experimental deposition system.

Table 1.
The deposition rates of the TiAlSiN coatings.
Table 2.
Process parameters of the buffer layer and TiAlSiN coating.
2.2. Composition, Microstructures and Mechanical Properties Characterization
The discharge voltage and current were monitored by a 100-times attenuation probe (Agilent 10076B) and a Hall sensor (CWT Rogowski Current Transducer) during glow discharge. Their waveforms were recorded by a digital oscilloscope (DSO-X 2024A, Palo Alto, Agilent Technologies, Palo Alto, CA, US) at 128-pulse average acquisition mode. The chemical composition of the coatings was analyzed by an X-ray photoelectron spectroscope with monochromate Al-Kα irradiation at a pass energy of 29.35 eV (Thermo Scientific Nexsa G2 X, Thermo Fisher Scientific, Waltham, MA, USA). Before collecting the element composition, the samples were pre-etched by Ar ions for 120 s in order to remove the contaminations on the coating surface. The cross-sectional microstructures and thickness of the TiAlSiN coatings were analyzed using a scanning electron microscope (SEM-ZEISS-Gemini SEM 500, Oberkochen, Germany). The crystallographic structures of the coatings were identified by X-ray diffraction (XRD: D/Max 2500) with Cu Kα radiation at 40 kV and 40 mA. A regular θ − 2θ measurement was conducted at scanning speed with 2°/min in the scanning range from 30° to 70°. The hardness and Young’s modulus of the coatings were measured by a nanoindentation tester (Nano-Indenter G200, Agilent) with a load precision of 50 nN in a continuous stiffness mode (CSM). The indentation depth did not exceed 1/10 of the coating thickness to avoid the substrate effect. Five random points were selected and tested on each sample to obtain an average hardness and Young’s modulus value. The coating toughness was evaluated by the H/E ratio, where H is the hardness measured and E represents the Young’s modulus.
2.3. Sand Particle Erosion Experiment
The erosion performance of TiAlSiN coatings was evaluated by angular Al2O3 solid particles. The sand particle erosion tests were performed at room temperature in a home-made sand blasting tester, which was set up according to the ASTM standard G76-13 [40]. As shown in Figure 2, the sand particles had a sharp angular geometry with a mean size of around 50 μm. The nozzle of the gas blast tester was designed with an inner diameter of 1.5 mm and a length of 50 mm. The distance from the sample’s surface to the nozzle end was set at 10 ± 1 mm. During the erosion tests, the feed rate and impingement velocity of sand particles were kept at 2 ± 0.1 g/min, 30 ± 1.5 m/s, which was calibrated every 10 min. The sample, artificially machined with a dimension of 30 mm × 10 mm × 5 mm, was fixed on a clamp holder. The surface of clamp holder can be machined to a plane at any angle toward the nozzle end of the gas blast tester. To confirm the brittle or ductile erosion failure mechanisms of the TiAlSiN coatings, impingement angles of 30° and 90° sand erosion were set. The erosion tests were terminated before the TC6 substrate surface was exposed.
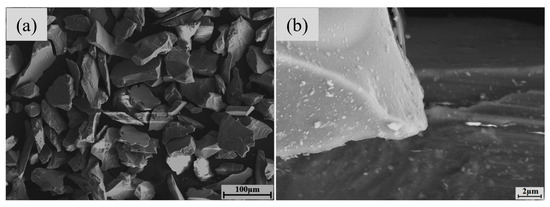
Figure 2.
The micro-morphology of angular Al2O3 solid particles (a) and the sharp angular geometry of one single particle (b).
Before and after the erosion tests, the samples were rinsed in an ultrasonic cleaner with alcohol for 10 min. Then the mass of samples was weighed with a balance with an accuracy of 10−5 g. The erosion rate was equal to the mass loss of the coating divided by the sand feed weight. To guarantee the reliability of the erosion rate, at least three repeated erosion tests were conducted for each sample. The average erosion rate was regarded as the final result. Furthermore, the morphology of the erosion surface was analyzed by SEM to deduce the damage mechanism of the TiAlSiN coatings under different erosion conditions.
3. Results
3.1. Discharge Characteristic
The discharge characterization of the HPPMS process for the Ti0.46Al0.45Si0.09 target in nitrogen atmosphere was recorded by a digital oscilloscope. The discharge current dependent on target voltages is shown in Figure 3. Overall, the peak target current increased from 105 to 225 A with the increase in discharge voltage from −500 to −600 V, which was reasonable. The target current during magnetron sputtering is composed of the collected ion current Iion, plasma electron current Ie, and secondary emission electron current Isec [41]. With the increase in discharge voltage, more secondary emission electrons were ejected from the target and obtained energy as they crossed the enhanced electric field of the plasma sheath. At same time, these abundant high-energy electrons could increase the probability of ionization collisions between the electrons and neutral particles, resulting in the increase in plasma density as well as discharge current.
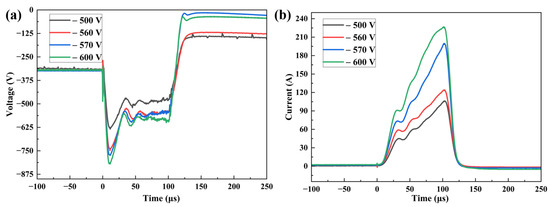
Figure 3.
The voltage (a) and current (b) waveform of the Ti0.46Al0.45Si0.09 target dependent on discharge voltages.
Nevertheless, the increment in the peak target current was significantly different during the stepwise voltage increase. With increasing the discharge voltage from −500 to −560 V, the peak of the discharge current increased from about 105 to 122 A, with an increment of 17 A. Then the discharge voltage was also increased in 10 V increments, up to 570 V, and the peak target current was increased by an increment of almost 78 A, rapidly arriving at around 200 A. By further increasing the discharge voltage to 600 V, the increment of the peak target current became smaller with a value of ~25 A, reaching approximately 225 A. This phenomenon may be connected with the target’s partial poisoning (nitrides redeposition) on the Ti0.46Al0.45Si0.09 target surface, which usually occurred during reactive magnetron sputtering [42]. These TiAlSiN nitrides have a higher secondary electron emission yield (SEEY) than their metal target [43], contributing to the increase in discharge current. With the further increase in voltage, the SEEY of the clean and partially poisoned target both became higher; thereby, the current increment for voltage from −560 to −570 V was larger than that for voltage from −500 to −560 V. However, it seemed that the redeposition rate of these nitrides of around −570 V was slower than that at −560 V, and concomitantly the growth rate of SEEY decreased. Accordingly, the increment in the peak target current became smaller for the discharge voltage, from −570 to −600 V.
Another characterization should be noted during the pulse-off time that as the dc power supply was controlled by the constant power mode and set at 0.1 kW, the initial voltage output of the dc power supply was ~−310 V, as shown in Figure 3a, which was too low to ignite the plasma. Thus, the discharge current is hardly observed in Figure 3b during the pulse-off time. But after turning off the pulse, the voltage output became lower than that before turning on the pulse and decreased with the discharge voltage increase. This phenomenon was expected from the limited charging efficiency of the storage capacitor, which supplies power for the dc supply. Especially at the discharge voltage range of −570~−600 V, the discharge current of the pulse was up to more than 200 A, and the inefficient charging led to the voltage output decreasing to almost zero. Then after a ~125 μs lag, charging of the storage capacitor was finished; thus, the voltage output of the dc power supply was increased to ~−310 V again.
3.2. Composition and Microstructure
The average atomic ratios and standard deviations of Ti, Al, Si, and N of the TiAlSiN coatings versus different discharge voltages were normalized to 100% and are presented in Table 3, indicated by the fraction of CTi = Ti/(Al + Ti + Si), CAl = Al/(Al + Ti + Si), and CN = N/(Al + Ti + Si) [20]. The compositions of the prepared TiAlSiN coatings were all close to stoichiometric (Ti, Al, Si)Ny (y ≈ 1). With the increase in the target voltage, the Ti content increased from 0.451 ± 0.003 to 0.521 ± 0.001, while Al and Si contents decreased from 0.474 ± 0.005 to 0.423 ± 0.003 and 0.075 ± 0.002 to 0.065 ± 0.002, respectively. These changes in the element atomic ratios may be the result of the increased re-sputtering effect, where the deposited coating on the substrate was sputtered out because of the enhanced ion bombardment by raising the discharge voltage.
Table 3.
The atomic ratio of the TiAlSiN coatings versus different discharge voltages.
Thanks to the heavier mass of Ti atoms compared to Al and Si atoms, the re-sputtering yield of Ti content was relatively lower and its atomic ratio was higher than the other two contents. In addition, Figure 4 displays the high-resolution core level spectra for Ti, Al, Si, and N of the TiAlSiN-500 coating. In Figure 4a, the deconvolution of the Ti 2p peak indicated that it was composed of four peaks centered at 455.1, 456.9, 460.9, and 461.8 eV. The peaks centered at 456.9 and 461.8 eV originated from the Ti 2p3/2 and Ti 2p1/2 electrons in titanium oxynitride [44,45]. The two peaks at 455.1 and 460.9 eV corresponded to TiN [19]. Figure 4b shows the Al 2p spectra at 74.2 eV assigned to the Al-N bond and a weak Al 2p signal at 74.8 eV corresponding to the Al-O bond [46]. The Si 2p spectrum consisted of two peaks centered at 101.6 and 102.5 eV, as shown in Figure 4c, corresponding to the Si3N4 phase [47] and SiO2 phase [19]. The O content may be from the trace residual oxygen in our deposition chamber. The N 1s spectrum of the TiAlSiN coating revealed the three characteristic peaks at the banding energies of 396.7, 397.1, and 398.2 eV, which were identified as AlN, TiN, and Si3N4 phases in several studies [19,48].
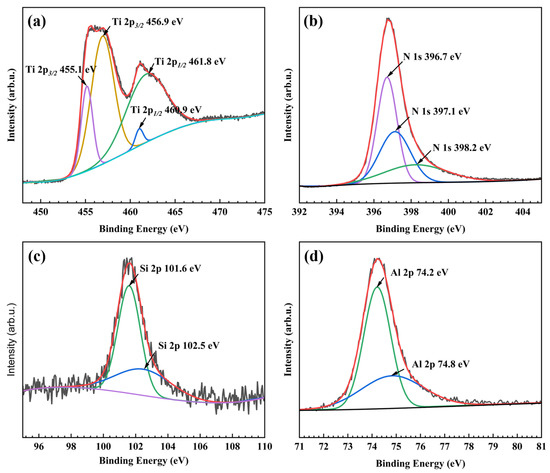
Figure 4.
The XPS spectra of the TiAlSiN-500 coating: (a) Ti 2p, (b) Al 2p, (c) Si 2p, (d) N 1s. (The grey line—raw data, red line—cumulative fit curve).
The phase constituents of the TiAlSiN coatings fabricated at various discharge voltages were determined by an X-ray diffractometer and are displayed in Figure 5. It is obvious that the TiAlSiN coatings exhibited the diffraction peaks of the standard face-centered cubic TiN (c-TiN, #JCPDF38-1420) and cubic AlN (c-AlN, #JCPDF25-1495). Meanwhile, the peaks of the buffer layer CrN (c-CrN, #JCPDF11-0065), Cr (c-Cr, #JCPDF06-0694), and the titanium alloy TC6 substrate (α-Ti, #JCPDF44-1294, β-Ti, #JCPDF44-1288) were also noticed and tagged. All coatings exhibited a NaCl-type crystal structure but with a diffuse scattering peak, which indicated coatings with a nanocrystalline structure. The silicon-related phases could not be matched in the diffraction peaks. Based on the above analysis by XPS, it suggested that Si atoms formed an amorphous Si3N4 phase. The XRD and XPS results implied that the prepared TiAlSiN coatings may be nanocomposite structures composed of nc-TiN and a-Si3N4.
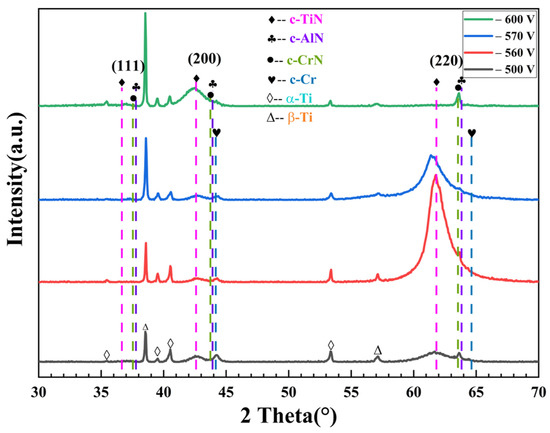
Figure 5.
The X-ray diffractograms of the TiAlSiN coatings with various discharge voltages.
With the discharge voltage increase during the deposition process, the prepared coatings presented different crystal structures and preferred orientations. At the discharge voltage of −500 V, the X-ray diffractogram of the deposited coating showed obvious streamed buns peaks, which meant the existence of a large number of amorphous structures. As the discharge voltage increased to −560 V, the coating not only showed the increase in the crystallization properties of the nanocrystals, but exhibited the preferred orientation (220) of FCC structures, which was also reported by Park et al. [49], Molarius et al. [50], and Pelleg et al. [51]. Usually, the preferred orientation in the FCC nitride coating is the outcome of the lowest overall energy, which results from the critical competition between the surface energy and strain energies [51]. The (110) or (111) plane was noted as having the lowest strain energy. As aforementioned, at higher discharge voltage, the ionization degree and energy flux of the reactive particles became higher, which enhanced the ion bombardment on the growth coating, especially under a bias voltage, and thus increased the strain energies. As a result, the (220) preferred orientation was expected under a higher discharge voltage. When the discharge voltage further increased to −570 V, the intensity of the (220) texture decreased with a broadened FWHM (full width at half maximum) and exhibited a certain degree of left-shifting. Namely, the grain size was refined and the compressive stress was introduced via the further enhanced ion flux and energy. Furthermore, increasing the discharge voltage to 600 V resulted in the (220) texture vanishing completely and a transition of the preferred growth orientation into the (200) plane, which was in agreement with previous studies [52]. Owing to the relative number of atom columns per unit area for (002):(220) with 1:, the [002] provided more open channeling directions for impingement ions to distribute their energy, which means that the (200) plane endured less damage from the strongest ion bombardment. Correspondingly, the (200) plane had a higher survival probability at the discharge voltage of −600 V, conducive to its preferred orientation. A leftward shift was also noticed on the X-ray diffractograms, which may have resulted from increased residual stress in the deposited coating under the strong ion bombardment [51,53,54]. At the same time, c-CrN displayed the (220) preferred orientation owing to the preferential sputtering and collisional dissociation ions at this intense ion bombardment [39]. The crystal structures and preferred orientation of the prepared coatings were effectively tailored by the discharge voltage of the HPPMS pulse.
Another point should be noticed that with the increase in ion flux and energy (discharge voltage), the X-ray diffraction patterns for the TC6 substrate also changed. The intensity of (110) in β-Ti was gradually enhanced, whereas the intensity of (101) in α-Ti decreased and the width became broader, which may be related to the plasticity and conductivity of constituent phases. The good plasticity ensured the β-Ti phase absorbing enough bombardment energy by deformation, yet its lower conductivity caused the dynamic recovery of the β-Ti phase. Thus, the β-Ti phase showed a progressively increased intensity for the (110). For the α-Ti phase with lower strength and poor ductility [53], the enhanced ion bombardment increased its dislocation density and refined its grain, leaving the X-ray diffraction patterns with broadened and smooth peaks.
To investigate the cross-sectional microstructure and thickness of the TiAlSiN coatings, SEM images were collected in an SE mode and are shown in Figure 6. The coating structure is distinguished by the light and dark layers. The light layer is the mixture of the Cr + CrNx buffer layer, with a thickness of ~500 nm. The dark layer is the TiAlSiN coating, with a thickness of ~2 μm. The overall thickness of whole coating on the TC6 substrate was measured to be ~2.5 μm. All prepared TiAlSiN coatings exhibited a dense and smooth structure, almost free from columnar structure, which fit well with the nanocomposite (nc-TiN/a-SiNx) structures in previous studies [26,55,56]. With the increase in discharge voltage, enhanced ion bombardment not only inhibited the growth of columnar formation but also refined the grains inside the TiAlSiN coating. Hence, the microstructure became denser and denser. The deposition rate was unfortunately reduced from 33 to 25 nm/min when the discharge voltage was increased from −500 to −600 V, as shown in Table 2.
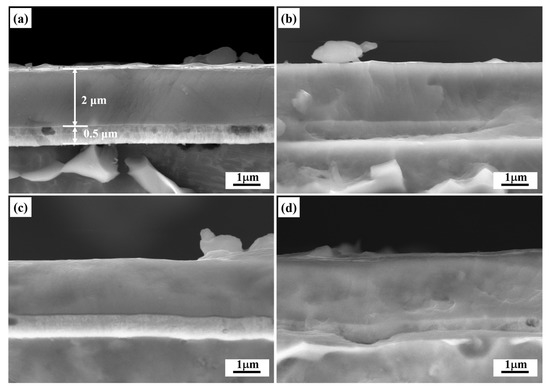
Figure 6.
Cross-sectional morphology of the TiAlSiN coating with various discharge voltages: (a) −500 V, (b) −560 V, (c) −570 V, (d) −600 V.
3.3. Mechanical Properties
The hardness, Young’s modulus, and H/E ratio of the TiAlSiN coatings dependent on various discharge voltages were evaluated by a nanoindentation tester and are illustrated in Figure 7. It is obvious that the hardness and Young’s modulus of the prepared coatings continuously increased to the maximum values of 35.34 ± 0.63 and 360.6 ± 2.5 GPa, respectively, as the discharge voltage increased to −570 V, whereas further increasing the discharge voltage to −600 V caused their values to decrease respectively. Although the mechanical properties of the prepared coatings were influenced by many factors including phase composition, microstructure, residual compressive stress, etc., they were determined by some dominant factors under certain conditions. In our cases, for the TiAlSiN-500 coating, the high fraction of amorphous structures caused the lowest hardness (28.16 ± 0.64 GPa) and Young’s modulus (300.5 ± 4.6 GPa), which seemed to be consistent with the reports in the Introduction where a high content of amorphous phases can degrade the coating coherence. With increasing the discharge voltage to 560 V, the better crystallinity and (220) plane preferred orientation of the FCC structures confirmed the hardness and Young’s modulus increasing to 34.85 ± 0.58 and 330.7 ± 2.7 GPa, respectively [20,49,50]. For the TiAlSiN-570 coating, the more refined grains and introduced residual compress certified the hardness and Young’s modulus arriving at their maximum values. In addition, the increment of Young’s modulus between TiAlSiN-560 and TiAlSiN-570 was larger than that between TiAlSiN-500 and TiAlSiN-560. For the TiAlSiN-600 coating, the (200) preferred orientation and increased residual stress resulted in the hardness and Young’s modulus reversely decreasing to 32.53 ± 0.63 and 355.9 ± 4.8 GPa, arising out of the higher Schmid factor (200) plane compared with the (220) plane [51,55].
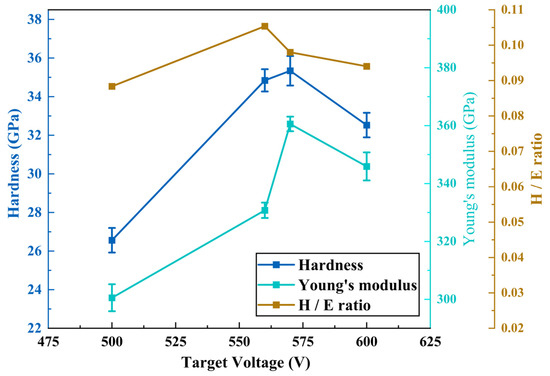
Figure 7.
Hardness, Young’s modulus, and H/E ratio of the TiAlSiN coatings dependent on discharge voltage.
The coating toughness was evaluated by the H/E ratio in previous studies [54,57], where the higher the H/E ratio, the stronger the suppression of crack initiation and propagation of coating. To evaluate the crack resistance of the TiAlSiN coating at various discharge voltages, the H/E ratio is also displayed in Figure 6. It indicated that with the increase in discharge voltage, the trend of the H/E ratio was the same as that of the hardness and Young’s modulus, initially increasing before decreasing. The TiAlSiN coating with largest H/E ratio of 0.105 was prepared at the discharge voltage of −560 V, which means this formed network structures between nc-TiN and a-Si3N4 that could effectively absorb the impacting energy of erosion sand and the possibility of less destruction. This result suggested that, under the correct set of discharge voltages in the HPPMS pulse, the prepared coating may present excellent toughness.
3.4. Erosion Resistance
To evaluate the erosion resistance of the TiAlSiN coatings with various discharge voltages relative to the TC6 substrate, average mass loss rates were calculated and are shown in Figure 8. Generally, the maximum erosion rate appears at low angles of incidence (15°~45°) for ductile materials [58] and at a normal angle of incidence (90°) for most brittle material [59]. Hence, impingement angles of 30° and 90° for solid particle relative to sample surface were chosen for the erosion test. The TC6 titanium alloy substrate suffered more mass loss at the impingement angle of 30° sand erosion, which corresponded to its ductile nature. The TiAlSiN coatings experienced more mass loss at the impingement angle of 90° sand erosion, confirming their brittle nature. All TiAlSiN coatings presented protection benefits for the TC6 titanium alloy. The erosion rates of the TC6 substrate were 0.682 ± 0.003 and 0.235 ± 0.002 mg/g at the impingement angles of 30° and 90°, respectively, which were about 9 and 2 times more than that of the TiAlSiN-500 coating. When increasing the discharge voltage to −560 V, the prepared TiAlSiN-560 coating displayed erosion rates with values of 0.015 ± 0.002 and 0.025 ± 0.002 mg/g at the impingement angles of 30° and 90° sand erosion, respectively, which were only 1/45 and 1/9 of the TC6 substrate. As the discharge voltage further increased to −570 and −600 V, the erosion rates rose gradually, reaching 0.023 ± 0.002 and 0.041 ± 0.002 mg/g, respectively, for the TiAlSiN-600 coating at 30° and 90° sand erosion, respectively, corresponding to 1/30 and 1/5 of the TC6 substrate. The TiAlSiN-560 coating displayed the minimum erosion rate, which meant that it possessed the best erosion resistance and can be the optimal protection for the TC6 substrate among the prepared samples. The trend of coating erosion resistance was consistent with that of the H/E ratio under various discharge voltages. It revealed that the highest H/E ratio of the hard coating can ensure its excellent erosion resistance, which was compatible with previous reports [26,60].
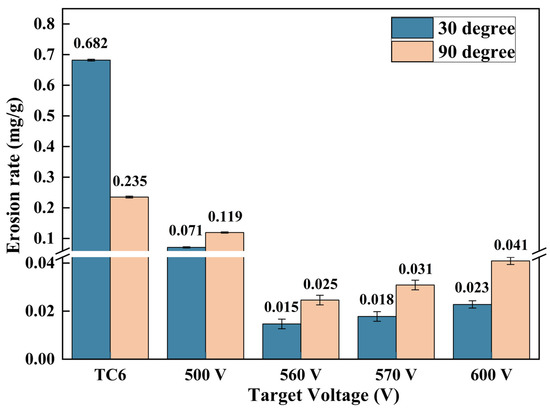
Figure 8.
Erosion rates of the TC6 substrate and TiAlSiN coatings with discharge voltage.
3.5. Erosion Behavior
The erosion damage evolution and characteristics were deduced based on the morphology investigation of the TiAlSiN coatings before and after erosion damage by SEM. Figure 9 shows the damage evolution of the TiAlSiN-500 coating at 90° sand erosion. The as-deposited TiAlSiN coating presented some nodule and hole-like defects on its surface, as shown in Figure 9a, which might have come from some arcing, the change of target surface morphology, and the re-deposited insulated TiAlSiN coating on the target surface [61,62]. These defects could facilitate crack initiation during particle erosion, leading to the premature damage of the coating [63,64]. Then the amount and size of the micro pits increased on the coating surface after the early stages of erosion, as shown in Figure 9b, decreasing the coherence of coating. In the following sand erosion, these micro pits were broadened and presented a severely damaged area in the center, as displayed in Figure 9c. From the morphology of enlarged area in its center, as indicated in Figure 9d, numerous micro cracks and chips can be observed, and somewhat ringed cracks are present around the edge of eroded pit. These cracks were caused by the tensile stress formed during particle impingement [65]. As erosion proceeded, these cracks may have propagated and coalesced, resulting in coating failure and substrate exposure.
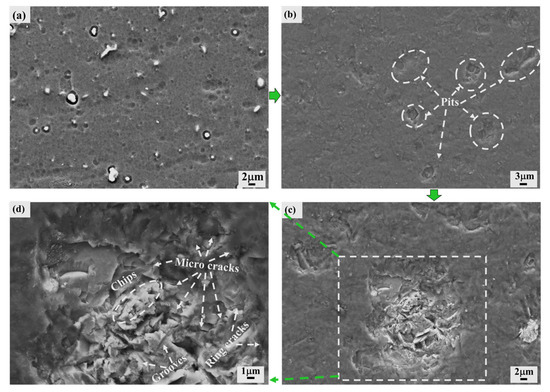
Figure 9.
The damage evolution of the TiAlSiN-500 coating at 90° sand erosion, surface morphology of the (a) as-deposited coating, (b) eroded coating after ~30 s erosion, (c) erosion pit before substrate exposure, and (d) enlarged area in (c).
To evaluate the failure mechanism and damage degree of the TiAlSiN coatings dependent on discharge voltage at 90° sand erosion, high-magnification morphologies of the center part in the erosion pit were collected and are shown in Figure 10. For the TC6 substrate, we can clearly note deep indentations and lots of chips on their sides, as displayed in Figure 9a. Because of the high ductility of the TC6 substrate, the material was easily indented and the indentations were deep with the emergence of extruded lips. Most of these lips were forged into chips by the repeated impacting of solid particles, resulting in the substrate material removal. This indicated that the dominant material removal of the mechanism at 90° sand erosion was the material plastic deformation and work hardening during the repeated impacts of the solid particles [66]. In comparation, the eroded coatings presented shallower indentations, finer fragmentary chips, and more micro cracks, which were the brittle fracture characteristics of the ceramic hard coating [67].
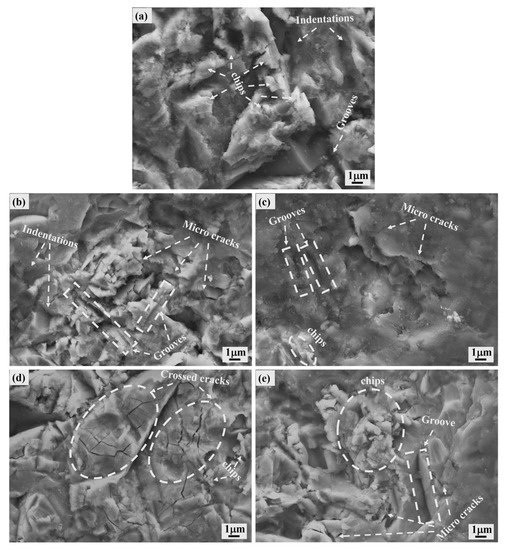
Figure 10.
The surface morphology of the center part in the erosion pit for the (a) TC6 substrate, (b) TiAlSiN-500, (c) TiAlSiN-560, (d) TiAlSiN-570, (e) TiAlSiN-600 at 90° sand erosion.
However, the extent of the damage to coatings significantly depended on the prepared samples. The TiAlSiN-560 coating showed the least erosion damage, with much smaller numbers of chips and micro cracks and a relatively smooth surface shown in Figure 10c, whereas the TiAlSiN-500 coating displayed the serious destruction shown in Figure 10b. The main reason traces back to the difference in their crystallinity. The TiAlSiN-560 coating with good crystallization and (220) preferred orientation presented higher hardness and excellent toughness, which were beneficial for its lowest erosion rate among the coatings, as shown in Figure 7. Moreover, based on the smooth surface of its eroded pit, the erosion damage of the TiAlSiN-560 coating may be mainly in the form of layer by layer, for its high hardness ensured the excellent resistance of the coating to erosion damage, and its excellent toughness could assure the coating had a strong ability to absorb impact energy and inhibit initiation of cracks in the sublayer. When the discharge voltage increased to −570 V, the prepared sample displayed serious destruction again after the sand erosion, with a large number of chips and micro cracks, particularly the emerged crossed cracks with reticular distribution, yet with a smooth surface (Figure 10d). Although this TiAlSiN-570 coating with (220) preferred orientation, refined grain, and compressive stress had the highest hardness and dense structure, its erosion resistance was lower than that of the TiAlSiN-560 coating. This can be attributed to its decreased toughness (H/E ratio) shown in Figure 6. It seems that the toughness instead of the hardness contributed more in determining the erosion resistance of the brittle coatings under 90° sand erosion. While further increasing the discharge voltage to −600 V, the prepared coating not only exhibited an increase in the number of chips but also became rougher, as shown in Figure 10e, after erosion damage, indicating enhancement in the severity of brittle fracture. It revealed that despite densifying the coating structure by the enhanced ion bombardment, the increased residual stress and (200) preferred orientation led to this TiAlSiN-600 coating having lower mechanical properties and erosion resistance. Another point that should be noticed is that all of these samples displayed somewhat ductile erosion failure characteristics such as grooves [68]. Owing to the irregular shape of the Al2O3 solid particle, the sharp corners of some particles may be at an acute angle to the coating surface and the microcutting mechanism of material removal occurred, resulting in the appearance of grooves. In addition, the expansion of particle carrier gas at the outlet of the nozzle led to some Al2O3 solid particles deviating from the trajectory of perpendicular impingement, also increasing the probability of the presence of grooves.
At 30° sand erosion, the erosion behavior variations of the TiAlSiN coatings with various discharge voltages were also analyzed with respect to that of the TC6 substrate, as shown in Figure 10. The energy of the inclined impacting particles can be decomposed into two mutually orthogonal forces, which are a force parallel to the surface and another normal to the surface. The parallel component can result in material microcutting damage, whereas the vertical component can lead to chipping damage. At 30° sand erosion, owing to the larger parallel component of the particle impact force, microcutting was often regarded as the major mechanism for material removal based on the material being isotropic. For the ductile isotropic TC6 substrate as an example, we can notice that the microcutting caused the eroded surface to present large numbers of deep grooves with raised lips (Figure 11a), which fit well with the typical failure features reported by Finnie [68]. After the TiAlSiN ceramic hard coating deposited on the TC6 substrate, because of its high hardness with some chipping resistance, the four samples presented shallower plowing grooves compared with the TC6 substrate. The grooves displayed different characteristics arising from the microstructure and mechanical property changes in the prepared coatings. Among these four coating samples, the TiAlSiN-500 coating presented the deepest grooves with largest number of chips rather than the lips (Figure 10b), revealing that it underwent not only serious microcutting, but also chipping disruption, which was consistent with its lowest hardness and toughness, indicated in Figure 7, and weakest erosion resistance in Figure 8. Whereas the TiAlSiN-560 coating exhibited the shallowest grooves without chips and sporadic cracks (Figure 11c), verifying its strongest erosion resistance. The shallowest grooves may be attributed to the (220) preferred orientation, for it has a lower Schmid factor [51,55], which can make it hard for the coating to slide under the microcutting damage. The lack of chips and sporadic cracks may benefit from the highest toughness, for it can ensure the compatible deformation of the coating under microcutting and chipping damage. For the TiAlSiN-570 coating, although the grooves rendered a similar depth as that on the TiAlSiN-560 coating, the appearance of more micro cracks and some chips around the grooves indicated the more brittle nature of the coating (lower H/E ratio in Figure 7), leading to the degradation of erosion resistance (Figure 8). With the discharge voltage further increased to −600 V, surrounding the shallow grooves were quantities of ring cracks in addition to micro cracks and chips, demonstrating that the coating underwent more serious microcutting and chipping brittle erosion behavior and had a lower erosion rate. This may have resulted from the (200) orientation with a higher Schmid factor [51,55], which led the coating to slide easily under the microcutting damage. The poor toughness caused serious chipping damage.
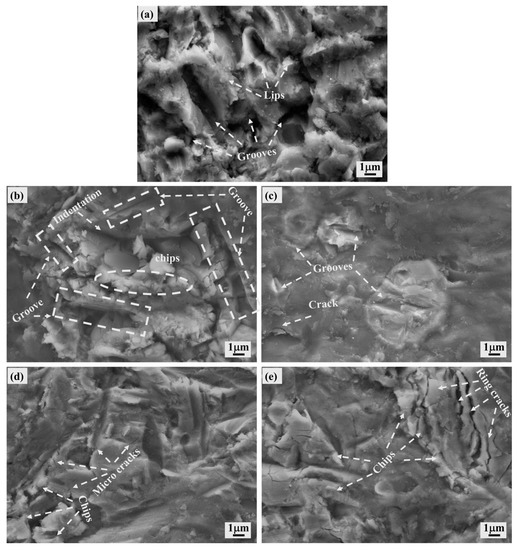
Figure 11.
The surface morphology of the center part in the erosion pit for the (a) TC6 substrate, (b) TiAlSiN-500, (c) TiAlSiN-560, (d) TiAlSiN-570, (e) TiAlSiN-600 at 30° sand erosion.
4. Conclusions
In this study, TiAlSiN coatings were prepared on the TC6 substrates by a home-made HPPMS discharge system at various target voltages. The componential and microstructural evolution, mechanical properties, and erosion performance were measured and evaluated. The main conclusions are as follows:
- (1)
- Adjusting the discharge voltage of the HPPMS pulse during deposition can effectively tailor the phase compositions of the TiAlSiN coating and improve its erosion performance. At a discharge voltage of −560 V, the prepared TiAlSiN coating with the (220) preferred orientation exhibits the lowest erosion rate, whose average value is 1/15 of the TC6 substrate.
- (2)
- With increasing the target voltage from −500 to −560V, the prepared coating displays a preferred orientation at the (220) plane, but further increasing the discharge voltage to 600 V, the preferred orientation turns to the (200) plane. The prepared TiAlSiN coating is characterized as a mixture of face-centered cubic structures and an amorphous phase, which ensure the coating has dense microstructures, regardless of discharge voltage.
- (3)
- The hardness, elastic modulus, and toughness (H/E ratio) of the prepared TiAlSiN coatings have the same trend dependent on the magnitude of the discharge voltage, initially increasing before decreasing and reaching a maximum of 35.34 and 360.5 GPa at the discharge voltage of −570 V and of 0.105 at the discharge voltage of −560 V, respectively.
- (4)
- The initial point of failure for the TiAlSiN coating seems to be generated from surface defects. Moreover, microcracks and fragmentation of the ceramic hard coating are the major mechanisms for the material removal at 90° sand erosion, whereas microcutting and chipping are the dominant mechanisms observed in all coatings at 30° sand erosion. Compared to high hardness, higher toughness may be more positively related to the strong erosion resistance of the TiAlSiN hard coating.
Author Contributions
Conceptualization, H.L. and L.L.; methodology, H.L. and L.L.; validation, H.L. and L.L.; formal analysis, D.L., L.T. and Y.L.; investigation, H.L.; resources, H.L., L.L., P.F. and X.X.; data curation, D.L., L.T., Y.L., G.L. (Guang Li), Y.W., G.L. (Guodong Li), Y.X., J.G., M.H., K.H., P.F. and X.X.; writing—original draft preparation, H.L.; writing—review and editing, H.L. and L.L.; supervision, L.L. and M.H.; project administration, L.L.; funding acquisition, L.L. All authors have read and agreed to the published version of the manuscript.
Funding
This research was funded by National Natural Science of China (NSFC 12275014) and National Science and Technology Major Project (2017-VII-0012-0108, 2017-VII-0003-0096).
Data Availability Statement
Not applicable.
Conflicts of Interest
The authors declare no conflict of interest. The funders had no role in the design of the study; in the collection, analyses, or interpretation of data; in the writing of the manuscript; or in the decision to publish the results.
References
- Tarodiya, R.; Levy, A. Surface erosion due to particle-surface interactions—A review. Powder Technol. 2021, 387, 527–559. [Google Scholar] [CrossRef]
- Mochizuki, H.; Yokota, M.; Hattori, S. Effects of materials and solution temperatures on cavitation erosion of pure titanium and titanium alloy in seawater. Wear 2007, 262, 522–528. [Google Scholar] [CrossRef]
- Fals, H.C.; Lourençato, L.A.; Orozco, M.S.; Belém, M.J.X.; Lima, C.R.C. Slurry erosion resistance of thermally sprayed Nb2O5 and Nb2O5+WC12Co composite coatings deposited on AISI 1020 carbon steel. Ceram. Int. 2020, 46, 27670–27678. [Google Scholar] [CrossRef]
- Zhang, H.; Li, Z.; He, W.; Liao, B.; He, G.; Cao, X.; Li, Y. Damage evolution and mechanism of TiN/Ti multilayer coatings in sand erosion condition. Surf. Coatings Technol. 2018, 353, 210–220. [Google Scholar] [CrossRef]
- Bousser, E.; Martinu, L.; Klemberg-Sapieha, J.E. Effect of erodent properties on the solid particle erosion mechanisms of brittle materials. J. Mater. Sci. 2013, 48, 5543–5558. [Google Scholar] [CrossRef]
- Bonu, V.; Jeevitha, M.; Kumar, V.P.; Barshilia, H.C. Nanolayered multilayer Ti/TiN coatings: Role of bi-layer thickness and annealing on solid particle erosion behaviour at elevated temperature. Surf. Coatings Technol. 2018, 357, 204–211. [Google Scholar] [CrossRef]
- Parameswaran, V.; Immarigeon, J.-P.; Nagy, D. Titanium nitride coating for aero engine compressor gas path components. Surf. Coatings Technol. 1992, 52, 251–260. [Google Scholar] [CrossRef]
- Martinella, R. Selection and application of wear-resistant materials to increase service life of components. Ceram. Int. 1993, 19, 375–389. [Google Scholar] [CrossRef]
- Sue, J.; Troue, H. Effect of crystallographic orientation on erosion characteristics of arc evaporation titanium nitride coating. Surf. Coatings Technol. 1987, 33, 169–181. [Google Scholar] [CrossRef]
- Ikeda, R.; Hayashi, M.; Yonezu, A.; Ogawa, T.; Takemoto, M. Fracture observation of polycrystalline diamond film under indentation test. Diam. Relat. Mater. 2004, 13, 2024–2030. [Google Scholar] [CrossRef]
- Torabi, S.; Valefi, Z.; Ehsani, N. Evaluation of oxy-acetylene flame angle effect on the erosion resistance of SiC/ZrB2–SiC/ZrB2 multilayer coatings fabricated by the shielding shrouded plasma spray technique. Ceram. Int. 2021, 48, 8155–8168. [Google Scholar] [CrossRef]
- Veprek, S.; Veprek-Heijman, M.J. Industrial applications of superhard nanocomposite coatings. Surf. Coatings Technol. 2008, 202, 5063–5073. [Google Scholar] [CrossRef]
- Koehler, J.S. Attempt to Design a Strong Solid. Phys. Rev. B 1968, 379, 547–551. [Google Scholar] [CrossRef]
- Wang, D.; Lin, S.-S.; Tian, T.; Liu, M.-X.; Chang, G.-R.; Dong, D.; Shi, J.; Dai, M.-J.; Jiang, B.-L.; Zhou, K.-S. Sand erosion and crack propagation mechanism of Cr/CrN/Cr/CrAlN multilayer coating. Ceram. Int. 2022, 48, 24638–24648. [Google Scholar] [CrossRef]
- Wu, Z.; Wang, Q.; Petrov, I.; Greene, J.; Hultman, L.; Greczynski, G. Cubic-structure Al-rich TiAlSiN thin films grown by hybrid high-power impulse magnetron co-sputtering with synchronized Al+ irradiation. Surf. Coatings Technol. 2020, 385, 125364. [Google Scholar] [CrossRef]
- Chen, J.; He, G.; Han, Y.; Yuan, Z.; Li, Z.; Zhang, Z.; Han, X.; Yan, S. Structural toughness and interfacial effects of multilayer TiN erosion-resistant coatings based on high strain rate repeated impact loads. Ceram. Int. 2021, 47, 27660–27667. [Google Scholar] [CrossRef]
- Zhang, K.; Lu, J.; Li, J.; Zhang, D.; Gao, L.; Zhou, H. An improved approach to prepare triazole protective film by click-assembly on copper surface. Corros. Sci. 2020, 164, 108352. [Google Scholar] [CrossRef]
- Tillmann, W.; Dildrop, M. Influence of Si content on mechanical and tribological properties of TiAlSiN PVD coatings at elevated temperatures. Surf. Coatings Technol. 2017, 321, 448–454. [Google Scholar] [CrossRef]
- He, N.; Li, H.; Ji, L.; Liu, X.; Zhou, H.; Chen, J. High temperature tribological properties of TiAlSiN coatings produced by hybrid PVD technology. Tribol. Int. 2016, 98, 133–143. [Google Scholar] [CrossRef]
- Hua, L.; Yang, L.; Mingyue, H.; Ling, T.; Jiabin, G.; Guodong, L.; Dachen, D.; Hongtao, L.; Kai, H.; Liuhe, L. Effect of geometric position on the film properties for a complex-shaped substrate in HiPIMS discharge: Experiment and simulation. Surf. Coatings Technol. 2022, 434, 128196. [Google Scholar] [CrossRef]
- Li, G.; Sun, J.; Xu, Y.; Xu, Y.; Gu, J.; Wang, L.; Huang, K.; Liu, K.; Li, L. Microstructure, mechanical properties, and cutting performance of TiAlSiN multilayer coatings prepared by HiPIMS. Surf. Coatings Technol. 2018, 353, 274–281. [Google Scholar] [CrossRef]
- Holubář, P.; Jílek, M.; Šíma, M. Nanocomposite nc-TiAlSiN and nc-TiN–BN coatings: Their applications on substrates made of cemented carbide and results of cutting tests. Surf. Coatings Technol. 1999, 120–121, 184–188. [Google Scholar] [CrossRef]
- Liu, J.; Zhu, S.-S.; Deng, X.; Liu, J.-Y.; Wang, Z.-P.; Qu, Z. Cutting Performance and Wear Behavior of AlTiN- and TiAlSiN-Coated Carbide Tools During Dry Milling of Ti–6Al–4V. Acta Metall. Sin. 2020, 33, 459–470. [Google Scholar] [CrossRef]
- Manoharan, M.P.; Desai, A.V.; Haque, M.A. Fracture toughness characterization of advanced coatings. J. Micromech. Microeng. 2009, 19, 115004. [Google Scholar] [CrossRef]
- Bobzin, K.; Brögelmann, T.; Kalscheuer, C.; Yildirim, B.; Liang, T. Deposition of a nanocomposite (Ti, Al, Si)N coating with high thickness by high-speed physical vapor deposition. Mater. Werkst. 2020, 51, 297–312. [Google Scholar] [CrossRef]
- Gu, J.; Li, L.; Ai, M.; Xu, Y.; Xu, Y.; Li, G.; Deng, D.; Peng, H.; Luo, S.; Zhang, P. Improvement of solid particle erosion and corrosion resistance using TiAlSiN/Cr multilayer coatings. Surf. Coatings Technol. 2020, 402, 126270. [Google Scholar] [CrossRef]
- Xu, Y.; Li, L.; Cai, X.; Chu, P.K. Hard nanocomposite Ti–Si–N films prepared by DC reactive magnetron sputtering using Ti–Si mosaic target. Surf. Coatings Technol. 2007, 201, 6824–6827. [Google Scholar] [CrossRef]
- Ma, Q.; Li, L.; Xu, Y.; Ma, X.; Xu, Y.; Liu, H. Effect of Ti content on the microstructure and mechanical properties of TiAlSiN nanocomposite coatings. Int. J. Refract. Met. Hard Mater. 2016, 59, 114–120. [Google Scholar] [CrossRef]
- Rafaja, D.; Poklad, A.; Klemm, V.; Schreiber, G.; Heger, D.; Šíma, M. Microstructure and hardness of nanocrystalline Ti1−x−yAlxSiyN thin films. Mater. Sci. Eng. A 2007, 462, 279–282. [Google Scholar] [CrossRef]
- Fager, H.; Andersson, J.; Lu, J.; Jöesaar, M.J.; Odén, M.; Hultman, L. Growth of hard amorphous TiAlSiN thin films by cathodic arc evaporation. Surf. Coatings Technol. 2013, 235, 376–382. [Google Scholar] [CrossRef]
- Carvalho, S.; Rebouta, L.; Cavaleiro, A.; Rocha, L.; Gomes, J.; Alves, E. Microstructure and mechanical properties of nanocomposite (Ti,Si,Al)N coatings. Thin Solid Films 2001, 398–399, 391–396. [Google Scholar] [CrossRef]
- Lee, J.-H.; Oh, I.-H.; Jang, J.-H.; Kim, J.-H.; Hong, S.-K.; Park, H.-K. Influence of Phase Composition in TiAlSiN Hard Coatings on the Evolution of Structure and Mechanical Properties. Met. Mater. Int. 2021, 27, 456–466. [Google Scholar] [CrossRef]
- Zeng, X.T.; Goto, T.; Zhao, L.R.; Ding, X.Z.; Liew, S.C.; Li, G.Y. Erosive wear properties of Ti–Si–N nanocomposite coatings studied by micro-sandblasting. J. Vac. Sci. Technol. A 2005, 23, 288–292. [Google Scholar] [CrossRef]
- Musil, J. Hard nanocomposite coatings: Thermal stability, oxidation resistance and toughness. Surf. Coatings Technol. 2012, 207, 50–65. [Google Scholar] [CrossRef]
- Diserens, M.; Patscheider, J.; Lévy, F. Mechanical properties and oxidation resistance of nanocomposite TiN–SiNx physical-vapor-deposited thin films. Surf. Coatings Technol. 1999, 120–121, 158–165. [Google Scholar] [CrossRef]
- Veprek, S.; Niederhofer, A.; Moto, K.; Bolom, T.; Männling, H.-D.; Nesladek, P.; Dollinger, G.; Bergmaier, A. Composition, nanostructure and origin of the ultrahardness in nc-TiN/a-Si3N4/a- and nc-TiSi2 nanocomposites with HV = 80 to ≥105 GPa. Surf. Coatings Technol. 2000, 133–134, 152–159. [Google Scholar] [CrossRef]
- Veprek, S.; Zhang, R.; Veprek-Heijman, M.; Sheng, S.; Argon, A. Superhard nanocomposites: Origin of hardness enhancement, properties and applications. Surf. Coatings Technol. 2010, 204, 1898–1906. [Google Scholar] [CrossRef]
- Wei, R. Plasma enhanced magnetron sputter deposition of Ti–Si–C–N based nanocomposite coatings. Surf. Coatings Technol. 2008, 203, 538–544. [Google Scholar] [CrossRef]
- Sánchez-López, J.C.; Caro, A.; Alcala, G.; Rojas, T.C. Tailoring CrNx stoichiometry and functionality by means of reactive HiPIMS. Surf. Coat. Technol. 2020, 401, 126235. [Google Scholar] [CrossRef]
- ASTM-G76; Standard Test Method for Conducting Erosion Tests by Solid Particle Impingement Using Gas Jets. ASTM International: West Conshohocken, PA, USA, 2007.
- Xu, Y.; Li, L.; Luo, S.; Lu, Q.; Gu, J.; Lei, N.; Huo, C. Self-enhanced plasma discharge effect in the deposition of diamond-like carbon films on the inner surface of slender tube. Appl. Surf. Sci. 2017, 393, 467–473. [Google Scholar] [CrossRef]
- Gao, F.; Li, G.; Xia, Y. Influence of hysteresis effect on properties of reactively sputtered TiAlSiN films. Appl. Surf. Sci. 2018, 431, 160–164. [Google Scholar] [CrossRef]
- Depla, D.; Mahieu, S.; De Gryse, R. Magnetron sputter deposition: Linking discharge voltage with target properties. Thin Solid Films 2009, 517, 2825–2839. [Google Scholar] [CrossRef]
- Barshilia, H.C.; Yogesh, K.; Rajam, K. Deposition of TiAlN coatings using reactive bipolar-pulsed direct current unbalanced magnetron sputtering. Vacuum 2008, 83, 427–434. [Google Scholar] [CrossRef]
- Vennemann, A.; Stock, H.-R.; Kohlscheen, J.; Vorgel, E.; Mayr, P. New diamond turnable coatings of ternary systems for ultraprecision cutting. Surf. Coatings Technol. 2003, 174–175, 973–978. [Google Scholar] [CrossRef]
- Marco, J.F.; Gancedo, J.R.; Auger, M.A.; Sánchez, O.; Albella, J.M. Chemical stability of TiN, TiAlN and AlN layers in aggressive SO2 environments. Surf. Interface Anal. 2005, 37, 1082–1091. [Google Scholar] [CrossRef]
- Chen, T.; Xie, Z.; Gong, F.; Luo, Z.; Yang, Z. Correlation between microstructure evolution and high temperature properties of TiAlSiN hard coatings with different Si and Al content. Appl. Surf. Sci. 2014, 314, 735–745. [Google Scholar] [CrossRef]
- Barshilia, H.C.; Ghosh, M.; Shashidhara, A.; Ramakrishna, R.; Rajam, K. Deposition and characterization of TiAlSiN nanocomposite coatings prepared by reactive pulsed direct current unbalanced magnetron sputtering. Appl. Surf. Sci. 2010, 256, 6420–6426. [Google Scholar] [CrossRef]
- Ma, Q.; Li, L.; Xu, Y.; Gu, J.; Wang, L.; Xu, Y. Effect of bias voltage on TiAlSiN nanocomposite coatings deposited by HiPIMS. Appl. Surf. Sci. 2017, 392, 826–833. [Google Scholar] [CrossRef]
- Calamba, K.M.; Schramm, I.C.; Jõesaar, M.P.J.; Ghanbaja, J.; Pierson, J.F.; Mücklich, F.; Odén, M. Enhanced thermal stability and mechanical properties of nitrogen deficient titanium aluminum nitride (Ti0.54Al0.46Ny) thin films by tuning the applied negative bias voltage. J. Appl. Phys. 2017, 122, 065301. [Google Scholar] [CrossRef]
- Park, H.; Jung, D.; Na, H.; Joo, J.; Lee, J. The properties of (Ti,Al)N coatings deposited by inductively coupled plasma assisted d.c. magnetron sputtering. Surf. Coatings Technol. 2001, 142–144, 999–1004. [Google Scholar] [CrossRef]
- Molarius, J.; Korhonen, A.; Harju, E.; Lappalainen, R. Comparison of cutting performance of ion-plated NbN, ZrN, TiN and (Ti, Al)N coatings. Surf. Coatings Technol. 1987, 33, 117–132. [Google Scholar] [CrossRef]
- Pelleg, J.; Zevin, L.Z.; Lungo, S.; Croitoru, N. Reactive-sputter-deposited TiN films on glass substrates. Thin Solid Films 1991, 197, 117–128. [Google Scholar] [CrossRef]
- Petrov, I.; Hultman, L.; Sundgren, J.-E.; Greene, J.E. Polycrystalline TiN films deposited by reactive bias magnetron sputtering: Effects of ion bombardment on resputtering rates, film composition, and microstructure. J. Vac. Sci. Technol. A 1992, 10, 265–272. [Google Scholar] [CrossRef]
- Kang, L.; Yang, C. A Review on High-Strength Titanium Alloys: Microstructure, Strengthening, and Properties. Adv. Eng. Mater. 2019, 21, 1801359. [Google Scholar] [CrossRef]
- Leyland, A.; Matthews, A. On the significance of the H/E ratio in wear control: A nanocomposite coating approach to optimised tribological behaviour. Wear 2000, 246, 1–11. [Google Scholar] [CrossRef]
- Leyland, A.; Matthews, A. Design criteria for wear-resistant nanostructured and glassy-metal coatings. Surf. Coat. Technol. 2004, 177–178, 317–324. [Google Scholar] [CrossRef]
- Hutchings, I.M. Ductile-brittle transitions and wear maps for the erosion and abrasion of brittle materials. J. Phys. D Appl. Phys. 1992, 25, A212–A221. [Google Scholar] [CrossRef]
- El-Rahman, A.A.; Wei, R. Effect of ion bombardment on structural, mechanical, erosion and corrosion properties of Ti–Si–C–N nanocomposite coatings. Surf. Coatings Technol. 2014, 258, 320–328. [Google Scholar] [CrossRef]
- Lin, J.; Wei, R.; Ge, F.; Li, Y.; Zhang, X.; Huang, F.; Lei, M. TiSiCN and TiAlVSiCN nanocomposite coatings deposited from Ti and Ti-6Al-4V targets. Surf. Coatings Technol. 2018, 336, 106–116. [Google Scholar] [CrossRef]
- Panjan, P.; Gselman, P.; Kek-Merl, D.; Čekada, M.; Panjan, M.; Dražić, G.; Bončina, T.; Zupanič, F. Growth defect density in PVD hard coatings prepared by different deposition techniques. Surf. Coatings Technol. 2013, 237, 349–356. [Google Scholar] [CrossRef]
- Panjan, P.; Drnovšek, A.; Gselman, P.; Čekada, M.; Panjan, M. Review of Growth Defects in Thin Films Prepared by PVD Techniques. Coatings 2020, 10, 447. [Google Scholar] [CrossRef]
- Wang, H.; Stack, M.; Lyon, S.; Hovsepian, P.; Münz, W.-D. Wear associated with growth defects in combined cathodic arc/unbalanced magnetron sputtered CrN/NbN superlattice coatings during erosion in alkaline slurry. Surf. Coatings Technol. 2000, 135, 82–90. [Google Scholar] [CrossRef]
- Azar, G.T.P.; Yelkarasi, C.; Ürgen, M. The role of droplets on the cavitation erosion damage of TiN coatings produced with cathodic arc physical vapor deposition. Surf. Coatings Technol. 2017, 322, 211–217. [Google Scholar] [CrossRef]
- Bhowmick, S.; Jayaram, V.; Biswas, S. Deconvolution of fracture properties of TiN films on steels from nanoindentation load–displacement curves. Acta Mater. 2005, 53, 2459–2467. [Google Scholar] [CrossRef]
- Levy, A.V. The platelet mechanism of erosion of ductile metals. Wear 1986, 108, 1–21. [Google Scholar] [CrossRef]
- Bousser, E.; Martinu, L.; Klemberg-Sapieha, J. Solid particle erosion mechanisms of protective coatings for aerospace applications. Surf. Coatings Technol. 2014, 257, 165–181. [Google Scholar] [CrossRef]
- Finnie, I. Some reflections on the past and future of erosion. Wear 1995, 186–187, 1–10. [Google Scholar] [CrossRef]


Disclaimer/Publisher’s Note: The statements, opinions and data contained in all publications are solely those of the individual author(s) and contributor(s) and not of MDPI and/or the editor(s). MDPI and/or the editor(s) disclaim responsibility for any injury to people or property resulting from any ideas, methods, instructions or products referred to in the content. |
© 2023 by the authors. Licensee MDPI, Basel, Switzerland. This article is an open access article distributed under the terms and conditions of the Creative Commons Attribution (CC BY) license (https://creativecommons.org/licenses/by/4.0/).