Abstract
In this work, the application of the Average Strain Energy Density (ASED) criterion for the estimation of failure loads in materials with nonlinear behavior containing U-shaped notches is presented. The ASED criterion was originally defined to predict failure in the presence of notches in materials with linear-elastic behavior. However, most structural materials (e.g., ferritic-pearlitic steels) can develop non-linear behavior (e.g., elastoplastic). In this sense, this work proposes to extend the use of the ASED criterion to materials that exhibit plasticity by a thorough calibration of their characteristic parameters, and the subsequent extrapolation of the liner-elastic formulation of the ASED criterion to non-linear situations. To validate this methodology, a wide range of structural steels (S275JR, S355J2, S460M, and S690Q) were used operating in the ductile-to-brittle transition range, with six different notch radii (0 mm, 0.15 mm, 0.25 mm, 0.50 mm, 1.0 mm, and 2.0 mm). The results obtained demonstrate that the proposed calibration of the ASED criterion allows for accurate predictions of failure loads. Therefore, it is shown that, for the notch radii analyzed in this work and for testing temperatures within the material ductile-to-brittle transition range, it is possible to extrapolate the ASED criterion to obtain estimates of failure loads in materials with U-shaped notches that exhibit ductile behavior.
1. Introduction
Structural steels are widely used in engineering structures, particularly in the construction industry. Brittle fracture is a major concern in practical situations, such as the cleavage fracture of reactor pressure vessels in nuclear power plants [1]. Structural steels can experience cleavage fracture at low temperatures, either in the brittle regime (lower shelf, LS) or in the Ductile-to-Brittle Transition Range (DBTR). Although steels are typically designed to operate in the ductile regime (upper shelf, US), unexpected low temperatures or material embrittlement can force them to operate in the DBTR or LS. In both cases, the fracture toughness of the material and the load-bearing capacity of the structural component can be significantly reduced. Therefore, studying steels operating at low temperatures is crucial for ensuring structural integrity.
On the other hand, notches (i.e., defects with finite tip radius), such as slots, holes, corners, cut-outs, etc., are sometimes introduced in components as structural details or to join them together. Components with notches have been found to have a higher load-bearing capacity compared to those with cracks [2,3,4] since notches tend to develop more relaxed stress fields around the tip. Traditionally, notches have been evaluated using a sharp crack methodology based on fracture mechanics [5], which is conservative and does not account for the unique properties of notched components.
In recent years, alternative methodologies have been developed to provide more accurate predictions of fracture loads and reduce conservatism. The scientific community has developed theories and tools to better understand and analyze the fracture behavior of notched components. For example, the Theory of Critical Distances (TCD) [2] and the Average Strain Energy Density (ASED) criterion [6,7,8,9,10] are two widely used linear elastic formulations that have been successfully applied to different materials and loading conditions. The TCD has also been calibrated for more ductile situations, while the accuracy of the linear-elastic formulation of the ASED criterion decreases in such cases since their characteristic parameters are constant. In literature, some exercises have been made in order to applicate the ASED approach to materials that have shown non-linear behavior. These approaches integrate the conventional brittle ASED criteria with innovative ideas, including the equivalent material concept (EMC) [11,12], the fictitious material concept (FMC) [13], or the virtual isotropic material concept (VIMC) [14]. However, all of these approaches require additional steps for predicting the fracture load, which the calibration proposed in this work aims to eliminate.
Other criteria, such as the Global Criterion [15], Process Zone Models [16], Statistical Models [17], Mechanistic Models [18], and Damage Models [19,20] can also be considered for studying the notch effect.
This research proposes a calibration of the ASED criterion allowing its extrapolation to non-linear elastic conditions that considers more realistic material behavior while maintaining simplicity. Non-linear elastic behavior can occur in many practical situations and calibrating the ASED criterion for such conditions would enhance its accuracy and applicability. This is the case, for example, of structural steels operating within their corresponding ductile-to-brittle transition range, on which the final cleavage (brittle) fracture may be preceded by certain ductile (non-linear) tearing. With all this, Section 2 provides the theoretical framework of the research with a description of the ASED criterion. Section 3 presents the materials and methods used for the prediction of critical loads. Section 4 provides the predictions of the critical loads obtained through the proposed calibration, together with the corresponding discussion. Finally, Section 5 presents the main conclusions.
2. The Average Strain Energy Density Criterion
The Average Strain Energy Density (ASED) criterion has been widely used to predict fracture in various materials since its introduction in the 1970s by Sih [21] and its further development carried out by Lazzarin and Zambardi [6,22,23,24]. The criterion states that the fracture occurs when the mean value of strain energy density () within a control volume equals the critical ASED value (Wc), as expressed in Equation (1).
For brittle materials, the critical ASED value can be obtained using Equation (2), which relates it to the material’s ultimate tensile strength (σu) and Young’s modulus (E), as it corresponds to the area below the curve of a tensile test.
Equations (3) and (4) define the radius of the control volume (Rc) (see Figure 1) under plane strain and plane stress conditions, respectively [25]. In the case of U-shaped notches, the center of the control volume is located at a distance of rc = ρ/2 with respect to the notch tip, i.e., it corresponds to the origin of the local coordinate system [22]. The choice between these conditions depends on the material’s fracture resistance, when Kmat is lower than Equation (5) [2], plane stress domains, while plane strain condition is reached when Kmat is higher than the value defined by Equation (6). For situations where fracture resistance falls between the values defined by these equations, an interpolation of Equations (3) and (4) is required to obtain Rc.
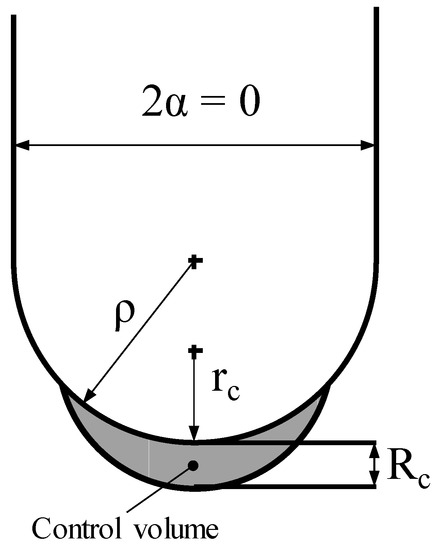
Figure 1.
Characteristic lengths and the control volume of ASED for U-notches under loading mode I.
σy represents the material yield strength, υ is the material Poisson’s ratio, Kmat is the material fracture toughness (obtained through cracked specimens), and B is the specimen thickness.
Considering the polar coordinates represented in Figure 1 and their three-dimensional extension to cylindrical coordinates (r, θ, z), the strain energy at a certain point for an isotropic material obeying a linear elastic law is [22]:
The average strain energy density over the control area (Ω) depicted in Figure 1 and can be expressed as [22]:
Now following the development of Lazzarin and Berto [22] for blunt V-notches, and considering the mathematical development of Equation (8) the mean value of the ASED within the control volume can be calculated using Equation (9), which depends on the functions F, H and the maximum elastic stress at the notch tip (σmax) [6]. In turn, the function F(2α) depends on the opening angle (2α) and the function H(2α, Rc/ρ) depends on the opening angle (2α) and the ratio between Rc and the notch radius (Rc/ρ). At the same time, H is a function of υ and their values were originally tabulated by an element finite analysis. Table 1 provides the tabulated values of H for the U-notch geometry while F takes a value of 0.785 for this notch shape.

Table 1.
Values of H for U-shaped notches (2α = 0), data from [6].
3. Materials and Methods
The present work presents a methodology for predicting the critical load values of U-notched specimens through a calibrated version of the ASED. This methodology was applied to four different types of ferritic-pearlitic steels: S275JR, S355J2, S460M, and S690Q. These four types of materials are commonly used in structural applications and are characterized by different mechanical properties and chemical compositions, which are summarized in Table 2 and Table 3, respectively [3,4,26,27]. Ferritic steels typically comprise carbon, low-alloy, and higher alloy grades, with common microstructures including bainite, tempered bainite, tempered martensite, ferrite, and pearlite. The four types of materials used in this study were characterized as follows:
Table 2.
Mechanical properties used for ASED analysis for the different structural steels and temperatures studied.
Table 3.
Chemical composition of structural steels (wt.%).
- Steel S275JR: 84 compact tension (CT) specimens with a thickness of 25 mm were tested, as shown in Figure 2a, covering six different notch radii (0 mm, 0.15 mm, 0.25 mm, 0.50 mm, 1.0 mm, and 2.0 mm) and five different temperatures within the ductile-to-brittle transition range (DBTR) of −10 °C, −30 °C, and −50 °C and two temperatures in the lower shelf (LS) of −90 °C and −120 °C. A complete description of the experimental procedure can be found in [26];
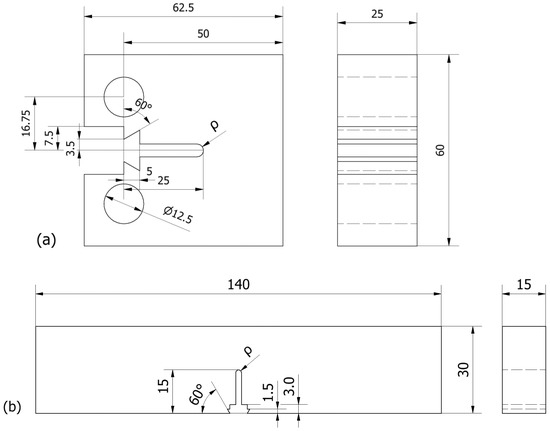 Figure 2. Schematic showing the geometry of the specimens (dimensions in mm): (a) CT specimen and (b) SENB specimen. ρ varying from 0 mm (cracked specimens) up to 2.0 mm.
 - Steel S355J2: 84 CT specimens with a thickness of 25 mm were tested (see Figure 2a), covering six different notch radii and three different temperatures within the DBTR of −100 °C, −120 °C, and −150 °C. The experimental procedure is described in [26];
- Steel S460M: 84 single-edge notched bend (SENB) specimens with a thickness of 15 mm were tested, schematic in Figure 2b, covering the same six notch radii and three different temperatures within the DBTR of −100 °C, −120 °C, and −140 °C. The experimental procedure is described in [27];
- Steel S690Q: 84 SENB specimens with a thickness of 15 mm were tested (check Figure 2b), covering the same six notch radii and testing temperatures as steel S460M, all of them within its DBTR. The experimental procedure is also described in [27].
Here, it is important to notice that the specimens with crack-like defect, i.e., 0 mm of notch radius, are used only to obtain the material fracture toughness (Kmat). This property is necessary for the initial calculation of the Rc parameter by following the ASED methodology presented above.
In addition, some examples of the obtained load–displacement curves are plotted in Figure 3, showing the behavior of the six notch radii (0, 0.15, 0.25, 0.5, 1, and 2 mm) for the case of the steel S460M (tested at −140 °C) and S690Q (tested at −100 °C). It is clear how even these medium (S460M) and high (S690Q) strength structural steels tested at such low temperatures develop a non-linear behavior due to the notch effect. The same effect is also observed in the S275JR and S355J2 steels.
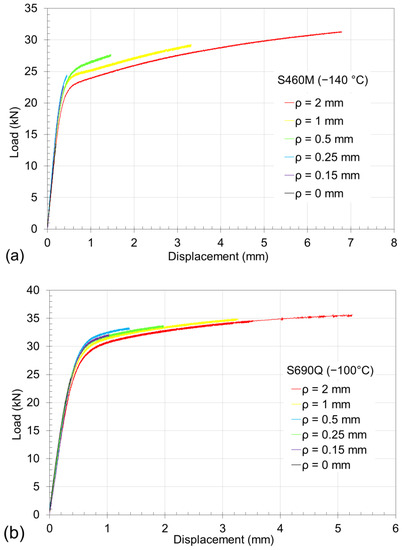
Figure 3.
Examples of load–displacement curves obtained for the materials: (a) S460M at −140 °C and (b) S690Q at −100 °C.
3.1. Direct Application of the ASED Criterion
Once the basic mechanical properties were determined from the tensile and fracture results of each material, the rupture loads were predicted by applying the ASED criterion according to its original formulation, assuming a linear elastic behavior of the material. The procedure followed was as follows: based on the failure criterion established by the ASED and using Equations (1), (2) and (9), the maximum stress at the notch tip can be simply derived from the tabulated values of the H function and the mechanical properties of the material:
It is important to note that the H values presented in Table 1 were tabulated for a certain range of Rc/ρ (from 0.01 to 1). However, there are materials where the Rc/ρ ratio can reach much higher values. For example, the S275JR steel exceeded the value of 100 at −10 °C. Therefore, for each analyzed material, the tabulated H values should be extrapolated for each Poisson’s ratio value. In this study, the fitting shown in Equation (11) proposed in [28] was used.
where the values of a and b are the parameters needed to fit the curve. In the case of the materials studied in this work, the curve was fitted using the least-squares method for a Poisson’s ratio of 0.3, resulting in fitting parameters of 0.1896 and 0.3258 for a and b, respectively, as shown in Figure 4.
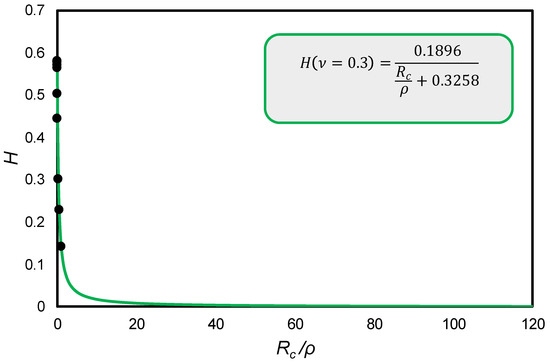
Figure 4.
Extrapolated values of the function H for ν = 0.3.
Next, considering that σmax (in mode I) is reached at the tip of the notch (r = 0), and applying the Creager–Paris stress distribution for U-notch [29], the stress intensity factor (KI) can be directly derived from the following equation:
Finally, one of the analytical solutions of KI for common specimens that can be found in the literature can be used to derive the predicted critical load values following the ASED criterion (PASED). In this study, Equation (13) for CT fracture specimens and Equation (14) for SENB specimens were used [5]:
where a is the length of the defect, B is the thickness of the specimen, W is the width of the specimen and S is the distance between specimen supports.
3.2. Proposed Calibration of the ASED Criterion
As previously mentioned, the ASED criterion is a local criterion based on elastic-linear principles. In materials that develop plasticity, using the area under the curve of a perfectly elastic-linear material (Wc) as the critical fracture value may lead to over-conservative predictions. Various attempts have been made to extend the applicability of the ASED criterion to materials with nonlinear behavior by combining it with other tools, such as the Equivalent Material Concept (EMC) [30] or the Fictitious Material Concept (FMC) [31]. However, they increase the number of steps of the analyses and have been validated to a limited number of materials.
In this sense, a novel calibration of the characteristic parameters (Wc and Rc) of the ASED is proposed, somewhat similar to that used in the Point Method (PM) of the Theory of Critical Distances (TDC) [2]. In order to calibrate the parameters Wc and Rc, a deformation energy density (W) profile can be obtained as a function of the distance (R) to the notch tip. Thus, by obtaining two W profiles for two different notch radii, the cut-off point between the two curves will correspond to the calibrated values of Wcalibrated and Rcalibrated, as shown in Figure 5. Once the calibrated parameters are defined, fracture load predictions (PASED) for any other notch radius can be easily derived using the conventional ASED procedure described in Section 3.1. Therefore, with just a small experimental campaign using specimens with two different notch radii, it would be possible to predict fracture loads for notches of different radii. This proposal is actually an extrapolation of the linear-elastic ASED criterion to non-linear situations through the calibration of the ASED parameters and their subsequent application to statically equivalent linear-elastic loading conditions.
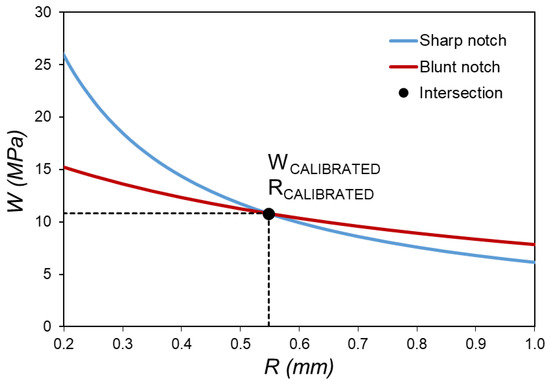
Figure 5.
Example of calibration procedure of ASED parameters using a blunt and a sharp U-notch radius.
4. Results and Discussion
In order to compare the quality of the calibration proposed, fracture load predictions have been obtained by applying directly the conventional ASED (i.e., the linear-elastic approach). A comparison between fracture load predictions obtained using the ASED criterion and actual experimental data is shown in Figure 6. It can be observed that the fracture load estimations using the ASED criterion are considerably lower than the actual experimental fracture loads. The ASED criterion exhibits a clear over-conservatism, resulting in poor predictive accuracy. This discrepancy may be attributed to the utilization of the linear elastic region of the tensile test and the exclusion of a significant portion of the stress-strain curve from consideration. Consequently, the estimated critical values of the strain energy density do not accurately represent a material that experiences substantial plastic deformations prior to failure.
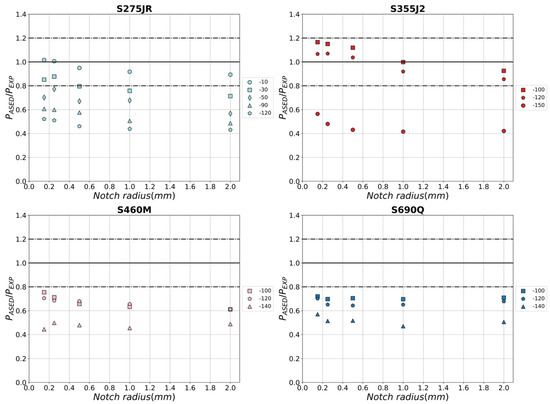
Figure 6.
The ratio of fracture load predictions (PASED) using conventional ASED criterion and experimental fracture load (PEXP).
Considering the low prediction accuracy shown by the linear-elastic approach of the ASED criterion, the need to develop an alternative method capable of providing more realistic estimates in clearly nonlinear situations becomes apparent. In this sense, the results of the calibration of the ASED parameters proposed in Section 3.2 are shown below.
As the first approach, the calibration was conducted using experimental data from specimens with the smallest and largest notch radii, i.e., 0.15 mm and 2 mm, for all the materials studied. The W curve was calculated as a function of R based on the experimental fracture loads. To achieve this, KI was calculated using Equation (13) or (14), as appropriate, and σmax was obtained using the Creager–Paris Equation (12). Finally, W was calculated using Equation (9). By employing these calculations, W curves were obtained for the two notch radii utilized, as shown in Figure 5. Table 4 summarizes the calibration parameters for all the possible combinations, it is evident that the Wcalibrated value deviates from the critical value Wc proposed in the original procedure, being on average over 10 times larger than the original Wc.
Table 4.
ASED calibrated parameters per material and temperature analyzed, together with the linear-elastic formulation of Wc.
In Figure 7, the fracture load estimations obtained using the calibrated ASED are presented. It is evident that employing the calibrated ASED values significantly improves the accuracy of the load predictions in comparison to the linear-elastic ASED, with all estimations falling within a margin of error of ±20%. The maximum error observed is 19% for S355J2 at a temperature of −150 °C and a notch radius of 0.50 mm, while the average error across all predictions is below 6%. This demonstrates the capability of accurately predicting fracture loads with the utilization of this calibration approach by using the notch radius of 0.15 mm and 2 mm. At the same time, Figure 8 shows the values of Wcalibrated (Figure 8a) and Rcalibrated (Figure 8b) for the four steels at the different temperatures studied. Although no tendency among the ASED parameters and the temperature was found, they all had the same magnitude order.
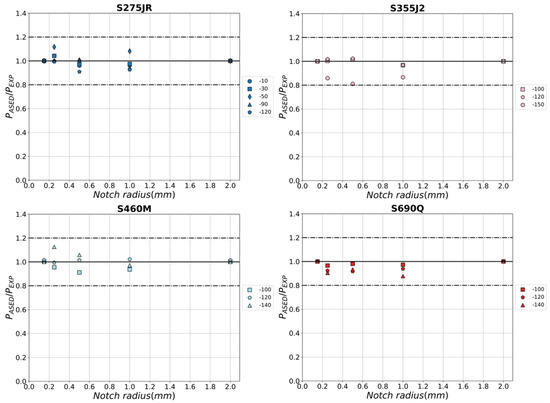
Figure 7.
The ratio of fracture load predictions (PASED) using the calibrated ASED criterion (with radius 0.15 and 2 mm) and experimental fracture load (PEXP).
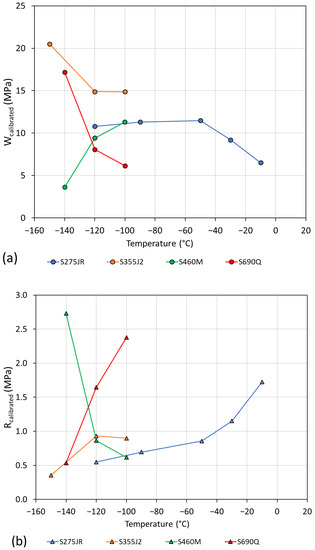
Figure 8.
Evolution of Wcalibrated (a) and Rcalibrated (b) with the temperature for all the steels calibrating with 0.15 and 2 mm.
Hereinafter, the calibration procedure has been validated by employing all possible combinations of notch radii to obtain the calibrated ASED parameters, such as 0.15–0.50 mm, 0.15–1 mm, and so on. An example of the calibration carried out for S275JR at −10 °C is presented in Figure 9, and the same process was performed for all the materials and temperatures analyzed. It is noteworthy that for the example shown in Figure 9, all ten possible calibrated parameters were obtained; however, this was not feasible for all materials. This limitation arises from the fact that sometimes the profile curves of two closely notch radii are so similar that they intersect outside the specimen’s remaining ligament, which is physically impossible. To provide context, when the calibration was conducted with notch radii of 0.15 and 0.25 mm, six out of the fourteen possible combinations did not intersect, and for notch radii of 1 and 2 mm, three out of fourteen times the intersection did not occur. For the remaining cases, either all the curves intersected or only one was missing.
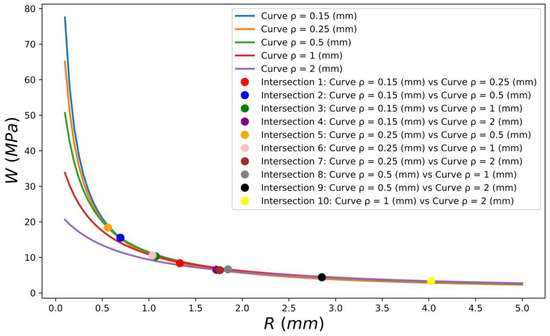
Figure 9.
Calibration procedure of S275JR at −10 °C using all possible combinations of notch radius.
Figure 10 presents the average ratio between the predicted and experimental loads for all combinations of notch radii used in the calibration process. The average value was calculated based on the remaining three notches that were not used for calibration. Overall, the predictions were found to be generally accurate regardless of the combination of notch radii used for calibration, with most of the errors falling within the band of ±20%. However, some considerations need to be taken into account. Calibrations with close-notch radii are sometimes not possible, as explained previously, and may result in larger errors. The maximum average error observed was 35% when calibrating with a notch radius of 0.15 and 0.25 mm, which is still lower than the maximum error of 54% obtained using conventional ASED. On average, the least accurate predictions were obtained with a notch radius of 0.15–0.25 mm, 0.25–0.50 mm, and 1–2 mm, with an average error of approximately 10%, which is again significantly lower than the 33% error obtained with conventional ASED. In general, it can be said that this calibration is limited to predicting critical loads for a notch radius twice larger than those used in the calibration. On the other hand, the predictions with the lowest error (4.6%) are obtained when the calibration is carried out with 0.25–1 mm radii, which makes sense because these radii are the nearest with respect to the predicted ones (i.e., 0.15, 0.5 and 2 mm).
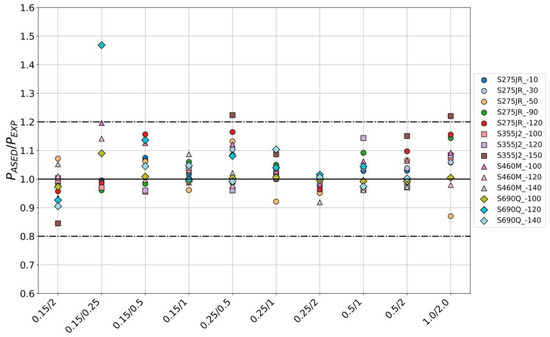
Figure 10.
Comparison of the ratio of prediction by using the different combinations of notch radii for the calibration.
As a general conclusion, to avoid complications with the calibration procedure and obtain the most accurate predictions, it is recommendable to use two extreme notch radii, i.e., a sharp notch and a blunt notch, taking into account which another notch radius needs to be predicted.
5. Conclusions
In this research, the possibility of extrapolating the ASED criterion for fracture load calculations in notched materials with significant plasticity is evaluated. Four types of structural steels (S275JR, S355J2, S460M, and S690Q) are analyzed at various temperatures, with six different notch radii (0, 0.15, 0.25, 0.50, 1.0, and 2.0 mm).
As observed, the original linear-elastic ASED criterion provides poor predictions of fracture loads. Therefore, instead of predicting load values directly using the characteristic parameters Wc and Rc of the ASED and assuming an elastic-linear behavior, these parameters (Wcalibrated and Rcalibrated) are calibrated using two different notch radii. The results demonstrate that with a simple calibration of the ASED criterion, accurate predictions of fracture loads are achieved for materials that clearly exhibit non-linear behavior prior to failure. An initial analysis is performed using the extreme notch radii of 0.15 mm and 2.0 mm, yielding highly accurate results with an average error of less than 6%. Furthermore, the consistency of the calibration is verified when using different combinations of notch radii. It is observed that in general, any combination of notch radii can be used for calibration of the ASED criterion. However, it is recommended to avoid using very close-notch radii, as they result in the worst predictions, and the profiles may not intersect within the remaining ligament of the specimen. Finally, in order to obtain accurate predictions, fracture load estimations should be limited to specimens or components with notch radii not larger than twice the bigger radius used in the calibration.
With all this, for the notch radii analyzed in this work, the calibrated version of the ASED approach can be used as a simple tool to predict the critical load of structural steels operating under the ductile-to-brittle transition region, where the main micromechanism is cleavage fracture but a significant amount of non-linear processes may precede the cleavage onset (that increase with the notch radius), such as ductile crack growth. Further validation is required to demonstrate the applicability of the approach to other conditions (e.g., different materials, notch radii, or ductility level, among others).
Author Contributions
Conceptualization, M.S. and S.C.; methodology., M.S. and S.C.; formal analysis, S.C., M.S., S.A. and A.R.T.; investigation M.S., S.C., S.A. and A.R.T.; writing—original draft preparation, M.S.; writing—review and editing, M.S., S.C., S.A. and A.R.T. All authors have read and agreed to the published version of the manuscript.
Funding
This research was funded from the Spanish Ministry of Science and Innovation under the agreement Project MAT2014-58443-P: “Análisis del comportamiento en fractura de componentes estructurales con defectos en condiciones debajo confinamiento tensional”.
Institutional Review Board Statement
Not applicable.
Informed Consent Statement
Not applicable.
Data Availability Statement
The data presented in this study are available upon request from the corresponding authors.
Conflicts of Interest
The authors declare no conflict of interest.
References
- Shah, V.N.; MacDonald, P.E. Aging and Life Extension of Major Light Water Reactor Components, 1st ed.; Shah, V.N., MacDonald, P.E., Eds.; Elsevier Science Pub. Co., Inc.: New York, NY, USA, 1993; ISBN 9780444894489. [Google Scholar]
- Taylor, D. The Theory of Critical Distances; Elsevier: London, UK, 2007; Volume 75, ISBN 9780080444789. [Google Scholar]
- Cicero, S.; Madrazo, V.; García, T. Analysis of Notch Effect in the Apparent Fracture Toughness and the Fracture Micromechanisms of Ferritic–Pearlitic Steels Operating within Their Lower Shelf. Eng. Fail. Anal. 2014, 36, 322–342. [Google Scholar] [CrossRef]
- Cicero, S.; Madrazo, V.; García, T.; Cuervo, J.; Ruiz, E. On the Notch Effect in Load Bearing Capacity, Apparent Fracture Toughness and Fracture Mechanisms of Polymer PMMA, Aluminium Alloy Al7075-T651 and Structural Steels S275JR and S355J2. Eng. Fail. Anal. 2013, 29, 108–121. [Google Scholar] [CrossRef]
- Anderson, T.L. Fracture Mechanics: Fundamentals and Applications, 4th ed.; CRC Press: Boca Raton, FL, USA, 2005; ISBN 1498728146. [Google Scholar]
- Berto, F.; Lazzarin, P.; Ayatollahi, M.R. Recent Developments in Brittle and Quasi-Brittle Failure Assessment of Graphite by Means of SED Approach. Key Eng. Mater. 2013, 2, 854–861. [Google Scholar]
- Seibert, P.; Susmel, L.; Berto, F.; Kästner, M.; Razavi, S.M.J. Applicability of Strain Energy Density Criterion for Fracture Prediction of Notched PLA Specimens Produced via Fused Deposition Modeling. Eng. Fail. Mech. 2021, 258, 108103. [Google Scholar] [CrossRef]
- Sánchez, M.; Cicero, S.; Arrieta, S.; Martínez, V. Fracture Load Predictions in Additively Manufactured ABS U-Notched Specimens Using Average Strain Energy Density Criteria. Materials 2022, 15, 2372. [Google Scholar] [CrossRef] [PubMed]
- Shahbaz, S.; Ayatollahi, M.R.; Petru, M.; Torabi, A.R. U-Notch Fracture in Additively Manufactured ABS Specimens under Symmetric Three-Point Bending. Theor. Appl. Fract. Mech. 2022, 119, 103318. [Google Scholar] [CrossRef]
- Seibert, P.; Taylor, D.; Berto, F.; Mohammad Javad Razavi, S. Energy TCD–Robust and Simple Failure Prediction Unifying the TCD and ASED Criterion. Eng. Fail. Mech. 2022, 271, 108652. [Google Scholar] [CrossRef]
- Ayatollahi, M.R.; Rezaeian, P.; Nabavi-Kivi, A.; Khosravani, M.R. Heat Treatment Effects on Fracture Resistance of Additively Manufactured PLA Specimens under Mode I Loading. Fatigue Fract. Eng. Mater. Struct. 2023, 46, 1045–1059. [Google Scholar] [CrossRef]
- Albinmousa, J.; AlSadah, J.; Hawwa, M.A.; Al-Qahtani, H.M. Estimation of Mode I Fracture of U-Notched Polycarbonate Specimens Using the Equivalent Material Concept and Strain Energy Density. Appl. Sci. 2021, 11, 3370. [Google Scholar] [CrossRef]
- Cicero, S.; Torabi, A.R.; Majidi, H.R.; Gómez, F.J. On the Use of the Combined FMC-ASED Criterion for Fracture Prediction of Notched Specimens with Nonlinear Behavior. Procedia Struct. Integr. 2020, 28, 84–92. [Google Scholar] [CrossRef]
- Sánchez, M.; Cicero, S.; Torabi, A.R.; Ayatollahi, M.R. Critical Load Prediction in Notched e/Glass–Epoxy-Laminated Composites Using the Virtual Isotropic Material Concept Combined with the Average Strain Energy Density Criterion. Polymers 2021, 13, 1057. [Google Scholar] [CrossRef]
- Beaumont, P.W.R. The Failure of Fibre Composites: An Overview. J. Strain Anal. Eng. Des. 1989, 24, 189–205. [Google Scholar] [CrossRef]
- Dugdale, D.S. Yielding of Steel Sheets Containing Slits. J. Mech. Phys. Solids 1960, 8, 100–104. [Google Scholar] [CrossRef]
- Beremin, F.M.; Pineau, A.; Mudry, F.; Devaux, J.-C.; D’Escatha, Y.; Ledermann, P. A Local Criterion for Cleavage Fracture of a Nuclear Pressure Vessel Steel. Metall. Trans. A 1983, 14, 2277–2287. [Google Scholar] [CrossRef]
- Ritchie, R.O.; Knott, J.F.; Rice, J.R. On the Relationship between Critical Tensile Stress and Fracture Toughness in Mild Steel. J. Mech. Phys. Solids 1973, 21, 395–410. [Google Scholar] [CrossRef]
- Churyumov, A.Y.; Medvedeva, S.V.; Mamzurina, O.I.; Kazakova, A.A.; Churyumova, T.A. United Approach to Modelling of the Hot Deformation Behavior, Fracture, and Microstructure Evolution of Austenitic Stainless AISI 316Ti Steel. Appl. Sci. 2021, 11, 3204. [Google Scholar] [CrossRef]
- Kim, M.-S.; Kim, H.-T.; Choi, Y.-H.; Kim, J.-H.; Kim, S.-K.; Lee, J.-M. A New Computational Method for Predicting Ductile Failure of 304L Stainless Steel. Metals 2022, 12, 1309. [Google Scholar] [CrossRef]
- Sih, G.C. Strain-Energy-Density Factor Applied to Mixed Mode Crack Problems. Int. J. Fract. 1974, 10, 305–321. [Google Scholar] [CrossRef]
- Lazzarin, P.; Berto, F. Some Expressions for the Strain Energy in a Finite Volume Surrounding the Root of Blunt V-Notches. Int. J. Fract. 2005, 135, 161–185. [Google Scholar] [CrossRef]
- Lazzarin, P.; Zambardi, R. A Finite-Volume-Energy Based Approach to Predict the Static and Fatigue Behavior of Components with Sharp V-Shaped Notches. Int. J. Fract. 2001, 112, 275–298. [Google Scholar] [CrossRef]
- Berto, F.; Lazzarin, P. A Review of the Volume-Based Strain Energy Density Approach Applied to V-Notches and Welded Structures. Theor. Appl. Fract. Mech. 2009, 52, 183–194. [Google Scholar] [CrossRef]
- Yosibash, Z. Failure Criteria for Brittle Elastic Materials. Interdiscip. Appl. Math. 2012, 37, 185–220. [Google Scholar] [CrossRef]
- Cicero, S.; Madrazo, V.; García, T. The Notch Master Curve: A Proposal of Master Curve for Ferritic–Pearlitic Steels in Notched Conditions. Eng. Fail. Anal. 2014, 42, 178–196. [Google Scholar] [CrossRef]
- Cicero, S.; García, T.; Madrazo, V. Application and Validation of the Notch Master Curve in Medium and High Strength Structural Steels. J. Mech. Sci. Technol. 2015, 29, 4129–4142. [Google Scholar] [CrossRef]
- Justo, J.; Castro, J.; Cicero, S. Energy-Based Approach for Fracture Assessment of Several Rocks Containing U-Shaped Notches through the Application of the SED Criterion. Int. J. Rock Mech. Min. Sci. 2018, 110, 306–315. [Google Scholar] [CrossRef]
- Creager, M.; Paris, P.C. Elastic Field Equations for Blunt Cracks with Reference to Stress Corrosion Cracking. Int. J. Fract. Mech. 1967, 3, 247–252. [Google Scholar] [CrossRef]
- Cicero, S.; Fuentes, J.D.; Torabi, A.R. Using the Equivalent Material Concept and the Average Strain Energy Density to Analyse the Fracture Behaviour of Structural Materials. Appl. Sci. 2020, 10, 1601. [Google Scholar] [CrossRef]
- Torabi, A.R.; Majidi, H.R.; Cicero, S.; Ibáñez-Gutiérrez, F.T.; Fuentes, J.D. Experimental Verification of the Fictitious Material Concept for Tensile Fracture in Short Glass Fibre Reinforced Polyamide 6 Notched Specimens with Variable Moisture. Eng. Fract. Mech. 2019, 212, 95–105. [Google Scholar] [CrossRef]
Disclaimer/Publisher’s Note: The statements, opinions and data contained in all publications are solely those of the individual author(s) and contributor(s) and not of MDPI and/or the editor(s). MDPI and/or the editor(s) disclaim responsibility for any injury to people or property resulting from any ideas, methods, instructions or products referred to in the content. |
© 2023 by the authors. Licensee MDPI, Basel, Switzerland. This article is an open access article distributed under the terms and conditions of the Creative Commons Attribution (CC BY) license (https://creativecommons.org/licenses/by/4.0/).