Article

Investigation of High-Cycle Fatigue Properties of Wire Arc Additive Manufacturing 13Cr4Ni Martensitic Stainless Steel

1
State Key Laboratory of Advanced Welding and Joining, Harbin Institute of Technology, Harbin 150001, China
2
Harbin Energy Innovation Digital Technology Co., Ltd., Digital Innovation Research Institute, Harbin 150028, China
3
Heilongjiang Power Generation Equipment Intelligent Manufacturing Innovation Center, Harbin 150028, China
4
Shi-Changxu Innovation Center for Advanced Materials, Institute of Metal Research, Chinese Academy of Sciences, Shenyang 110016, China
*
Author to whom correspondence should be addressed.
Metals 2023, 13(7), 1210; https://doi.org/10.3390/met13071210
Submission received: 6 June 2023 / Revised: 23 June 2023 / Accepted: 27 June 2023 / Published: 29 June 2023
(This article belongs to the Special Issue Fatigue, Fracture and Damage of Steels)

Abstract

:
As one of the widely used materials for hydro turbine runners, 13Cr4Ni martensitic stainless steels (13/4 MSS) manufactured by forging and wire arc additive manufacturing (WAAM), respectively, were selected for high-cycle fatigue tests, and the effects of microstructures and defect characteristics on fatigue mechanism were investigated. The results indicate that compared to the forged 13/4 MSS, the microstructure of the WAAM test piece is very fine, and the martensite units, consequently, are smaller in size. The yield strength and ultimate tensile strength are 685 MPa and 823 MPa for the forged specimen and 850 MPa and 927 MPa for the WAAM specimens, respectively. The fatigue strength of 107 cycles at room temperature is 370 MPa for forged specimens and 468 MPa for WAAM specimens. The predominant defect of the forged 13/4 MSS specimen is inclusion, and the fatigue initiates mainly at the surface and subsurface. While for the WAAM specimen, the most commonly found defects are pores, and the fatigue initiation is internal and at the subsurface. In addition, the fine microstructure, as well as the high strength and hardness, enable the WAAM material to have higher fatigue strength. In order to assess the effect of defects on fatigue performance, the stress intensity factor and El-Haddad model were adopted in the present study. It was found that the forged specimens with fish-eye (FIE) zones and the WAAM specimens with granular bright facet (GBF) zones have longer fatigue life. The fatigue strengths of the forged 13/4 MSS were therefore predicted by defect size. In contrast, the fatigue strengths of the WAAM 13/4 MSS were predicted by both defect and GBF sizes.

1. Introduction

Runners are one of the core components of Pelton hydraulic power generation units and are subject to intermittent impacts from high-speed water jets during high-speed rotation. As a result, high-cycle fatigue (HCF) damage could occur at the bucket root, which could seriously deteriorate the service life [1,2,3]. With the increases in water heads, it is essential to study the HCF properties of runners. Because of its high resistance against corrosion and cavitation erosion, as well as its high strength, low-temperature ductility, and toughness, low-carbon 13Cr4Ni martensitic stainless steel (13/4 MSS) has been widely used to manufacture hydro turbine runners [4,5,6]. Extensive explorations have been conducted by researchers on microstructures, mechanical properties, corrosion resistance, and fatigue properties of cast and welded 13/4 MSS material [7,8,9].
In recent years, with the advancement of additive manufacturing (AM) technology, a substantial amount of effort has been spent on using the wire arc additive manufacturing (WAAM) process for manufacturing runners, with the goal of lowering the dependency on forging size, reduce cost, and increase efficiency [10,11]. In particular, the present researchers made the first WAAM Pelton turbine runner in China [12].
However, because of their unique microstructures, the mechanical properties and damage mechanism of the WAAM 13/4 MSS specimens are different from that of conventionally forged ones. In order to further the application of AM technology in runner manufacturing, it is therefore of practical importance to perform a comprehensive investigation of the HCF properties of the WAAM 13/4 MSS. However, the fact is that even though many studies have been conducted on WAAM in recent years, most of them focused on mechanical properties, with the fatigue properties not fully investigated.
As far as WAAM of stainless steel is concerned, such as H13-8Mo MSS [13], PH17-4 [14], and MMS 308L SS [15,16], extensive investigations on the influence of the manufacturing process of WAAM on microstructures and mechanical properties have been carried out in recent years. The main focus was placed on the clarification of the structure–property characteristics of these materials. With regard to the fatigue properties, some researchers have concluded that the commonly found defects in WAAM, i.e., inherited porosity, lack of fusion, and impurities, are detrimental to the fatigue properties [17,18,19,20]. Hence, efforts have been devoted to generating a relationship between fatigue strength and defect size in AM materials. Kitagawa and Takahashi [21] proposed the concepts of stress intensity factor and critical short crack size, and based on that, El Haddad [22] derived a mathematical model that could be used to describe the relationship between fatigue strength and short crack size. It was reported by Murakami [23] that the effect of defects on fatigue properties is similar to that of short cracks. Building upon this finding, Beretta et al. [24,25] replaced the short crack size with a small defect size in the El-Haddad model, with the goal of using the modified model to predict the performance of AM material. However, the influencing factors on the HCF properties of WAAM material are very complex, and not a single theory or model was able to elucidate their effects. To further the understanding of the contributing factors to fatigue performance and clarify the corresponding damage mechanism, the present study designed and conducted HCF tests on forged and WAAM 13/4 MSS at room temperatures, respectively.

2. Material and Testing Methods

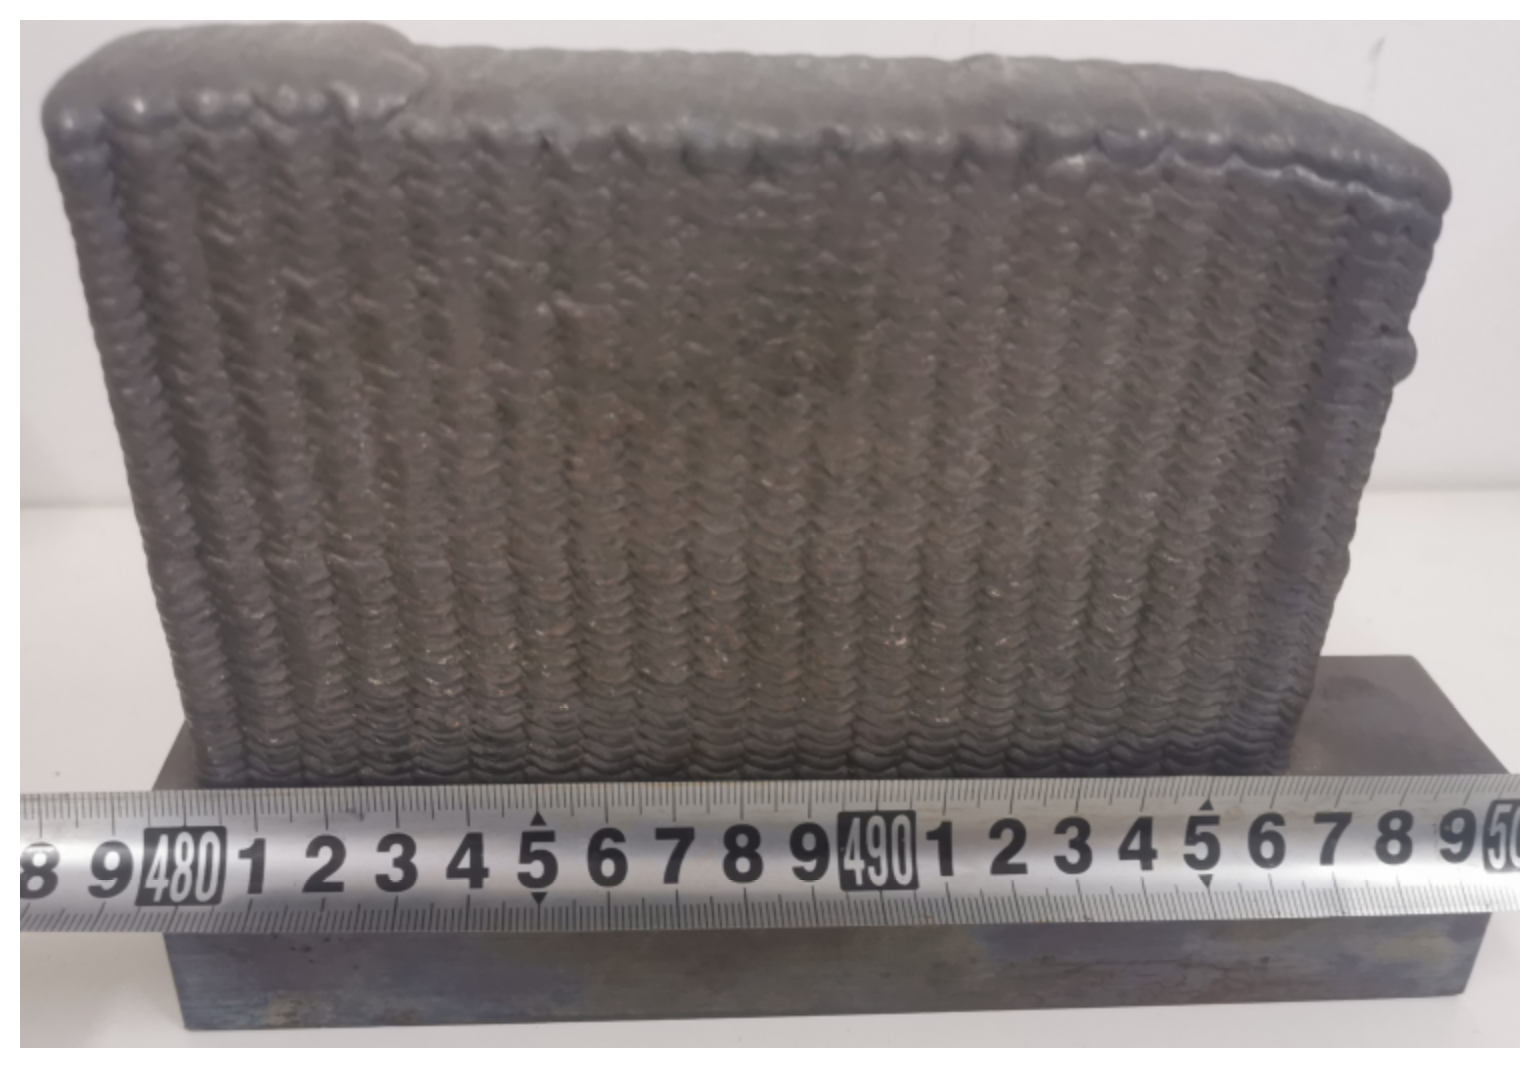
2.1. Material Preparation

Cold metal transfer (CMT) technology is characterized by low heat input, small deformation, and no spatter. Moreover, its wire feeding motion and droplet transfer process can be digitally coordinated with high controllability, which is very suitable for the WAAM process [26,27]. Its combined application with robots can perfectly achieve the additive manufacturing of metal components, and therefore, it has become one of the most important research focuses in WAAM in recent years [28,29,30]. In this work, a WAAM rectangular sample with dimensions of 200 × 150 × 30 mm was fabricated using a KUKA 6 DOF robot (KUKA AG, Augsburg, Germany) and an Fronius Trans Puls 2700 CMT welding machine (Fronius Intl. GmbH, Wels, Austria). The welding wire is ER410NiMo (Well Welding Co., Ltd., Harbin, China), with a diameter of 1.2 mm, which is the most commonly used welding filler material for runners. The shielding gas is composed of 98%Ar + 2%CO2. During the production, welding current of 120 A, voltage of 19.5 V, welding speed of 10 mm/s, layer thickness of 3.0 mm, and scanning distance of 2.5 mm were used. The rectangular sample was subjected to a post-welding heat treatment to relieve residual stresses. The heat treatment process is as follows: 580 °C × 2 h/furnace cooling to 300 °C, followed by air-cooling to ambient temperature. WAAM test piece after heat treatment is shown in Figure 1, and the forged material is taken from the forging blank of Pelton turbine runner. Table 1 summarizes the chemical compositions of the welding filler metal, the forged material, and the WAAM rectangular samples.

2.2. Microstructure Characterization

Metallographic specimens were taken from the rectangular samples and were ground starting with 80 grit sandpaper to 2000 grit, followed by mechanical polishing using a diamond suspension of 2.5 μm in preparation for the optical microscopy and electron backscatter diffraction (EBSD) analysis. For optical microscopy, the samples were etched using a solution (5 g FeCl3 + 4 mL HCl + 20 mL distilled water) at room temperature. For EBSD analysis, the samples were electropolished for 1 min at 12.5 V in a 10% perchloric acid alcohol solution at 10 °C. The optical microscopy and EBSD analysis were performed using a Zeiss Axio microscope (Carl Zeiss AG, Jena, Germany) and a Zeiss Sigma500 SEM (Carl Zeiss AG, Jena, Germany), respectively.

2.3. Mechanical Properties and Fracture Analysis

The specimens for tensile and fatigue tests were cut from the rectangular samples along the build direction (BD), with machined dimensions shown in Figure 2. The specimens were polished to achieve a surface roughness of less than 0.2 μm. Tensile tests were performed using a Shimadzu AG–I250 KN (Shimadzu Co., Kyoto, Japan) static testing machine. The uniaxial stress-controlled fatigue tests were performed using a P16F–10 high-frequency fatigue testing machine with a stress ratio R = −1 and a frequency of 110 Hz. Fractography was conducted using a Zeiss Sigma500 SEM after tensile and fatigue tests. Hardness was measured using a Shimadzu Vickers HMV–2 hardness tester (Shimadzu Co., Kyoto, Japan).

3. Experimental Results

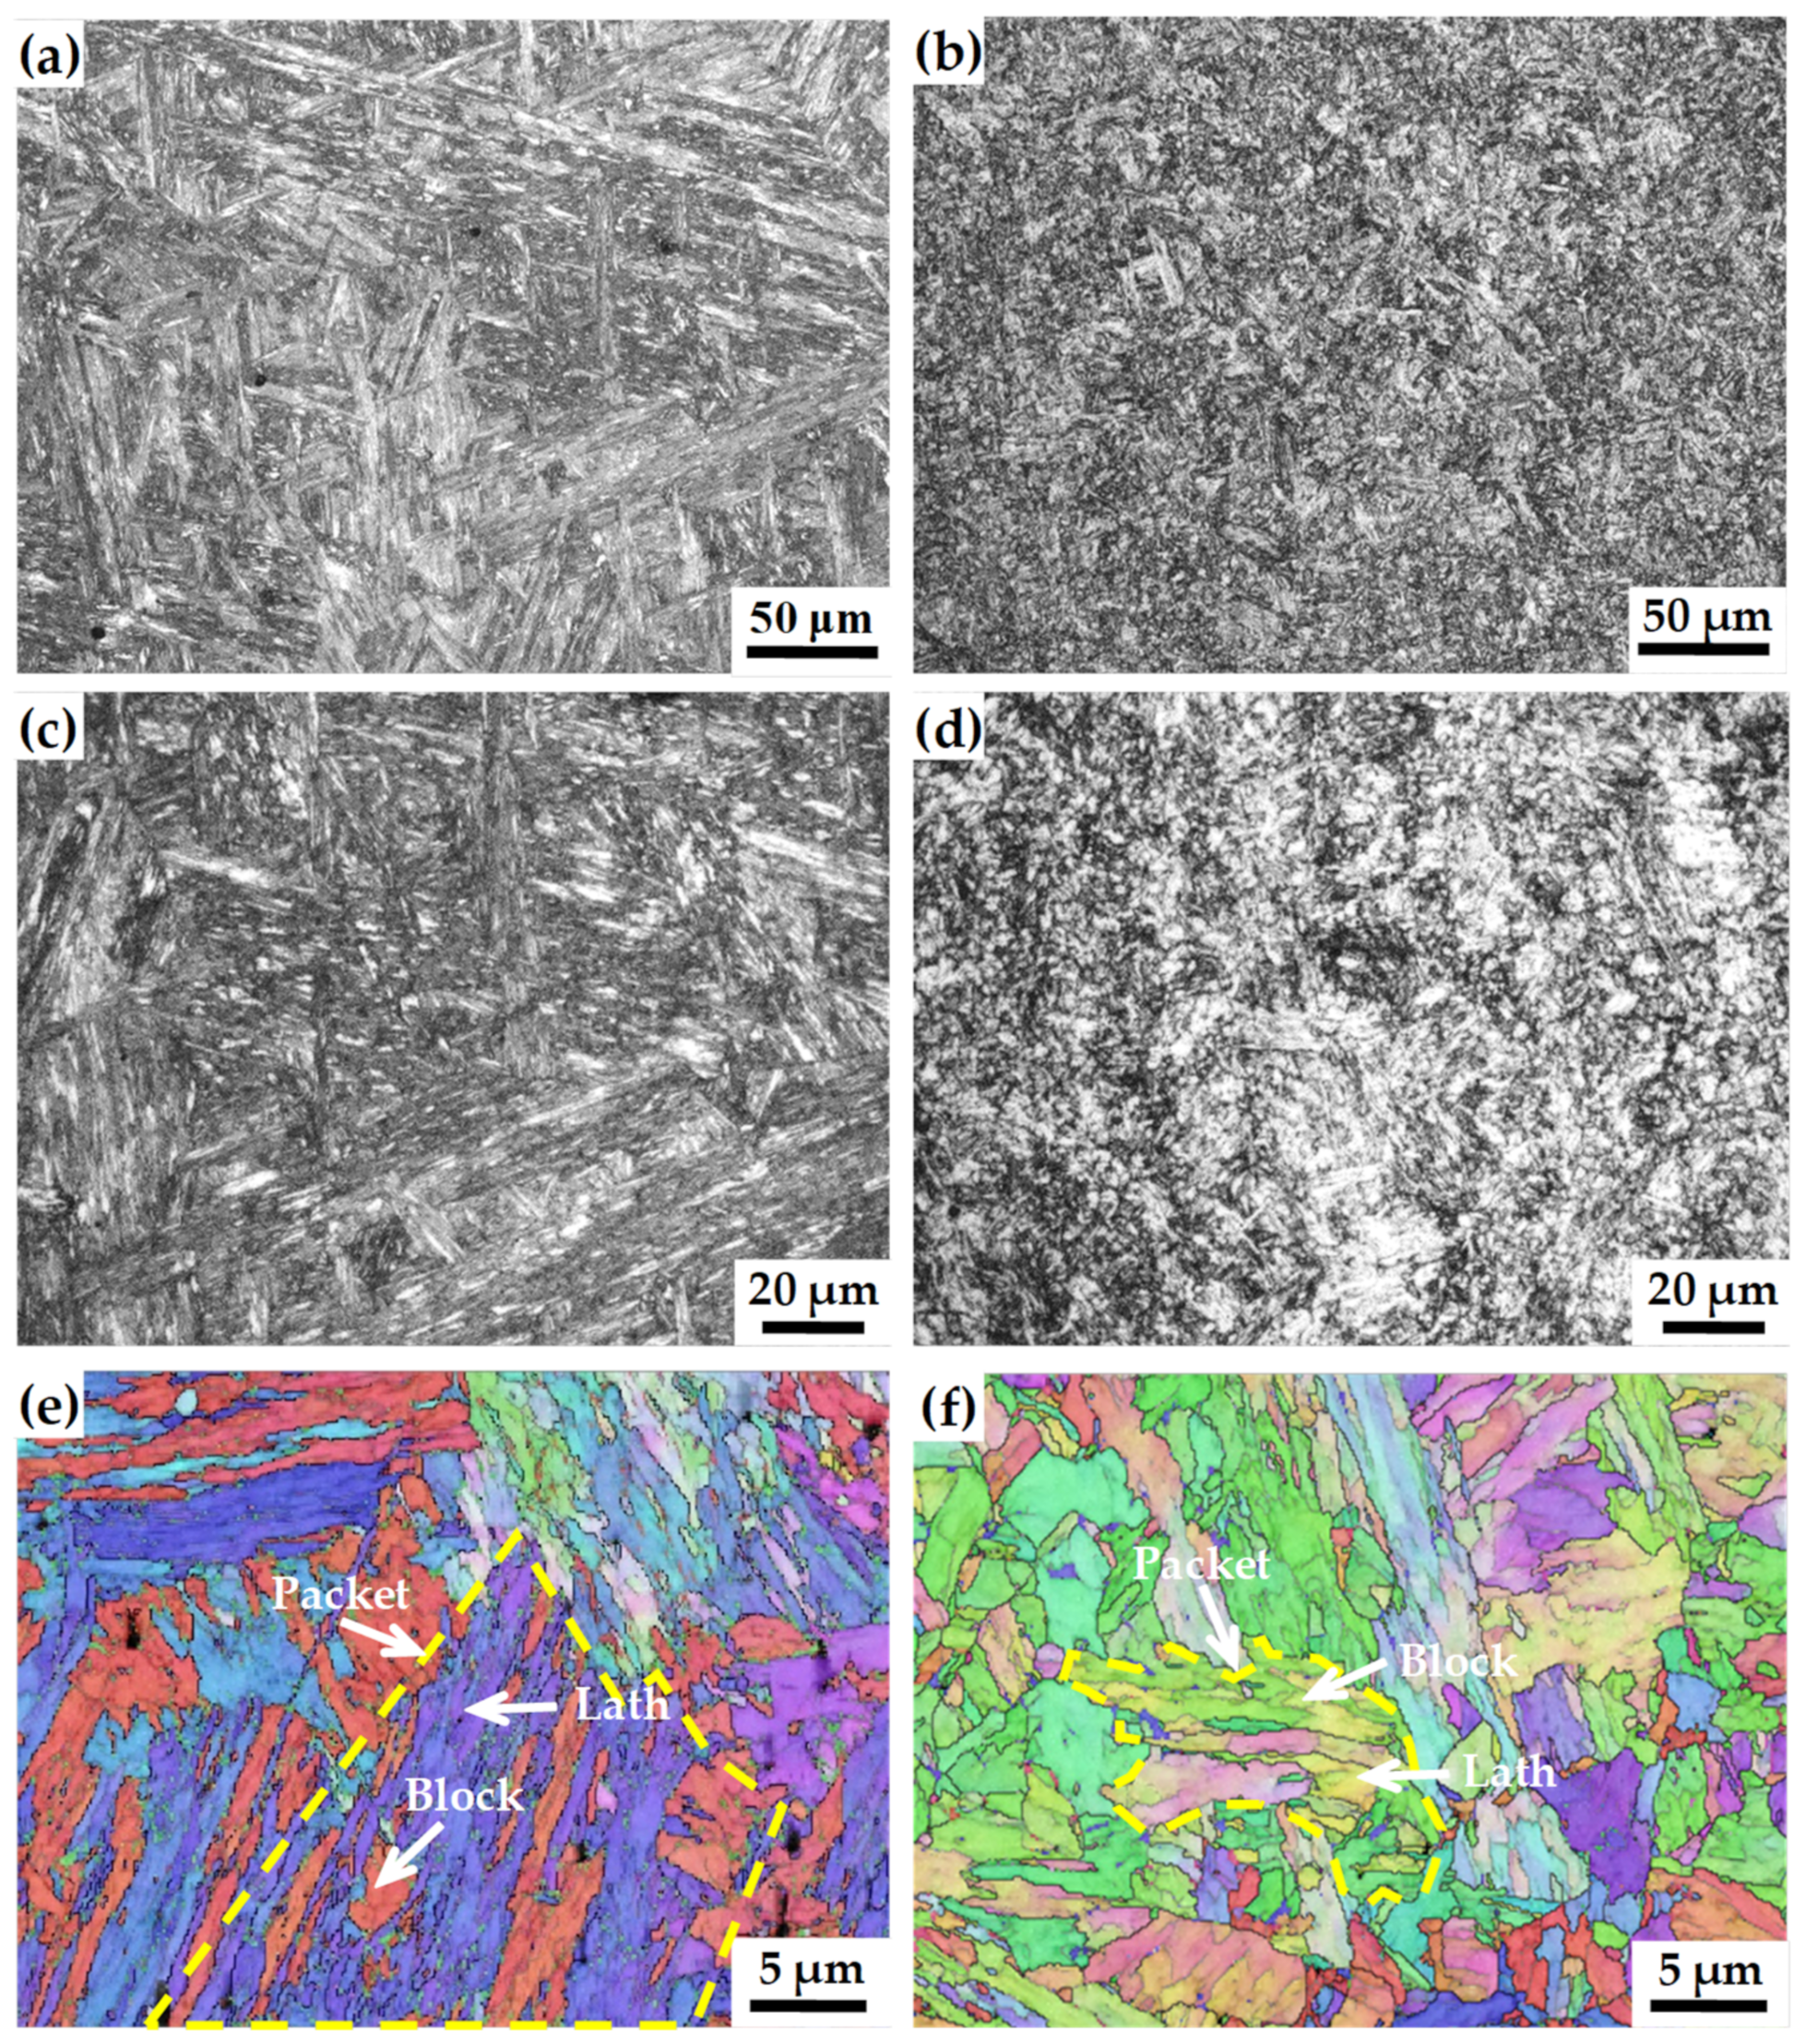
3.1. Microstructure Characterization

Figure 2 shows the typical microstructures of the forged and WAAM 13/4 MSS, which is predominantly martensite. Martensite is a typical phase in quenched low alloy steels and some stainless steels, and its structure can be characterized at different scales, including packets, blocks, and laths. A prior austenite grain consists of several martensite packets with the same habit plane, and each packet can be further divided into several martensite blocks, with each block containing multiple laths with the same orientation [31,32,33]. The microstructure of the forged 13/4 MSS is shown in Figure 3a,c, and there are a large number of martensite lath bundles with large sizes growing from the prior austenite grain boundaries into the grains. As shown in Figure 3e, packet, block, and lath martensite units can be clearly observed. Compared to the forged 13/4 MSS, the microstructure of the WAAM test piece (Figure 3b,d) is very fine, the original austenite grains and subgrain sizes are much smaller, and the martensite units consequently are smaller in size (Figure 3f). In addition, it is affected by the heat treatment. Therefore, the microstructure of the martensite units is not as clear as that of the forged 13/4 MSS. The packet area size is significantly smaller, it has a relatively large number of blocks, and the content of its block units is higher than that of the forged 13/4 MSS.

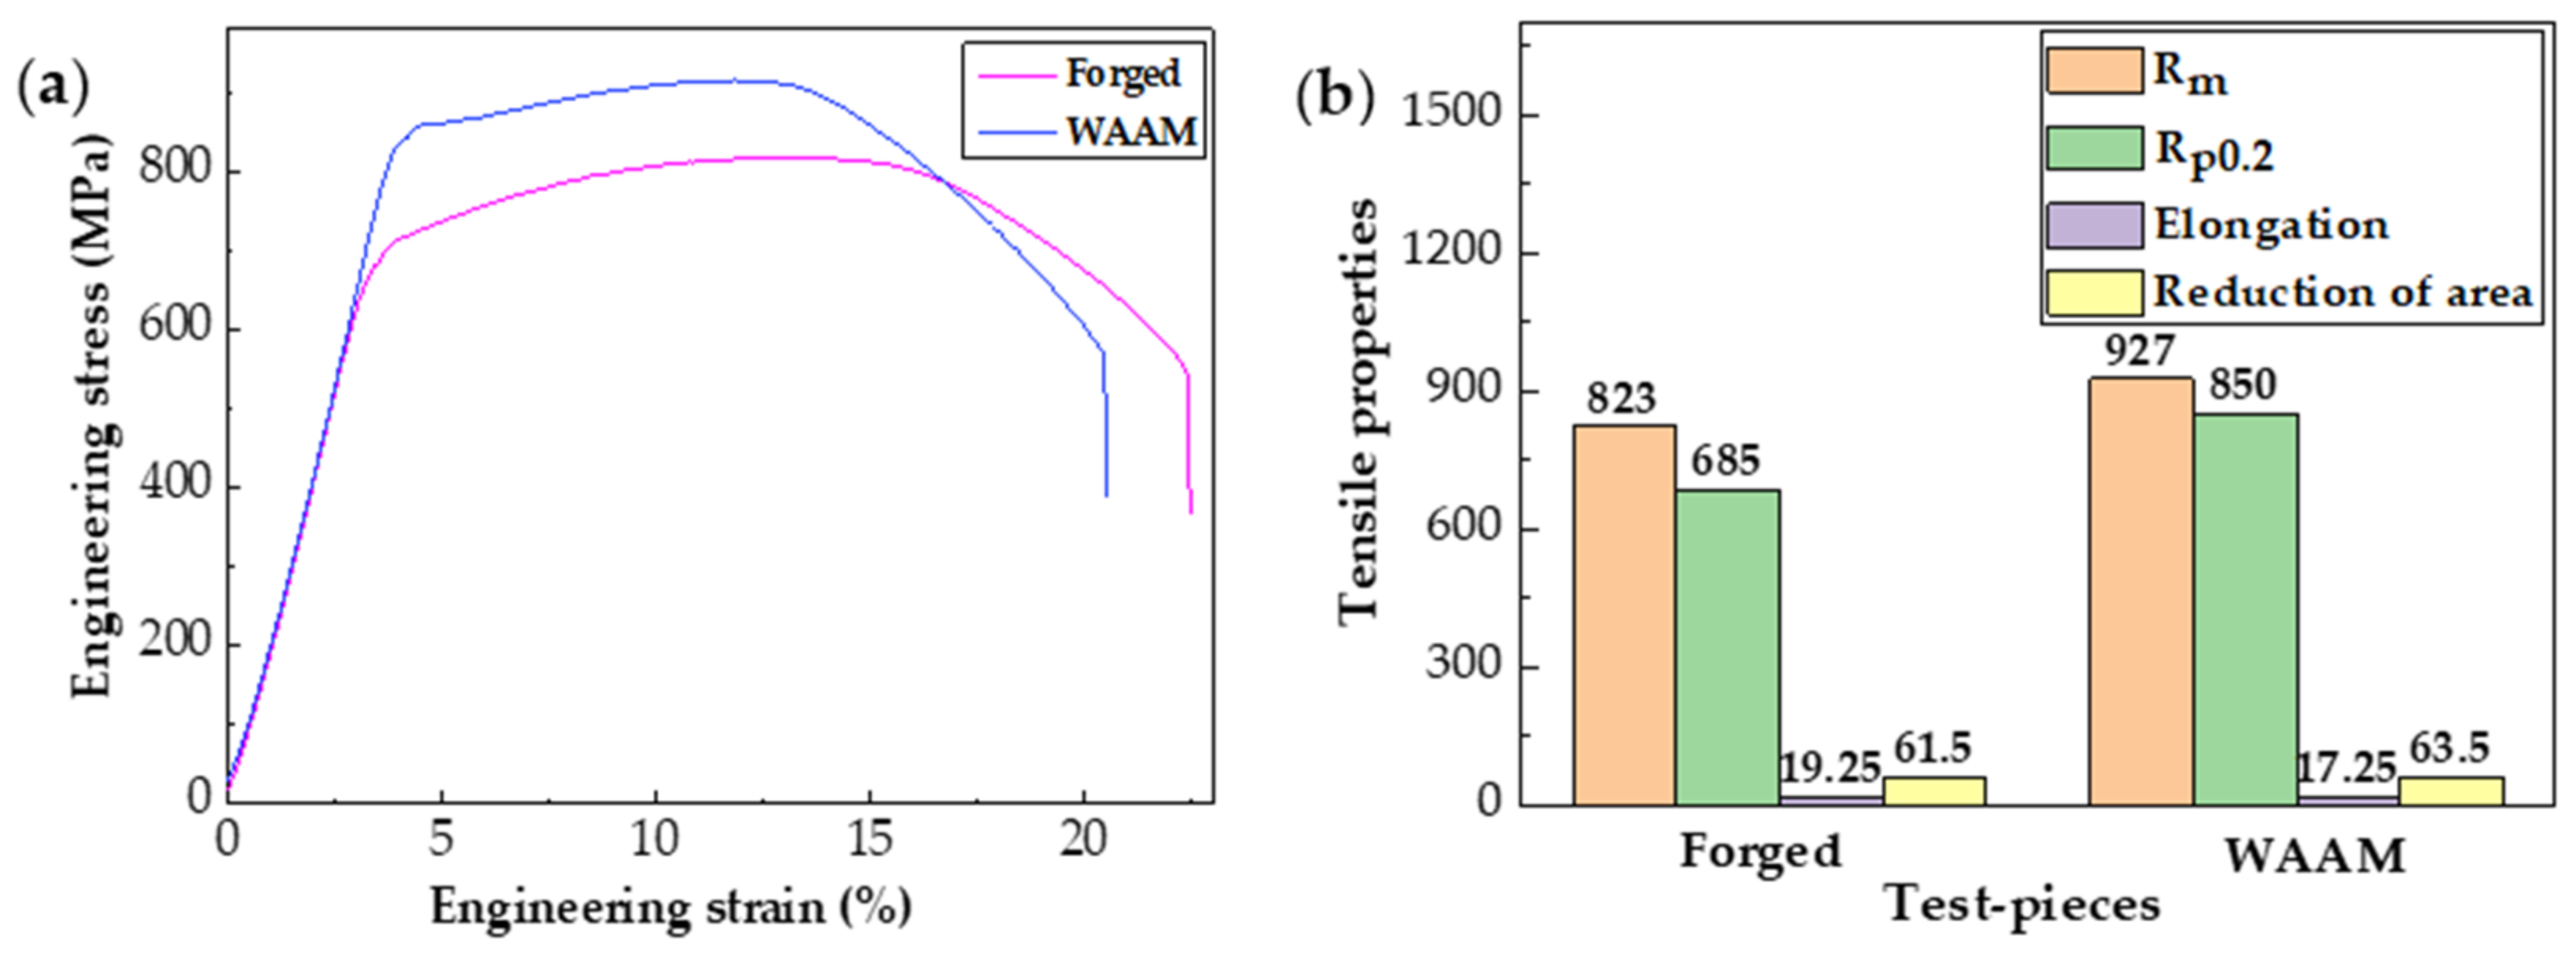
3.2. Tensile Properties and Fracture Analysis

The tensile stress–strain curves of the forged and the WAAM 13/4 MSS specimens are shown in Figure 4a. No distinct yield points can be observed on the two curves. The yield strength (Rp0.2) and ultimate tensile strength (Rm) are 685 and 823 MPa for the forged specimen, and 850 and 927 MPa for the WAAM specimens, respectively. The yield strength of WAAM specimens is about 160 MPa higher than that of the forged specimen. The strength difference is due to the variation in grain size. According to the Hall–Patch relationship, the yield strength of polycrystalline metals at room temperature increases with grain refining. Under the same applied stress, the probability of stress concentration caused by dislocation accumulation in large grains triggering plastic deformation in adjacent grains is much greater than that of the small grains. The stress to resist dislocation motion is high in small grains, so greater applied stress is required to initiate the plastic deformation of adjacent grains, i.e., the yield strength in WAAM specimens with fine microstructures is higher. As shown in Figure 4b, the elongation to fracture is 19.25% and 17.50%, and the reduction in area is 61.50% and 63.50% for the forged and WAAM specimens, respectively. It suggests that the fine microstructure has no significant influence on the plasticity of the two materials.
The tensile fracture surfaces of the forged and the WAAM specimens were analyzed using SEM. Figure 5a,b show the macroscopic fracture morphology. There is a narrow shear lip zone in the fracture, which primarily consists of a fibrous region (enclosed by the yellow dotted line) and radial region, with the former occupying a large proportion, indicating both materials have excellent plasticity. However, there is a significant difference in the roughness of the fibrous region and radial region. The roughness of the WAAM specimens is much smaller and smoother than that of the forged ones, which is determined by their finer grains. The red dotted rectangles are the enlarged positions of the fibrous regions. A substantial amount of tear ridges can be observed in the fibrous region, with observable traces of torsion and fracture of the lath bundle, as shown in Figure 5c,d. This is the result of the local plastic deformation and crack extension in the process of fracture. This plastic tearing will consume a great amount of plastic deformation work. Figure 5e shows the enlarged morphology of the fibrous region of the forged specimen, which is significantly different from the WAAM specimen (Figure 5f). There are dimples instead of tear ridges. For lath martensite with a coarse microstructure, its laths have a large length-to-width ratio. The rotation, bending, and sliding of lath martensite in the tensile cross layer can lead to the relaxation of interfacial stresses, thus improving the plastic deformation ability of the lath martensite [34].

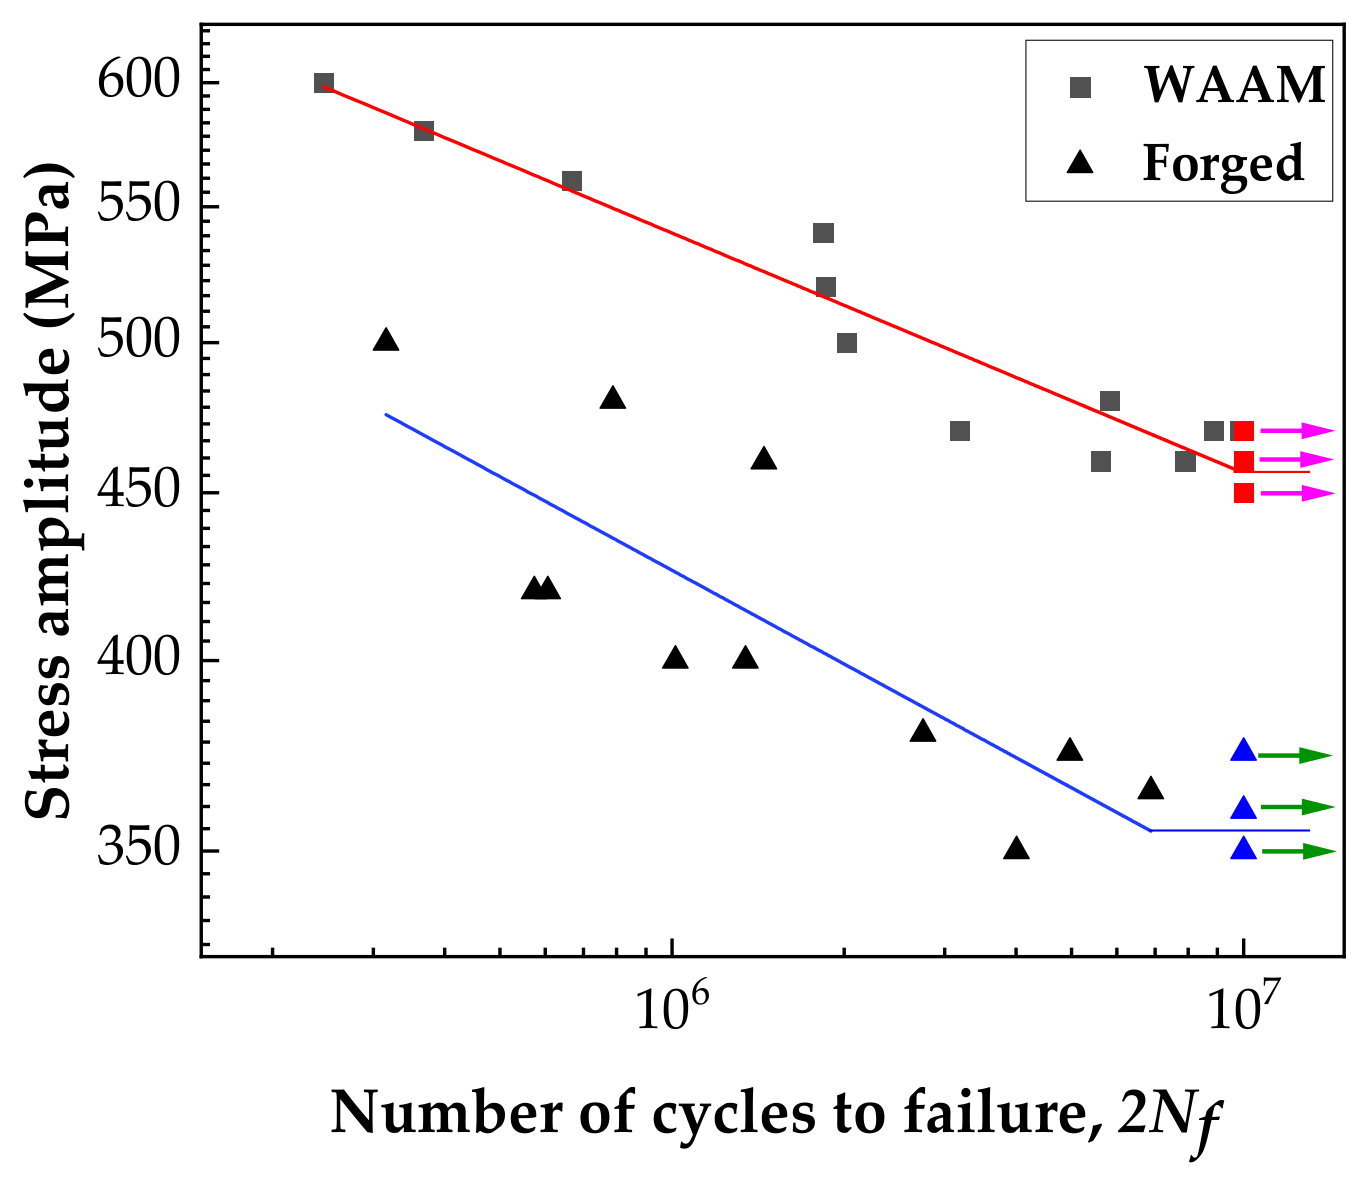
3.3. Fatigue Properties and Fracture Analysis

The S–N curve has been widely used to describe HCF behaviors and is illustrated by the Basquin equation:
σa = σf (2Nf)b
where σa is the stress amplitude; Nf is the number of cycles to failure; σ’f is the fatigue strength (FS) coefficient; and b is the FS exponent. In addition, the fitted results of the forged and the WAAM specimens are expressed as the following:
Forged: logσa = 3.20 − 0.095 log(2Nf)
WAAM: logσa = 3.17 − 0.073 log(2Nf)
The fatigue test data and the fitted results (Equations (2) and (3)) are shown in Figure 6. The blue and red lines represent the S-N curves obtained by fitting the fatigue data of forged steel and WAAM specimens, respectively. The staircase method was used to determine the fatigue strength [35]. The forged specimen’s fatigue strength is 370 MPa, and the WAAM specimen has a fatigue strength of 468 MPa, which is about 100 MPa greater than the former.
Figure 7 and Figure 8 show the SEM fractographs of the forged and the WAAM fatigue specimens. The fatigue fracture surfaces consist of a fatigue source (red dotted rectangle), a crack propagation region, and a final rupture region (the two are separated approximately by an orange dotted line). The fatigue source locations include the surface, subsurface, and internal. It was found in the present study that the equivalent sizes of most fatigue sources are smaller than 200 μm for the forged specimens and less than 100 μm for the WAAM specimens.
In this study, for forged specimens, subsurface initiation is defined when the shortest distance between the fatigue source and specimen surface is in the range of 0 to 200 μm. In addition, it is categorized as internal initiation when this distance is greater than 200 μm. While for the WAAM specimens, subsurface initiation occurs when the shortest distance is in the range of 0 to 100 μm. If it is greater than 100 μm, it is defined as internal initiation.
It can be seen in Figure 7 and Figure 8 that the forged and the WAAM specimens’ fatigue sources are different. It is shown in Figure 7a,c,e that most fatigue sources of the forged specimens are surface and subsurface defects, which are Al2O3 and broken metallic oxides formed during the forging process (Figure 7b,d,g). For the internal defects, the inclusions are Al2O3 and metallic oxides (Figure 7f,h) distributed in lines. There are fish-eye zones (FIEs) (enclosed by the yellow dotted line) around the internal defects, but there is no FIE around the surface and subsurface defects. Furthermore, no granular bright facets (GBFs) were observed in any specimen. The detailed fatigue testing results, i.e., crack initiation location, stress–life data, and type and size of defects, of the forged specimens are summarized in Table 2.
For WAAM specimens, the fatigue sources are subsurface and internal defects, which include lack of fusion (Figure 8e,f), silicate inclusion (Figure 8g–i), and pores (Figure 8a–d), with pores being the main defect. There is roughly circular FIE (enclosed by the yellow dotted line) around the pores and inclusions. Obvious GBF (enclosed by the blue dotted line) can be observed near the pores, but there is no GBF near the defects of lack of fusion and inclusions. In addition, the secondary cracks around pores and inclusion can be clearly observed. The detailed fatigue testing results, i.e., crack initiation location, stress–life data, type and size of defects, of the WAAM specimens are summarized in Table 3. The phenomenon of fatigue cracks occurring at defects will be further discussed in later section.

4. Discussion

4.1. Fatigue Cracking Mechanism of the Forged Specimens

The fatigue cracking mechanism of the forged specimens was studied. It was found that the primary factor affecting the HCF performance is the manufacturing defects. It is inevitable that many kinds of inclusions are present in the ingot due to metallurgical reactions and solidification in the ingot manufacturing process, and so some internal inclusions are common and are part of a steel ingot. Therefore, cracks originating from inclusions are one of the main factors causing the failure of heavy forgings [36].
Under the axial loading process, stress concentration exists around the inclusions, which causes fatigue cracks to nucleate preferentially at the inclusions. Considering those defects as short cracks, there are relationships between the stress intensity factor and the size of defects at different locations, as shown below [37]:
Internal:   K I = 0.5 σ 0 π a r e a
Subsurface and surface:   K I = 0.65 σ 0 π a r e a
where KI denotes the stress intensity factor, σ0, the maximum axial loading stress, and a r e a , the size of an area affected by defects. In Figure 9a, it can be seen that the data for subsurface and surface fatigue sources are distributed along a straight line, and the other two data points for internal fatigue sources deviate from the line rather obviously, which may be caused by using different expressions to calculate the KI (Equations (4) and (5)). Nevertheless, it can be concluded from Figure 9a that the stress intensity factor increases with the increase in defect areas. For the forged specimens, the maximum stress intensity factor is 6.15 MPa·m1/2 (σ0 = 375 MPa, a r e a Inc = 202.4 μm, and Nf = 298,000), and the average stress intensity factor is 4.84 MPa·m1/2.
The equation of the El–Haddad model [38] can be expressed as below. It provides a short crack equation to describe the relationship between the fatigue strength and the defect size, i.e., the Kitagawa–Takahashi diagram.
Δ σ w = Δ σ w 0 a r e a 0 a r e a + a r e a 0
when the defect is at the surface and subsurface
a r e a 0 = 1 π ( Δ K t h , l c 0.65 Δ σ w 0 ) 2
when the defect is internal
a r e a 0 = 1 π ( Δ K t h , l c 0.5 Δ σ w 0 ) 2
where Δσw is the fatigue strength; Δσw0 is the fatigue strength of the specimen without defects; a r e a 0 is the El-Haddad parameter, indicating the critical size where a short crack develops into a long crack; a r e a is the defect size; and ΔKth,lc is the crack growth threshold. For 13/4 MSS, the crack propagation threshold value is about 8.00 MPa·m1/2 at R = −1 [39]. For forged specimens, as the main defects are surface and subsurface inclusions, the relationship can be expressed as the following by substituting the fatigue strength (370 MPa) and average defect size (121.6 μm calculated by the data in Table 2) into Equations (6) and (7).
Δ σ w = 457 231 a r e a + 231
Figure 9b shows the details of this relationship, with the defect sizes (observed from fractographs) indicated by solid black and red dots. It shows that the fatigue strength of the forged specimens in the absence of defects is about 457 MPa, which can be predicted using the above relationship. It is reasonable that the fatigue strength decreases when the defect size increases.

4.2. Fatigue Cracking Mechanism of the WAAM Specimens

Like the forged specimens, the primary factor affecting the HCF performance of the WAAM specimens is also manufacturing defects. This is because during the manufacturing process, the weld quality may be unstable due to the complex mass and heat transfer, and as a result, pores, inclusions, and lack of fusion defects could form [40,41]. Considering those defects as short cracks and the main defects as pores in the internal specimens, the calculated KI by Equations (5) and (6) are shown in Figure 10a. It can be seen that two data points for subsurface and surface fatigue sources deviate from the fitted line. However, it is clearly shown that the stress intensity factor increases as the area of the defects increases.
For fine-grain specimens, the threshold value of crack propagation is about 4.00 MPa·m1/2 at R = −1 [34]. For WAAM specimens, as the main defect is the internal pores, the El-Haddad model relation can be expressed as the following by substituting the fatigue strength (468 MPa) and average defect size (45.7 μm, calculated by the data in Table 3) into Equations (6) and (8).
Δ σ w = 656 47 a r e a + 47
Figure 10b shows the details of this relationship, with the defect sizes (observed from fractographs) indicated by solid black and red dots. The fatigue strength of the WAAM specimens in the absence of defects is about 656 MPa, which can be predicted using the above relationship. The fatigue strength decreases with increasing defect size.
It has been found that the formation of GBF consumes the majority of the fatigue life [42]. Research has shown that the size of GBF positively affects the fatigue life, with larger sizes of GBF improving the fatigue life [43,44,45]. It has been reported that internal defects initially cause the formation of GBF in the very high cycle fatigue (VHCF) regime [46]. The present study correlates well with this finding, and shows that pores, as internal defects, are an important influencing factor in the initiation of fatigue cracks of the WAAM specimens. The GBF exists around the pores (Figure 8b,d) instead of around the defects of lack of fusion and inclusions (Figure 8f,h), which may be due to the excessive size of the defects. In the samples damaged by fatigue testing, the GBF zone formed around the pores at the subsurface is very small, as shown in Table 3.
Since the majority of the fatigue life is consumed by the formation of the GBF, by using the same method, the stress intensity factor amplitude calculation formula for the GBF area can be obtained as the following:
Internal :   K G B F = 0.5 σ 0 π a r e a G B F
Subsurface :   K G B F = 0.65 σ 0 π a r e a G B F
where KGBF is the stress intensity factor, σ0 is the maximum axial loading stress, and a r e a GBF is the size of the GBF zone affected. It can be seen from Figure 11a that the stress intensity factor increases with an increase in the GBF area. The maximum stress intensity factor is 4.82 MPa·m1/2 (σ0 = 470 MPa, a r e a GBF = 134 μm, and Nf = 8,794,000), and the average stress intensity factor is 4.01 MPa·m1/2.
Shown below is the equation of the El–Haddad model:
Δ σ w = Δ σ w 0 a r e a 0 G B F a r e a G B F + a r e a 0 G B F
And when the defect is internal,
a r e a 0 G B F = 1 π ( Δ K G B F 0.5 Δ σ w 0 ) 2
where Δσw denotes fatigue strength; Δσw0 denotes fatigue strength in the absence of defects; a r e a 0 GBF is El-Haddad parameter, indicating the critical size where a short crack develops into a long crack; a r e a GBF is the GBF size; and ΔKGBF is the crack propagation threshold value in the GBF region. For fine-grain MSS, ΔKGBF is about 5.00 MPa·m1/2 at R = −1 [34]. The relation can be expressed as follows by substituting the fatigue strength (468 MPa) and average GBF size (106.9 μm calculated by the data in Table 3) into Equations (13) and (14).
Δ σ w = 643 77 a r e a G B F + 77
Figure 11b shows the details of this relationship, with the GBF sizes observed from fractographs indicated by the solid black and red dots. The fatigue strength of the WAAM specimens in the absence of defects is approximately 643 MPa, which could be predicted using the above relationship. The fatigue strength decreases with increasing the GBF size.

4.3. Analysis of Fatigue Strength

With consideration of microstructures, the austenite of WAAM specimens is featured by smaller grain and sub-grain sizes compared with forged specimens, as mentioned above. Zhao et al. [33] suggested that the finer subgrains were favorable for stronger fatigue properties.
With regard to mechanical properties, a general relation between fatigue strength and tensile strength (hardness) has been proposed by Pang et al. [47,48], as shown below.
σw = (CPσb) × σb
where P and C are material constants, which are suitable for many traditional and newly developed materials after verification. For low carbon steel with lower strength, its fatigue strength is positively related to strength and hardness, i.e., the higher the tensile strength and hardness of the steel, the greater its fatigue strength. The tensile strength of the forged specimen is 823 MPa, which is lower than that of the WAAM specimen (927 MPa). The hardness of the forged specimen is 280 HV, which is lower than that of the WAAM specimen (320 HV). For martensitic steel, the finer the grain size, the higher the fatigue strength [49]. Therefore, from the perspective of strength (hardness) and microstructure, WAAM specimens have higher fatigue strength.
Moreover, according to Relation (9) mentioned above, the fatigue strength increases with decreasing defect size [40,46]. The defect size of WAAM specimens (average size 45.7 μm) is much smaller than that of forged specimens (average size 121.6 μm). The combined effect of the above two factors results in a significantly higher fatigue strength for WAAM specimens than for forged ones.

5. Conclusions

(1)
Compared to the forged 13/4 MSS, the microstructure of the WAAM test piece is very fine, and the martensite units are consequently smaller in size. The yield strength and ultimate tensile strength are 685 MPa and 823 MPa for the forged specimen and 850 MPa and 927 MPa for the WAAM specimens, respectively;
(2)
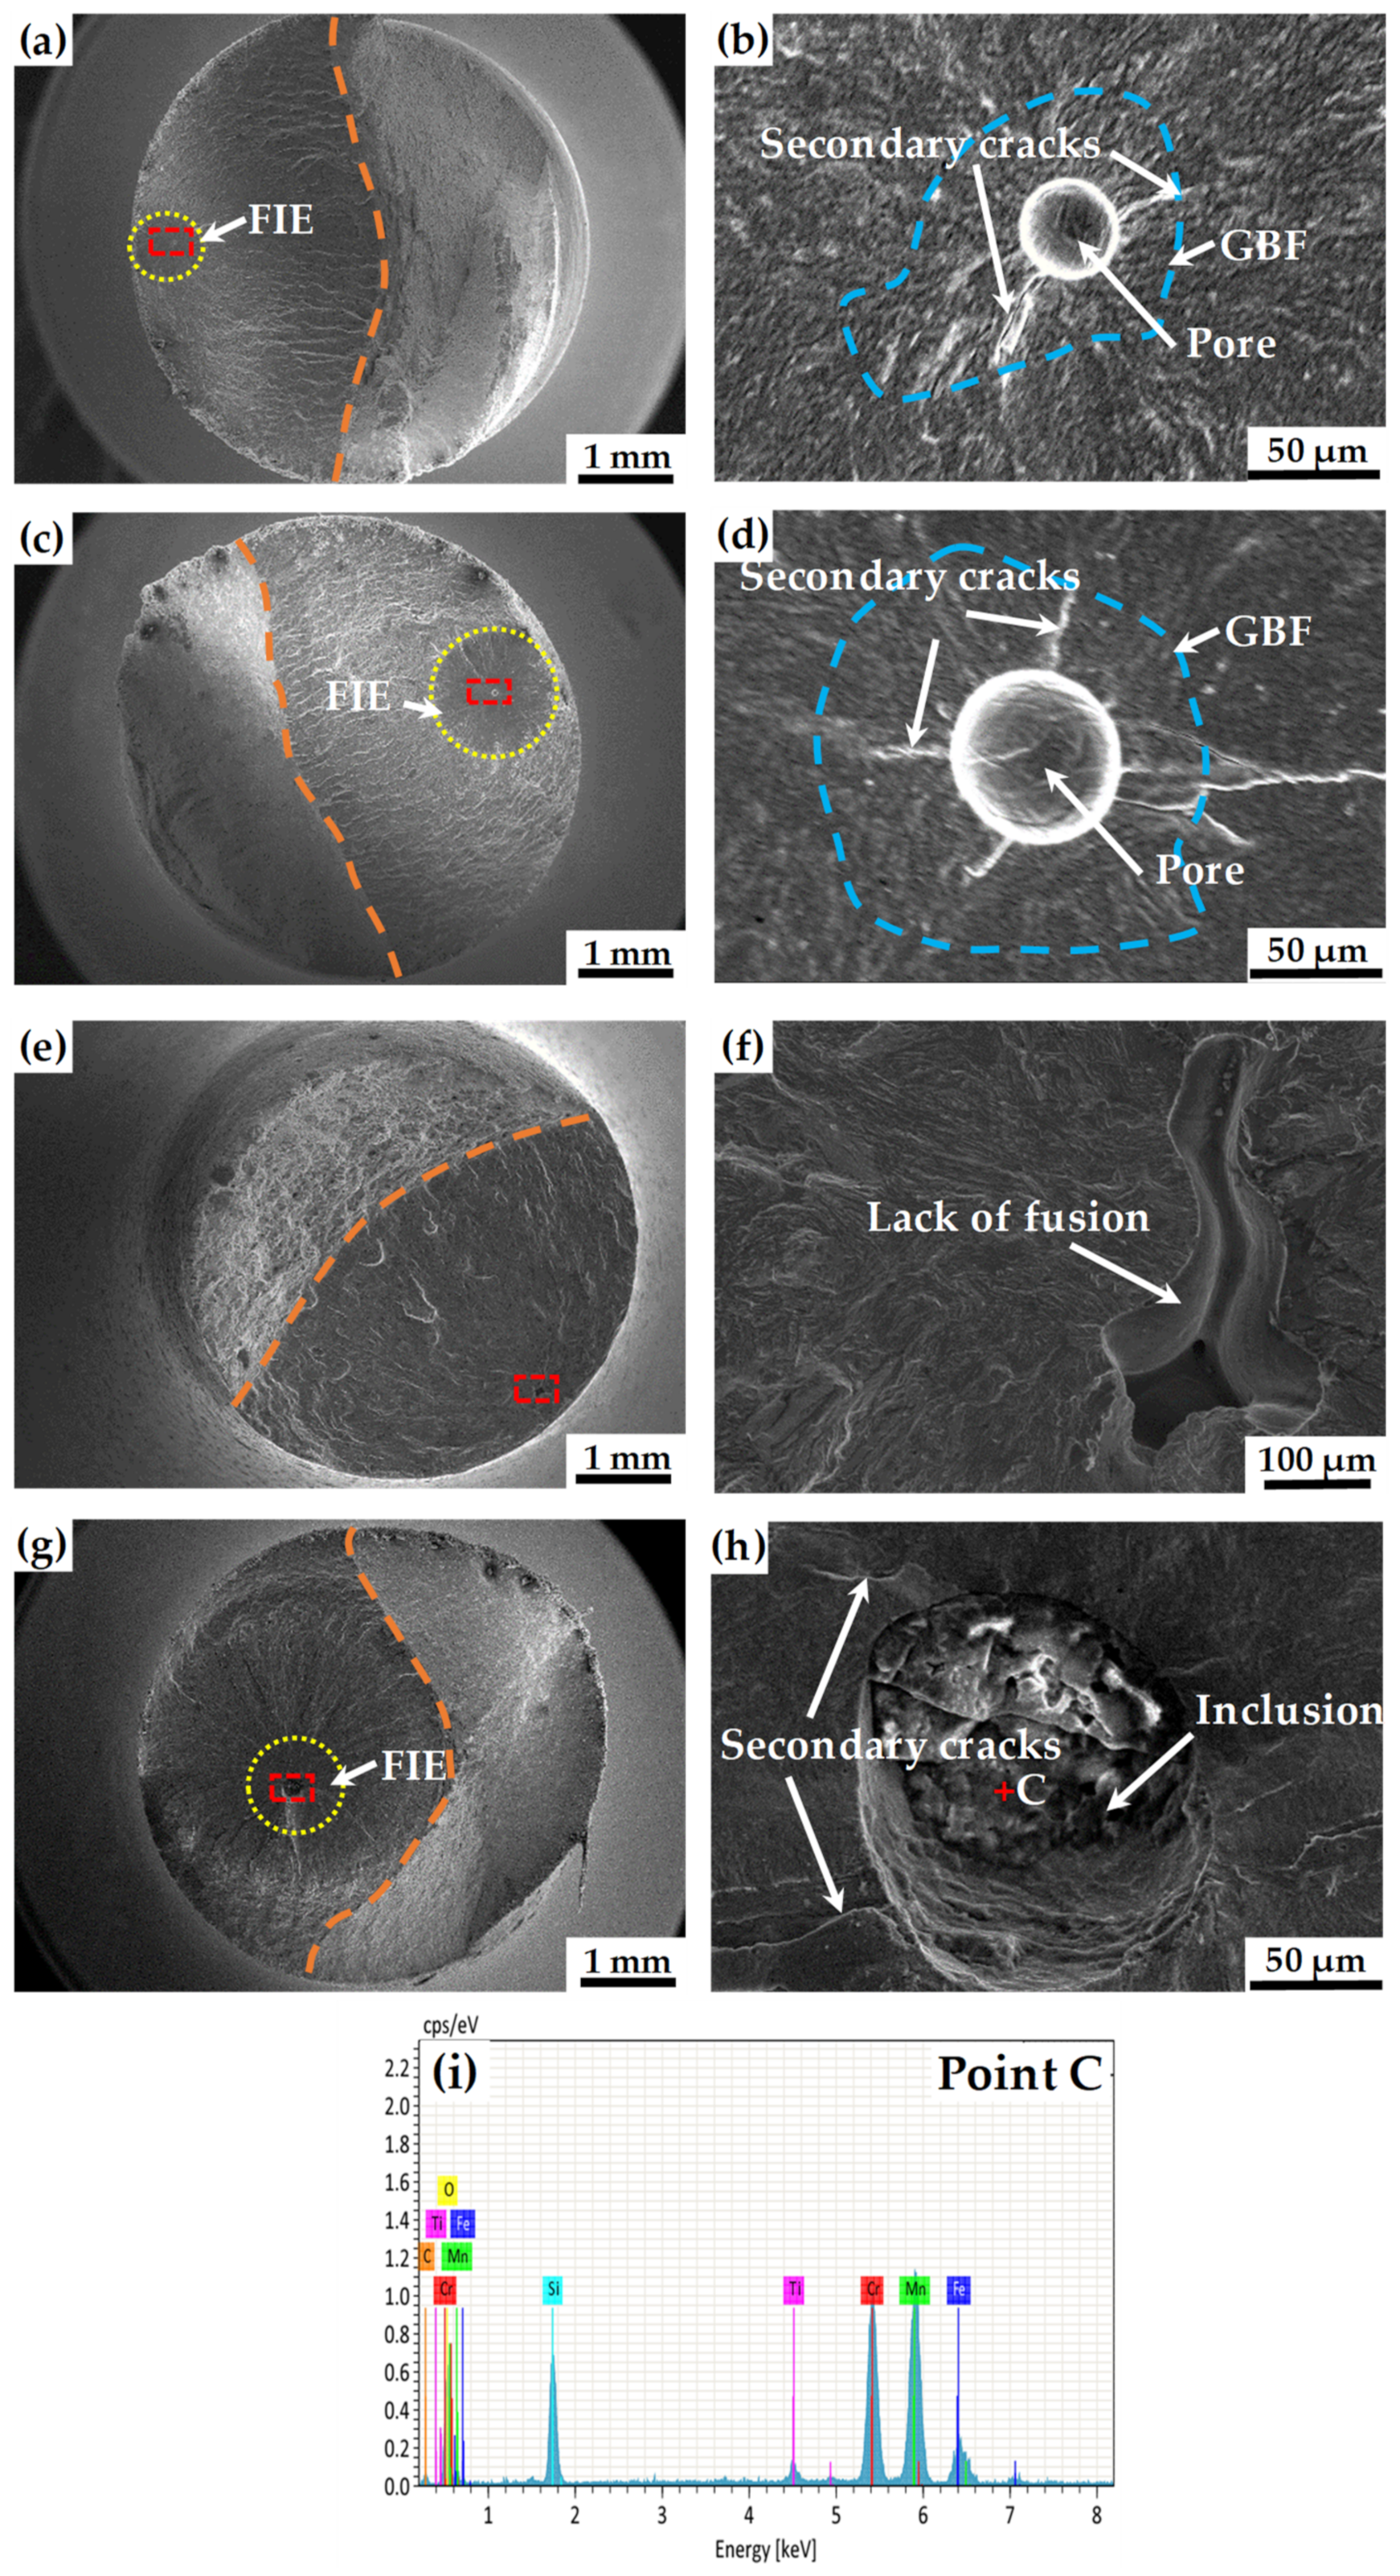
The fatigue strength of 107 cycles at room temperature for forged specimens is 370 MPa and 468 MPa for WAAM specimens. The fine microstructure, as well as the high strength and hardness, enable WAAM material to have higher fatigue strength. The majority of the fatigue sources of the forged ones are surface and subsurface defects, with most of them being inclusions. The majority of the fatigue sources of the WAAM ones are internal defects, with most of them being pores;
(3)
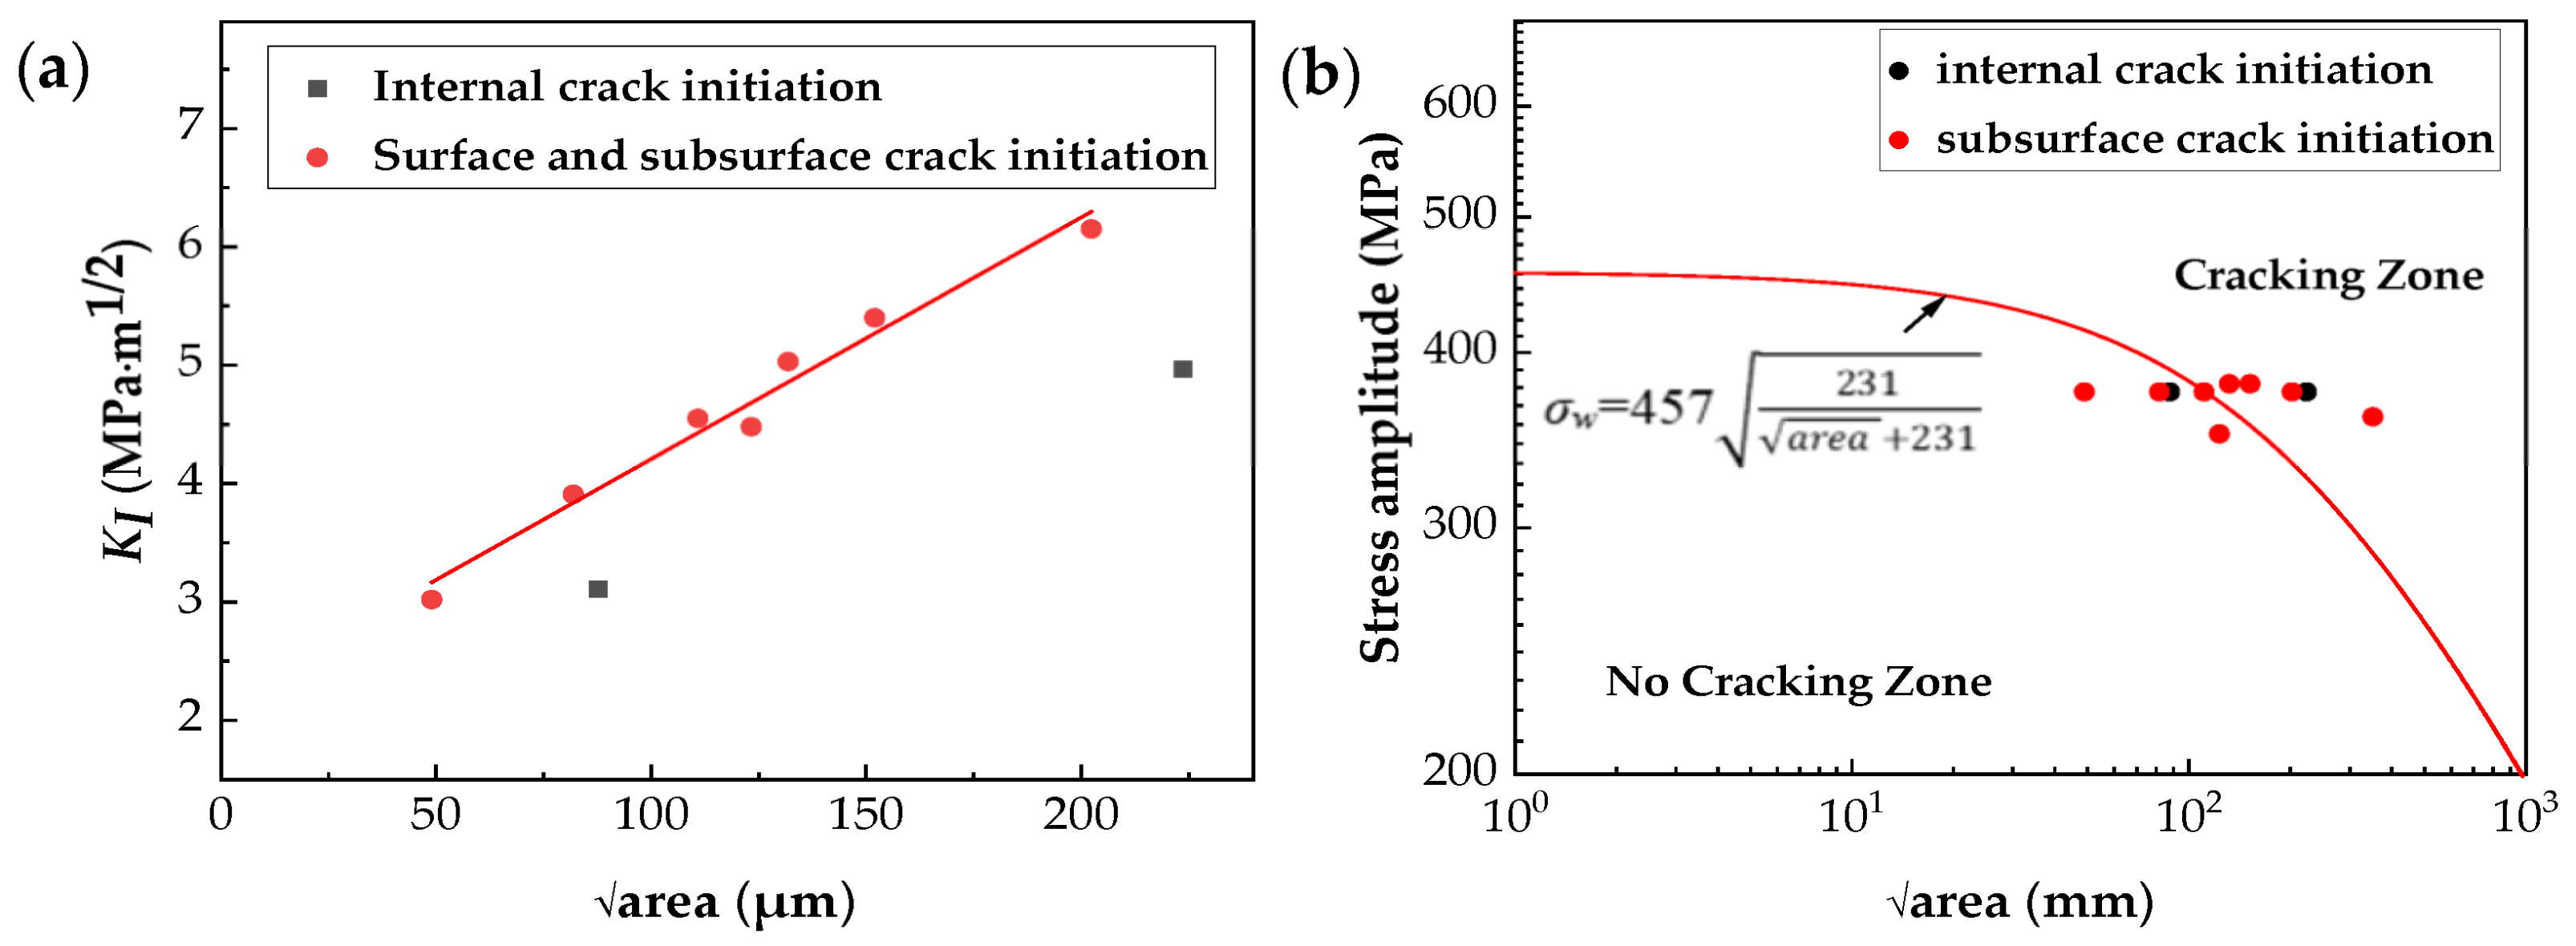
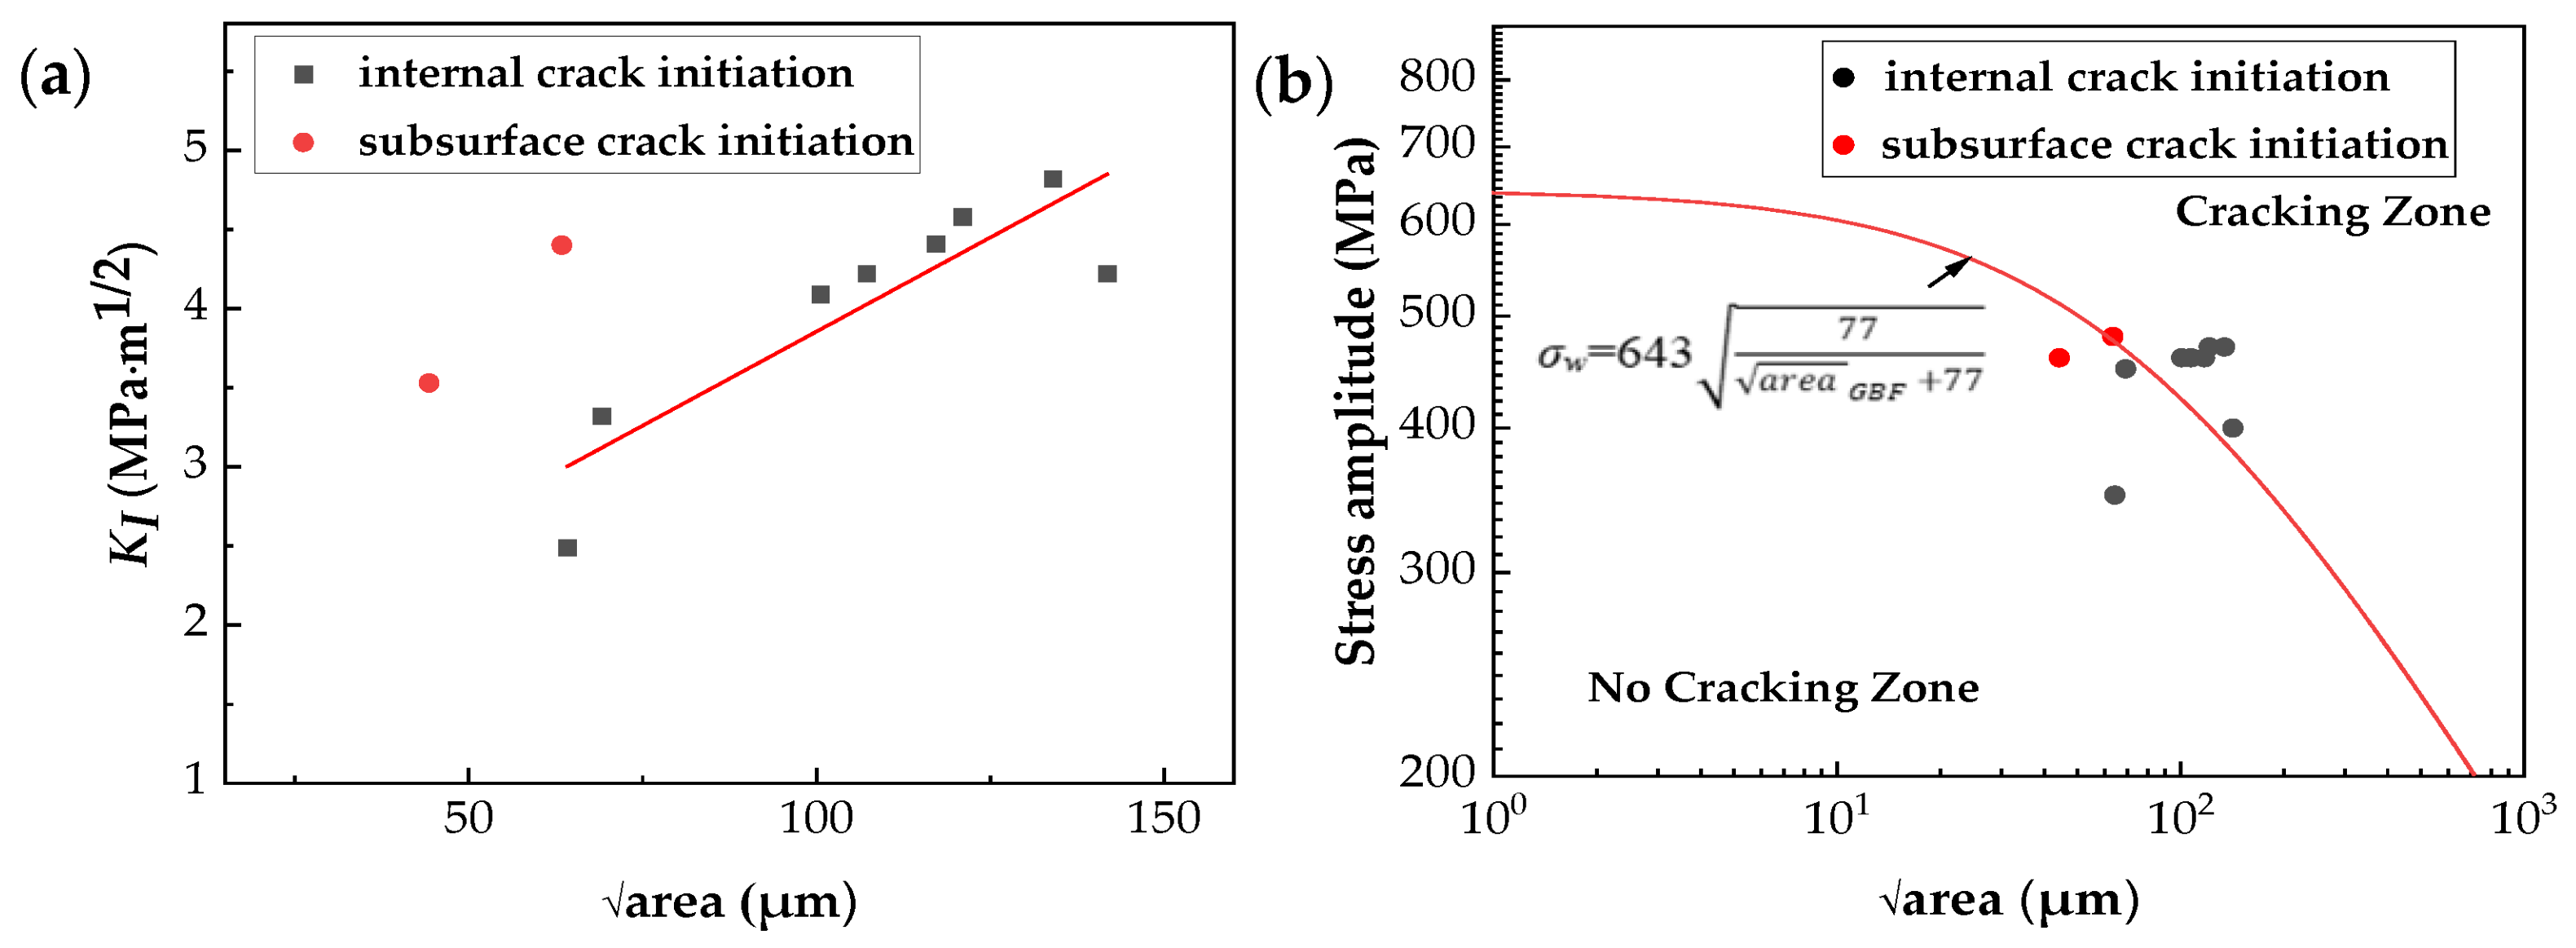
The fatigue strengths of the forged specimens with surface or subsurface inclusions are predicted by defect size, and the fatigue strengths of the WAAM ones with internal pores are predicted by defects and GBF sizes.

Author Contributions

Study design, H.G.; Test method, H.L. and H.G.; Data collection, G.C.; Data analysis, G.C. and H.D.; Making charts, G.C. and H.D.; Writing—First Draft, G.C. and J.P.; Article writing—review and editing, J.P., H.L. and G.C. All authors have read and agreed to the published version of the manuscript.

Funding

This research was funded by the National key research and development program of China (No. 2022YFC 3005903).

Data Availability Statement

Not applicable.

Acknowledgments

The authors would like to thank Gao C. from the Institute of Metal Research, Chinese Academy of Sciences, for his help with the SEM observations and Zhao P. from Harbin Electric Machinery Research Institute for his help with the fatigue experiment.

Conflicts of Interest

The authors declare no conflict of interest.

References

  1. Luo, X.; Zhu, G.; Feng, J. Progress and Development Trends of Hydraulic Turbine Technology. J. Hydroelectr. Power 2020, 39, 1–18. [Google Scholar]
  2. Gao, Z.; Feng, X.; Liu, S.; Gong, R.; Gao, H.; Wang, H.; Duan, W. Key technologies for large and medium-sized bucket water turbines. Large Electr. Mach. Hydraul. Turb. 2021, 63–68. [Google Scholar]
  3. Mack, R.; Probst, C. Evaluation of the dynamic behavior of a Pelton runner based on strain gauge measurements. In Proceedings of the 28th IAHR Symposium on Hydraulic Machinery and Systems, Grenoble, France, 4–8 July 2016. [Google Scholar]
  4. Foroozmehr, F.; Bocher, P. Effect of low temperature intercritical heat-treatment on stable crack growth behavior in 13%Cr-4%Ni martensitic stainless steel multipass weldments. Eng. Fract. Mech. 2020, 240, 107360. [Google Scholar] [CrossRef]
  5. Wang, P.; Lu, S.P.; Xiao, N.M.; Li, D.Z.; Li, Y.Y. Effect of delta ferrite on impact properties of low carbon 13Cr–4Ni martensitic stainless steel. Mater. Sci. Eng. A 2010, 527, 3210–3216. [Google Scholar] [CrossRef]
  6. Wang, C.; Ma, R.; Zhou, Y.; Liu, Y.; Daniel, E.F.; Li, X.; Wang, P.; Dong, J.; Ke, W. Effects of rare earth modifying inclusions on the pitting corrosion of 13Cr4Ni martensitic stainless steel. J. Mater. Sci. Technol. 2021, 93, 232–243. [Google Scholar] [CrossRef]
  7. Song, Y.; Ping, D.; Yin, F.; Li, X.Y.; Li, Y.Y. Microstructural evolution and low temperature impact toughness of a Fe–13%Cr–4% Ni–Mo martensitic stainless steel. Mater. Sci. Eng. A 2010, 527, 614–618. [Google Scholar] [CrossRef]
  8. Kishor, B.; Chaudhari, G.; Nath, S. Cavitation erosion of thermomechanically processed 13/4 martensitic stainless steel. Wear 2014, 319, 150–159. [Google Scholar] [CrossRef]
  9. Zhang, S.; Wang, P.; Li, D.; Li, Y. Investigation of the evolution of retained austenite in Fe–13%Cr–4%Ni martensitic stainless steel during intercritical tempering. Mater. Des. 2015, 84, 385–394. [Google Scholar] [CrossRef]
  10. Kalberer, A.; Krause, M. Review of experience with microcast Pelton wheels. Int. J. Hydropower Dams 1996, 3, 22–24. [Google Scholar]
  11. Hauser, H.; Riedel, A.; Keck, B. New technologies for high head Francis and pump runners. Int. J. Hydropower Dams 2007, 14, 89–93. [Google Scholar]
  12. China’s First Additive Manufacturing Pelton Turbine Real Runner Successfully Developed. Available online: https://news.sina.com.cn/o/2020-11-17/doc-iiznctke1939602.shtml (accessed on 17 November 2020).
  13. Ghaffari, M.; Nemani, A.; Nasiri, A. Microstructure and mechanical behavior of PH 13–8Mo martensitic stainless steel fabricated by wire arc additive manufacturing. Addit. Manuf. 2022, 49, 102374. [Google Scholar] [CrossRef]
  14. Caballero, A.; Ding, J.; Ganguly, S.; Williams, S. Wire + Arc Additive Manufacture of 17-4 PH stainless steel: Effect of different processing conditions on microstructure, hardness, and tensile strength. J. Mater. Process. Technol. 2019, 268, 54–62. [Google Scholar] [CrossRef]
  15. Bui, M.C.; Nguyen, T.D. On the connection of the heat input to the forming quality in wire-and-arc additive manufacturing of stainless steels. Vacuum 2023, 209, 111807. [Google Scholar]
  16. Van, T.; Dinh, S.; Paris, H. Influences of the compressed dry air-based active cooling on external and internal qualities of wire-arc additive manufactured thin-walled SS308L components. J. Manuf. Process 2021, 62, 18–27. [Google Scholar]
  17. Gordon, J.; Hochhalter, J.; Haden, C.; Harlow, D. Enhancement in fatigue performance of metastable austenitic stainless steel through directed energy deposition additive manufacturing. Mater. Des. 2019, 168, 107630. [Google Scholar] [CrossRef]
  18. Duraisamy, R.; Kumar, S.M.; Kannan, A.R.; Shanmugam, N.S.; Sankaranarayanasamy, K. Fatigue Behavior of Austenitic Stainless Steel 347 Fabricated via Wire Arc Additive Manufacturing. J. Mat. Eng. Perfom. 2021, 30, 6844–6850. [Google Scholar] [CrossRef]
  19. Ayan, Y.; Kahraman, N. Bending fatigue properties of structural steel fabricated through wire arc additive manufacturing (WAAM). Eng. Sci. Technol. Int. J. 2022, 35, 101247. [Google Scholar] [CrossRef]
  20. DebRoy, T.; Wei, H.L.; Zuback, J.S.; Mukherjee, T.; Elmer, J.W.; Milewski, J.O.; Beese, A.M.; Wilson-Heid, A.; De, A.; Zhang, W. Additive manufacturing of metallic components-Process, structure and properties. Prog Mater. Sci. 2018, 92, 112–224. [Google Scholar] [CrossRef]
  21. Kitagawa, H.; Takahashi, S. Application of Fracture Mechanics to Very Small Cracks or the Cracks in the Early Stage. In Proceedings of the Second International Conference on Mechanical Behaviour of Materials, Metro Parks, OH, USA, 16–20 August 1976; pp. 627–631. [Google Scholar]
  22. El Haddad, M.; Smith, K.; Topper, T. Fatigue crack propagation of short cracks. J. Eng. Mater. Technol. 1979, 101, 42–46. [Google Scholar] [CrossRef]
  23. Murakami, Y. Metal Fatigue, 2nd ed.; Academic Press: New York, NY, USA, 2019; pp. 341–406. [Google Scholar]
  24. Beretta, S.; Carboni, M.; Madia, M. Modelling of fatigue thresholds for small cracks in a mild steel by “Strip–Yield” model. Eng. Fract. Mech. 2009, 76, 1548–1561. [Google Scholar] [CrossRef]
  25. Beretta, S.; Romano, S. A comparison of fatigue strength sensitivity to defects for test-pieces manufactured by AM or traditional processes. Int. J. Fatig. 2017, 94, 178–191. [Google Scholar] [CrossRef]
  26. Azar, A.S. A heat source model for cold metal transfer (CMT) welding. J. Therm. Anal. Calorim. 2015, 122, 741–746. [Google Scholar] [CrossRef]
  27. Scotti, F.; Teixeira, F.; Silva, L. Thermal Management in WAAM through the CMT Advanced Process and an Active Cooling Technique. J. Manuf. Process 2020, 57, 23–35. [Google Scholar] [CrossRef]
  28. Nikam, P.; Arun, D.; Ramkumar, K.; Sivashanmugam, N. Microstructure characterization and tensile properties of CMT-based wire plus arc additive manufactured ER2594. Mater. Charact. 2020, 169, 110671. [Google Scholar] [CrossRef]
  29. González, J.; Rodríguez, I.; Prado-Cerqueira, J.L.; Diéguez, J.L.; Pereira, A. Additive manufacturing with GMAW welding and CMT technology. Procedia Manuf. 2017, 13, 840–847. [Google Scholar] [CrossRef]
  30. Selvi, S.; Vishvaksenan, A.; Rajasekar, E. Cold metal transfer (CMT) technology-an overview. Def. Technol. 2018, 14, 28–44. [Google Scholar] [CrossRef]
  31. Luo, H.; Wang, X.; Liu, Z.; Yang, Z. Influence of refined hierarchical martensitic microstructures on yield strength and impact toughness of ultra-high strength stainless steel. J. Mater. Sci. Technol. 2020, 51, 130–136. [Google Scholar] [CrossRef]
  32. Morsdorf, L.; Jeannin, O.; Barbier, D.; Mitsuhara, M.; Raabe, D.; Tasan, C.C. Multiple mechanisms of lath martensite plasticity. Acta Mater. 2016, 121, 202–214. [Google Scholar] [CrossRef]
  33. Zhao, P.; Xuan, F.; Wang, C. A physically-based model of cyclic responses for martensitic steels with the hierarchical lath structure under different loading modes. J. Mech. Phys. Solids 2019, 124, 555–576. [Google Scholar] [CrossRef]
  34. Yang, M.; Zhong, Y.; Liang, Y. Effect of Hierarchical Microstructures of Lath Martensite on the Transitional Behavior of Fatigue Crack Growth Rate. Met. Mater. Int. 2018, 24, 970–980. [Google Scholar] [CrossRef]
  35. Lee, Y.; Taylor, D. Fatigue Testing and Analysis-Stress-Based Fatigue Analysis and Design; Butterworth-Heinemann: Burlington, ON, Canada, 2005; pp. 103–180. [Google Scholar]
  36. Ma, Q.; Zhang, G.; Zhong, Y. Study on Mechanism of Defects Originated from Inclusions in Processes of Heavy Forgings. China Mech. Eng. 2001, 12, 943–945. [Google Scholar]
  37. Evans, S.; Wang, J.; Qin, J.; He, Y.; Shepherd, P.; Ding, J. A review of WAAM for steel construction-manufacturing, test-piece and geometric properties, design, and future directions. Structures 2022, 44, 1506–1522. [Google Scholar] [CrossRef]
  38. Li, W.B.; Pang, J.C.; Zhang, H.; Li, S.X.; Zhang, Z.F. The high-cycle fatigue properties of selective laser melted Inconel 718 at room and elevated temperatures. Mater. Sci. Eng. A 2022, 836, 142716. [Google Scholar] [CrossRef]
  39. Murakami, Y. Metal Fatigue-Stress Concentration; Elsevier Science Ltd.: Oxford, UK, 2019; pp. 11–24. [Google Scholar]
  40. Murakami, Y.; Nomoto, T.; Ueda, T.; Murakami, Y. On the mechanism of fatigue failure in the superlong life regime (N > 107 cycles). Part I: Influence of hydrogen trapped by inclusions. Fatigue Fract. Eng. Mater. Struct. 2010, 23, 893–902. [Google Scholar] [CrossRef]
  41. Tanaka, K.; Akiniwa, Y. Fatigue crack propagation behavior derived from S–N data in very high cycle regime. Fatigue Fract. Eng mater. Struct. 2010, 25, 775–784. [Google Scholar] [CrossRef]
  42. Wang, Q.Y.; Berard, J.Y.; Dubarre, A.; Baudry, G.; Rathery, S.; Bathias, C. Gigacycle fatigue of ferrous alloys. Fatigue Fract. Eng. Mater Struct. 2010, 22, 667–672. [Google Scholar] [CrossRef]
  43. Akiniwa, Y.; Miyamoto, N.; Tsuru, H.; Tanaka, K. Notch effect on fatigue strength reduction of bearing steel in the very high cycle regime. Int. J. Fatigue 2006, 28, 1555–1565. [Google Scholar] [CrossRef]
  44. He, X.; Wang, T.; Wu, K.; Liu, H. Automatic defects detection and classification of low carbon steel WAAM products using improved remanence/magneto-optical imaging and cost-sensitive convolutional neural network. Measurement 2021, 173, 108633. [Google Scholar] [CrossRef]
  45. Trudel, A.; Lévesque, M.; Brochu, M. Microstructural effects on the fatigue crack growth resistance of a stainless steel CA6NM weld. Eng. Fract. Mech. 2014, 115, 60–72. [Google Scholar] [CrossRef]
  46. Li, S. Effects of inclusions on very high cycle fatigue properties of high strength steels. Int. Mater. Rev. 2012, 57, 92–114. [Google Scholar] [CrossRef]
  47. Pang, J.; Li, S.; Wang, Z.; Zhang, Z. General relation between tensile strength and fatigue strength of metallic materials. Mater. Sci. Eng. A 2013, 564, 331–341. [Google Scholar] [CrossRef]
  48. Pang, J.; Li, S.; Wang, Z.; Zhang, Z. Relations between fatigue strength and other mechanical properties of metallic materials. Fatigue Fract. Eng Mater Struct. 2014, 37, 958–976. [Google Scholar] [CrossRef]
  49. Pang, J.C.; Yang, M.X.; Yang, G.; Wu, S.D.; Li, S.X.; Zhang, Z.F. Tensile and fatigue properties of ultrafine-grained low-carbon steel processed by equal channel angular pressing. Mater. Sci. Eng. A 2012, 553, 157. [Google Scholar] [CrossRef]
Figure 1. WAAM test piece after heat treatment.
Metals 13 01210 g001
Figure 2. Dimensions of tensile (a) and fatigue (b) specimens (mm).
Metals 13 01210 g002
Figure 3. (a,c) The microstructure of the forged steel; (b,d) the microstructure of the WAAM test piece; and (e) EBSD analysis of the forged steel. (f) EBSD analysis of the WAAM test piece.
Metals 13 01210 g003
Figure 4. (a) Tensile stress–strain curves; (b) tensile properties of the forged and the WAAM specimens.
Metals 13 01210 g004
Figure 5. The SEM fractographs of the forged (a,c,e) and the WAAM (b,d,f) tensile specimens.
Metals 13 01210 g005
Figure 6. S–N curves of the forged and the WAAM fatigue specimens.
Metals 13 01210 g006
Figure 7. The SEM fractographs of the forged fatigue specimens (a,b) σa = 380 MPa, Nf = 1395 × 103; (c,d) σa = 460 MPa, Nf = 724 × 103; and (e,f) σa = 375 MPa, Nf = 7935 × 103. (g,h) EDS analyses of the inclusions shown in (d) (point A) and (f) (point B), respectively.
Metals 13 01210 g007
Figure 8. The SEM fractographs of WAAM fatigue specimens (a,b) σa = 375 MPa, Nf = 7935 × 103; (c,d) σa = 470 MPa, Nf = 4925 × 103, (e,f) σa = 400 MPa, Nf = 8 × 10³; and (g,h) σa = 460 MPa, Nf = 3855 × 103. (i) Energy spectrum analysis (EDS) of inclusion (point C) shown in (h).
Metals 13 01210 g008
Figure 9. (a) The relationship between stress intensity factor and size of the inclusion defects (forged); (b) the relationship between fatigue strength and size of inclusion defects (forged).
Metals 13 01210 g009
Figure 10. (a) The relationship between stress intensity factor and defect size (WAAM); (b) the relationship between fatigue strength and defect size (WAAM) (most defects are pores).
Metals 13 01210 g010
Figure 11. (a) The relationship between stress intensity factor and the GBF size (WAAM); (b) the relationship between fatigue strength and the GBF size (WAAM).
Metals 13 01210 g011
Table 1. Chemical compositions of the welding filler metal, the forged material, and the WAAM sample (wt.%).
MaterialCMnSiCrNiMoCu
ER410NiMo0.0150.660.4412.804.290.490.088
Forged0.0540.540.4411.783.660.490.094
WAAM0.0210.570.4511.534.360.510.087
Table 2. Crack initiation location, stress–life data, and type and size of defects of the forged specimens.
Specimen No.σa
(MPa)
Nf × 103
(Cycle)
a r e a I n c
μm
FIE Yes/NoType of
Defect
Crack
Initiation
13757935223.6YesInclusionInternal
237510,39187.7YesInclusionInternal
33502003123.3NoInclusionSubsurface
43752403202.4YesInclusionSubsurface
53758881110.9NoInclusionSubsurface
6375889349.0NoInclusionSubsurface
73801395131.9NoInclusionSurface
83801392152NoInclusionSurface
9375248481.9NoInclusionSurface
Table 3. Crack initiation location, stress–life data, and type and size of defects of the WAAM specimens.
Specimen No.σa
(MPa)
Nf × 103
(Cycle)
a r e a P o r e
μm
a r e a G B F
μm
Defect TypeCrack
Initiation
1350291430.664.2PoreInternal
240074,63451.8141.8PoreInternal
345023,86629.169.1PoreInternal
4470879455.7134.0PoreInternal
5470444250.2121.0PoreInternal
6460385557.3117.2PoreInternal
746012,60047.1107.2PoreInternal
8460786543.9100.6PoreInternal
9460281727.544.3Poresubsurface
10480291626.763.4Poresubsurface
Disclaimer/Publisher’s Note: The statements, opinions and data contained in all publications are solely those of the individual author(s) and contributor(s) and not of MDPI and/or the editor(s). MDPI and/or the editor(s) disclaim responsibility for any injury to people or property resulting from any ideas, methods, instructions or products referred to in the content.

