Abstract
The photovoltaic industry generates large amounts of waste graphite (WG) that contains useful metals that can be recycled into high-value products. This study elucidated the impurity elements and their existence states in WG, analyzed and verified the source of the main impurity phase SiC, and determined the SiC content to be 4.66%. WG was purified using an alkaline-acid method, whose optimal process parameters were a solid alkali ratio of 3, calcination temperature of 600 °C, calcination time of 120 min, HCl concentration of 1 M, and acid leaching time of 40 min. Under these conditions, a graphite product with a fixed carbon content of 98.45% was obtained. Impurities were determined to migrate via three pathways: (1) Most main elements (Al, K, and Si) in silicates were removed by alkaline roasting, while the remaining elements were dissolved in acid. (2) Impurities containing metal elements such as Fe, Mg, Ca, and Zn were decomposed in NaOH to form hydroxides or oxides that were dissolved in HCl. (3) Silicon carbide impurities were removed by the alkaline-acid method without decomposition and often existed with graphite in the acid-leaching slag.
1. Introduction
Due to their chemical inertness, corrosion resistance, strength, and conductivity, graphite and graphite-derived materials are used in the chemical industry, portable electronics, aerospace, and metallurgy [1,2,3]. Due to the increasing application of graphite, it is inevitable to produce a large amount of graphite waste. Due to the excellent properties of carbon [4,5,6], graphite is used to manufacture key upstream equipment in the solar photovoltaic power generation industry chain [7,8,9]. Wu [10] pointed out that graphite products are necessary for the development of the photovoltaic industry. Improving the quality of graphite products and reducing the production cost is the key to greatly improve the photoelectric conversion efficiency of the photovoltaic industry [11,12,13,14]. The photoelectric conversion efficiency of solar cells largely depends on the purity of silicon wafers [15,16,17], which depends on the purification environment of the crystalline silicon-graphite crucible during purification. If the purity of graphite is low, the crystalline silicon drawing environment will become polluted, and the quality of the wafer cannot be guaranteed, which may diminish the efficiency of solar cells [18,19,20].
Graphite products play a key role in the development of photovoltaic technologies [21,22], including the manufacture of polysilicon raw materials, the drawing of monocrystalline silicon rods, and the casting of polysilicon ingots. Because graphite materials have excellent density, hardness, compressive strength, high-temperature resistance, high-pressure resistance, corrosion resistance, good electrical conductivity, and stable performance, they can be made into silica-graphite crucibles used during the purification of polysilicon and silicon rods [23,24,25,26,27]. Therefore, it is necessary to regenerate and purify waste graphite generated in the photovoltaic industry. Various methods have been used to accomplish this, including froth flotation, hydrometallurgy, pyrometallurgy, air elutriation, gravity separation, magnetic separation, electrostatic separation, microwave irradiation, carbochlorination, flushing processes, and electrochemical processes [28,29,30]. Among these, acid leaching is the most effective method for removing metal oxides and has been implemented in some industrial plants. For example, graphite products (a fixed carbon content (FC) of 99.0%) have been obtained from graphite flotation concentrate through an acid leaching method that removed Fe- and Al-bearing impurities. To realize a high impurity removal efficiency (RE), it is necessary to investigate the impurity removal mechanism beyond process parameter optimization [31,32,33]. Nevertheless, there have been few scientific investigations into uncovering the migration of common impurities in waste graphite powders [34].
In this study, the waste graphite from crucibles used for photovoltaic crystal pulling was first purified by an alkali-acid method, and the experimental parameters were optimized to develop the best purification process. The occurrence state of impurity elements and their decomposition mechanisms during purification were determined. The impurity migration mechanism can be extended to assist in the purification and reuse of other solid wastes.
2. Materials and Methods
2.1. Materials and Chemicals
In this study, WG was obtained from the waste graphite crucible used for photovoltaic single-crystal pulling. It was crushed and sieved to below 200 mesh and completely dehydrated before experiments. Deionized water was used in all experiments, and other reagents included hydrochloric acid (analytical purity from Cologne Chemicals LTD, Chengdu, China) and sodium hydroxide (analytical purity from Cologne Chemicals LTD).
The morphology and microstructure of the samples were observed by a field emission scanning electron microscope (FEI QUANTA 200, Waltham, MA, USA). Mastersizer (Winner 2008 A, Malvern Panalytical, Malvern, UK) was used to measure the particle size distribution of WG. The concentration of impurity elements was determined by inductively coupled plasma-atomic emission spectrometry (ICP-AES, OPTIMA 8000, PerkinElmer, Waltham, MA, USA). Phase analysis by X-ray diffractometer (PANalytical Empyrean Nano, Malvern, Malvern, UK). X-ray photoelectron spectroscopy (PHI5000 Versaprobe III, Tokyo, Japan) was used for structural analysis and chemical bond study. Fourier infrared spectrometer (Nicolet iS10, Thermo Fisher Scientific, Waltham, MA, USA) was used for functional group analysis. Impurity elements in the raw materials were determined by two different methods: the acid dissolution method and the alkali dissolution method. The acid dissolution method used a mixture of hydrochloric acid and nitric acid to dissolve metal impurities. The contents of Na2O and SiO2 were determined by alkali solution method at 320–340 °C. Finally, the impurity element contents measured by both methods were taken as the impurity element contents in the raw material.
2.2. Purification Methods of WG Powders
Purification procedures included alkali roasting, water washing, and acid leaching. First, a mixture of NaOH and raw material (10.0 g) was roasted in a laboratory muffle furnace for 3 h. Next, the roasted material was washed to neutrality (pH 7) with deionized water to remove soluble products and excess alkali agents. The filtrate was then collected and analyzed using ICP-OES and AAS, and the washed material was treated with HCl in a glass beaker for several hours to remove any remaining impurities. Finally, the acid-treated material was washed to pH 7 and dried. The filtrate was collected and analyzed using ICP-OES and AAS.
The mass of impurity in the filtrate was calculated using Equation (1):
where ci (g/mL) means the concentration of impurity i in the filtrate; v (mL) is the filtrate volume (mL); m0 (g) is the mass of raw materials used in each process; mi (g)is the mass of impurity i in the filtrate.
The impurity removal efficiency (RE) was calculated using Equation (2):
where mri (g) is the mass of impurity i removed from the alkali-acid method process; mti (g) represents the mass of impurity i in the waste graphite powder.
Figure 1 shows a flow chart of the alkali-acid experiment. The waste graphite powder and sodium hydroxide were mixed in a graphite boat and roasted in a furnace under the protection of argon. The obtained calcined slag was ground and crushed using an agate mortar to obtain the calcined product, which was then washed with water. The washed sample was filtered to obtain a water-washing solution and water-washing slag and finally subjected to acid-leaching treatment. After separating the acid-leaching solution and the acid-leaching residue, the sample treated by the alkali-acid method was obtained.
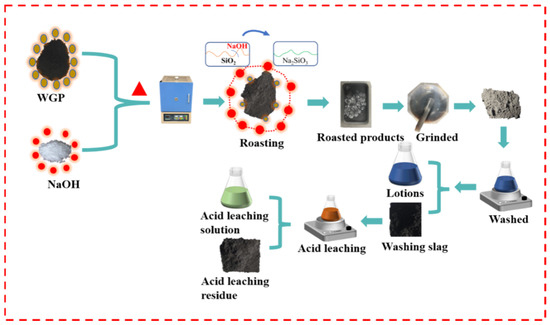
Figure 1.
Schematic diagram of the alkaline-acid method experimental process.
3. Results and discussion
3.1. Analysis of Impurity Element Contents and Occurrence State of Raw Materials
Chemical composition analysis of raw materials showed the presence of various metal impurity elements, whose contents are shown in Table 1. The raw materials contained metal impurities such as Al, Ca, Fe, Zn, Mg, Na, Ni, Si, and Ti. Due to the low content of impurity elements, it was impossible to determine the occurrence form of impurity elements through direct detection. Therefore, we analyzed the source of waste graphite first.

Table 1.
Chemical composition analysis of WG.
Coal analysis techniques were carried out for raw materials, and the results are shown in Table 2. Mad stands for moisture, and it was low, less than 0.1%, because WG was sufficiently dried prior to testing. Vad stands for volatile matter, which is mainly derived from organic impregnators used in isostatic pressing process, with a content of 0.88%. Aad stands for ash, with content up to 5.93%, and is mainly composed of various impurities. The waste graphite was initially used in the graphite crucible devices used in a monocrystalline silicon crystal drawing furnace. Since the monocrystalline silicon rod was sliced to produce solar cells in a later stage, the purity of the devices used in the furnace was very high. Some of the literature has shown that the graphite crucible used in single-crystal furnaces is isostatic graphite, which is obtained from petroleum coke/pitch coke/natural graphite and other raw materials through kneading, roasting, impregnation, and graphitization. Because the isostatic process is a physical process, the probability of introducing impurities is very low. Any foreign substances introduced during the impregnation process are usually organic substances, which will be decomposed and removed in the form of volatile substances during graphitization due to the high temperature. Some impurity elements in the ash will also be removed during the graphitization process. A literature review showed that the main impurities in natural graphite are aluminosilicates, particularly feldspar or mica minerals. In petroleum coke, silicon and aluminum primarily exist in sand in crude oil and enter petroleum coke during the coking process. The main components of sand are mica, feldspar, and quartz, so the elements of natural graphite and petroleum coke (Si, Al, Ca, Mg, and Na) come from the above minerals. Therefore, regardless of what is used as a raw material to prepare isostatic graphite, the above impurities will inevitably be introduced. The graphitization temperature is about 2500 °C, while the boiling point of aluminosilicates is about 2750 °C. Therefore, they cannot be completely removed when using only graphitization, resulting in some remaining impurities.
Table 2.
Analysis of a set of WG coal samples.
In the XRD pattern of waste graphite (Figure 2a), only peaks of C and SiC were observed, with no characteristic peaks of other impurity elements because their contents were lower than the XRD detection limit. Then, waste graphite was roasted in the air at 800 °C so that all the C escaped as CO2, which increased the proportion of impurity phases. The roasted ash was then analyzed by XRD (Figure 2b). In addition to SiC impurities in Figure 2a, there were also hematite and silica impurities. Semi-quantitative XRD analysis of waste graphite ash was conducted to roughly predict the proportion of each phase. The results showed that the ash contained 78.8% SiC impurities, 10.2% hematite, and 9.1% silica. Other impurity elements existed as feldspar or metal oxides from previously described sources.
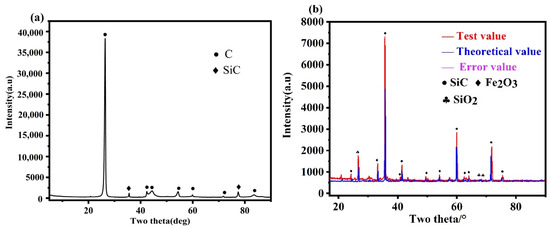
Figure 2.
XRD Analysis: (a) raw material XRD, (b) ash XRD.
The ash content of the waste graphite raw material was analyzed through SEM and EDS, as shown in Figure 3. Waste graphite contained various impurity phases, including feldspar, hematite, magnesium oxide, silicon dioxide, and silicon carbide. Analysis showed that feldspar, hematite, silicon dioxide, and other impurities were less homogeneously distributed and attached to impurity phases with silicon carbide as the main body. However, they were not embedded between each other and silicon carbide, so they were likely easier to remove.
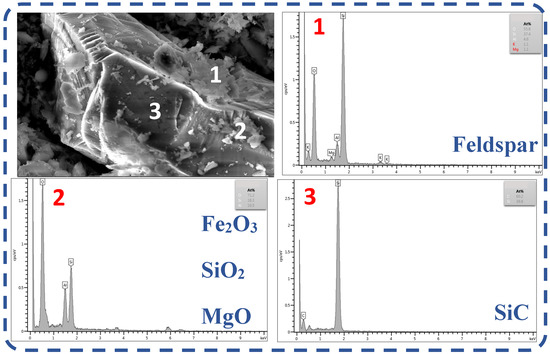
Figure 3.
SEM-EDS analysis of waste graphite ash. (1: EDS at point 1 in the figure, 2: EDS at point 2 in the figure, 3: EDS at point 3 in the figure).
Analysis of the waste graphite raw material showed that it was high-purity when used as a crucible during photovoltaic crystal drawing. Silicon carbide does not exist in nature, so it could not have been introduced during the isostatic pressing, suggesting that it was introduced during crystallization. A schematic diagram of the single-crystal furnace is shown in Figure 4. According to the literature report and experiments, the polycrystalline silicon is heated to the melting point of silicon in the high-purity quartz crucible during crystallization. Then, monocrystalline silicon is prepared by the traction of the seed crystal rod. Because silicon undergoes a disproportionation reaction during this process, as shown in Formulas (4) and (5), the generated SiO reacts with the graphite crucible to generate SiC.
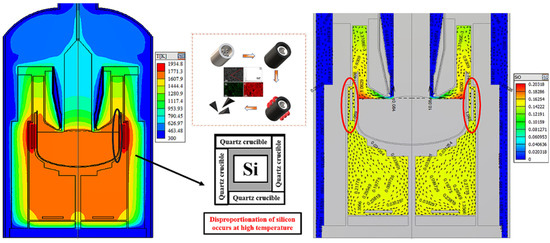
Figure 4.
SiO concentration in single-crystal silicon furnace and mechanism of silicon carbide formation in a graphite crucible.
To verify this hypothesis, a simulation experiment was carried out in the laboratory. Because the long crystal process is not involved in the theoretical analysis, it was not considered in the simulation experiment. In the simulation experiment, polysilicon was placed in a high-purity quartz crucible and placed into an induction furnace and heated to 1500 °C for 3 h (the quartz crucible and graphite crucible did not contact other parts of the furnace except for their bottom surface). A schematic diagram is shown in Figure 4. After cooling in the furnace, the graphite crucible was removed and broken. SEM-EDS analysis was performed on the side wall of the graphite crucible. The analysis found a large amount of SiC in the inner wall of the graphite crucible. These experimental results verified our hypothesis, showing that the SiC impurities in the graphite raw material were introduced during crystallization.
3.2. Impurity Traceability and Content Determination of Silicon Carbide
First, the raw material was dissolved in an alkali reagent, and impurities such as silicon dioxide and silicates were dissolved and measured. Then, acid dissolution was performed, and metal oxides were dissolved using aqua regia and then measured. Insoluble substances included only graphite and silicon carbide. Then, the twice-dissolved samples were roasted under an air atmosphere, allowing all graphite in the raw material to escape in the form of carbon dioxide. It was assumed that the only remaining product was silicon carbide. Then, the carbon content was measured using a carbon sulfur analyzer, and the silicon carbide content was determined.
The data in Table 3 were obtained from the carbon and sulfur analysis of the ash of raw materials after calcination in the air. As mentioned earlier, graphite in the feedstock completely escaped as carbon dioxide, so the remaining carbon existed as silicon carbide. As the relative atomic mass of carbon is 12, and the relative atomic mass of silicon is 28, the mass fraction of silicon carbide was 78.615%, which is close to the semi-quantitative XRD analysis of waste graphite ash. According to the analysis of one group of coal, ash accounted for 5.93% of the raw material, so silicon carbide accounted for 4.66%. There was a discrepancy with the alkali-acid purification experiment. Most of the SIC exists on the surface of the raw material, so there is uneven distribution, eventually leading to uneven sampling leg. Grinding large samples after mixing produced inhomogeneous samples, requiring a sampling process to determine the mass fraction of silicon carbide and purification efficiency.
Table 3.
Analysis of carbon and silicon carbide content in waste graphite ash.
3.3. Effect of Purification Parameters on the Removal Efficiency of Impurities
3.3.1. Effect of Alkali Roasting Parameters on Purification Efficiency
The effects of the mass ratio of graphite to sodium hydroxide, calcination temperature, calcination time, hydrochloric acid concentration, acid leaching time, liquid–solid ratio, acid leaching temperature, and other factors on the content of rare earth (RE) impurities were studied. As a higher RE indicates a higher FC of graphite, the FC of the graphite product was used as an indicator of the RE content.
Chemical analysis of graphite raw materials showed that the main impurity elements were silicon, iron, aluminum, and calcium. The main impurity, silica, has strong acid resistance and does not react with acids except for HF. However, it can react with alkali agents at high temperatures to produce silicates, which can be removed. Ordinary alumina can generally react with strong acids and bases, but α-Al2O3 has dense hexagonal packing that provides good resistance to both acids and bases. However, it can react with molten alkali agents. Alkali melting is the most critical step in the purification of graphite by the alkali-acid method. Relevant studies have found that many alkaline substances react with impurities in graphite, and using more alkaline agent more thoroughly removes impurities. Considering that the molten alkali needs to react with impurities in graphite, sodium hydroxide is selected as the additive, which has the advantages of low melting point and high alkalinity, and the generated salts can be removed by reacting with hydrochloric acid. Because impurities are widely distributed throughout graphite during purification, to ensure the complete removal of impurities, the amount of sodium hydroxide needs to be strictly controlled. Too little sodium hydroxide leads to an insufficient reaction with impurities. Moreover, molten sodium hydroxide cannot selectively contact impurities during the reaction and will diffuse inside the graphite and fully react with impurities. To ensure that sodium hydroxide completely wraps the graphite, only sufficient sodium hydroxide should be added, which might result in gasification loss. Therefore, excessive sodium hydroxide is necessary, but this increases costs and also adds an unnecessary workload during subsequent acid leaching. Therefore, it is necessary to determine the appropriate amount of sodium hydroxide using a single-factor experiment (Figure 5a).
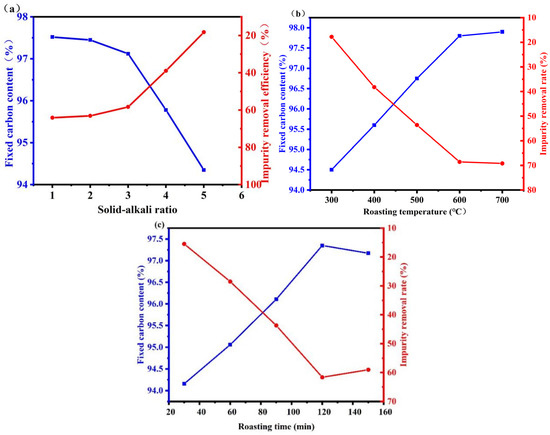
Figure 5.
Alkali roasting and purification efficiency under different conditions ((a) solid alkali ratio, (b) temperature, (c) time).
As can be seen from Figure 5a, the amount of sodium hydroxide significantly affected the purification effect of graphite. The fixed carbon content of graphite increased from 93.09% to 97.35% upon increasing the amount of sodium hydroxide. However, the curve became increasingly smooth, and the fixed carbon content eventually remained unchanged upon further increasing the amount of sodium hydroxide because most impurities were completely removed [34,35]. Further increasing the sodium hydroxide amount will affect the dissolution of sodium silicate during subsequent leaching because it will remain in the graphite after washing. During acid leaching, residual sodium silicate will generate silicic acid, which easily forms colloids. However, no more impurities can be removed, thus affecting the purification effect of graphite, as shown in Equation (3). Instead, excess sodium hydroxide reduced the fixed carbon content of graphite. Therefore, a graphite:sodium hydroxide ratio of 3 was selected as the base condition for subsequent experiments.
Figure 5b demonstrates the effect of roasting temperature on the FC of graphite products. The graphite FC increased appreciably upon increasing the temperature from 300 °C to 600 °C, reaching a maximum FC at 700 °C because the chemical reaction rate increased rapidly with the temperature. However, the reaction extent and graphite FC decreased at temperatures higher than 700 °C, as shown in Equations (4) and (5) [36]. These silicate products were challenging to remove using water or HCl. Therefore, the optimal roasting temperature was 600 °C.
As can be seen from Figure 5c, the roasting time significantly changed the graphite purification effect. The fixed carbon content increased gradually before 60 min but increased slowly between 60 min and 120 min and then remained basically unchanged. This was because the impurities in graphite reacted completely with sodium hydroxide by 120 min, and no additional impurities could be removed. Therefore, 120 min roasting time was used in subsequent experiments.
3.3.2. Effect of Acid Leaching Parameters on Purification Efficiency
The reaction of hydrochloric acid with graphite impurities after alkali roasting is a liquid–solid reaction that generates soluble compounds and can be approximately regarded as an unreacted core model. Therefore, there are two main factors affecting the acid-leaching effect: the diffusion rate of hydrochloric acid and the reaction rate of hydrochloric acid with impurities. The concentration of hydrochloric acid affects both rates. Therefore, to study the effect of hydrochloric acid concentration on graphite purification by the alkali-acid method, WG was leached with different acid concentrations.
Figure 6a shows that below 1.0 M HCl, graphite’s fixed carbon content gradually increased and remained unchanged above 1.0 M. Upon increasing the HCl concentration, the molar concentration difference of HCl on the surface of the hydrochloric acid solution and impurity solids became larger. The diffusion rate of HCl also became larger, which allowed the surface impurities to react more fully with HCl, thus improving the removal rate of impurities in graphite. Therefore, upon increasing the HCl concentration, the graphite fixed carbon content gradually increased. A higher concentration of hydrochloric acid also led to a poor purification effect because of the following two points:
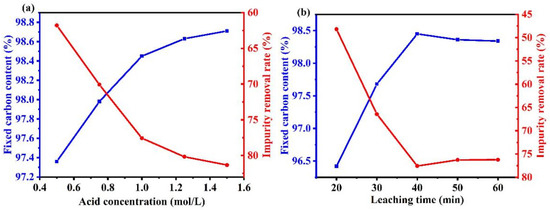
Figure 6.
Influence of various factors during the acid leaching process on the purification efficiency. ((a) acid concentration, (b) time).
- The volatility of concentrated hydrochloric acid led to the partial loss of hydrochloric acid. Increasing the concentration also reduced the liquid–solid ratio, which affected the reaction of impurities with hydrochloric acid, and ultimately reduced the graphite fixed carbon content.
- HCl reacted with the residual Na2SiO3 to form metasilicic acid, which hindered the filtration effect and reduced the removal efficiency via Equation (6):
Figure 6b shows that the fixed carbon content of graphite gradually increased upon prolonging the acid leaching time before 40 min. However, upon increasing the leaching time beyond 40 min, the fixed carbon content decreased slightly. This was because the impurity removal reaction was complete at about 40 min, and a longer reaction time led to the formation and deposition of metasilicic acid. The formed silicic acid sol remained in the graphite, which increased the content of impurities.
The impurities in WG were removed by the optimal alkali-acid method. Under a solid–alkali ratio of 3, calcination temperature of 600 °C, calcination time of 120 min, HCl concentration of 1 M, and acid leaching time of 40 min, the graphite product with a fixed carbon content of 98.45% was obtained. A high-purity (99.9%) graphite product could not be obtained because SiC impurities in WG were difficult to remove by the alkali-acid method.
3.4. Analysis of Products Purified by the Alkali-Acid Method
Figure 7 shows the Raman spectra of waste graphite, purified graphite, and commercial graphite. The degree of graphitization of waste graphite was close to that of commercial graphite, indicating that waste graphite may be used to prepare negative electrodes of lithium-ion batteries. Compared with purified graphite, the waste graphite had a lower D peak intensity and, thus, a lower ID/IG ratio. This shows that the original graphitic structure was not destroyed during the removal of impurities. Amorphous carbon also underwent graphitization during high-temperature roasting. Upon increasing the graphitization degree, the lithium storage capacity will first decrease and then increase, and the Coulombic efficiency will gradually increase. Compared with amorphous carbon, graphitization increases the conductivity and can also promote the transport of lithium ions, giving a lithium-ion battery more stable cycling. This indicates that after purification, the graphitization degree of waste graphite was higher. The purification process improved the purity of graphite and also increased the graphitization degree of raw materials, which may improve their electrochemical performance when used as the negative electrode for lithium-ion batteries.
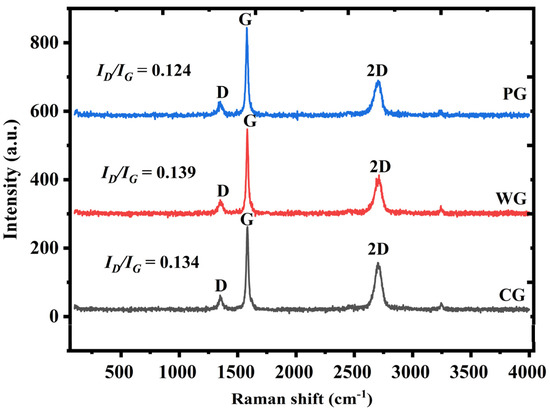
Figure 7.
Raman spectra of different samples.
As shown in Figure 8, XPS analysis was carried out for the products treated by the alkali-acid method, and it was found that only Si-C bonds existed in the treated products. Si-O bonds in the raw materials disappeared after treatment. The reason is that silicates and silicon dioxide in the raw materials reacted with the molten sodium hydroxide during alkali roasting to produce soluble sodium salts that were then transferred to the aqueous solution during washing. The presence of Si-C bonds indicates SiC impurities were present in the roasted products, which could not be removed by alkali roasting or acid leaching because of their acid and alkali resistance.
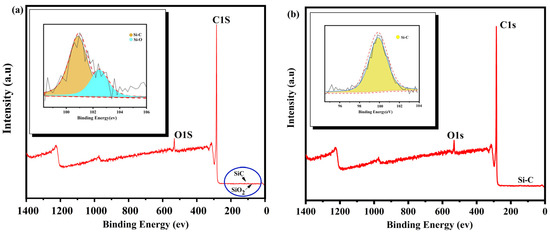
Figure 8.
XPS analysis before and after purification ((a) WG, (b) PG).
As shown in Figure 9, The infrared spectral analysis of the products treated by the alkali-acid method showed peaks near 810 cm−1 (Si-C vibration), 1050 cm−1 (asymmetric tensile vibration of Si-O-Si bonds), 1635 cm−1 (the bending vibration of water molecules), and 650–850 cm−1 (SiC). A C-H absorption peak appeared near 2900 cm−1, which was generated by the vibration and rotation of C-H bonds. A strong absorption peak near 3400 cm−1 was generated by the vibration and rotation of hydroxyl groups in organic matter. By analyzing the products of the alkali-acid method, it can be found that the Si-C vibration peak near 810 cm−1 and the bending vibration of water molecules near 1635 cm−1 still existed in the spectrum. However, the asymmetric tensile vibration peak of Si-O-Si bonds near 1050 cm−1 in the calcined products spectrum disappeared because SiO2 and silicate minerals reacted with the alkali agent during alkali roasting and were removed during washing. This is consistent with the XPS analysis.
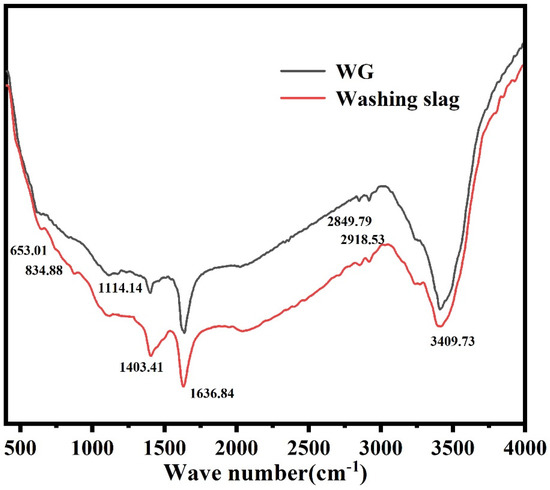
Figure 9.
Infrared analysis before and after purification.
As shown in Figure 10, SEM-EDS analysis of WG and PG showed that the main impurity phases in WG were silicon dioxide, iron oxide, and silicon carbide. Most impurities were distributed on the surface of graphite, and although the monomer dissociation was low and there was some embedding, most were exposed in the outer layer without being wrapped by graphite, allowing them to be easily removed. Comparing PG with WG shows that after purification by the alkaline-acid method, all impurities except silicon carbide impurities were removed, leaving only graphite. SEM images showed that there was no significant difference between the typical laminar structure and surface morphology of the final product and the initial graphite scrap, which still had a good laminar structure, indicating that the graphite structure was well preserved during the washing process.
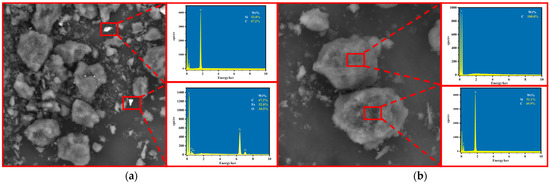
Figure 10.
SEM-EDS analysis ((a) WG and (b) PG).
3.5. Analysis of Impurity Element Migration during Removal
The above results showed that except for SiC impurities, all other impurities (feldspar, silica, metal oxides, etc.) were removed by the alkali-acid method. However, it is necessary to study the migration behavior of impurity elements during the purification process. As shown in Figure 6a, the content of impurity elements (Si, Al, Na, K, etc.) in the product after alkali roasting and water leaching was greatly decreased, while the content of Fe and Mg impurities did not significantly decrease. Combined with the content of impurity elements in the water-leaching solution, it can be found that during alkali roasting-water washing, most impurities decomposed into soluble salts and then transferred to the liquid phase. There was no obvious change in the iron impurity content because goethite was generated during the alkali roasting of iron oxide via Formulas (7)–(11) [27], which was difficult to remove during water washing.
As shown in Figure 11b, the contents of Fe and Mg in the product after acid leaching decreased significantly because impurities that could not be removed by alkali roasting and water leaching were removed during acid leaching via Formulas (12) and (13) [28].
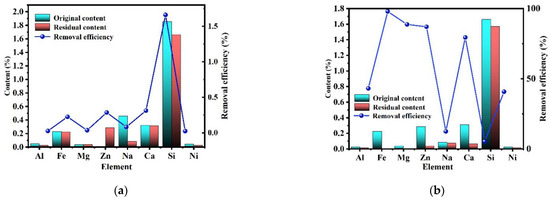
Figure 11.
Purification efficiency of each element ((a) alkali roasting process and (b) acid-leaching process).
Based on the above data and discussion, the removal of impurities mainly followed three mechanisms. The removal of Fe, Mg, Ti, Zn, and Ca followed the same chemical principle in which impurities containing these elements initially decomposed at high temperatures and reacted with NaOH to form hydroxides or oxides that dissolved in HCl solution. Therefore, most Fe, Mg, Ti, Zn, and Ca impurities were removed during acid leaching.
The alkali-acid method process produces a large amount of wastewater, which requires treatment. During purification, the wastewater from the alkaline roasting and washing process is strongly alkaline, while the acid-leaching solution is strongly acidic. In addition, the water extract and acid extract contain various metal ions and anions. The direct discharge of this alkaline and acidic wastewater may seriously corrode relevant facilities and cause serious water pollution. Coagulation provides a feasible method to treat these wastewaters by mixing alkaline wastewater and acid wastewater. A neutral or near-neutral solution can be obtained by controlling the mixing method. Different metal ions and anions can be added to the coagulants. Therefore, impurities can be collected and removed from the wastewater, thus further purifying it [37,38].
4. Conclusions
By investigating the purification of WG using an alkaline-acid method, several conclusions were drawn, and the source of the main impurity phase silicon carbide in WG was analyzed. It was found that during the crystallization process, Si and SiO2 reacted to form SiO, which further reacted with the graphite crucible to form SiC impurities attached to the graphite crucible. Silicon carbide accounted for 4.66% of the waste graphite raw material. Impurities in WG were removed using the optimized alkaline-acid method. Under a solid alkali ratio of 3, a calcination temperature of 600 °C, a calcination time of 120 min, a HCl concentration of 1 M, and an acid leaching time of 40 min, a graphite product with a fixed carbon content of 98.45% was obtained. The migration of impurities followed three pathways. Most of the main elements (Al, K, and Si) in silicates were removed by alkaline roasting, while the remaining elements were dissolved in acid. Impurities containing metal elements such as Fe, Mg, Ca, and Zn decomposed in NaOH to form hydroxides or oxides that dissolved in HCl. Silicon carbide impurities were removed by the alkaline-acid method without decomposition and often existed together with graphite in the acid-leaching slag. In this study, the occurrence state and content of impurities of waste graphite used for photovoltaic crystal drawing were analyzed, and the alkalic acid method was used to purify the fixed carbon content from 93.09% to 98.45%. The trend of impurity elements in the purification process was analyzed, which provided the basic theory for realizing the high value utilization of waste graphite used for photovoltaic crystal drawing.
Author Contributions
Conceptualization, Y.Z., Z.C. and K.X.; methodology, Y.Z., Z.C. and K.X.; validation, Z.C., K.X. and W.M.; resources, Y.Z., X.C. and Y.H.; data curation, Y.Z., X.C. and Y.H.; writing—original draft, Y.Z.; writing—review and editing, visualization, Y.Z., X.C. and Y.H.; funding acquisition, Z.C., K.X. and W.M. All authors have read and agreed to the published version of the manuscript.
Funding
The authors are grateful for financial support from the Major Projects of Yunnan Province (No. 202302AB080004) and the Ten Thousand Talent Plans for Young Top-notch Talents of Yunnan Province (No. YNWR-QNBJ-2020-022).
Data Availability Statement
Not applicable.
Acknowledgments
The authors are grateful for financial support from the Major Projects of Yunnan Province (No. 202302AB080004) and the Ten Thousand Talent Plans for Young Top-notch Talents of Yunnan Province (No. YNWR-QNBJ-2020-022).
Conflicts of Interest
The authors declare no conflict of interest.
References
- Angelopoulos, P.M.; Koukoulis, N.; Anastassakis, G.N.; Taxiarchou, M.; Paspaliaris, I. Selective recovery of graphite from spent potlining (SPL) by froth flotation. J. Sustain. Metall. 2021, 7, 1589–1602. [Google Scholar] [CrossRef]
- Bao, C.; Shi, K.; Xu, P.; Yang, L.; Chen, H.; Dai, Y.; Liu, H. Purification effect of the methods used for the preparation of the ultra-high purity graphite. Diam. Relat. Mater. 2021, 120, 108704. [Google Scholar] [CrossRef]
- Bhola, S.M.; Kundu, S.; Alabbas, F.; Mishra, B.; Olson, D.L. An electrochemical study on chlorhexidine gluconate addition to normal saline for oral implant applications. Int. J. Electrochem. Sci. 2013, 8, 5172–5182. [Google Scholar] [CrossRef]
- Bouchetou, M.; Poirier, J.; Morales, L.A.; Chotard, T.; Joubert, O.; Weissenbacher, M. Synthesis of an innovative zirconia-mullite raw material sintered from andalusite and zircon precursors and an evaluation of its corrosion and thermal shock performance. Ceram. Int. 2019, 45, 12832–12844. [Google Scholar] [CrossRef]
- Chehreh Chelgani, S.; Rudolph, M.; Kratzsch, R.; Sandmann, D.; Gutzmer, J. A review of graphite beneficiation techniques. Miner. Process. Extr. Metall. Rev. 2016, 37, 58–68. [Google Scholar] [CrossRef]
- Dhal, B.; Thatoi, H.N.; Das, N.N.; Pandey, B.D. Chemical and microbial remediation of hexavalent chromium from contaminated soil and mining/metallurgical solid waste: A review. J. Hazard. Mater. 2013, 250–251, 272–291. [Google Scholar] [CrossRef]
- Ding, S.; Sun, S.; Xu, H.; Yang, B.; Liu, Y.; Wang, H.; Chen, D.; Zhang, R. Preparation and adsorption property of graphene oxide by using waste graphite from diamond synthesis industry. Mater. Chem. Phys. 2019, 221, 47–57. [Google Scholar] [CrossRef]
- Jalili, R.; Esrafilzadeh, D.; Aboutalebi, S.H.; Sabri, Y.M.; Kandjani, A.E.; Bhargava, S.K.; Della Gaspera, E.; Gengenbach, T.R.; Walker, A.; Chao, Y. Silicon as a ubiquitous contaminant in graphene derivatives with significant impact on device performance. Nat. Commun. 2018, 9, 5070. [Google Scholar] [CrossRef]
- Jara, A.D.; Betemariam, A.; Woldetinsae, G.; Kim, J.Y. Purification, application and current market trend of natural graphite: A review. Int. J. Min. Sci. Technol. 2019, 29, 671–689. [Google Scholar] [CrossRef]
- Li, B.; Wu, C.; Xu, J.; Hu, D.; Zhang, T.; Fang, X.; Tong, J. One-pot redox synthesis of graphene from waste graphite of spent lithium ion batteries with peracetic acid assistance. Mater. Chem. Phys. 2020, 241, 122397. [Google Scholar] [CrossRef]
- Li, Y.-F.; Zhu, S.-F.; Wang, L. Purification of natural graphite by microwave assisted acid leaching. Carbon 2013, 55, 377–378. [Google Scholar] [CrossRef]
- Lu, X.; Forssberg, E. Preparation of high-purity and low-sulphur graphite from Woxna fine graphite concentrate by alkali roasting. Miner. Eng. 2002, 15, 755–757. [Google Scholar] [CrossRef]
- Ma, Y.; Wang, X.; Stopic, S.; Wang, M.; Kremer, D.; Wotruba, H.; Friedrich, B. Preparation of vanadium oxides from a vanadium (IV) strip liquor extracted from vanadium-bearing shale using an eco-friendly method. Metals 2018, 8, 994. [Google Scholar] [CrossRef]
- Natarajan, S.; Aravindan, V. An urgent call to spent LIB recycling: Whys and wherefores for graphite recovery. Adv. Energy Mater. 2020, 10, 2002238. [Google Scholar] [CrossRef]
- Ni, B.J.; Huang, Q.S.; Wang, C.; Ni, T.Y.; Sun, J.; Wei, W. Competitive adsorption of heavy metals in aqueous solution onto biochar derived from anaerobically digested sludge. Chemosphere 2019, 219, 351–357. [Google Scholar] [CrossRef]
- Peng, W.; Li, H.; Hu, Y.; Liu, Y.; Song, S. Does silicate mineral impurities in natural graphite affect the characteristics of synthesized graphene Mater. Res. Bull. 2016, 74, 333–339. [Google Scholar] [CrossRef]
- Quan, Y.; Liu, Q.; Li, K.; Zhang, H.; Yuan, L. Highly efficient purification of natural coaly graphite via an electrochemical method. Sep. Purif. Technol. 2022, 281, 119931. [Google Scholar] [CrossRef]
- Rey, I.; Vallejo, C.; Santiago, G.; Iturrondobeitia, M.; Lizundia, E. Environmental impacts of graphite recycling from spent lithium-ion batteries based on life cycle assessment. ACS Sustain. Chem. Eng. 2021, 9, 14488–14501. [Google Scholar] [CrossRef]
- Shen, K.; Huang, Z.-H.; Hu, K.; Shen, W.; Yu, S.; Yang, J.; Yang, G.; Kang, F. Advantages of natural microcrystalline graphite filler over petroleum coke in isotropic graphite preparation. Carbon 2015, 90, 197–206. [Google Scholar] [CrossRef]
- Wang, H.; Feng, Q.; Tang, X.; Liu, K. Preparation of high-purity graphite from a fine microcrystalline graphite concentrate: Effect of alkali roasting pre-treatment and acid leaching process. Sep. Sci. Technol. 2016, 51, 2465–2472. [Google Scholar] [CrossRef]
- Xie, W.; Wang, Z.; Kuang, J.; Xu, H.; Yi, S.; Deng, Y.; Cao, T.; Guo, Z. Fixed carbon content and reaction mechanism of natural microcrystalline graphite purified by hydrochloric acid and sodium fluoride. Int. J. Miner. Process. 2016, 155, 45–54. [Google Scholar] [CrossRef]
- Zaghib, K.; Song, X.; Guerfi, A.; Rioux, R.; Kinoshita, K. Purification process of natural graphite as anode for Li-ion batteries: Chemical versus thermal. J. Power Sources 2003, 119, 8–15. [Google Scholar] [CrossRef]
- Nakamura, D.; Shigetoh, K. Fabrication of large-sized TaC-coated carbon crucibles for the low-cost sublimation growth of large-diameter bulk SiC crystals. Jpn. J. Appl. Phys. 2017, 56, 085504. [Google Scholar] [CrossRef]
- Duan, S.-Z.; Wu, X.-W.; Wang, Y.-F.; Feng, J.; Hou, S.-Y.; Huang, Z.-H.; Shen, K.; Chen, Y.-X.; Liu, H.-B.; Kang, F.-Y. Recent progress in the research and development of natural graphite for use in thermal management, battery electrodes and the nuclear industry. New Carbon Mater. 2023, 38, 73–95. [Google Scholar] [CrossRef]
- Park, K.H.; Lee, D.; Kim, J.; Song, J.; Lee, Y.M.; Kim, H.; Park, J. Defect-Free, Size-Tunable Graphene for High-Performance Lithium Ion Battery. Nano Lett. 2014, 14, 4306–4313. [Google Scholar] [CrossRef] [PubMed]
- Chen, K.; Song, S.; Liu, F.; Xue, D. Structural Design of Graphene for Use in Electrochemical Energy Storage Devices. Chem. Soc. Rev. 2015, 44, 6230–6257. [Google Scholar] [CrossRef] [PubMed]
- Tian, R.; Wang, W.; Huang, Y.; Duan, H.; Guo, Y.; Kang, H.; Li, H.; Liu, H. 3D Composites of Layered MoS2 and Graphene Nanoribbons for High Performance Lithium-Ion Battery Anodes. J. Mater. Chem. A 2016, 4, 13148–13154. [Google Scholar] [CrossRef]
- Tian, R.; Zhang, Y.; Chen, Z.; Duan, H.; Xu, B.; Guo, Y.; Kang, H.; Li, H.; Liu, H. The Effect of Annealing on a 3D SnO2/Graphene Foam as an Advanced Lithium-Ion Battery Anode. Sci. Rep. 2016, 6, 19195. [Google Scholar] [CrossRef]
- Chen, K.; Xue, D.; Komarneni, S. Nanoclay Assisted Electrochemical Exfoliation of Pencil Core to High Conductive Graphene Thin-Film Electrode. J. Colloid Interface Sci. 2017, 487, 156–161. [Google Scholar] [CrossRef]
- Gu, J.N.; Du, Z.G.; Zhang, C.; Yang, S.B. Pyridinic Nitrogen-Enriched Carbon Nanogears with Thin Teeth for Superior Lithium Storage. Adv. Energy Mater. 2016, 6, 1600917. [Google Scholar] [CrossRef]
- Chen, K.; Xue, D.; Komarneni, S.; Liu, F. Carbon with Ultrahigh Capacitance when Graphene Paper Meets K3Fe(CN)6. Nanoscale 2015, 7, 432–439. [Google Scholar] [CrossRef] [PubMed]
- Yu, M.; Lin, D.; Feng, H.; Zeng, Y.; Tong, Y.; Lu, X. Boosting Energy Density of Carbon Based Aqueous Supercapacitors via Optimizing Surface Charge. Angew. Chem. Int. Ed. 2017, 56, 5454–5459. [Google Scholar] [CrossRef] [PubMed]
- Yu, M.; Zhao, S.; Feng, H.; Hu, L.; Zhang, X.; Zeng, Y.; Tong, Y.; Lu, X. Engineering Thin MoS2 Nanosheets on TiN Nanorods: Advanced electrochemical capacitor electrode and hydrogen evolution electrocatalyst. ACS Energy Lett. 2017, 2, 1862–1868. [Google Scholar] [CrossRef]
- Rothermel, S.; Evertz, M.; Kasnatscheew, J.; Qi, X.; Grutzke, M.; Winter, M.; Nowak, S. Graphite Recycling from Spent Lithium-Ion Batteries. ChemSusChem 2016, 9, 3473–3484. [Google Scholar] [CrossRef]
- Placke, T.; Siozios, V.; Schmitz, R.; Lux, S.F.; Bieker, P.; Colle, C.; Meyer, H.W.; Passerini, S.; Winter, M. Influence of Graphite Surface Modifications on the Ratio of Basal Plane to “Non-Basal Plane” Surface Area and on the Anode Performance in Lithium Ion Batteries. J. Power Sources 2012, 200, 83–91. [Google Scholar] [CrossRef]
- Zvereva, E.; Caliste, D.; Pochet, P. Interface Identification of the Solid Electrolyte Interphase on Graphite. Carbon 2017, 111, 789–795. [Google Scholar] [CrossRef]
- Zouboulis, A.I.; Tzoupanous, N.D. Polyaluminium silicate chloride—A systematic study for the preparation and application of an efficient coagulant for water or wastewater treatment. J. Hazard. Mater. 2009, 162, 1379–1389. [Google Scholar] [CrossRef] [PubMed]
- Yang, Z.L.; Gao, B.Y.; Yue, Q.Y.; Wang, Y. Effect of pH on the coagulation performance of Al-based coagulants and residual aluminum speciation during the treatment of humic acid–kaolin synthetic water. J. Hazard. Mater. 2010, 178, 596–600. [Google Scholar] [CrossRef]


Disclaimer/Publisher’s Note: The statements, opinions and data contained in all publications are solely those of the individual author(s) and contributor(s) and not of MDPI and/or the editor(s). MDPI and/or the editor(s) disclaim responsibility for any injury to people or property resulting from any ideas, methods, instructions or products referred to in the content. |
© 2023 by the authors. Licensee MDPI, Basel, Switzerland. This article is an open access article distributed under the terms and conditions of the Creative Commons Attribution (CC BY) license (https://creativecommons.org/licenses/by/4.0/).