Article

The Influence of a Corrosive Environment on Fatigue and Mechanical Properties of An Al-Cast Alloy with Higher Fe Content

by
Lenka Kuchariková
1,
Lucia Pastierovičová
1,*,
Eva Tillová
1,
Milan Uhríčik
1,
Viera Zatkalíková
1 and
Michal Šajgalík
2
1
Faculty of Mechanical Engineering, Department of Materials Engineering, University of Žilina, Univerzitná 8215/1, 010 26 Žilina, Slovakia
2
Faculty of Mechanical Engineering, Department of Machining and Manufacturing Technologies, University of Žilina, Univerzitná 8215/1, 010 26 Žilina, Slovakia
*
Author to whom correspondence should be addressed.
Metals 2023, 13(6), 1019; https://doi.org/10.3390/met13061019
Submission received: 24 April 2023 / Revised: 16 May 2023 / Accepted: 23 May 2023 / Published: 25 May 2023
(This article belongs to the Special Issue Microstructure and Properties of Aluminum Alloys)

Abstract

:
Al has very good corrosion resistance and corrosion properties. The corrosion resistance of Al-cast alloys is different because these alloys contain a lot of elements, especially in secondary alloys, which contain more impurity elements, of which Fe is the most common. This study deals with secondary AlSi7Mg0.3 cast alloys, which contain more Fe and are affected by a chloride corrosive environment. This environment was selected based on the application of castings in the automotive industry. The main object was to research the effect of such an environment on basic mechanical properties and fatigue properties. The results show that a higher Fe content does not lead to a significant reduction in the properties of the casting, and the chloride environment is not so harmful. Therefore, it can be stated that the investigated secondary sand-cast experimental materials can replace primary alloys without losing the required corrosion and mechanical properties.

1. Introduction

Over the past 50 years, an increasing proportion of the world’s aluminum supply has come from a variety of sources. One of the major sources is ore; however, scrap aluminum from industrial waste and end-of-life products is increasingly coming to the fore. The processing of this scrap to produce a new aluminum alloy is known as recycling, and the alloy is commonly called secondary [1,2]. Recycling represents increased environmental care in the aluminum industry, which is related to reducing the consumption of resources such as energy, materials, water, and soil; extending the lifetime of products; etc. [3,4,5,6]. The producers of such aluminum casts have worried about the effect of the chemical composition (especially the higher Fe content) on their strength, hardness, wear resistance, creep, stress relaxation, or fatigue since these are influenced by the size, volume, and morphology of microstructural or intermetallic parameters [7].
However, removing the iron from the melt is a complicated process from both technological and economic perspectives [8]. The commonly used processes for refining aluminum melts include fluxing, flotation, and filtration. Unfortunately, these methods are not sufficient to eliminate iron from the melt. For instance, aluminum melts, purification technologies, sedimentation, and distillation can be sufficient. In sedimentation processes, high-density particles are forced to settle down to the bottom of the melt in the furnace due to the additional melt holding time and energy consumption. It was reported that iron removal can be fulfilled with rates from 24% up to 71% by the sedimentation separation process. Additionally, it is also possible to achieve high-purity Al castings through three-layer electrolysis and fractional crystallization techniques, which can result in very high-purity aluminum products. However, all the methods mentioned above require high energy consumption; therefore, the secondary production goal would be negligible [9].
Unfortunately, even in casting processes, coarse microstructures and various defects are commonly formed, which possibly reduce the mechanical properties and especially the fatigue strength of the final cast part, as they are discontinuity elements and act as stress concentrators [10]. The higher Fe content also affects the porosity of the cast material. In general, the porosity parameters (percent porosity and maximum porosity) tend to increase with an increasing % wt. Fe [11]. Although iron is very soluble in liquid aluminum and its alloys, it has very low solubility in the solid state and, therefore, tends to combine with other elements to form various types of intermetallic phases. As the % Fe increases, the size and density of Fe-based intermetallic phases also increase. In the absence of Si, the Al3Fe and Al6Fe phases are dominant, with the presence of Si being dominant in phases such as Al8Fe2Si (known as α-phase) and Al5FeSi (known as β-phase). The higher content of Fe causes an increase in the formation of a longer and higher quantity of Al5FeSi phases. Hard and brittle Al5FeSi platelets (3D morphology)/needles (2D metallography surfaces) have a detrimental influence on the properties of the alloy. These phases enhance porosity, reduce fluidity, act as stress concentrators, promote crack formation, and reduce impact strength, machinability, and fatigue life. In terms of corrosion, Fe reduces the corrosion resistance of materials [12]. Despite the lower value of the electrode potential of the metal, aluminum has excellent corrosion resistance in a neutral environment owing to a passive layer. This passive layer consists of aluminum oxides and hydroxides that reduce the rate of corrosion processes by isolating the metal from the environment [13]. If this layer is removed by mechanical or chemical means, both anodic and cathodic reactions begin immediately (<1 mS) and continue until the layer reforms [14]. Al corrosion occurs relatively rapidly in areas of activity where the metal is oxidized to a soluble ionic product, Al3+. At pH levels from 4 to 8.5, aluminum is able to form a thin, stable passivation layer of hydrated aluminum oxides (Al2O3 · H2O), which significantly slow corrosion reactions [14,15].
Whereas Fe decreases the corrosion resistance of materials, it is very important to study its impact in different environments. The corrosion rate of aluminum in pure water is extremely low. The assessment of the corrosion properties of Al alloys used in the automotive industry is important because in many regions, cars are exposed to severe corrosive conditions during winter due to the use of deicing salt, but also important is how exactly Al and chloride (Cl) ions influence the protective character of the quasi-passive surface films [15]. Uneven corrosion attacks on aluminum alloys especially occur in the case of higher inhomogeneities of the material, which represent the so-called “weak spots”. The weak spots are affected by the purity of the Al (i.e., the higher the purity, the higher the corrosion resistance), and, therefore, the course of corrosion processes depends on the chemical and structural composition of Al alloys. In his work, Vargel [16] describes the fact that the individual components of the structure of Al alloys have different potential values and move in both directions from the potential of the basic matrix. However, the dissolution potential of aluminum alloys is determined by its main component, the solid solution α. The value of the dissolution potential is approximately −845 mV. The values of the dissolution potentials of the most common intermetallic phases in Al alloys also differ from the value of the matrix potential. The microstructures of Al–Si alloys often lead to the formation of galvanic cells, which are places not only for the initiation but also for the growth of pitting corrosion, precisely due to the presence of intermetallic phases of different chemical compositions [17,18,19,20]. In the case of the presence of Mg and Si, the Fe forms the π-phase Al8FeMg3Si6, resp. Fe with Mn added forms Al15(Fe, Mn)3Si2 [12]. Mg is an element that improves the corrosion resistance of Al alloys depending on the other additive elements present in the alloy. The increased Mg content results in a higher susceptibility of Al alloys to intergranular corrosion or stress cracking. The Mg2Si phase is even more “active” compared to the Al alloy matrix or silicon itself and contributes to pitting or intergranular corrosion. The authors of [21,22] focused on investigating the corrosion behavior of AlSi7Mg0.3 alloys before and after heat treatment. Vargel [16] stated that the presence of larger eutectic Si particles in non-heat-treated alloys largely caused the formation of pitting corrosion compared to heat-treated alloys. In general, the formation of pitting corrosion in Al–Si alloys is associated with a difference in corrosion potential, as the intermetallic phases, as well as eutectic Si, represent the sites for cathodic reactions [18,19]. In some cases, they lead to the formation of intercrystalline corrosion or corrosion during casting stress. Vargel and Ambant et al. [16,20] also showed in their work that the presence of Fe-rich intermetallic phases has an adverse effect on corrosion resistance. The Fe-rich phases act as catalytic sites for cathodic reactions as well as nucleation sites for corrosion pits.
Al–Si alloys are widely used in fatigue-critical structural applications, such as engine blocks, cylinder heads, and suspension components, for their excellent combination of mechanical and technological properties and to improve automotive fuel economy [2]. The increasing use of cast Al components under repeated cyclic loading has focused considerable interest on the fatigue properties of cast Al alloys. The Wöhler test is the most widely used analysis to determine the fatigue properties of a material and to determine the fatigue lifetime and fatigue strength of constant stress amplitude. The results obtained from the experiment are plotted into the graphical dependence of the amplitude of the applied nominal stress (σa) depending on the number of cycles to the fracture (N f) [23,24]. The fatigue life curve for aluminum alloys (σa = f (N)) has a different shape than that of steel. For aluminum alloys, the fatigue life curve decreases constantly with the stress amplitude; therefore, aluminum alloys are characterized by a fatigue time limit (σc) for a certain number of cycles [25]. The authors of [26] experimented on the AlSi9Cu3 aluminum alloy in a casting state, where the typical fatigue curve was obtained. The results show that its fatigue life increased with the decreasing of the stress amplitude in the range of 160 MPa to 80 MPa, and the fatigue limit was stated as a value of σc = 80 MPa. The fatigue properties of cast aluminum components strongly depend on casting defects and microstructural characteristics (especially intermetallic phases and eutectic Si needle-like forms). According to the authors of [27,28], materials with higher Fe content have a better fatigue lifetime, while fatigue is tested at 100 MPa. Increasing Fe-content reduces the fatigue life in the long lifetime regime (>106 cycles). Thus, it has no effect on the medium fatigue lifetime (>105 and <106 cycles), and it slightly increases the fatigue life in the short lifetime regime (<105 cycles).
For secondary Al alloys to be able to compete with primary Al alloys, it is essential that the products produced from them are of high quality and have comparable properties over their entire service life. The quality of the casting itself is affected by several factors, and one of the most significant is a higher presence of Fe. As mentioned above, higher Fe content reduces the corrosion properties of castings. Therefore, this work focuses on the effect of a corrosive environment on the mechanical and fatigue properties of secondary AlSi7Mg0.3 alloys with different Fe contents.

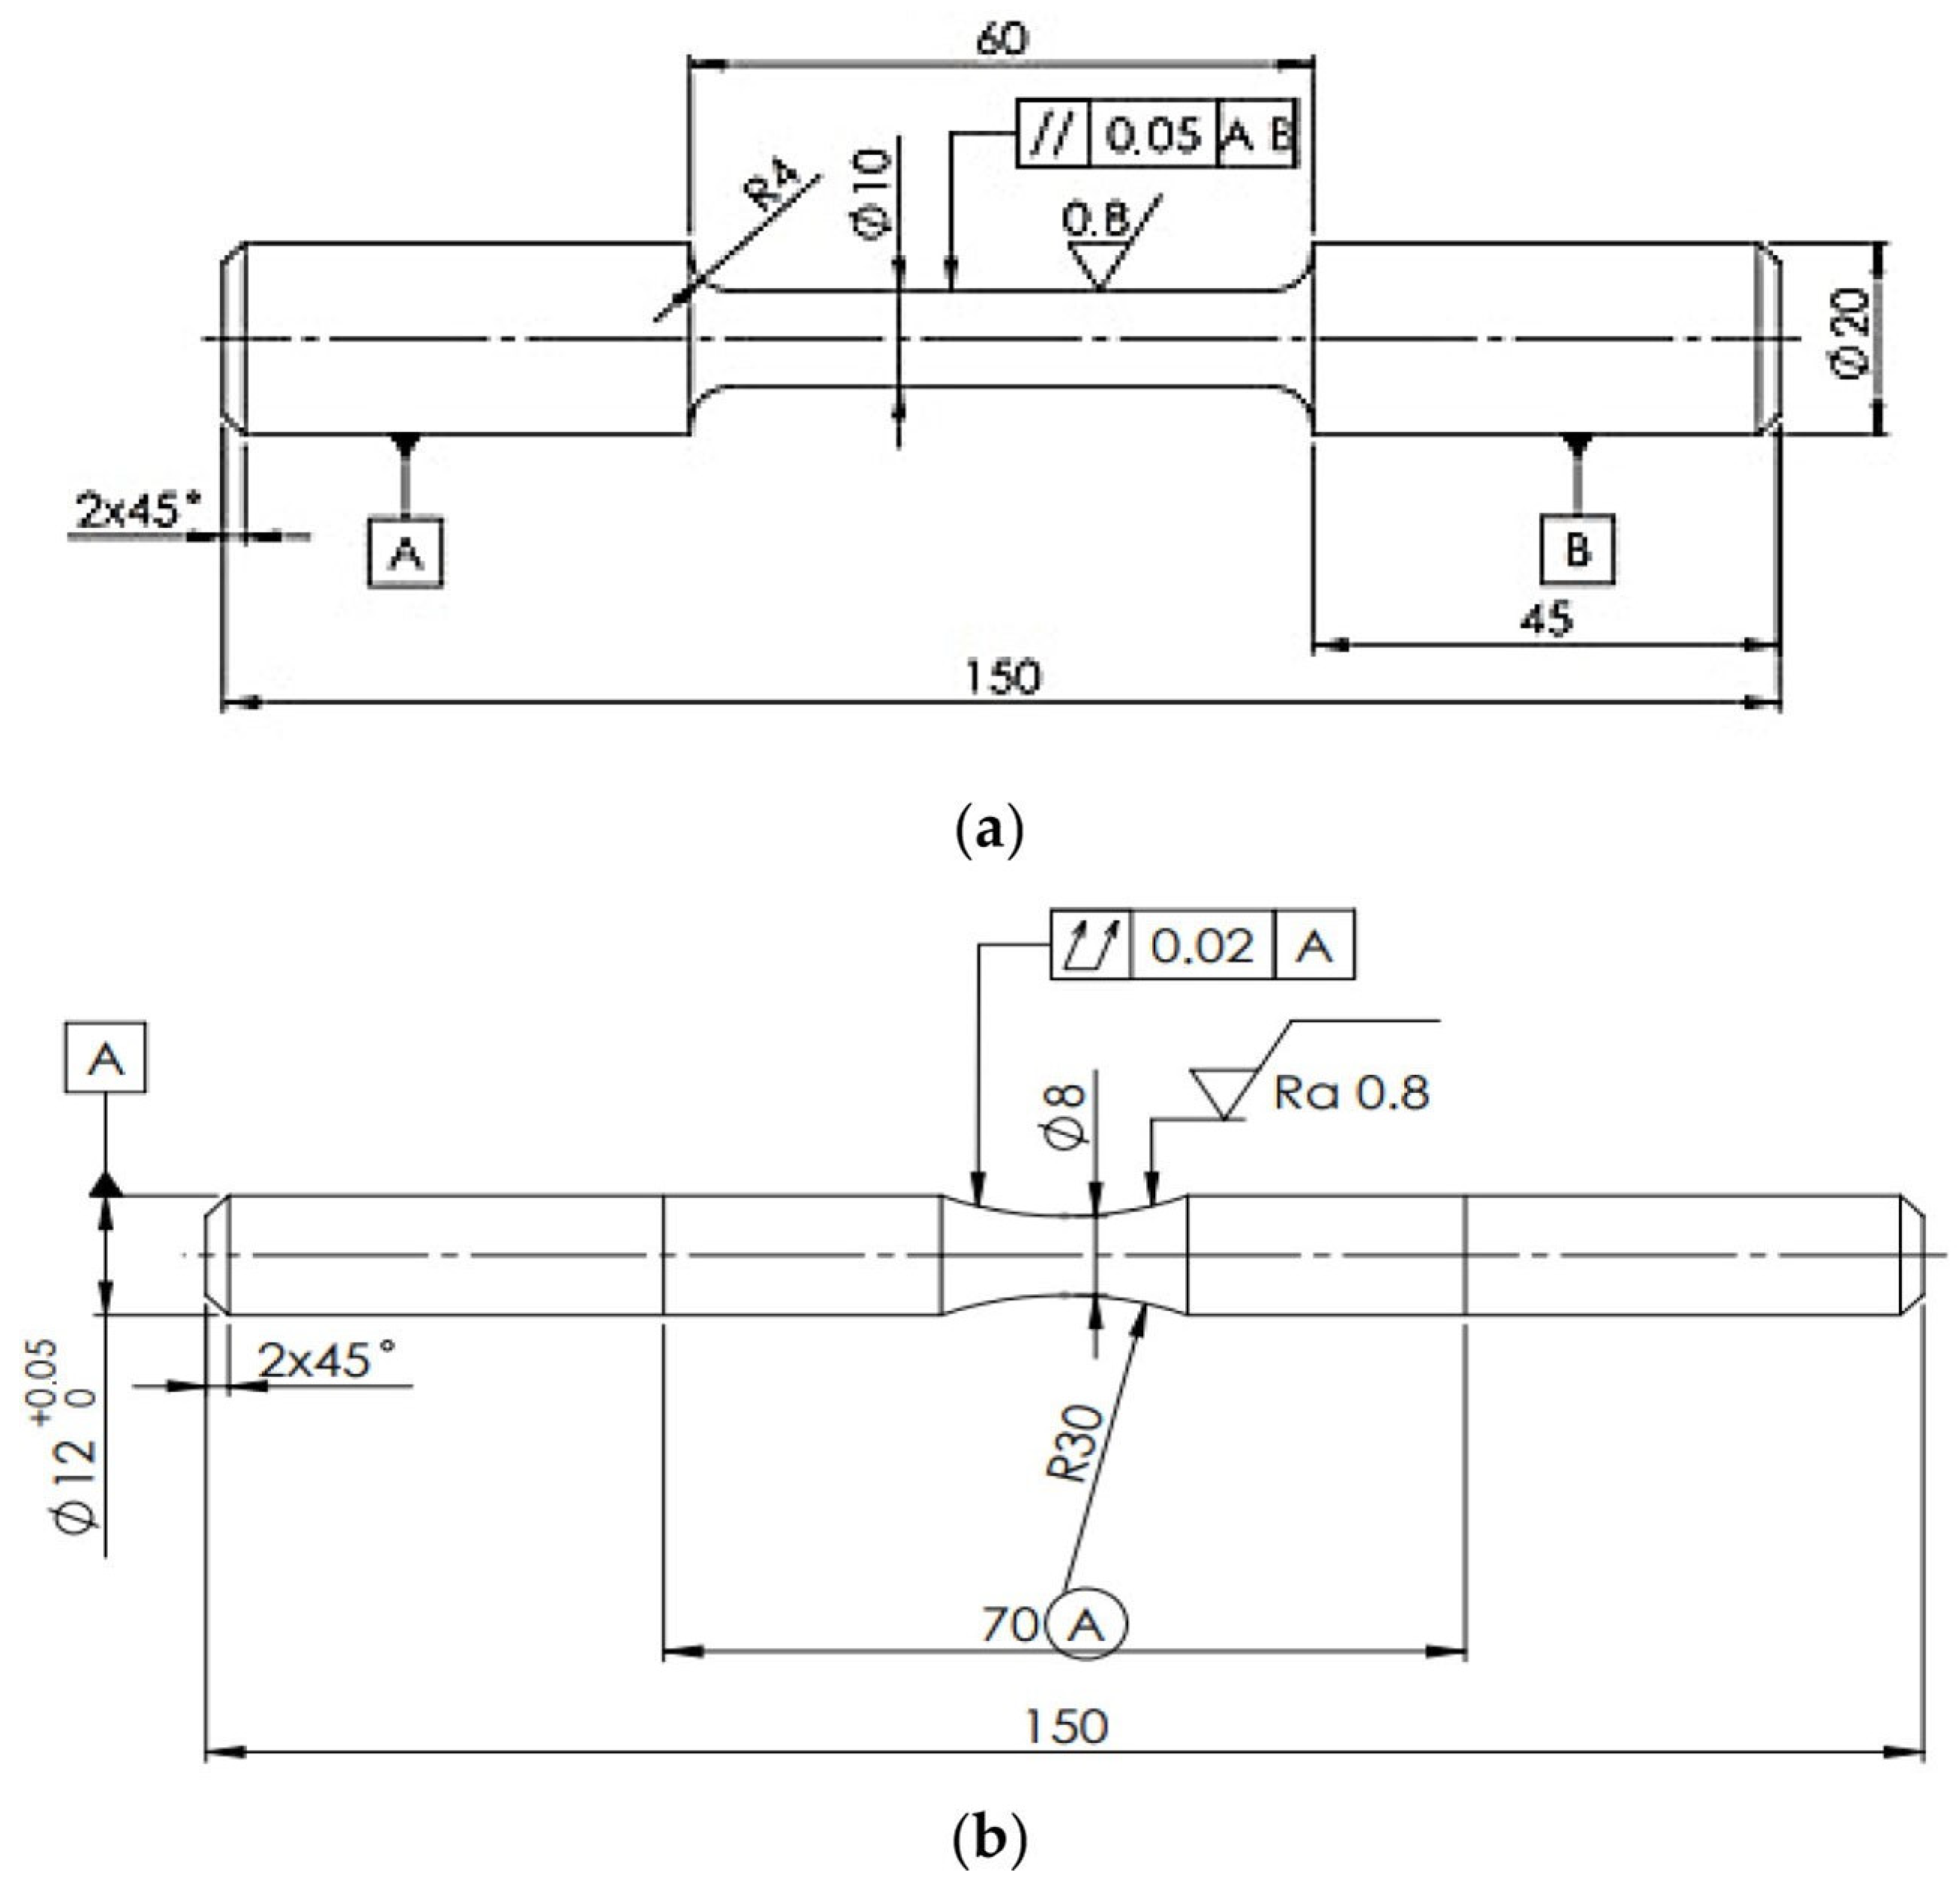
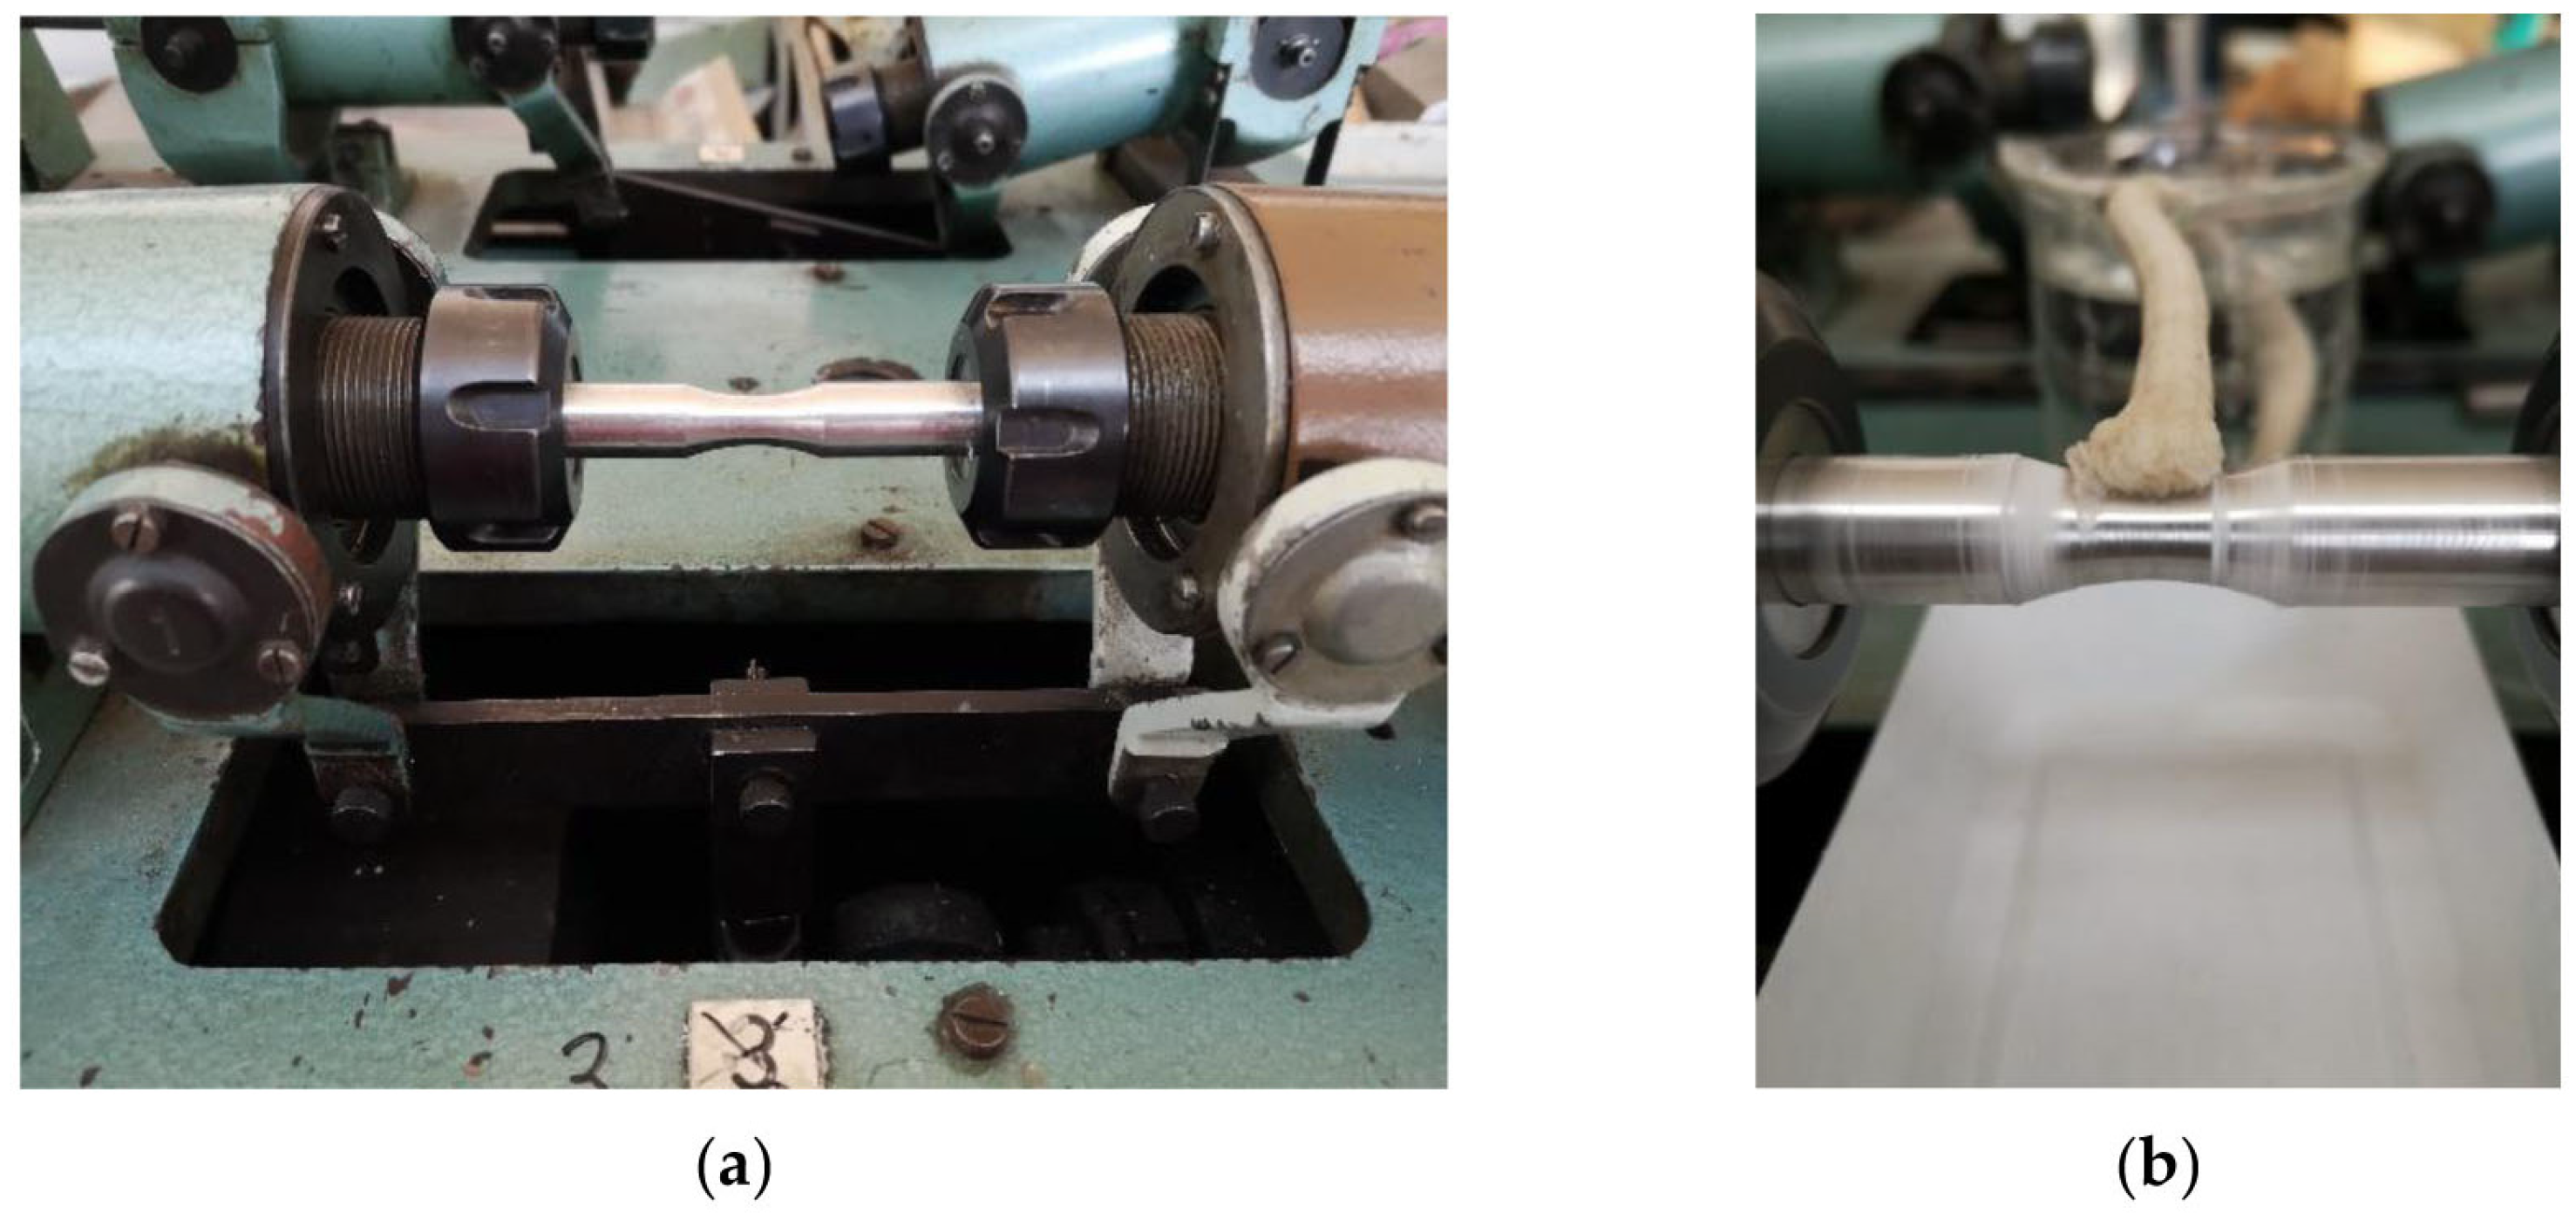
2. Materials and Methods

Three as-cast aluminum alloys (cast into sand molds) were studied in this work, as the casting of secondary alloys in sand molds has not been investigated so far. The alloys were manufactured by UNEKO, Zátor, Ltd. (Zátor, Czech Republic), company with the aim to investigate if the increased Fe content will have a significant detrimental effect on fatigue and corrosion properties. The original alloy ingots were re-melted and sand-casted into the shape of bars with diameters of 20 mm and lengths of 300 mm. The investigated alloys were without modification or refinement. The chemical compositions are presented in Table 1. As can be seen, the iron content was gradually increased. Since the alloy designated as A was a primary type of alloy without the use of scrap metal, the Fe content was the lowest. The secondary alloys designated B and C were secondary alloys, where a ratio of scrap metal was used; thus, they possessed higher Fe contamination. There was also a slight difference between other main alloying elements, such as Si, Mg, and Cu, but these differences were not expected to have a significant influence on the mechanical and corrosion properties. From the as-cast bars, specimens for tensile tests and fatigue tests were manufactured, per Figure 1.
The microstructure character of experimental materials can be evaluated with different methods of quantitative metallography. In the past, the evaluation of microstructures was measured by etalons, measurement of structural parameters using coherent tests grids, and so on. Nowadays, automatic image analysis is mostly used. This image analysis enables the evaluation of different structural parameters, for example, the evaluation of the volume (area) ratios of phases and structural components; the shape of particles; the size of particles; the count of particles per unit of area or volume; the measurement of the distance between particles; the length, width, diameter, angle, area, or perimeter of particles; the orientation of the structure; and so on, in different materials [7,29]. Therefore, the image analysis software NIS Elements 5.0 was used for this study.
Specimens for the metallography analysis were prepared using a standard metallography procedure, and 0.5% HF and Dix-Keller were used as etchers, and for highlighting of Fe intermetallic phases, a H2SO4 etcher was used. For highlighting the 3D morphology of structural constituents, the deep-etching method was used as well. Deep etching was performed with an HCl etcher, which dissolved the matrix so other microstructural constituents (eutectic Si and intermetallic phases) were visible and were not dissolved in the etcher.
Tensile tests, a hardness test, and bending impact tests were performed on the experimental alloys: (a) in the as-cast state (without being affected by the corrosive environment), and (b) after corrosion attack. The exposition of specimens to a corrosive environment was performed with an immersion test. The corrosive environment was a 3.5% NaCl (aq) solution in which the samples were immersed for three weeks (Figure 2) [30].
Tensile testing was performed on an Instron 5985 device (ISO 6892-1A standard [31]), where the test results included the UTS (ultimate tensile strength) and the ductility. Per Figure 1a, five test specimens for each series of materials, A, B, and C, were used to determine the mechanical properties and average.
For the assessment of alloy quality, the quality index (QI) or its derivates are commonly applied to comprehensively assess the operating durability of as-cast aluminum alloys. In this study, the QI index was calculated according to Drouzy, per the following formula [32,33]:
QI = UTS + d·log(A)
where UTS—ultimate tensile strength; A—elongation; and d—experimentally chosen coefficient, depending on the alloy type (in the case of casting hypoeutectic Al–Si alloys, the most often chosen value is 150).
The hardness was obtained with the NEXUS 3000 hardness tester per the ISO 6506—1 standard [34]. The method used was HBW 5/250, and the resulting values were the average of the six total measurements.
The Charpy impact test was performed on the Charpy tester with a nominal energy of 300 J. These tests provided information about the resistance of the material to impact loading. The final resulting value at each state was obtained by an average of at least six measurements.
Fatigue tests were performed on the experimental device KOUPT for rotating-bending fatigue testing on specimens, per Figure 1b. All details regarding the test methodology, e.g., test setup, temperature control, data recording, and others, complied with STN 42 0363 [35]. During rotation stress at the gauge length, the sinus changed from maximum tension to maximum pressure. It means that it was a symmetrical load with a stress asymmetry ratio of R = −1 at room temperature, T = 20 ± 5 °C. The testing device was powered by an electric motor, and the load frequency depended on its speed, which in our case was 30 Hz. The recording of the number of applied cycles was determined using the revolution counter.
Two fatigue test types were performed: (a) a fatigue test on the rotation-bending device at room temperature without a corrosive environment (Figure 3a,b) a fatigue test on the rotation-bending device at room temperature with a corrosive environment (Figure 3b). A 3.5 wt.% NaCl solution was used as a corrosive environment. To verify the effect of the corrosive environment during the cyclic loading of the samples, a solution of 3.5% NaCl was continuously applied to the stressed area with the use of a wick during rotation. During the fatigue test, it was checked whether the wick was immersed in a solution and transported to the stressed area. These measurements were performed under the same conditions as the fatigue tests of the specimens without the application of corrosive solution, and under the same loads.

3. Results and Discussion

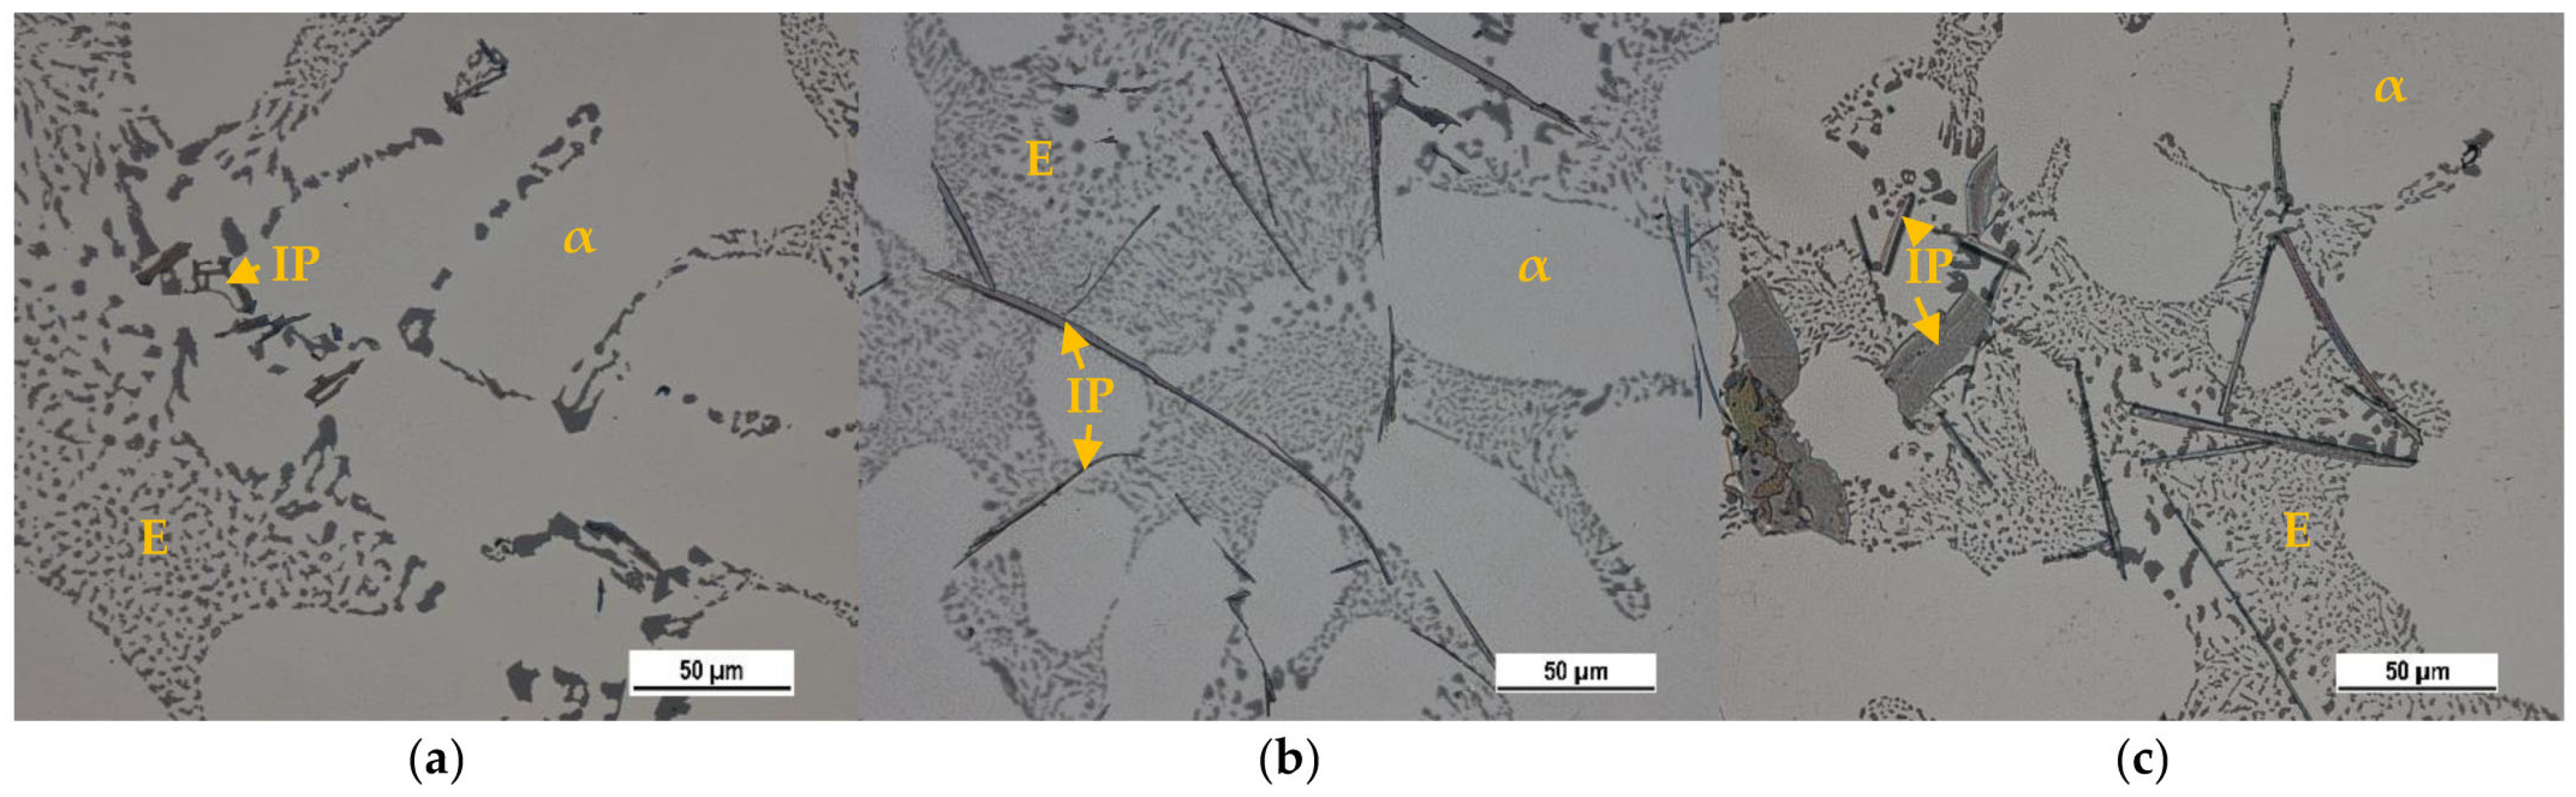
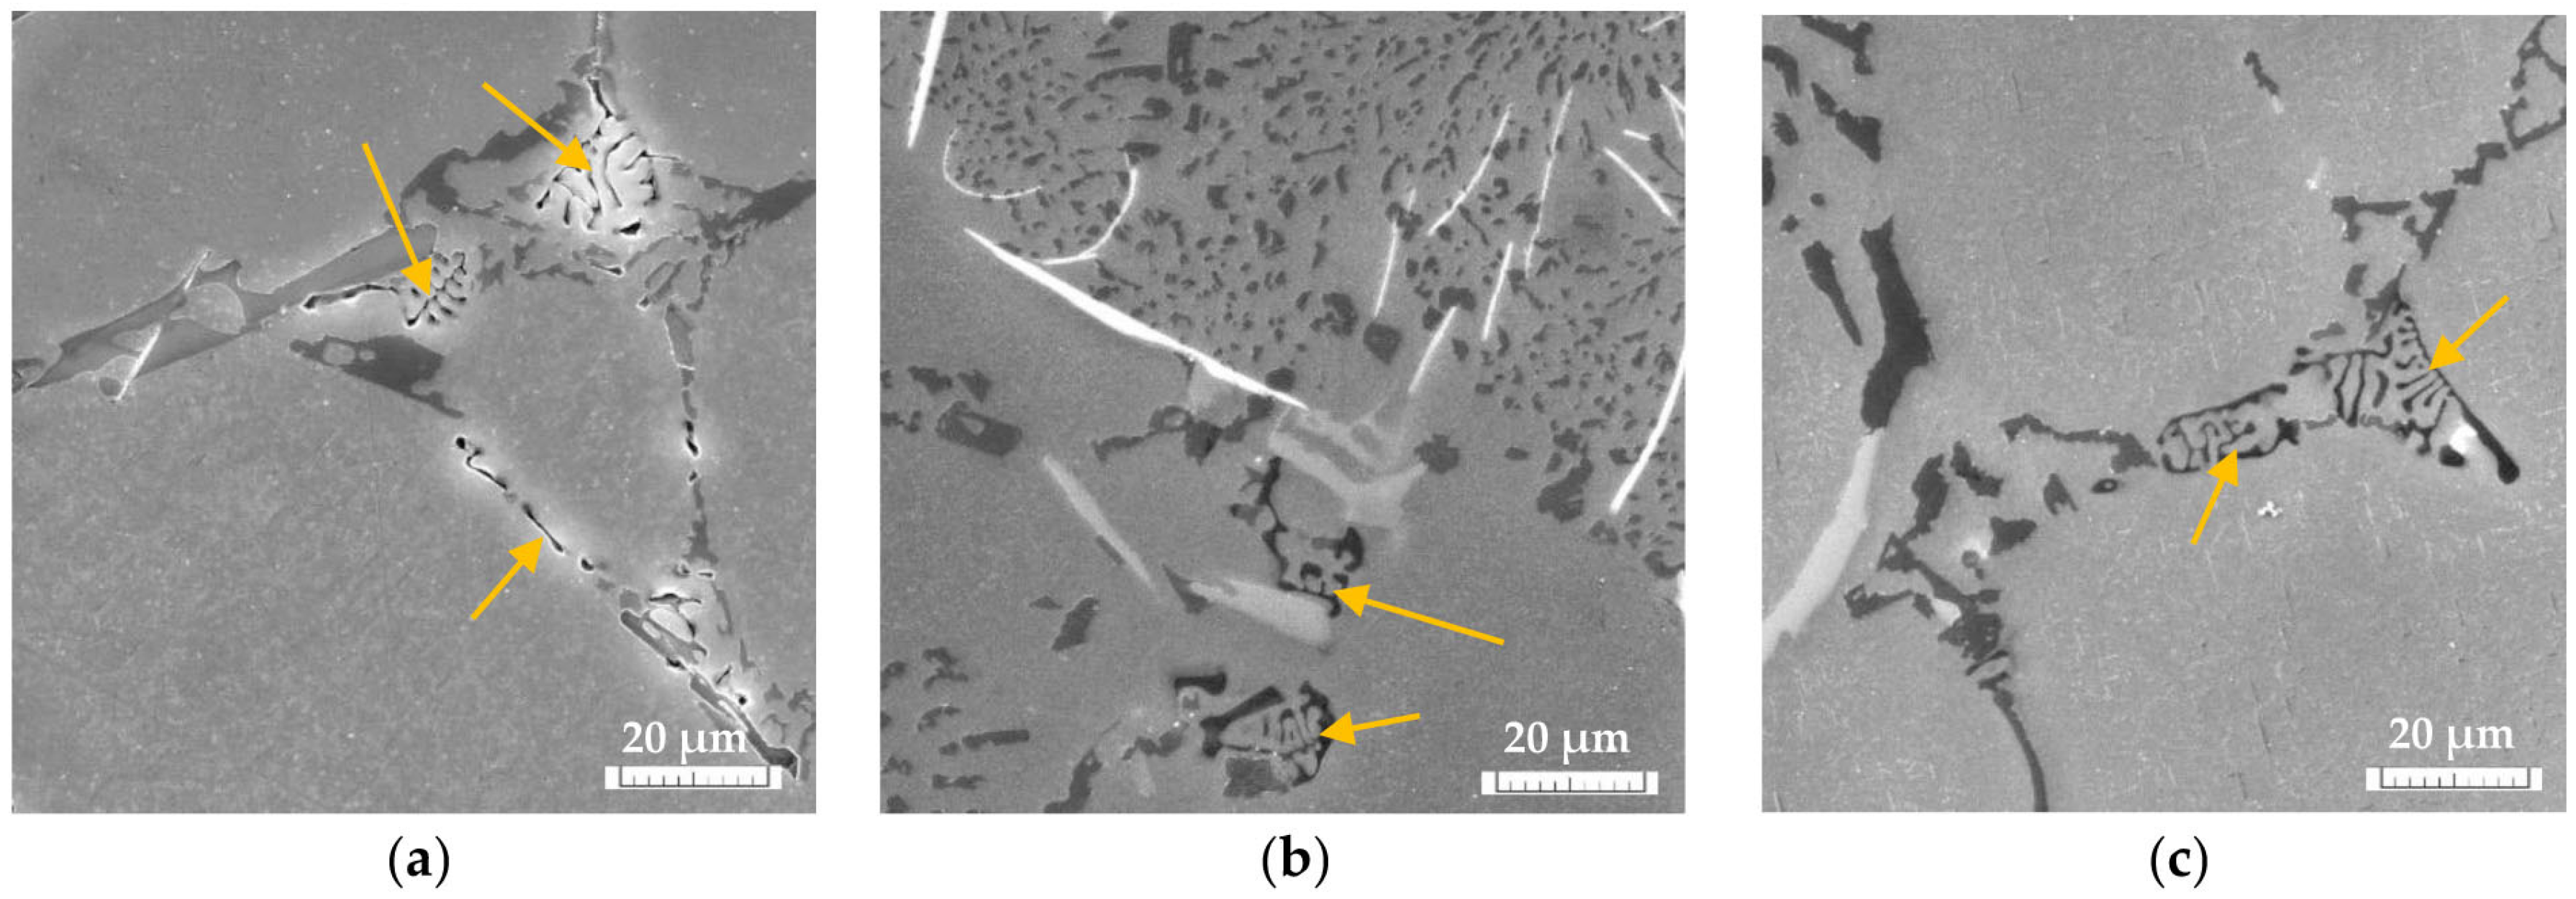
3.1. Basic Microstructure

The microstructure analysis demonstrated the presence of general microstructural constituents: the matrix (α-phase), the eutectic (a mechanical mixture of α-phase and eutectic Si), and intermetallic phases with different chemical compositions (Figure 4). The effect of higher Fe content on the basic microstructural features and porosity in the same experimental materials was evaluated in our previous study [36]. Its results show the effect of increased Fe content on forming longer Fe-rich phases in form needles (Figure 4b), eutectic Si morphology changes (Figure 4), and porosity formations. The formation of finer eutectic Si particles was confirmed as a result of the increasing formation of the Fe plate-like phases in the microstructure (Figure 4). The length of the Fe needle-like phases affected the pore growth, too. The longest phases (in alloy B) led to the formation of smaller pores than in alloys A and C [36].
The identification of the intermetallic phases observed in the experimental AlSi7Mg0.3 materials was completed with a morphology study on an optical microscope and with energy-dispersive X-ray analysis on a scanning electron microscope (EDX). Intermetallic phases based on Fe, Mn, and Mg were identified using EDX analysis, as follows: Mg2Si (in the form of globular particles), Al15(FeMn)3Si2 (in the form of skeleton-particles), and Al5FeSi (in the form of platelets), as documented in Figure 5 and Figure 6 [11,12,36].

The Effect of Fe on the Mg2Si Intermetallic Phases

The effect of the higher Fe content on the quantity and morphology of the Mg2Si intermetallic phases was studied in this experiment, and they show their presence in the form of dark-black oval grains connected to small, fine skeleton particles (Figure 7). The area fractions measured by using image analysis of the Mg2Si phases ranged from 0.1 to 0.35%, while no direct relationship was observed between the increased Fe content and the quantity and size of the Mg2Si phases. All of the experimental materials contained a comparable quantity and size of these phases.

3.2. Effects of the Corrosive Environment on Mechanical Properties

The results of the static tensile test and hardness test (Table 2) showed negligible differences between the different material melts. Immersion of the specimens into a corrosive environment had minimal effect on the UTS, hardness, and ductility of the alloys, and the differences in the results can be considered as a standard material scatter. This behavior can be considered as expected since material degradation is rarely possible to identify using mechanical tests with a low loading rate. The influence of the Fe content and the corrosion attack on the material is possible to observe in the results of the Charpy test—loading with a high deformation rate. The impact energy (Table 2) decreased with the increasing Fe content in the as-cast materials, and exposition to a corrosive environment caused a further decrease in the resistance to impact loading. These results correlate with the conclusions of the authors of [37,38,39,40] that the presence of a higher quantity of Al5FeSi Fe-rich phases increases the material’s tendency toward brittle fractures. The effect of the corrosive environment on the decrease of all mechanical properties in materials containing more Fe, as demonstrated by the authors of [11,20,21,41], was not confirmed. Our results show that impact energy correlates with the results of the authors of [11,20,21,41].
The quality indices (Table 3) calculated per Equation (1) show that both alloys with increased Fe content (materials A and B) had higher quality indices before exposure to corrosive environments than the primary alloy (material A). When the materials were exposed to a corrosive environment, the quality index of the primary alloy (material A) was almost identical to the as-cast condition, but the indices of the secondary alloys (materials B and C) decreased significantly. However, there was no significant difference in the quality index of the secondary alloy despite the significant difference in the iron content. This also demonstrates that all materials affected by a corrosive environment have comparable quality indices with no relation to the Fe content. The results of mechanical tests and the quality indices confirmed that higher Fe content and a corrosive environment are not critical for these experimental materials, and they could be used for many common applications in the automotive industry.

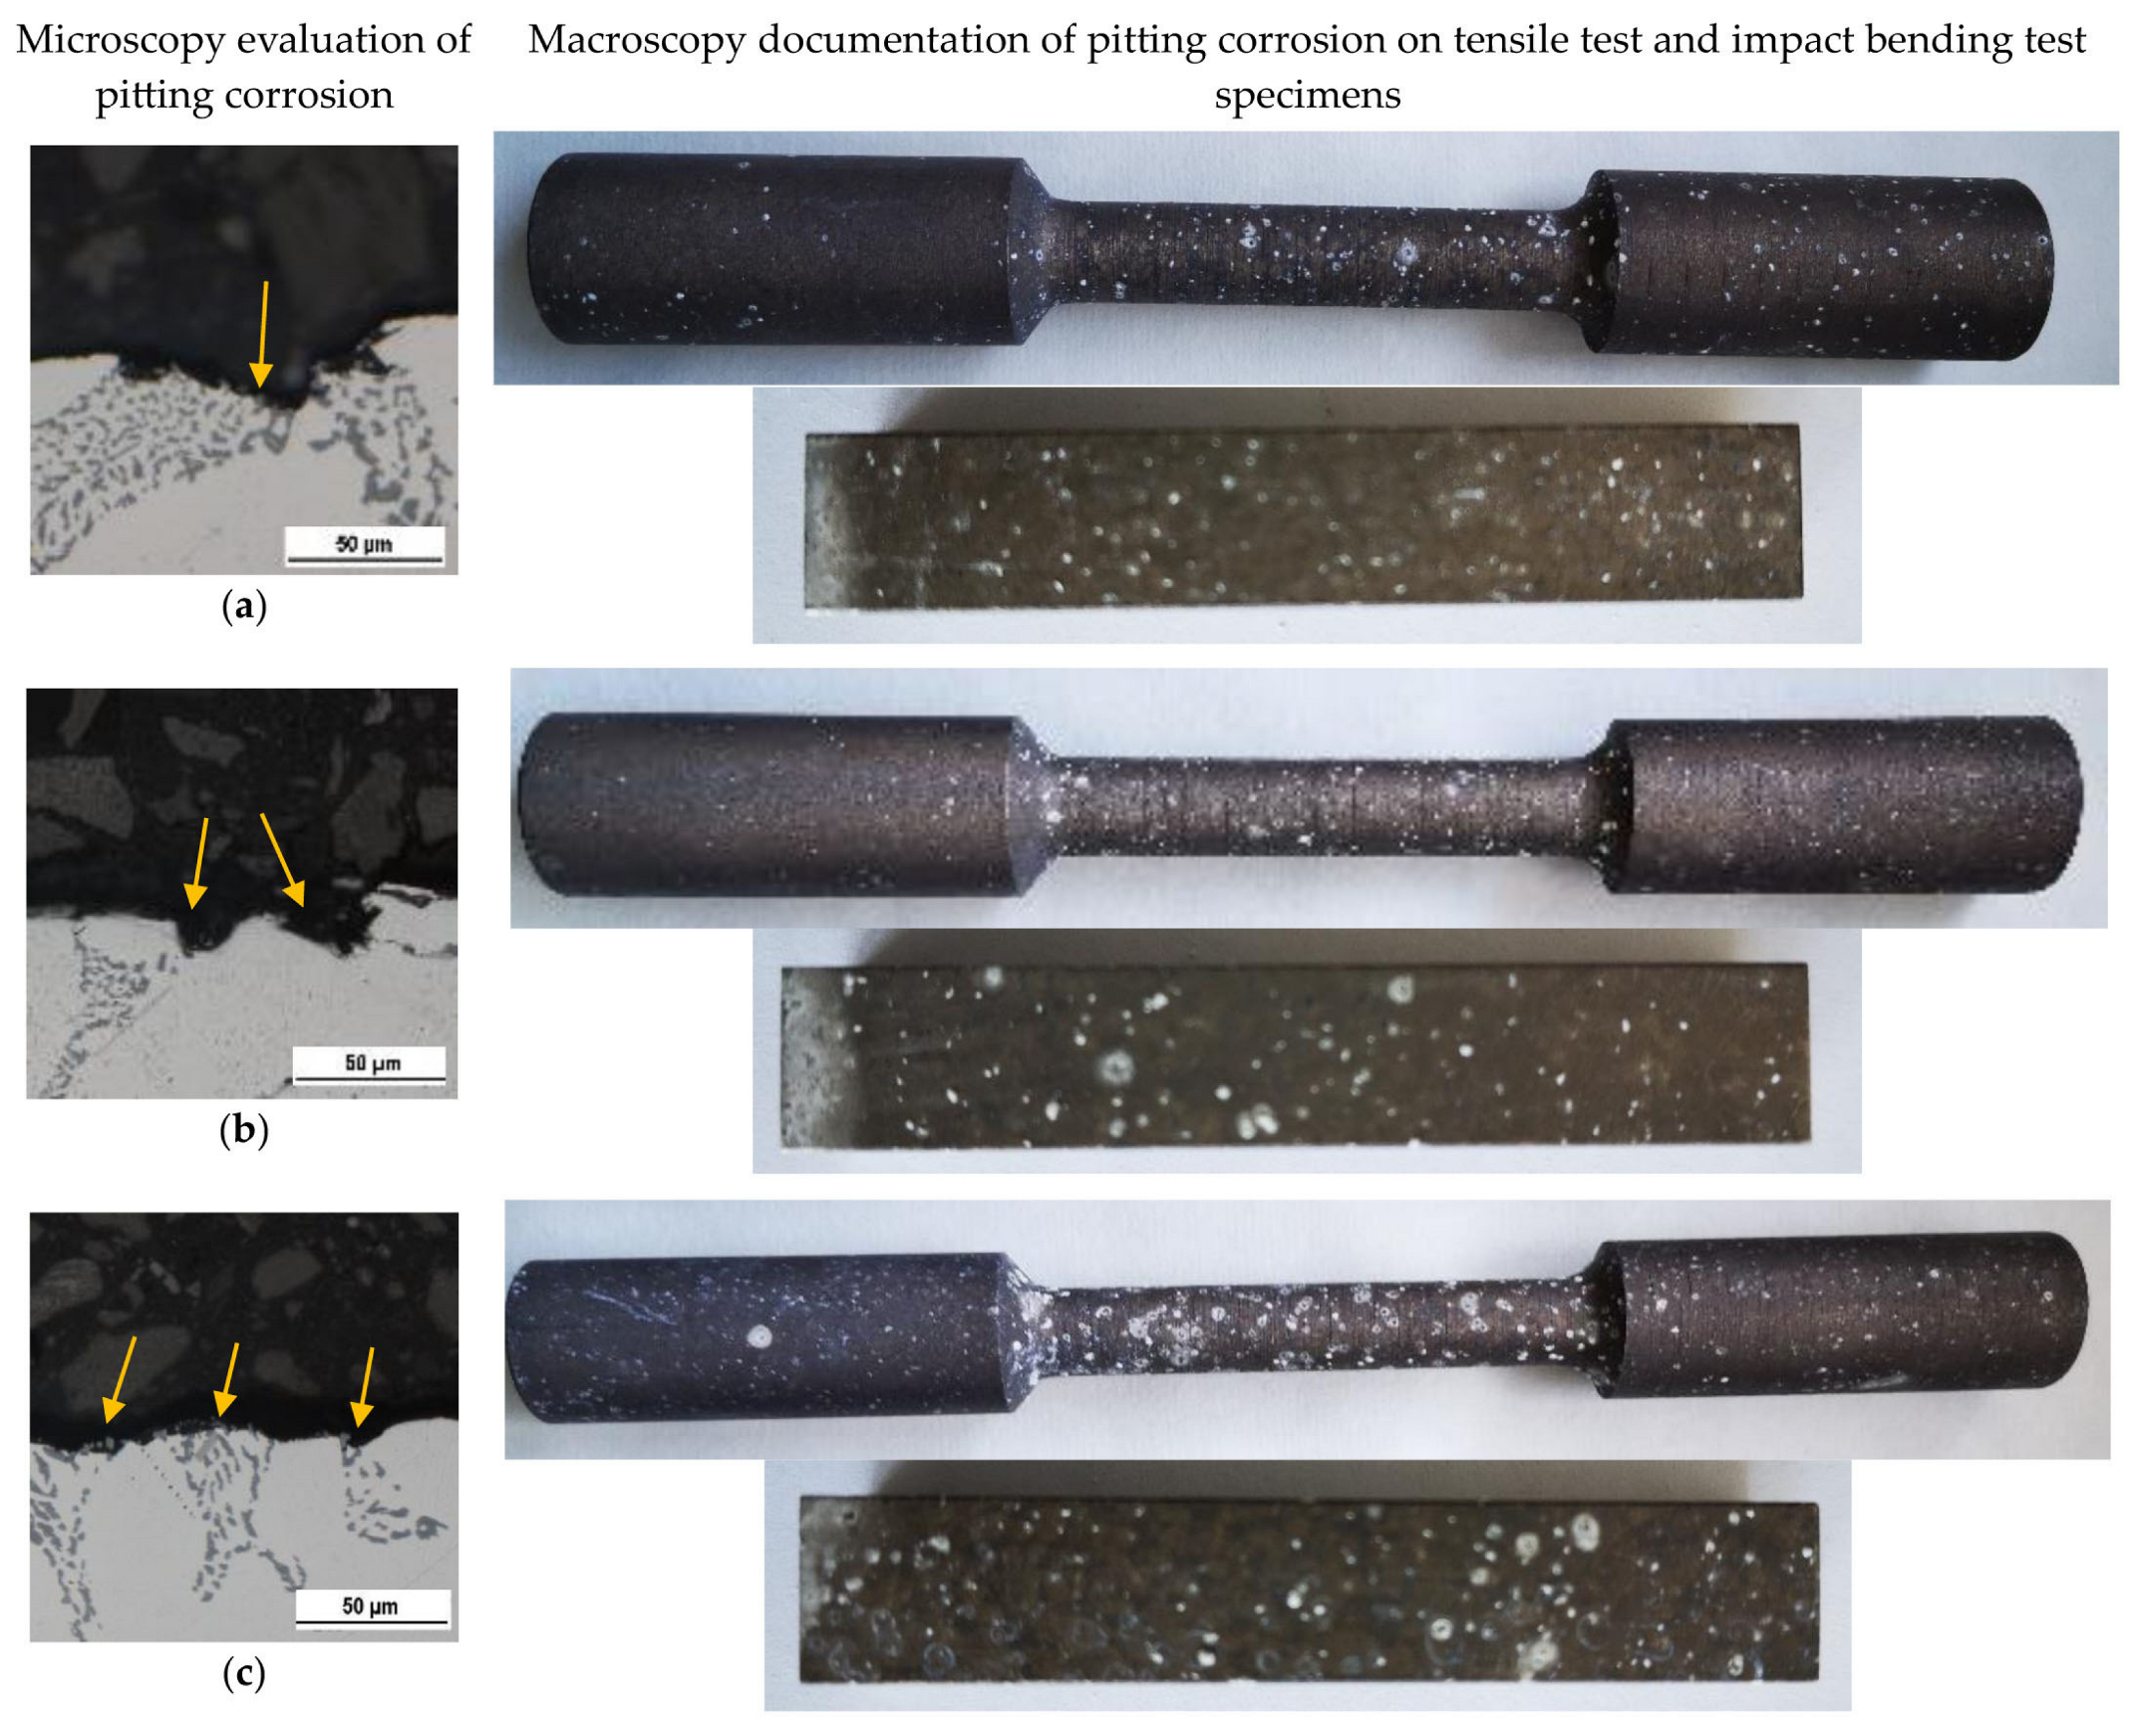
Evaluation of the Corrosion Attack on Tested Specimens

The optical evaluation of the corrosion attack showed the presence of pitting corrosion on each experimental material (Figure 8). We demonstrated a more detailed investigation of the pits in the experimental materials with higher Fe content in our research work [42].
An increase in the occurrence and size of the corrosion pits was observed with increasing Fe content (Figure 8). The appearance of the corrosion attack was comparable between the specimens for the tensile test and the specimens for the Charpy impact test. The observation of the corrosion attack (Figure 8) confirms the results of Osório et al. [43,44] that increasing the Si content causes a detrimental effect on the electrochemical corrosion resistance. This correlates with the results of the microstructure changes—the higher Fe content leads to a decrease in the size of the eutectic Si, thus resulting in the increase in the quantity of these particles. Locations with an increased number of Si particles are more prone to the initiation of pitting corrosion as a result of the different potential of structural constituents, as written in the research [15,16,17,18,19]. The influence of the higher content of Fe on the increasing pitting corrosion of Al alloys is also confirmed by the research work of Samuel et al. [11]. The results of this study confirm that the higher amount and smaller size of the eutectic Si led to increased amounts of corrosion pitting (Figure 8). However, it should not be forgotten that these changes are related to the increasing quantity of Fe platelet phases in the microstructure, due to the higher content of Fe.
For documentation of an increasing number of point corrosion pits on the surfaces, quantitative measurements of the surface area, diameter (marked as D in Table 4 and Figure 9), and circumference (marked as P in Table 4 and Figure 9) of the corrosion pits (Figure 9 and Table 4) were used. The corrosion products were carefully removed from the surfaces to reveal only the size of the pit. The results confirm the presence of larger corrosion pits on the surfaces of materials with higher Fe content and the increase of the maximum area of the pits with the increasing Fe content. The minimum and average values of the other measured parameters confirm comparable results for each experimental material.

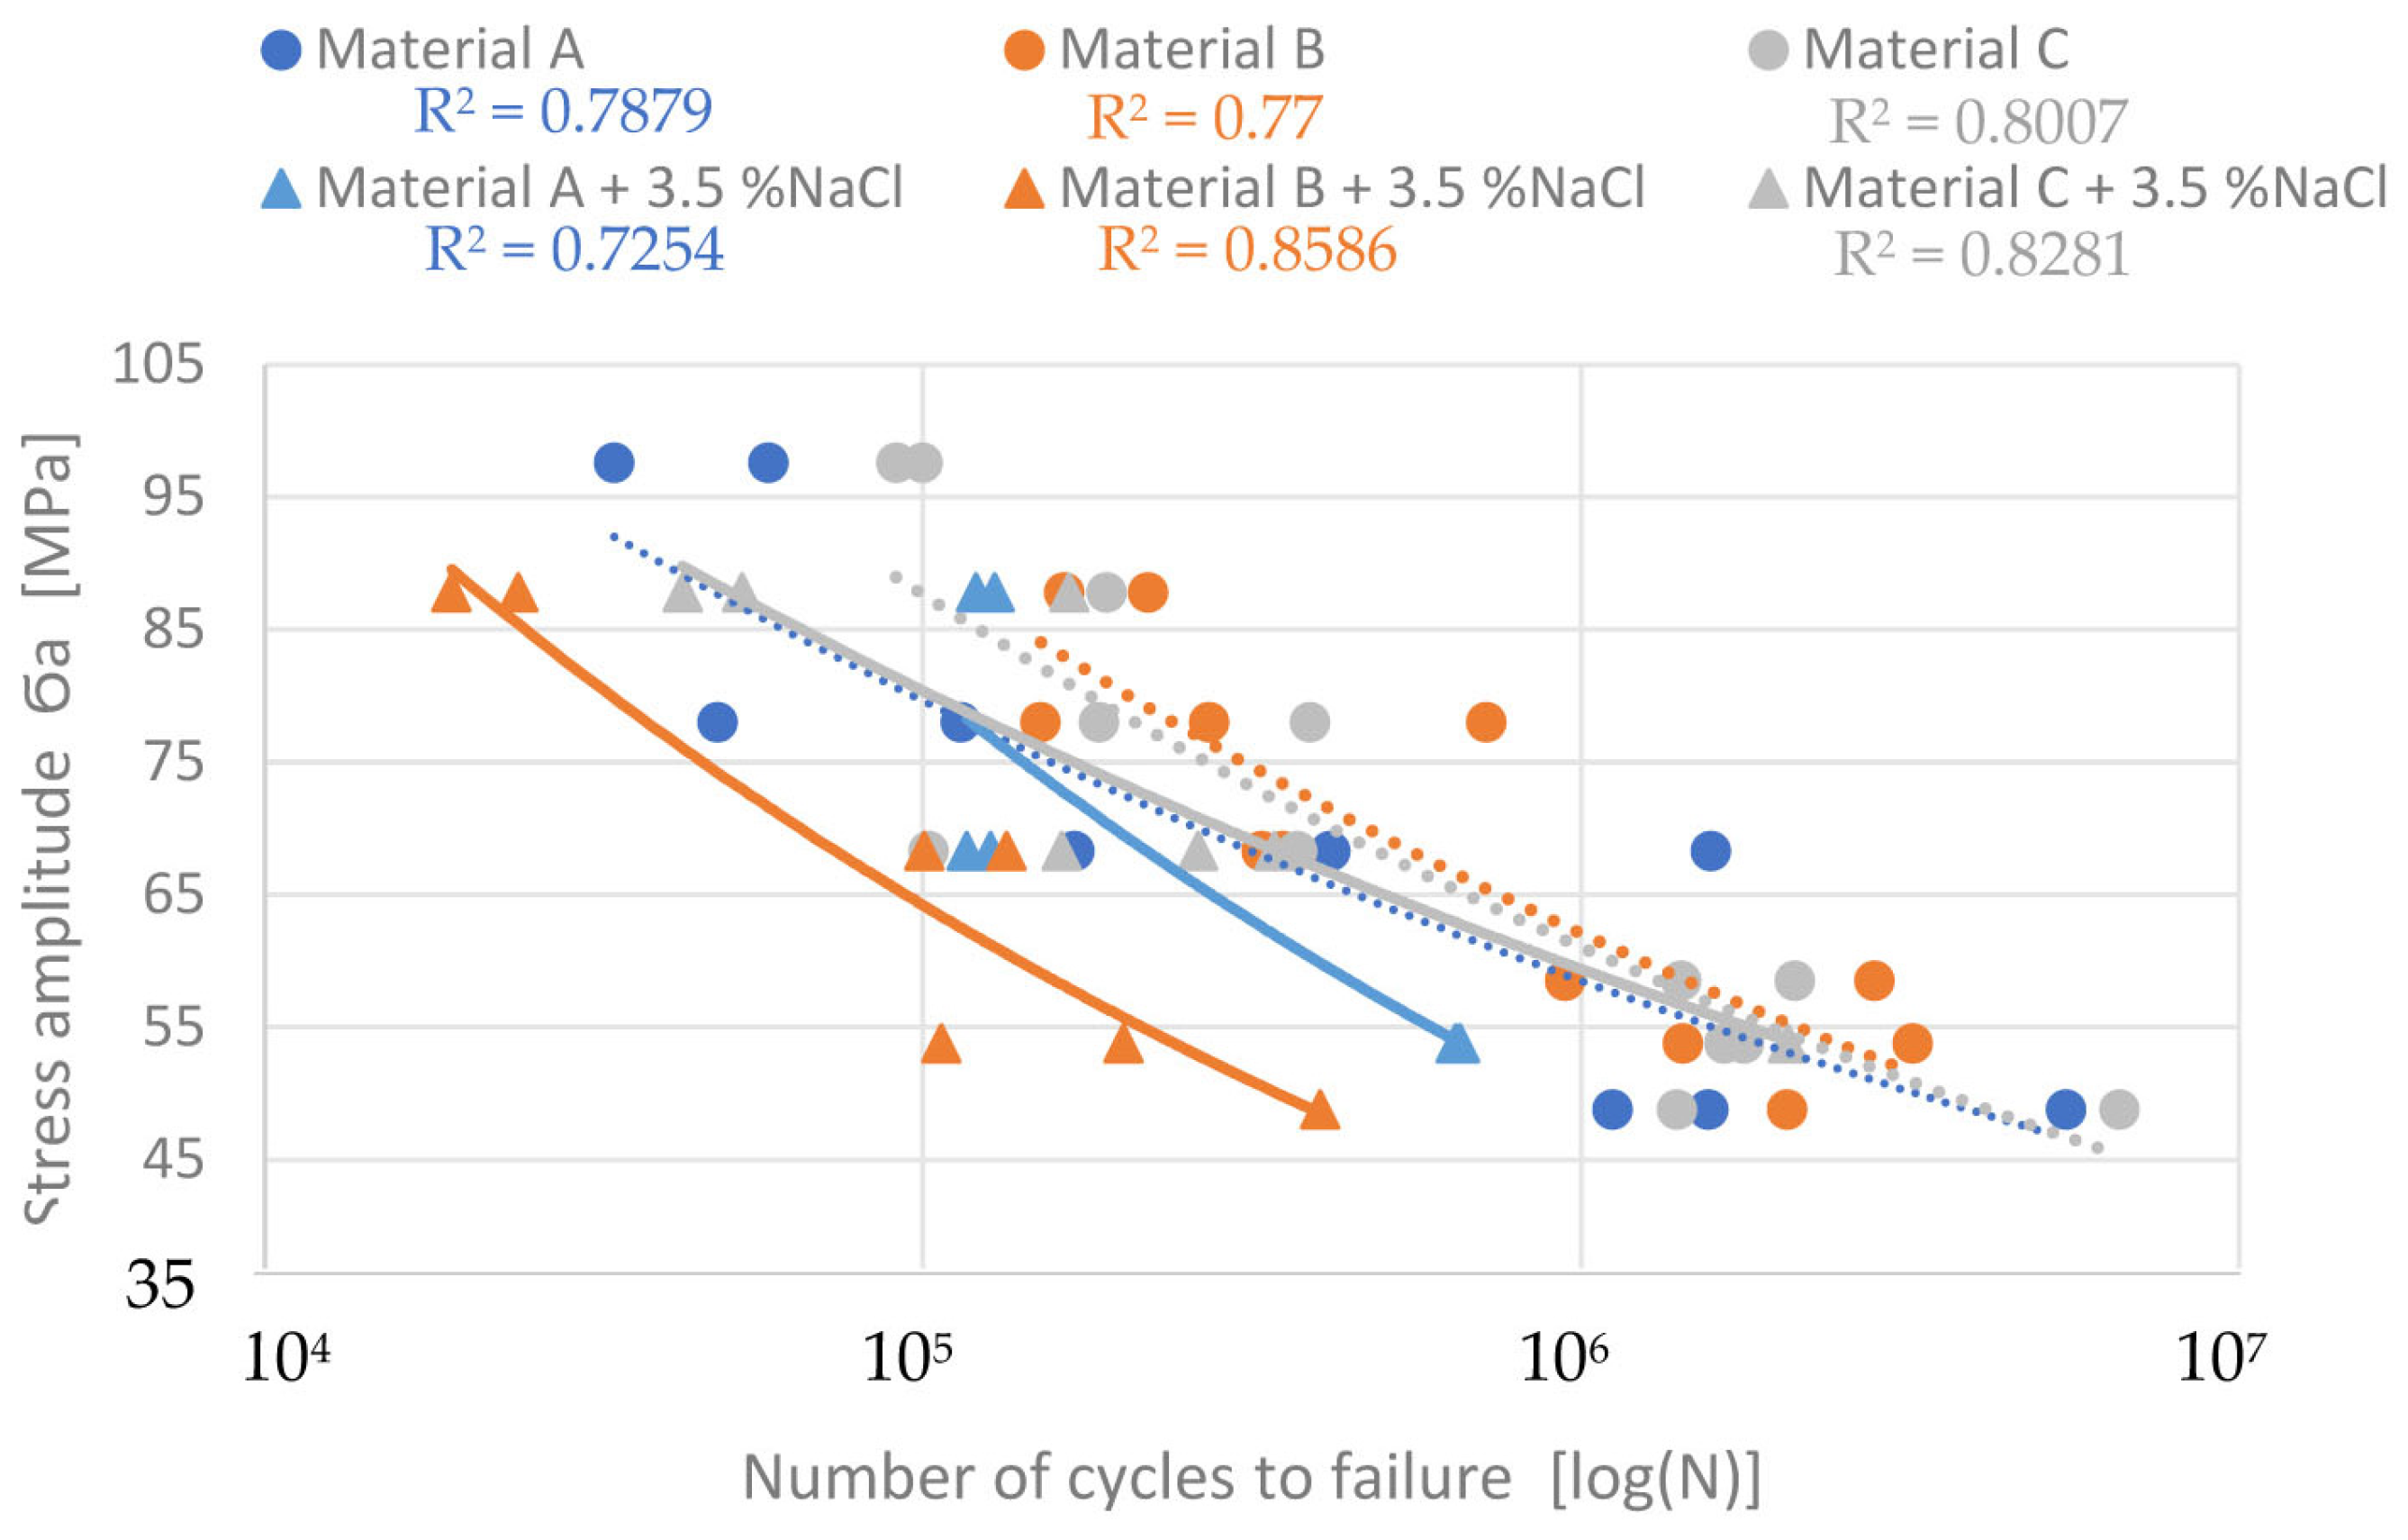
3.3. Effects of the Corrosive Environment on Fatigue Properties

One of the main experimental interests was to determine the results of the corrosive environment on the fatigue properties of experimental alloys, which had different Fe content. The fatigue life of the experimental materials was defined as the highest applied stresses which a specimen could withstand for Nc = 3 × 10⁵ cycles (Figure 10). A previous study by Kuchariková (2021) [36] demonstrated the effect of Fe content on the fatigue properties of these experimental alloys before a corrosion attack (pointed lines in Figure 10), and it shows that with a decrease in the stress amplitude, the fatigue properties of alloys with a higher content of Fe fell sharply, and they were lowest in the alloys with chemical compositions closest to the standard (alloy A without increased Fe content). When materials were under higher stress amplitude than 60 MPa, the better fatigue properties were obtained by materials with higher Fe content.
The fatigue properties of the materials affected by the corrosion showed a significant drop in fatigue toughness when compared to the as-cast state (Figure 10). Again, a direct correlation between the iron content and fatigue properties was not confirmed. The experimental material C, with the highest Fe content, had the best fatigue properties. The values of fatigue toughness for Nc = 3 × 10⁵ cycles are shown in Table 5.
According to the S–N curves, the material with the longest and thinnest Fe platelet phases (material B) had the worst fatigue properties after a corrosion attack, but without exposure to corrosion, the material had the best fatigue properties. A significant decrease in fatigue properties was observed in material A (a primary alloy with the lowest Fe contamination) at lower stress amplitudes. Material C had comparable fatigue properties at a smaller stress amplitude (Figure 6).
The Basquin equation is commonly used to model the fatigue data trend for different numbers of cycles by using the statistical calculation of the S–N curves (Figure 10). The Basquin equation has the form [45,46,47]:
σa = σ’f (Nf)b
where σ’f is the fatigue strength coefficient and b is the fatigue life exponent. Therefore, for better visualization of the effects of the corrosive environment, statistical calculations were used, and the Basquin equations obtained for experimental materials in different states were:
Material A: σa = 372.02 × Nf(−0.134), Material A + 3.5% NaCl: σa = 986.79 × Nf(−0.217),
Material B: σa = 567.35 × Nf(−0.160), Material B + 3.5% NaCl: σa = 653.96 × Nf(−0.202),
Material C: σa = 535.69 × Nf(−0.157), Material C + 3.5% NaCl: σa = 365.29 × Nf(−0.131)
The applications of the Basquin equation are shown in Figure 11. These predicted curves point to the fact that the highest Fe content does not lead to decreased fatigue properties. It also demonstrates that material C has the best fatigue life after a corrosion attack. Moreover, it seems to have better properties than the same material without a corrosion attack (Figure 11).

3.4. Effects of the Corrosive Environment on Fracture Surfaces

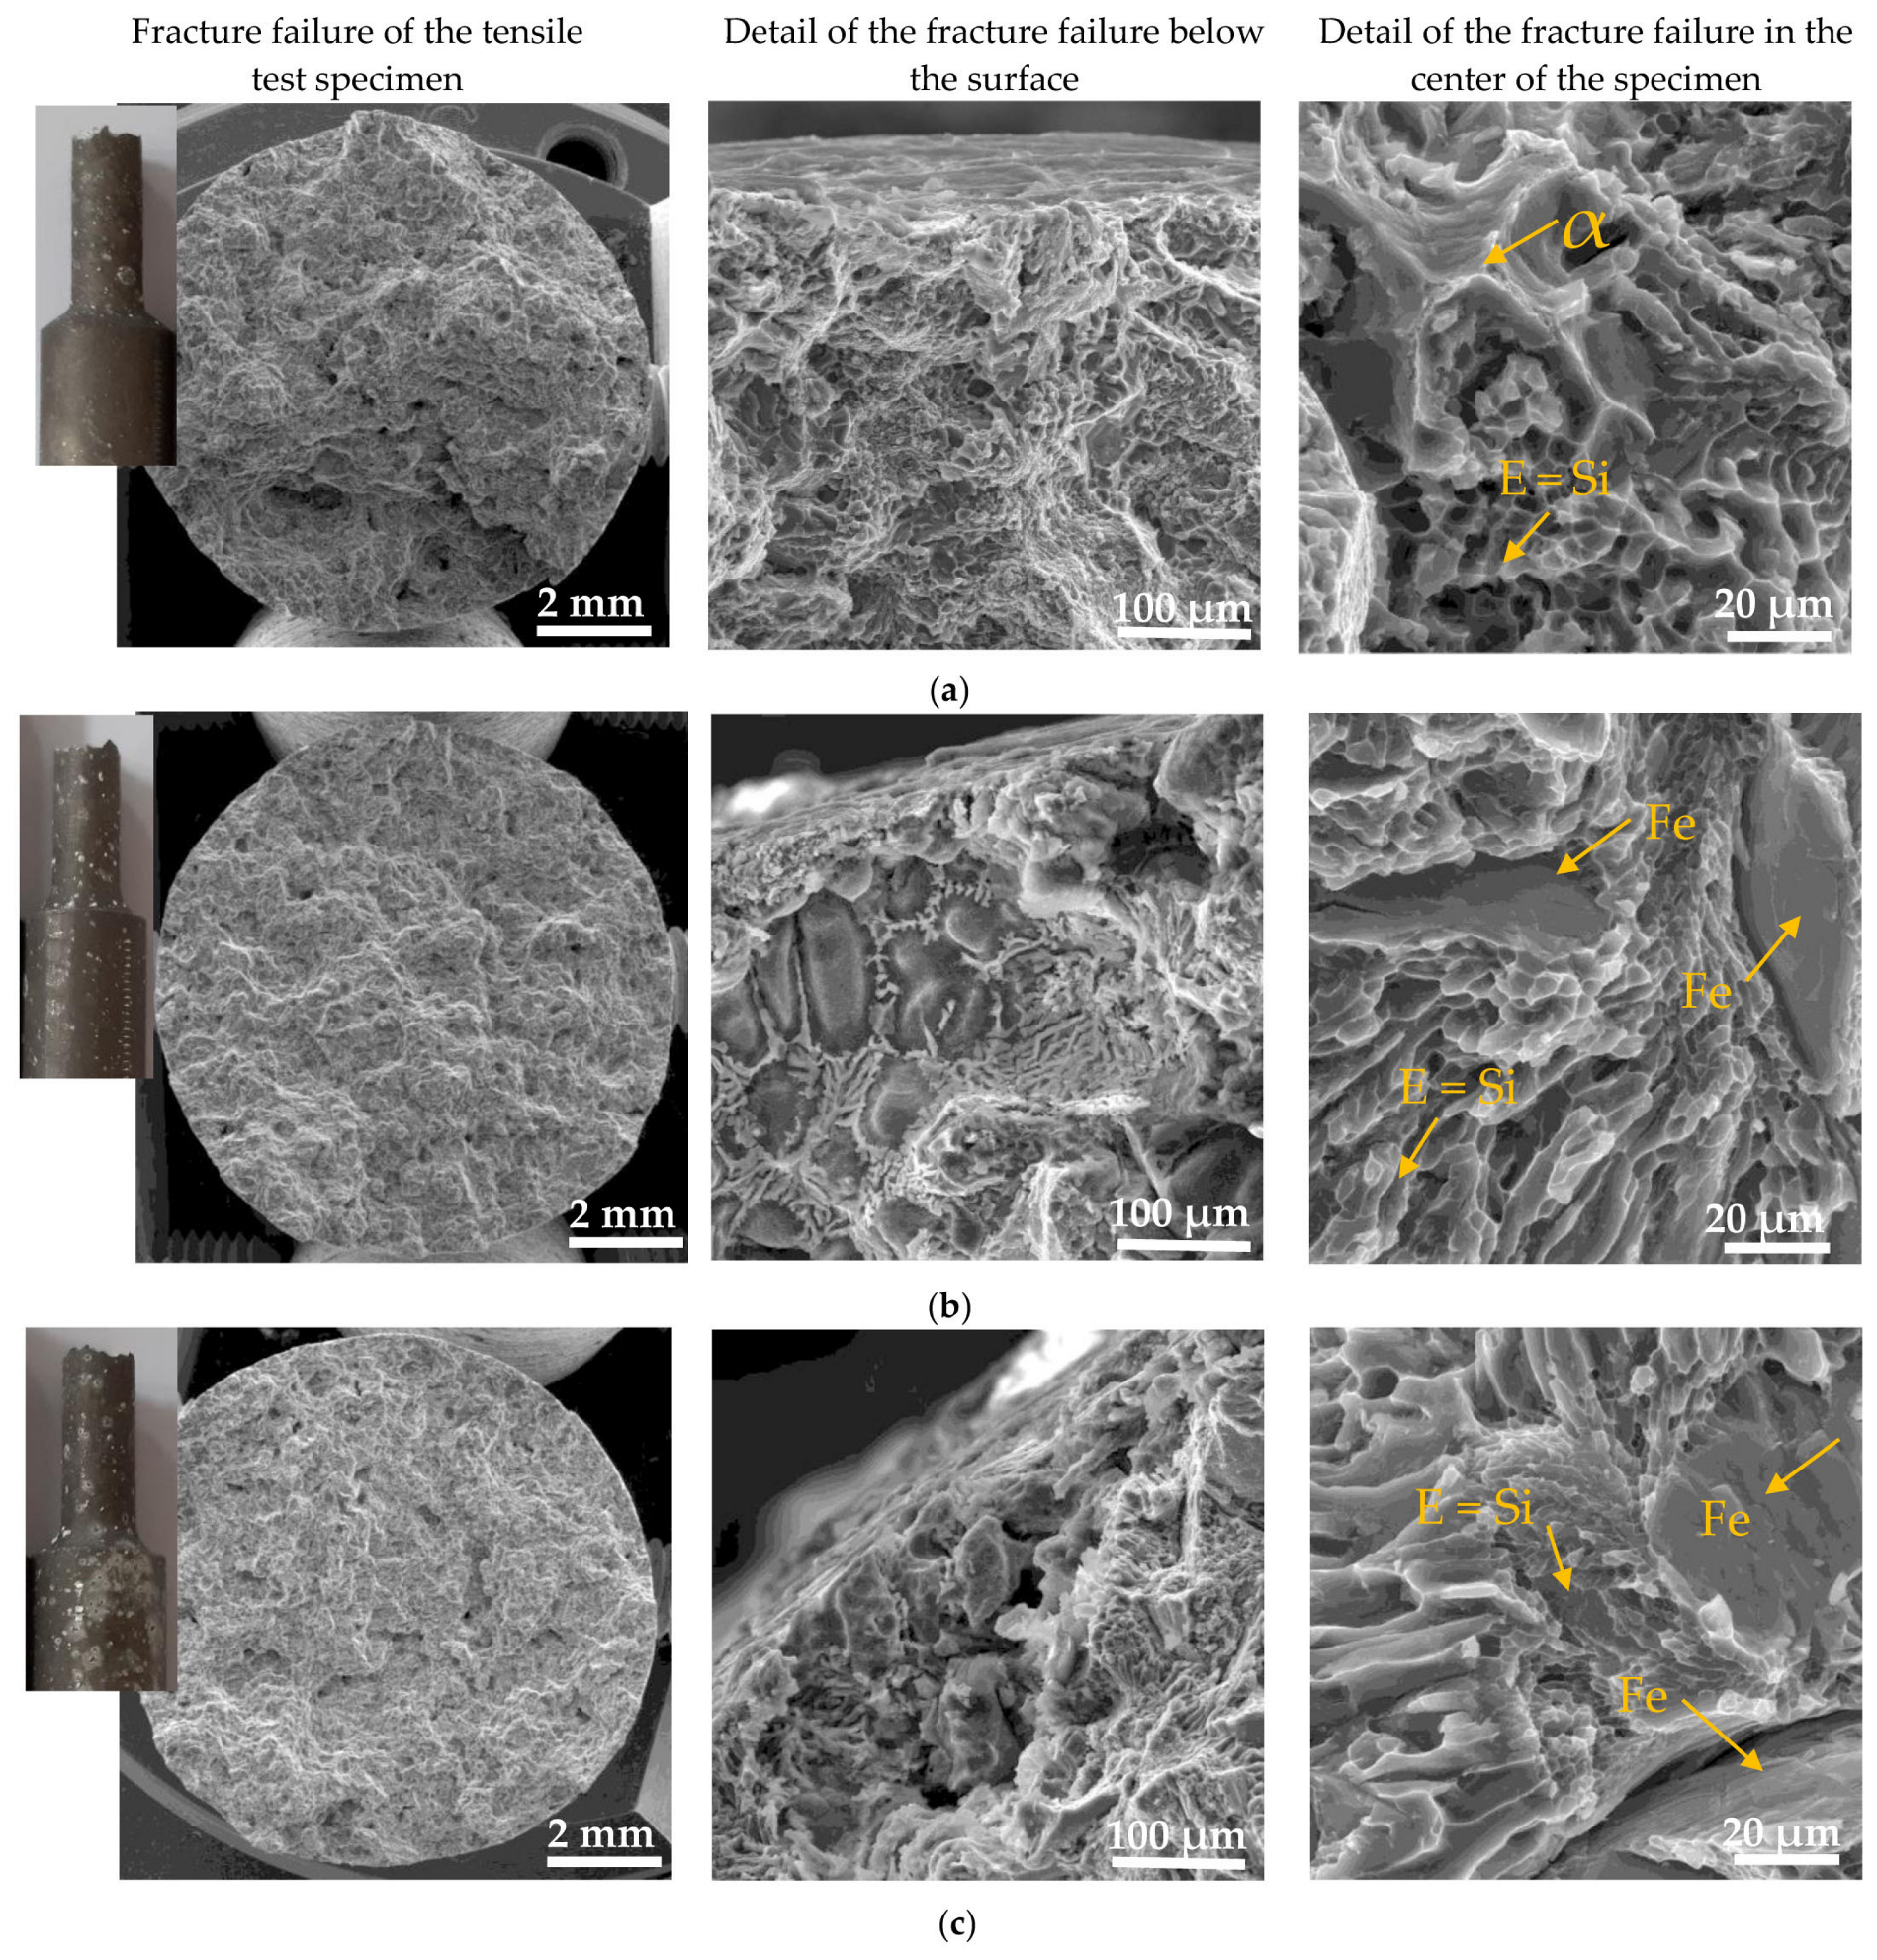
3.4.1. Fracture Surfaces after Tensile Strength and Charpy Impact Tests

The character of the fracture surfaces of the specimens after the tensile test was mixed and consisted of transcrystalline cleavage fractures and transcrystalline ductile fractures. This character of fracture surface correlates with the results of other research works [48,49,50]. A macrofractography assessment of fracture failure did not show a great effect of the higher Fe content on the increasing fragmentation of fracture surfaces (Figure 12). The presence of corrosion products was documented in the details of the fracture failure below the surface (Figure 12). This microfractographic assessment showed that material A was not affected by the corrosion in its greater depth (Figure 12a). Increasing the Fe content led to the penetration of the corrosion into greater depths (Figure 12b,c). The microfractographic analysis of the fracture surfaces in the center of the specimen also showed the presence of a mixed fracture. A fine transcrystalline ductile fracture with a higher presence of the ductile ridges of the matrix was typical for material A. Phase identification was possible to perform according to the morphology of individual features based on the work of Taylor [12], where phase character reconstruction was performed. The increasing quantity of brittle Fe needle phases led to increased transcrystalline cleavage fracture content in materials B and C. In addition, changes in the finesse of the transcrystalline ductile fractures, which is connected with changes in the size of the eutectic Si in the microstructure, were observed (Figure 4 and Figure 12).
The character of the fracture surfaces of the specimens after the Charpy impact test was comparable with the observation of the specimens after tensile tests—fracture surfaces with mixed-crack propagation mechanisms. It also consisted of transcrystalline cleavage fractures and transcrystalline ductile fractures. The macrofractography assessment of the fracture surfaces did not show a great effect of the higher Fe content on the increasing fragmentation of fracture surfaces. The character of the fracture profile was similar for each experimental material (Figure 13). The presence of corrosion products is documented in detail in Figure 13. This microfractographic assessment proved that material C had a lot of corrosion products on the surface, but material B was comparable with material A. The microfractographic analysis of the fracture surfaces in the center of the specimens again demonstrated the presence of a mixed fracture, as in tensile test specimens. A fine transcrystalline ductile fracture with a higher presence of ductile ridges in the matrix was typical for material A (Figure 13a). The increasing quantity of brittle Fe platelets led to an increase of the transcrystalline cleavage fractures in materials B and C (Figure 13b,c). In addition, changes in the finesse of the transcrystalline ductile fractures, which relates to changes in the size of the eutectic Si in the microstructure, were observed (Figure 4 and Figure 13).

3.4.2. Fracture Surfaces after Fatigue Tests

The effect of the higher Fe content on the fatigue fractures was studied in previous research work [36]. These fatigue results and fractography analyses have not confirmed the results of Wang et al. [51] or Caceres et al. [52] suggesting that large Fe-rich phase particles are the main contributing factor for fatigue failure. As declared in our work [36], the crack initiation sites were locations of surface or near-surface porosity. The presence of Fe-rich phases did not lead to the initiation of fractures, but in all the experimental materials, fatigue cracks were initiated on pores. The presence of a higher number of initiation locations in specimens with higher Fe content correlates with the results of the porosity ratio and their size.
This study of the corrosive environment attack on fatigue fracture surfaces confirms that the same microstructural parameters relate to initiation, but around these places, corrosion products were observed (Figure 14). The initiation places were near-surface pores. An increase in the number of initiation locations (Figure 14), as a result of higher porosity, is connected with higher Fe content, as was mentioned previously.
The fractography analysis of the fatigue region showed the presence of the typical fatigue fracture of a matrix on each specimen (Figure 15), but the presence of striation was difficult to observe because of the presence of oxide films on the failures of specimens without the corrosion attack (Figure 15a) and with effects on the fatigue regions after the corrosion attack (Figure 15b). The smooth areas in the fatigue regions were related to the presence of the long Fe platelet-like phases in this type of experimental material.
The final static rupture (Figure 15) shows a mixed transcrystalline ductile and transcrystalline cleavage fracture after the tensile test and Charpy impact tests. Transcrystalline ductile fractures relate to the matrix, and the size of the dimple depends on the fineness of the eutectic Si particles [52,53,54,55,56]. Transcrystalline cleavage fractures depend on the size and quantity of Fe phases and eutectic Si particles. The presence of corrosion product on the static rupture of the fatigue specimens was not observed (Figure 15b).

4. Conclusions

This study focused on the effects of a corrosive environment on the basic mechanical properties and fatigue property changes in aluminum casts formed from secondary alloys. The study was chosen with respect to the industrial application of sand castings from AlSi7Mg0.3 and brings the following results.
The microstructure of secondary materials (with higher Fe content) is completely comparable with the base microstructure of primary alloys and contains the same microstructural constituents. The difference was observed in the increased quantity and size of Fe platelet phases. The presence of long phases leads to decreased size of the eutectic Si, which affects the results of the mechanical properties in a positive direction.
The UTS and HBW of all alloys were comparable—with and without a corrosive environment. The ductility of the materials without being affected by the corrosive environment increase was again very similar for all three alloys. After the corrosion attack, a general decrease in the ductility could be observed for all materials. The impact energy decreased with the increasing Fe content in both states of the experimental materials—with and without exposure to a corrosive environment. In view of these results, it could be stated that secondary materials have comparable strength properties (UTS and HBW) to primary alloys.
Exposure to a corrosive environment caused each material to be attacked by pitting corrosion. Increasing the content of Fe led to the formation of higher quantities and greater sizes of corrosion pits; however, it must be noted, that locations which are more prone to corrosion are where the eutectic phase is present (a mechanical mixture of eutectic Si and the matrix). The decrease in size of the eutectic Si and the associated increase in their share in the microstructure correlates with creating a higher number of places with corrosion pits. Therefore, it should be noted that corrosion attacks (the size and quantity of pits) increase with increasing Fe content.
The fatigue properties after the corrosion attack were lower when compared to the as-cast state of the experimental materials. A great decrease was observed in material B, which had the best mechanical properties of the experimental materials. Material C, the one with the highest content of Fe, had the best fatigue properties after the corrosion attack. Material A (compared to typical primary alloys) had a very low fatigue life at a lower stress amplitude. Therefore, it could be stated that higher Fe content does not lead to a greater decrease in fatigue properties, but under a corrosive environment, the material behavior changes differently, and it does not depend on the Fe content.
The investigation of the tensile and impact tests of the specimens’ fracture surfaces showed the presence of a mixed-fracture character, which consisted of the transcrystalline cleavage fracture and the transcrystalline ductile fracture. This character of fractures correlates with common knowledge. The corrosive environment had the effect on the surfaces of the experimental specimens for the tensile tests and impact bending tests. The corrosion products were visible not only on the surface but on the fracture surfaces, too. The higher content of Fe led to a violation of the protective layer, which created the locations in which the corrosive environment attacked the microstructure, which were also visible on the fracture surfaces of materials B and C. More corrosion products were visible on the fatigue test specimens’ fracture surfaces, in the fatigue region of fatigue crack propagation, because the corrosive environment acted during the fatigue test.
The results of this study do not confirm a significant negative effect of the combination of higher Fe content and a corrosive environment on the greater decrease in the properties of AlSI7Mg0.3 castings, but it is necessary to conduct a complementary experiment because these materials were in the as-cast state, and their common application is after heat treatment.

Author Contributions

Conceptualization, L.K., L.P. and E.T.; methodology, L.K., V.Z., M.U. and L.P.; software, L.K., M.U., L.P. and M.Š.; validation, L.K., M.U. and L.P.; formal analysis, L.K., M.U., V.Z. and L.P.; investigation, L.K., M.U. and L.P.; resources, E.T. and L.K.; data curation, L.K. and L.P.; writing—original draft preparation, L.K.; writing—review and editing, L.K. and L.P.; visualization, L.K.; supervision, E.T.; project administration, L.K. and E.T.; funding acquisition, L.K. and E.T. All authors have read and agreed to the published version of the manuscript.

Funding

This research was funded by following grants: KEGA no. 004ŽU-4/2023 and the Project to Support Young Researchers at UNIZA, project ID: 12715 (Kuchariková).

Data Availability Statement

Data sharing not applicable.

Conflicts of Interest

The authors declare no conflict of interest.

References

  1. Schlesinger, M. Aluminum Recycling, 2nd ed.; CRC Press: Boca Raton, FL, USA, 2014; p. 282. [Google Scholar] [CrossRef]
  2. Nicoletto, G.; Anzelotti, G.; Konečná, R. X-ray Computed Tomography vs. Metallography for Pore Sizing and Fatigue of Cast Al-alloys. Procedia Eng. 2010, 2, 547–554. [Google Scholar] [CrossRef]
  3. Senčáková, L.; Virčíková, E. Life cycle assessment of primary aluminium production. Acta Metall. Slovaca 2007, 13, 412–419. [Google Scholar]
  4. Das, K.S. Designing Aluminum Alloys for a Recycling Friendly World. Mater. Sci. Forum 2006, 519–521, 1239–1244. [Google Scholar] [CrossRef]
  5. Cui, J.; Roven, H.R. Recycling of automotive aluminium. Trans. Nonferrous Met. Soc. China 2010, 20, 2057–2063. [Google Scholar] [CrossRef]
  6. Bakedano, A.; Niklas, A.; Fernández-Calvo, A.I.; Plata, G.; Lozares, J.; Berlanga-Labari, C. Comparative Study of the Metallurgical Quality of Primary and Secondary AlSi10MnMg Aluminium Alloys. Metals 2021, 11, 1147. [Google Scholar] [CrossRef]
  7. Tillová, E.; Chalupová, M.; Hurtalová, L. Evolution of the Fe-rich phases in recycled AlSi9Cu3 cast alloy during solution treatment. Communications 2010, 12, 95–101. [Google Scholar] [CrossRef]
  8. Svobodova, J.; Lunak, M.; Lattner, M. Analysis of the Increased Iron Content on the Corrosion Resistance of the AlSi7Mg0.3 Alloy Casting. Manuf. Technol. 2019, 19, 1041–1046. [Google Scholar] [CrossRef]
  9. Wu, J.; Djavanroodi, F.; Gode, C.; Attarilar, S.; Ebrahimi, M. Melt refining and purification processes in Al alloys: A comprehensive study. Mater. Res. Express 2022, 9, 032001. [Google Scholar] [CrossRef]
  10. Boromei, L.; Ceschini, L.; Morri, A.; Nicoletto, G.; Riva, E. Influence of the solidification microstructure and porosity on the fatigue strength of Al-Si-Mg casting alloys. Metall. Sci. Technol. 2010, 2, 18–24. [Google Scholar]
  11. Samuel, A.M.; Samuel, F.H.; Doty, H.W.; Valtierra, S. Beta Al5FeSi phase platelets-porosity formation relationship in A319.2 type alloys. Int. J. Met. Cast. 2018, 12, 55–70. [Google Scholar] [CrossRef]
  12. Taylor, J. Iron-containing intermetallic phases in Al-Si based casting alloys. Procedia Mater. Sci. 2012, 1, 19–33. [Google Scholar] [CrossRef]
  13. Hadzima, B.; Liptáková, T. Fundamentals of Electrochemical Corrosion of Metals, 1st ed.; Edis: Žilina, Slovakia, 2008; p. 116. (In Slovak) [Google Scholar]
  14. Ricker, R.; Duquette, D. Corrosion Fatigue of Aluminum Alloys. In Proceedings of the First Joint DoD/FAA/NASA Conference on Aging Aircraft, Ogden, UT, USA, 8–10 July 1997. [Google Scholar]
  15. Esmaily, M.; Blüche, D.B.; Svensson, J.E.; Halvarsson, M.; Johansson, L.G. New insights into the corrosion of magnesium alloys—The role of aluminum. Scr. Mater. 2016, 115, 91–95. [Google Scholar] [CrossRef]
  16. Vargel, C. Corrosion of Aluminium, 1st ed.; Elsevier: Paris, France, 2004; p. 626. [Google Scholar]
  17. Torbati-Sarraf, H.; Stannard, T.; Callagon La Plante, E.; Sant, G.N.; Chawla, N. Direct observations of microstructure-resolved corrosion initiation in AA7075-T651 at the nanoscale using vertical scanning interferometry (VSI). Mater. Charact. 2020, 161, 110166. [Google Scholar] [CrossRef]
  18. Winkler, S.L.; Ryan, M.; Flower, H.M. Pitting corrosion in cast 7XXX aluminium alloys and fibre reinforced MMCs. Corros. Sci. 2004, 46, 893–902. [Google Scholar] [CrossRef]
  19. Roodbari, M.K. Effect of Microstructure on the Performance of Corrosion Resistant Alloys. Master’s Thesis, Norwegian University of Science and Technology, Trondheim, Norway, 2015; p. 74. Available online: http://hdl.handle.net/11250/2377272 (accessed on 10 May 2022).
  20. Ambat, R.; Davenport, A.J.; Scamans, G.M.; Afseth, A. A Effect of iron-containing intermetallic particles on the corrosion behaviour of aluminium. Corros. Sci. 2006, 48, 3455–3471. [Google Scholar] [CrossRef]
  21. Liang, W.J.; Rometsch, P.A.; Cao, L.F.; Birbilis, N. General aspects related to the corrosion of 6xxx series aluminium alloys: Exploring the influence of Mg/Si ratio and Cu. Corros. Sci. 2013, 76, 119–128. [Google Scholar] [CrossRef]
  22. Gebril, M.A.; Omar, M.Z.; Othman, N.K.; Mohamed, I.F. Microstructural Refinement and Corrosion Resistance Improvement of Heat-Treated A356 Alloy Processed by Equal Channel Angular Pressing. Sains Malays. 2019, 48, 2749–2757. [Google Scholar] [CrossRef]
  23. Lange, G.; Pohl, M. Systematische Beurteilung Technischer Schadensfälle, 1st ed.; Wiley–VCH Verlag GmbH: Weinheim, Germany, 2014; p. 548. [Google Scholar]
  24. Činčala, M. High Cycle Fatigue of Bearing Steel 14 109. Ph.D. Thesis, University of Žilina, Žilina, Slovakia, 2005; p. 91. [Google Scholar]
  25. Caton, M.J.; Jones, J.W.; Mayer, H.; Stanzl-Tschegg, S.E.; Allison, J.E. Demonstration of an endurance limit in cast 319 aluminum. Metall. Mater. Trans. A 2003, 34, 33–41. [Google Scholar] [CrossRef]
  26. Zhu, X.; YI, J.Z.; Jones, J.W.; Allison, J.E. A Probabilistic Model of Fatigue Strength Controlled by Porosity Population in a 319-Type Cast Aluminum Alloy: Part I. Model Development. Miner. Met. Mater. Soc. ASM Int. 2007, 38, 1111–1122. [Google Scholar] [CrossRef]
  27. Yi, J.Z. Effect of Microstructure and Defects on the Fatigue Behavior of Cast A356- T6 Aluminium-Silicon Alloy. Ph.D. Thesis, Department of Materials, Imperial College, London, UK, 2004. [Google Scholar]
  28. Wang, Q.G.; Apelian, D.; Lados, D.A. Fatigue behavior of A356/357 aluminum cast alloys. Part II-Effect of microstructural constituents. J. Light Met. 2001, 1, 85–97. [Google Scholar] [CrossRef]
  29. Markovičová, L.; Hurtalová, L.; Zatkalíková, V.; Garbacz, T. Evolution of composite structures by light microscopy and image analysis. Manuf. Technol. 2014, 14, 351–355. [Google Scholar] [CrossRef]
  30. Liu, M.; Uggowitzer, P.J.; Nagasekhar, A.V.; Schmutz, P.; Easton, M.; Song, G.; Atrens, A. Calculated phase diagrams and the corrosion of die-cast Mg–Al alloys. Corros. Sci. 2009, 51, 602–619. [Google Scholar] [CrossRef]
  31. ISO 6892-1A; Metallic Materials—Tensile Testing—Part 1: Method of Test at Room Temperature. ISO: Geneva, Switzerland, 2004.
  32. Czekaj, E.; Zych, J.; Kwak, Z.; Garbacz-Klempka, A. Quality Index of the AlSi7Mg0.3 Aluminium Casting Alloy Depending on the Heat Treatment Parameters. Arch. Foundry Eng. 2016, 16, 25–28. [Google Scholar] [CrossRef]
  33. Tiryakioglu, M.; Staley, J.T.; Campbell, J. Evaluating structural integrity of cast Al–7%Si–Mg alloys via work hardening characteristics II. A new quality index. Mater. Sci. Eng. 2004, 368, 231–238. [Google Scholar] [CrossRef]
  34. STN EN ISO 6506–1; Metallic Materials: Brinell Hardness Test. Part 1, Test Method. ISO: Geneva, Switzerland, 2005.
  35. STN 42 0363; Metal Testing. Fatigue Testing of Metals. Methodology of Testing. Úrad pre normalizáciu, metrológiu a skúšobníctvo SR: Bratislava, Slovakia, 1986.
  36. Kuchariková, L.; Medvecká, D.; Tillová, E.; Belan, J.; Kritikos, M.; Chalupová, M.; Uhríčik, M. The Effect of the β-Al5FeSi Phases on Microstructure. Mechanical and Fatigue Properties in A356.0 Cast Alloys with Higher Fe Content without Additional Alloying of Mn. Materials 2021, 14, 1943. [Google Scholar] [CrossRef] [PubMed]
  37. Irizalp, S.G.; Saklakoglu, N. Effect of Fe-rich intermetallic on the microstructure and mechanical properties of thixoformed A380 aluminium alloy. Eng. Sci. Technol. Int. J. 2014, 17, 58–62. [Google Scholar] [CrossRef]
  38. Mathew, J.; Remy, G.; Williams, M.A.; Tang, F.; Srirangam, P. Effect of Fe Intermetallics on Microstructure and Properties of Al-7Si Alloys. J. Miner. Met. Mater. Soc. 2019, 71, 4362–4369. [Google Scholar] [CrossRef]
  39. Taylor, J.A. The effect of iron in Al-Si casting alloys. In Proceedings of the 35th Australian Foundry Institute National Conference, Adelaide, Australia, 31 October–3 November 2004; pp. 148–157. [Google Scholar]
  40. Seifeddine, S. The Influence of Fe on the Microstructure and Mechanical Properties of Cast Al-Si Alloys; Literature Review-Vilmer Project; Jönköping University: Jönköping, Sweden, 2007. [Google Scholar]
  41. Yasakau, K.A.; Zheludkevich, M.L.; Ferreira, M.G.S. Role of Intermetallics in Corrosion of Aluminum Alloys; Smart Corrosion Protection; Intermetallic Matrix Composites, Woodhead Publishing: Duxford, UK, 2018; pp. 425–462. [Google Scholar] [CrossRef]
  42. Kuchariková, L.; Liptáková, T.; Tillová, E.; Kajánek, D.; Schmidová, E. Role of Chemical Composition in Corrosion of Aluminum Alloys. Metals 2018, 8, 581. [Google Scholar] [CrossRef]
  43. Osório, W.R.; Garcia, L.R.; Goulart, P.R.; Garcia, A. Effects of eutectic modification and T4 heat treatment on mechanical properties and corrosion resistance of an Al–9 wt. % Si casting alloy. Mater. Chem. Phys. 2007, 106, 343–349. [Google Scholar] [CrossRef]
  44. Osório, W.R.; Goulart, P.R.; Garcia, A. Effect of silicon content on microstructure and electrochemical behavior of hypoeutectic Al–Si alloys. Mater. Lett. 2008, 62, 365–369. [Google Scholar] [CrossRef]
  45. Trško, L.; Hadzima, B.; Fintová, S. Influence of Nano-Grained Surface Layer on Fatigue Properties of Structural Materials; Pearson Publishing House: London, UK, 2020. [Google Scholar]
  46. Trško, L.; Guagliano, M.; Bokůvka, O.; Nový, F. Fatigue life of AW 7075 Aluminium Alloy after Severe Shot Peening Treatment with Different Intensities. Procedia Eng. 2014, 74, 246–252. [Google Scholar] [CrossRef]
  47. Li, Y.; Retraint, D.; Gao, P.; Xue, H.; Gao, T.; Sun, Z. Effect of Surface Mechanical Attrition Treatment on Torsional Fatigue Properties of a 7075 Aluminum Alloy. Metals 2022, 12, 785. [Google Scholar] [CrossRef]
  48. Zhang, G.; Zhang, J.; LI, B.; Cai, W. Characterization of tensile fracture in heavily alloyed Al−Si piston alloy. Prog. Nat. Sci. 2011, 21, 380–385. [Google Scholar] [CrossRef]
  49. Maceka, W.; Owsińskib, R.; Trembaczc, J.; Branco, R. Three-dimensional fractographic analysis of total fracture areas in 6082 aluminium alloy specimens under fatigue bending with controlled damage degree. Mech. Mater. 2020, 147, 103410. [Google Scholar] [CrossRef]
  50. Pedersen, M. Introduction to Metal Fatigue; Department of Engineering, Aarhus University: Denmark, Denmark, 2018; p. 91. [Google Scholar]
  51. Wang, Q.G.; Caceres, C.H.; Griffiths, J.R. Damage by eutectic particle cracking in aluminum casting alloys A356/357. Met. Mater. Trans. 2003, 34, 2901–2912. [Google Scholar] [CrossRef]
  52. Caceres, C.; Griffiths, J. Damage by the cracking of silicon particles in an Al-7Si-0.4Mg casting alloy. Acta Mater. 1996, 44, 25–33. [Google Scholar] [CrossRef]
  53. Cao, X.; Campbell, J. Morphology of β-Al5FeSi Phase in Al-Si Cast Alloys. Mater. Trans. 2006, 47, 1303–1312. [Google Scholar] [CrossRef]
  54. Hurtalová, L.; Tillová, E.; Chalupová, M. The Changes of Fatigue Properties in Aluminium Cast Alloy during Solution Treatment. Key Eng. Mater. 2013, 592–593, 433–436. [Google Scholar] [CrossRef]
  55. Tillová, E.; Chalupová, M.; Borko, K.; Kuchariková, L. Changes of Fracture Surface in Recycled A356 Cast Alloy. Mater. Today Proc. 2016, 3, 1183–1188. [Google Scholar] [CrossRef]
  56. Hurtalová, L.; Tillová, E.; Chalupová, M.; Belan, J.; Uhríčik, M. The Influence of Two Different Casting Moulds on the Fatigue Properties of the Al–Si–Cu Cast Alloy. Adv. Struct. Mater. 2016, 61, 61–70. [Google Scholar] [CrossRef]
Figure 1. The specimens for (a) tensile tests, and (b) fatigue tests. Dimensions are given in mm.
Metals 13 01019 g001
Figure 2. Examples of (a) placing samples into the container, and (b) embedding them in a solution.
Metals 13 01019 g002
Figure 3. The fatigue tests (a) without corrosive environment, (b) with corrosive environment.
Metals 13 01019 g003
Figure 4. The basic microstructural constituents’ matrices (α), eutectic phases (E), and intermetallic phases (IPs) in (a) material A, (b) material B, and (c) material C, LM.
Metals 13 01019 g004
Figure 5. The EDX point analyses of Mg2Si phases: (a) the places of measurements and concentrations of elements; (b) numerical results of point measurements.
Metals 13 01019 g005
Figure 6. Mapping of the EDX analysis (a) of Al15(FeMn)3Si phases and (b) of Al5FeSi phases (yellow arrow) in deep-etched samples.
Metals 13 01019 g006
Figure 7. The effect of increasing Fe content on Mg2Si phases (yellow arrow) in (a) material A; (b) material B; and (c) material C.
Metals 13 01019 g007
Figure 8. The evaluation of pitting corrosion (yellow arrows) on experimental materials (a) A; (b) B; and (c) C before mechanical tests.
Metals 13 01019 g008
Figure 9. The quantitative measurements of corrosion pits in (a) material A and (b) material C on specimens after Charpy impact test: D—diameter, P—Circumference, A—area.
Metals 13 01019 g009
Figure 10. The S–N curves from measured data.
Metals 13 01019 g010
Figure 11. The predicted S–N curves by using the Basquin equation for stress under 45 MPa.
Metals 13 01019 g011
Figure 12. The fractography analysis of fracture surfaces after tensile tests of (a) material A; (b) material B; and (c) material C after the corrosion attack.
Metals 13 01019 g012
Figure 13. The fractography analyses of fracture surfaces after Charpy impact tests of (a) material A; (b) material B; and (c) material C after the corrosion attack.
Metals 13 01019 g013
Figure 14. The fractography analysis of initiation places (yellow arrows) in material C (a) without corrosive environment and (b) with corrosive environment.
Metals 13 01019 g014
Figure 15. The fractography analysis of fatigue and static regions in material C (a) without corrosive environment and (b) with corrosive environment.
Metals 13 01019 g015
Table 1. The chemical compositions of the experimental materials (in wt. %).
TypeMaterialSiFeCuMnMgZnTiAl
primaryA7.0280.1230.0130.0090.3540.0360.12392.253
secondaryB7.3400.4540.0210.0090.3020.0200.11891.673
secondaryC7.3150.6550.0300.0100.2920.0280.12091.486
Table 2. The results of basic mechanical properties.
Measured PropertiesBefore CorrosionAfter Corrosion
ABCABC
UTS [MPa]141150147130140144
HBW 5/250/15525554585959
Ductility [%]1.451.911.551.71.51.3
Impact energy [J]141210.510.587.8
Table 3. The results of the quality indices.
Quality IndexBefore CorrosionAfter Corrosion
ABCABC
QI165.21192.16175.55164.57166.41161.09
Table 4. The results of quantitative measurements of corrosion pits in experimental materials after a corrosion attack: D—diameter, P—Circumference, A—area.
Material AMaterial BMaterial C
A
[mm2]
D
[mm]
P
[mm]
A
[mm2]
D
[mm]
P
[mm]
A
[mm2]
D
[mm]
P [mm]
Minimum48.660.250.7848.660.250.7824.830.180.56
Maximum339.910.662.07397.260.712.23437.980.752.35
Average value115.990.4021.21161.340.4341.39144.730.4031.34
Mean deviation71.740.1200.33105.310.150.4491.090.150.42
Table 5. The results of fatigue properties.
Fatigue LifeBefore CorrosionAfter Corrosion
ABCABC
σ3×10⁵ [MPa]68.575.573.563.551.569.5
Disclaimer/Publisher’s Note: The statements, opinions and data contained in all publications are solely those of the individual author(s) and contributor(s) and not of MDPI and/or the editor(s). MDPI and/or the editor(s) disclaim responsibility for any injury to people or property resulting from any ideas, methods, instructions or products referred to in the content.

