Article

Strain-Rate Effect on Anisotropic Deformation Characterization and Material Modeling of High-Strength Aluminum Alloy Sheet

1
Shenzhen Institute of Advanced Technology, Chinese Academy of Sciences, Shenzhen 518055, China
2
Shenzhen Key Laboratory of Precision Engineering, Shenzhen 518055, China
3
Guangdong-Hong Kong-Macao Joint Laboratory of Human-Machine Intelligence-Synergy Systems, Shenzhen Institute of Advanced Technology, Chinese Academy of Sciences, Shenzhen 518055, China
4
Department of Surgery, The Chinese University of Hong Kong, Hong Kong SAR, China
*
Author to whom correspondence should be addressed.
Metals 2022, 12(9), 1430; https://doi.org/10.3390/met12091430
Submission received: 21 July 2022 / Revised: 25 August 2022 / Accepted: 25 August 2022 / Published: 29 August 2022
(This article belongs to the Special Issue Microstructure and Properties of Aluminum Alloys)

Abstract

:
Aluminum alloy sheets are widely applied as structure components in automotive, aircraft and other industries to realize lightweight. Nowadays, many high strain rate forming techniques have been developed to improve their formability and widen their application. To ensure the reliability of the aluminum alloy structure components under high strain rate conditions, it is imperative to develop a thorough understanding of the alloy’s mechanical properties. In this paper, taking high-strength 6XXX aluminum alloy sheet as an example, the anisotropic deformation characterization and corresponding material models at various strain-rate conditions are investigated systematically. The material hardening curves and anisotropic plastic yielding stresses were achieved based on the quasi-static uniaxial tensile test and the split Hopkinson tensile bar tests. In this study, the Johnson–Cook hardening model and two anisotropic yield functions are applied to well describe the strain-rate-dependent anisotropic plastic deformation behavior. In addition, the fractographic characterization of the fractured samples at various strain-rate conditions are measured and compared. The study systematically investigates the influence of strain rate on the anisotropic deformation behavior of the high-strength aluminum alloy sheets and gives the basic experimental data for their application in engineering fields in the future.

1. Introduction

In recent years, aluminum alloy has been widely applied for structural components in various industries to realize lightweight due to its medium strength, high specific strength, low density, good corrosion resistance and 100% recycling [1,2,3]. However, the formability of aluminum alloy sheets at ambient temperature is obviously low, and it is difficult to achieve the target components if using the traditional cold stamping methods, which limits their popularization and application. One effective method to improve the formability of aluminum alloy sheets is to deform the sheets at an elevated temperature, while such hot forming and warm forming processes have inevitable disadvantages. A too-high forming temperature can increase the overall manufacturing cost since the heating equipment should be added and the production energy consumption is thus increased. In addition, a too-higher temperature can cause oxide scale on the metal surface and increase the subsequent surface treatment process. Moreover, it is difficult to deform complex components that have a multi-step forming requirement and need an essential forming temperature to ensure the sufficient formability [4]. In order to guarantee the quality of the components and reduce the production cost, it is necessary to develop some novel flexible sheet metal forming processes that can improve the formability of the aluminum alloy sheets at ambient temperature.
Many research studies prove that high strain rate forming technologies can effectively improve the formability of metal sheets. According to the energy source and energy conversion method, the widely applied high strain rate forming technologies can be divided into three types, including explosive forming (EF) [5], electromagnetic forming (EMF) [6] and pulse electrohydraulic forming (EHF) [7]. The formability improvement for aluminum alloy sheets based on the three forming technologies have been validated. However, in view of the technical challenges, limited experimental data are available to take greater advantage of these high-strain rate forming technologies to widen the application of the aluminum alloy. Thus, it is necessary to first understand the basic deformation behavior, including the hardening behavior and the anisotropic yielding behavior, of the aluminum alloy sheets under high strain rate forming conditions.
In numerous studies on aluminum alloy sheets, the influence of different material parameters at various strain-rate condition, including the grain size [8,9], temper state [10], thermal exposure temperature and time [11] and strain rate [12] on the flow stress characterization, were investigated based on experiments. To accurately predict the plastic deformation behavior of the aluminum alloy sheets through numerical simulation, the proper material models should be adopted and the accurate material parameters should be applied as input. For example, Jenab et al. [13] applied neural networks technology to predict the uniaxial tensile behavior of AA5182-O aluminum alloy sheet. Zhang et al. [14] proposed a modified Voce hardening model and FE-Marciniak model to predict the influence of temperature and high strain rates on the plastic flow behavior and the formability of AA5086 aluminum alloy. Their numerical results showed that the forming limit curve increased with increasing temperature, while it decreased with increasing high strain rate. It should be noted that the predicted results were not validated by the corresponding experimental results. Lee and Tang [15] also adopted the Zerilli–Armstrong FCC model to describe the temperature and strain-rate-related deformation behavior for 6061-T6 aluminum alloy. In their study and in other literature works [10,16,17,18], the compressive split Hopkinson pressure bar tests were used to investigate the dynamic deformation behavior at high strain rates. However, for most applications in industries, the aluminum alloy sheets undertook stretching instead of compression. According to Yan et al. [19], there were certain differences between the dynamic tensile behavior and dynamic compressive behavior of 5A06 and 5A02 aluminum alloy, including the strain corresponding to the peak stress, the range of the diffusive necking section and the softening percentage. So, whether the stress–strain data under the dynamic compressive state can accurately describe the deformation behavior of the aluminum alloy under dynamic tensile condition for a specific material is still a question.
Recently, several phenomenological material models on the formability improvement of the aluminum alloy sheet under high strain rate conditions were also analyzed. Ji et al. [20] proposed a MMC-based fracture function to describe the influence of high strain rate on the fracture strain of 6061-T5 aluminum alloy. More experimental work needs to be carried out to verify the change of formability for this aluminum alloy sheet. Recently, aimed at the impact hydroforming process, one novel method was proposed by Chen et al. [21] to evaluate the formability of sheet metals under high strain rate condition. The novel forming limit curve was obtained based on the experimental data and it related to the impact energy and deep drawing ratio. It worked well with the impact hydroforming, while it cannot directly guide the formability of sheet metals under other high strain rate forming processes.
To sum up, the above studies mainly focus on merely hardening behavior or formability investigation of aluminum alloy sheet; there is still a lack of description of the anisotropic deformation characterization, of the aluminum alloy at high strain rates. Therefore, the aim of this paper was to give a comprehensive understanding of the anisotropic plastic deformation characterization of one commonly used 6XXX aluminum alloy sheet under various high strain rate conditions and to describe the material characterization of this aluminum alloy with proper phenomenal material models. Here in the following sections, the uniaxial tensile tests under quasi-static condition and the split Hopkinson tensile bar tests under high strain rate conditions along various tensile directions were carried out. The corresponding hardening model and the anisotropic yield function considering high strain rate effect are used to describe the plastic deformation behavior of this aluminum alloy sheet. In addition, the influence of the strain rate on the fractographic characterization is investigated. The results obtained by this study not only provide the mechanical properties of the 6XXX aluminum alloy sheets, but also give the basic theoretical data for the application of the aluminum alloy components in the engineering fields, especially for the high strain rate forming processes.

2. Experimental Procedure

The studied material here is a 2 mm thick 6XXX aluminum alloy sheet. By applying the T6 temper to this aluminum alloy sheet, the aluminum alloy has a good strength-to-weight ratio and is also heat-treatable. This material is widely used for engineering and structural applications. The chemical composition (wt%) of the alloy is reported in Table 1. In order to define the plastic deformation behavior of this material, the standard uniaxial tensile tests at quasi-static condition and the split Hopkinson tensile bar (SHTB) tests at various high strain rate conditions are carried out in this section.

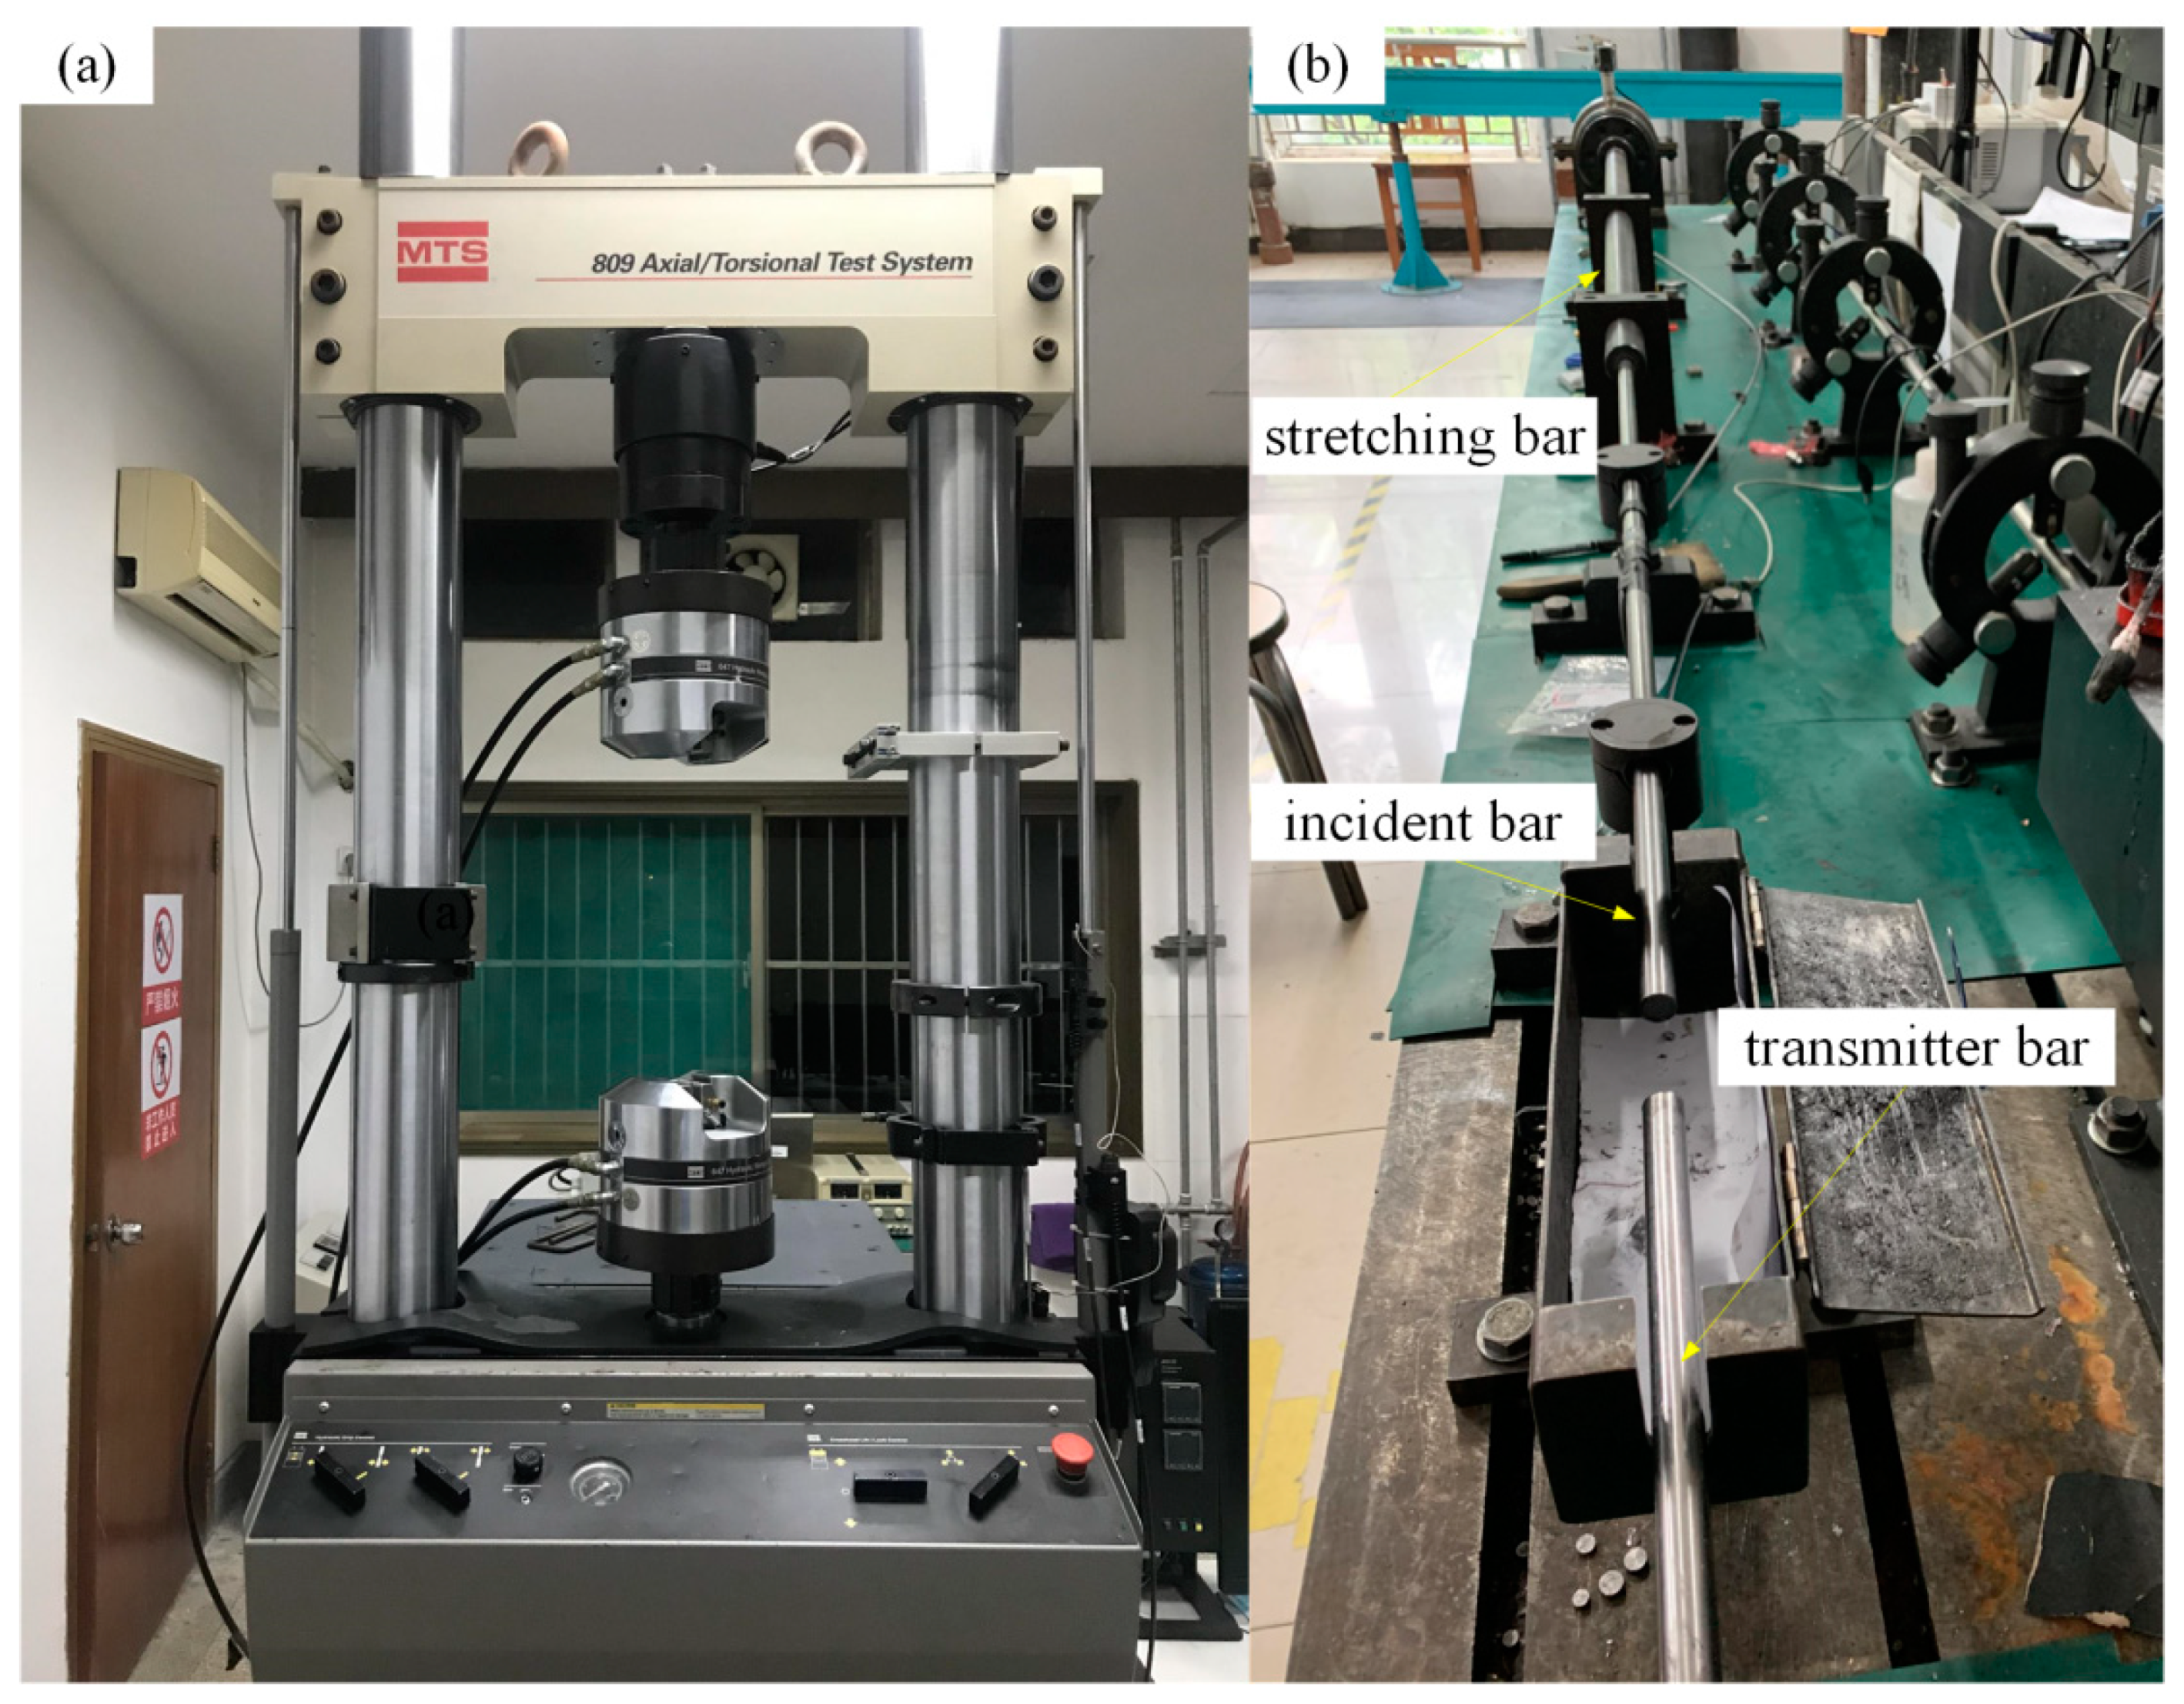
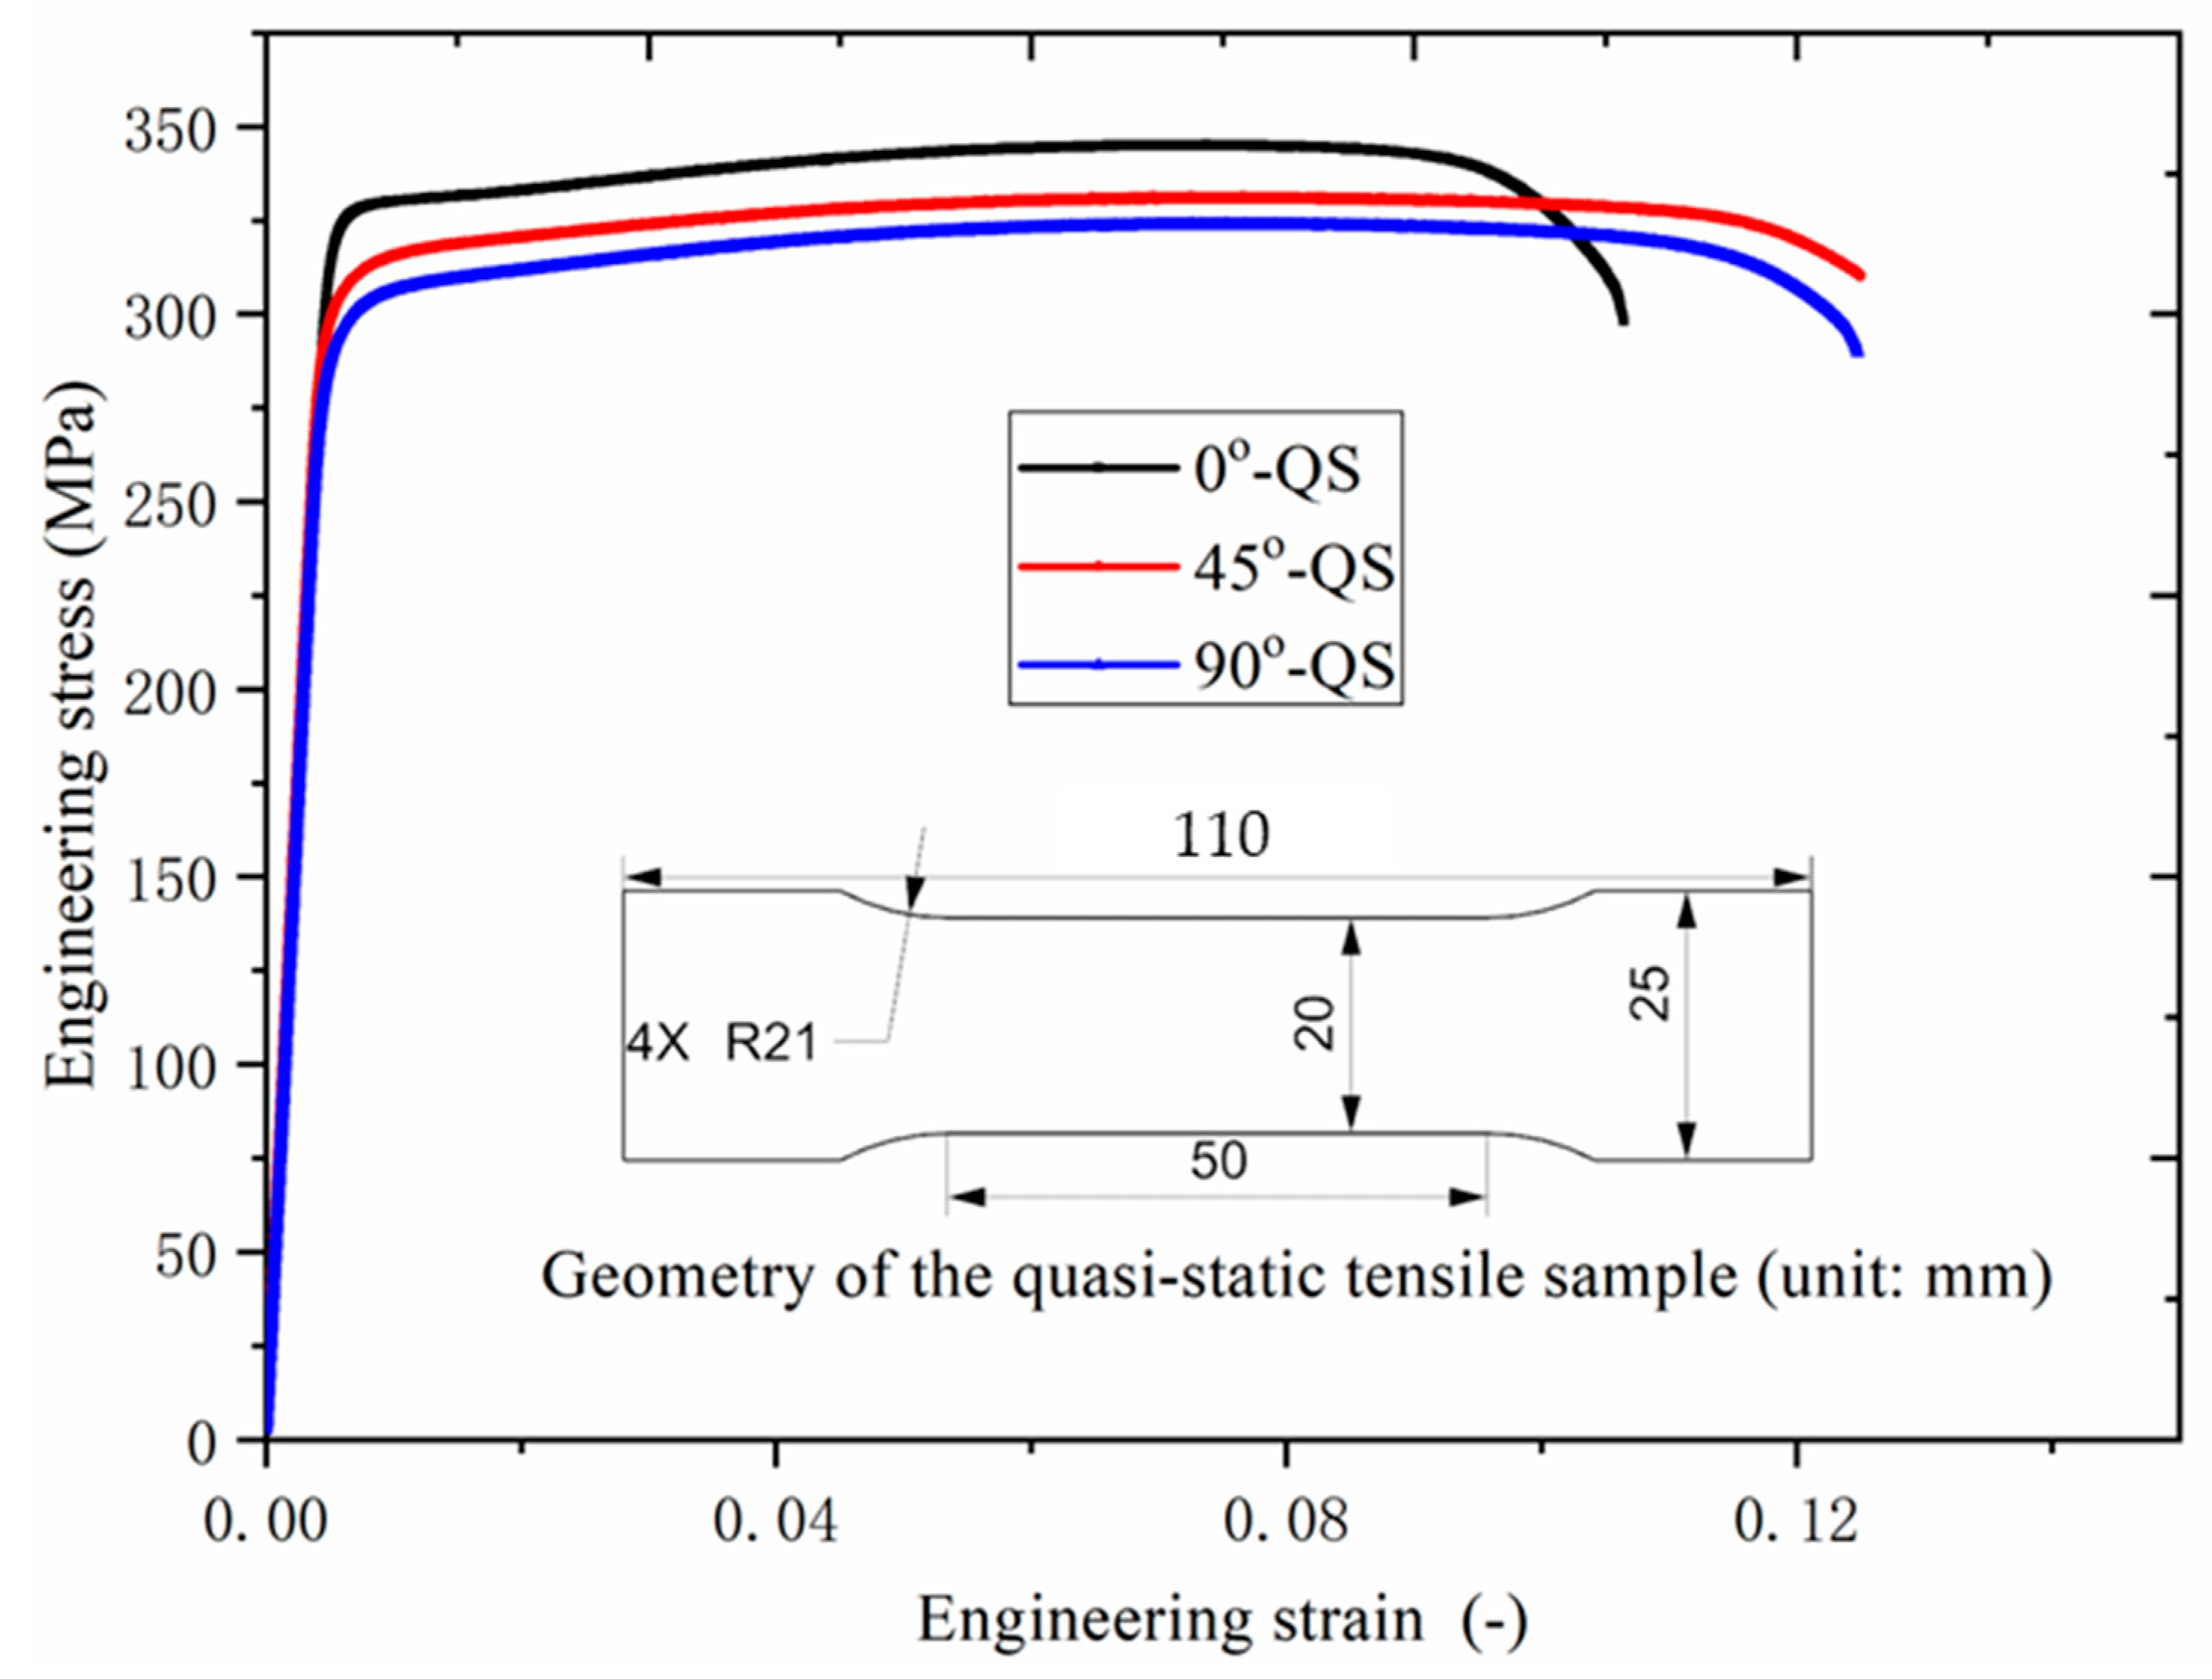
2.1. Uniaxial Tensile Test at Quasi-Static Condition

For the hardening behavior of the aluminum alloy sheet at quasi-static condition, the standard uniaxial tensile tests at different orientations to the rolling direction (0°, 45° and 90°) were carried out. The equipment for the uniaxial tensile tests is MTA809 with maximum force of 25 kN (as shown in Figure 1a). During the uniaxial tensile tests, the samples (as shown in Figure 2) were stretched with a stretching speed of 0.025 mm/s. The uniaxial tensile experimental data were automatically collected by the computer, and the mechanical properties, including the yield stress, the ultimate tensile stress, the elastic modulus and the ductility, could be read directly by the report. Three samples were adopted under each experimental condition and relative error is less than 1%, so the repeatability of the experiments is very good. The average experimental value was used for the following analysis.
The measured engineering flow stress curves at three orientations to the rolling direction for the 6XXX aluminum alloy sheet are shown in Figure 2. It can be seen that the material has a certain anisotropy and it is harder for the material to deform along the rolling direction, and the ductility of the aluminum alloy in the rolling direction is the lowest. In addition, the anisotropic coefficient of this aluminum alloy is obtained by adopting the following equation.
r = ε b / ε t
where   ε b is the transverse strain and ε t is the thickness strain, respectively.
Based on the uniaxial tension samples without fracture, the anisotropic coefficients of 6XXX aluminum alloy sheet at quasi-static condition is calculated as follows: r 0 = 0.58 , r 45 = 0.55 , and r 90 = 0.61 . The anisotropic coefficients of this 6XXX aluminum alloy sheet is close to that of AA5XXX and AA6011 used in the literature [22], which indirectly verified the reliability of the anisotropy acquisition experiments.

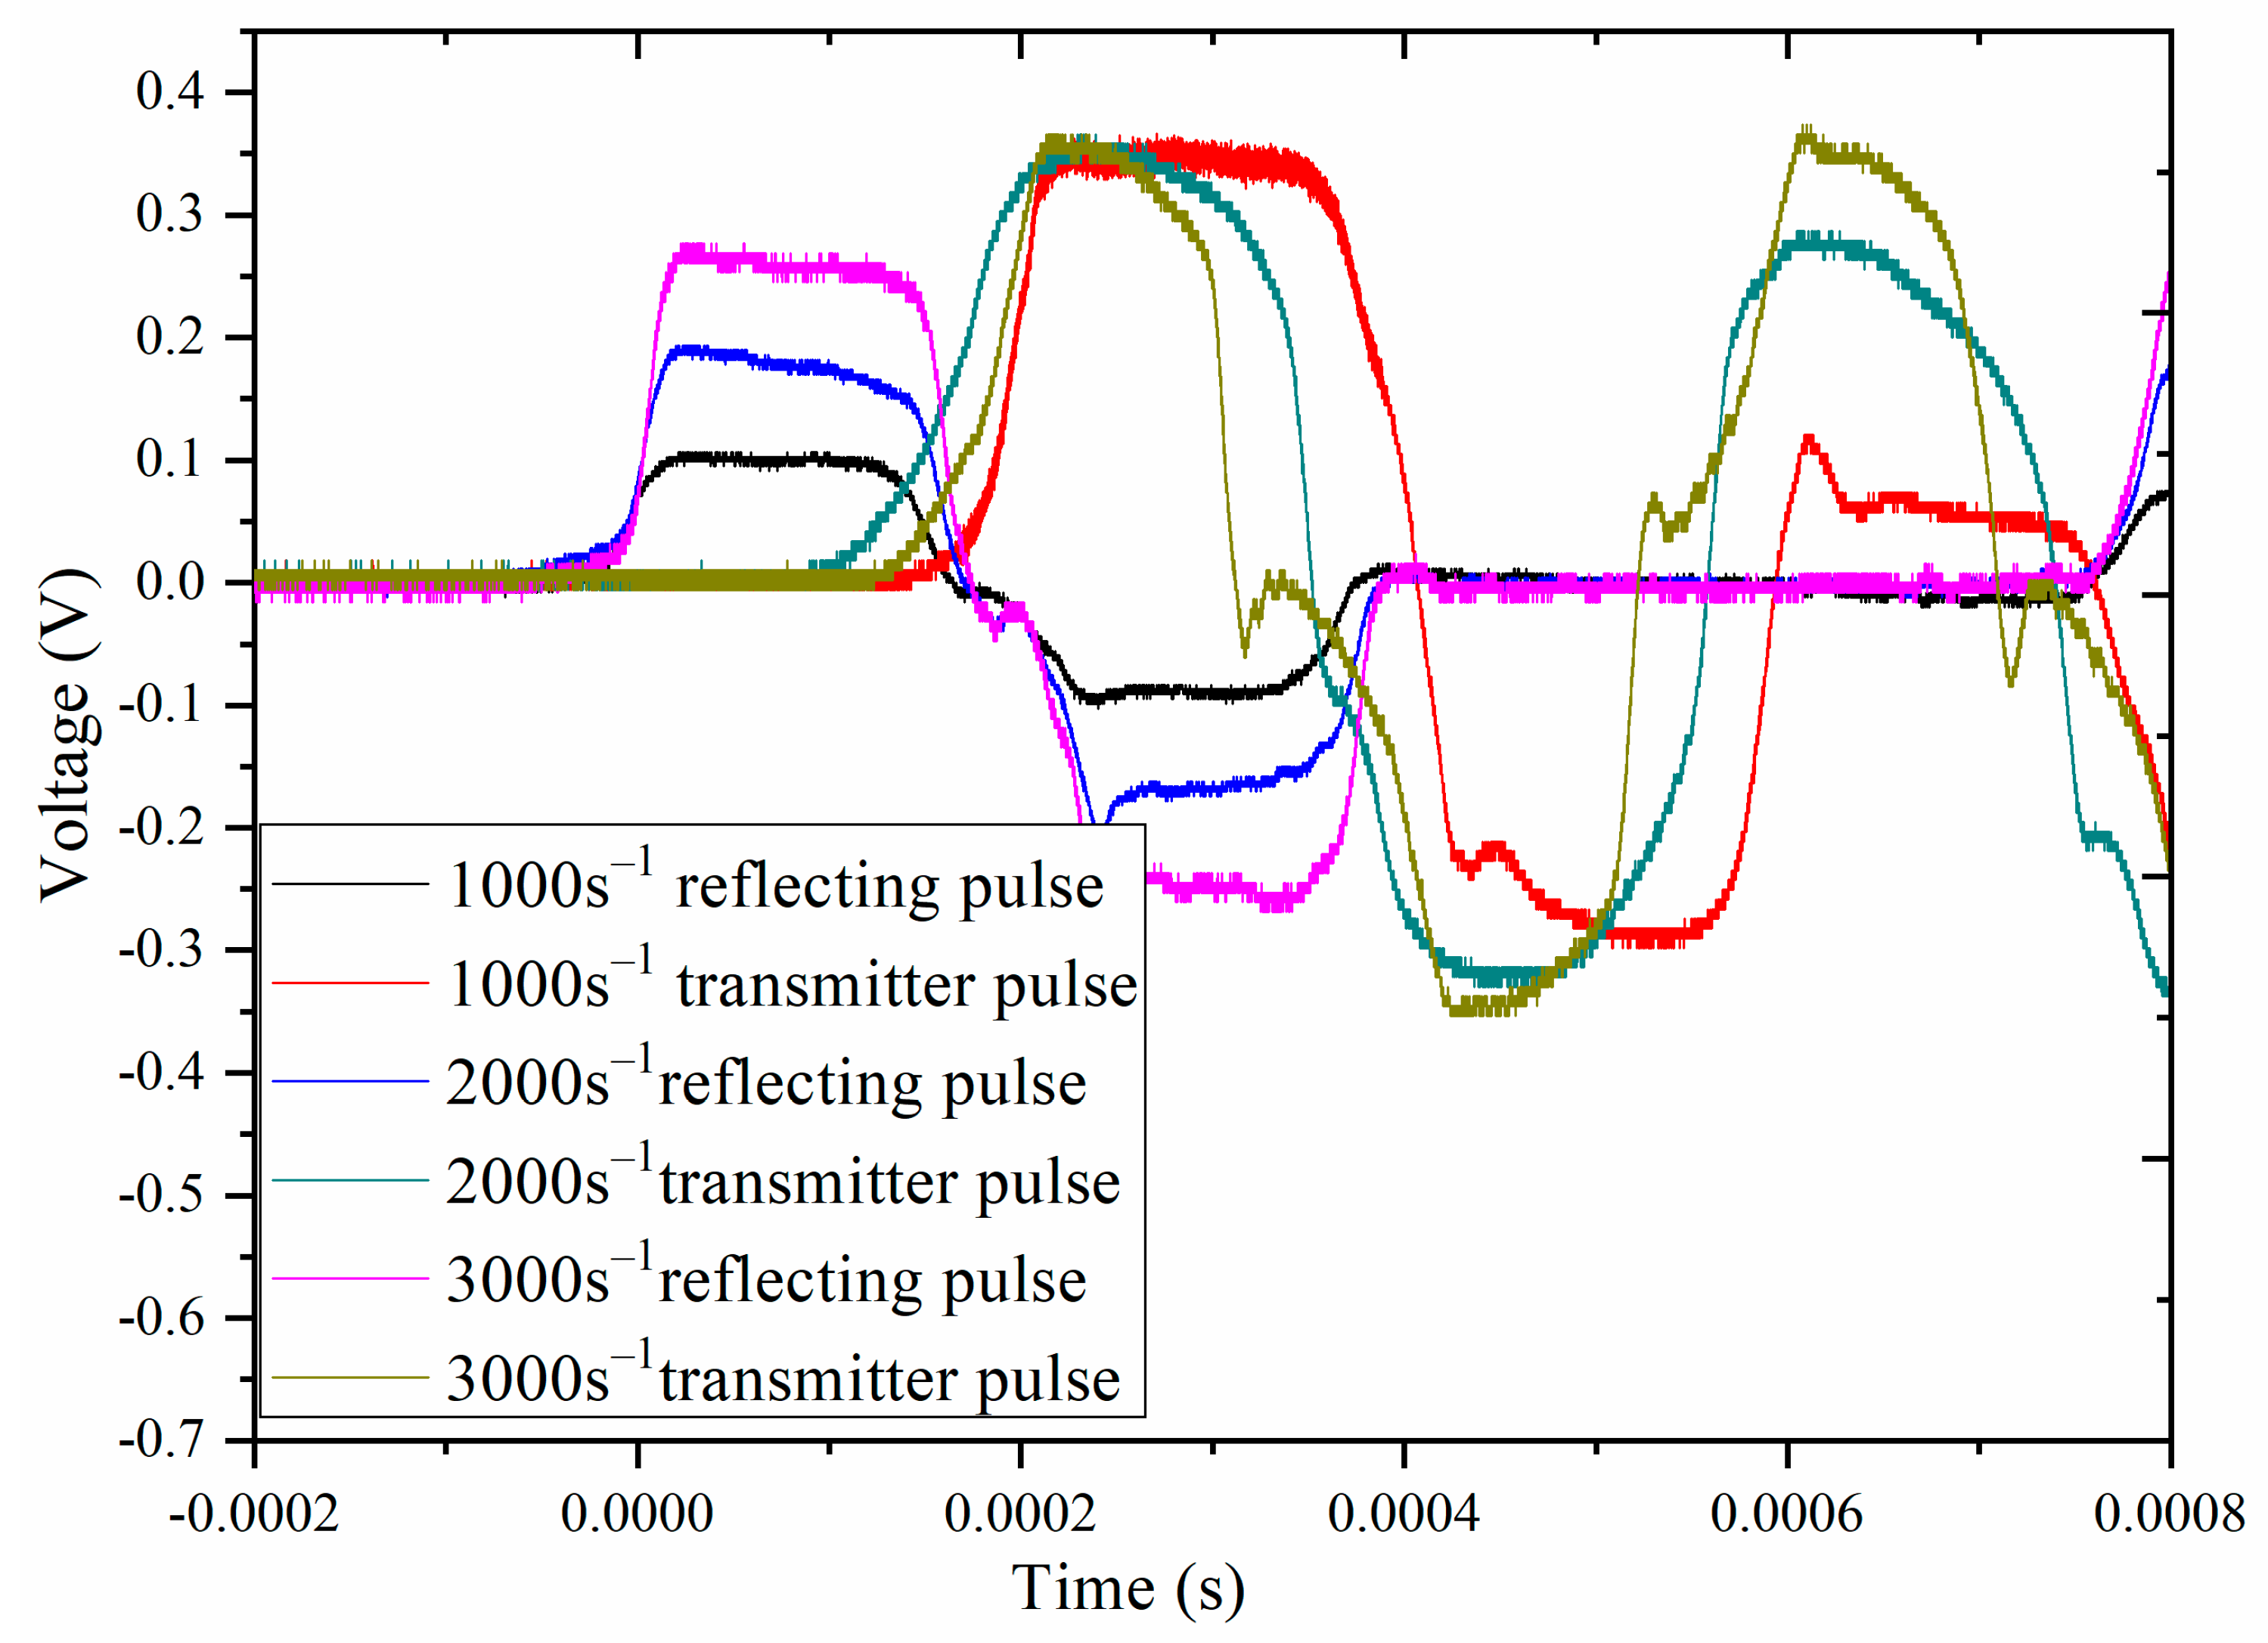
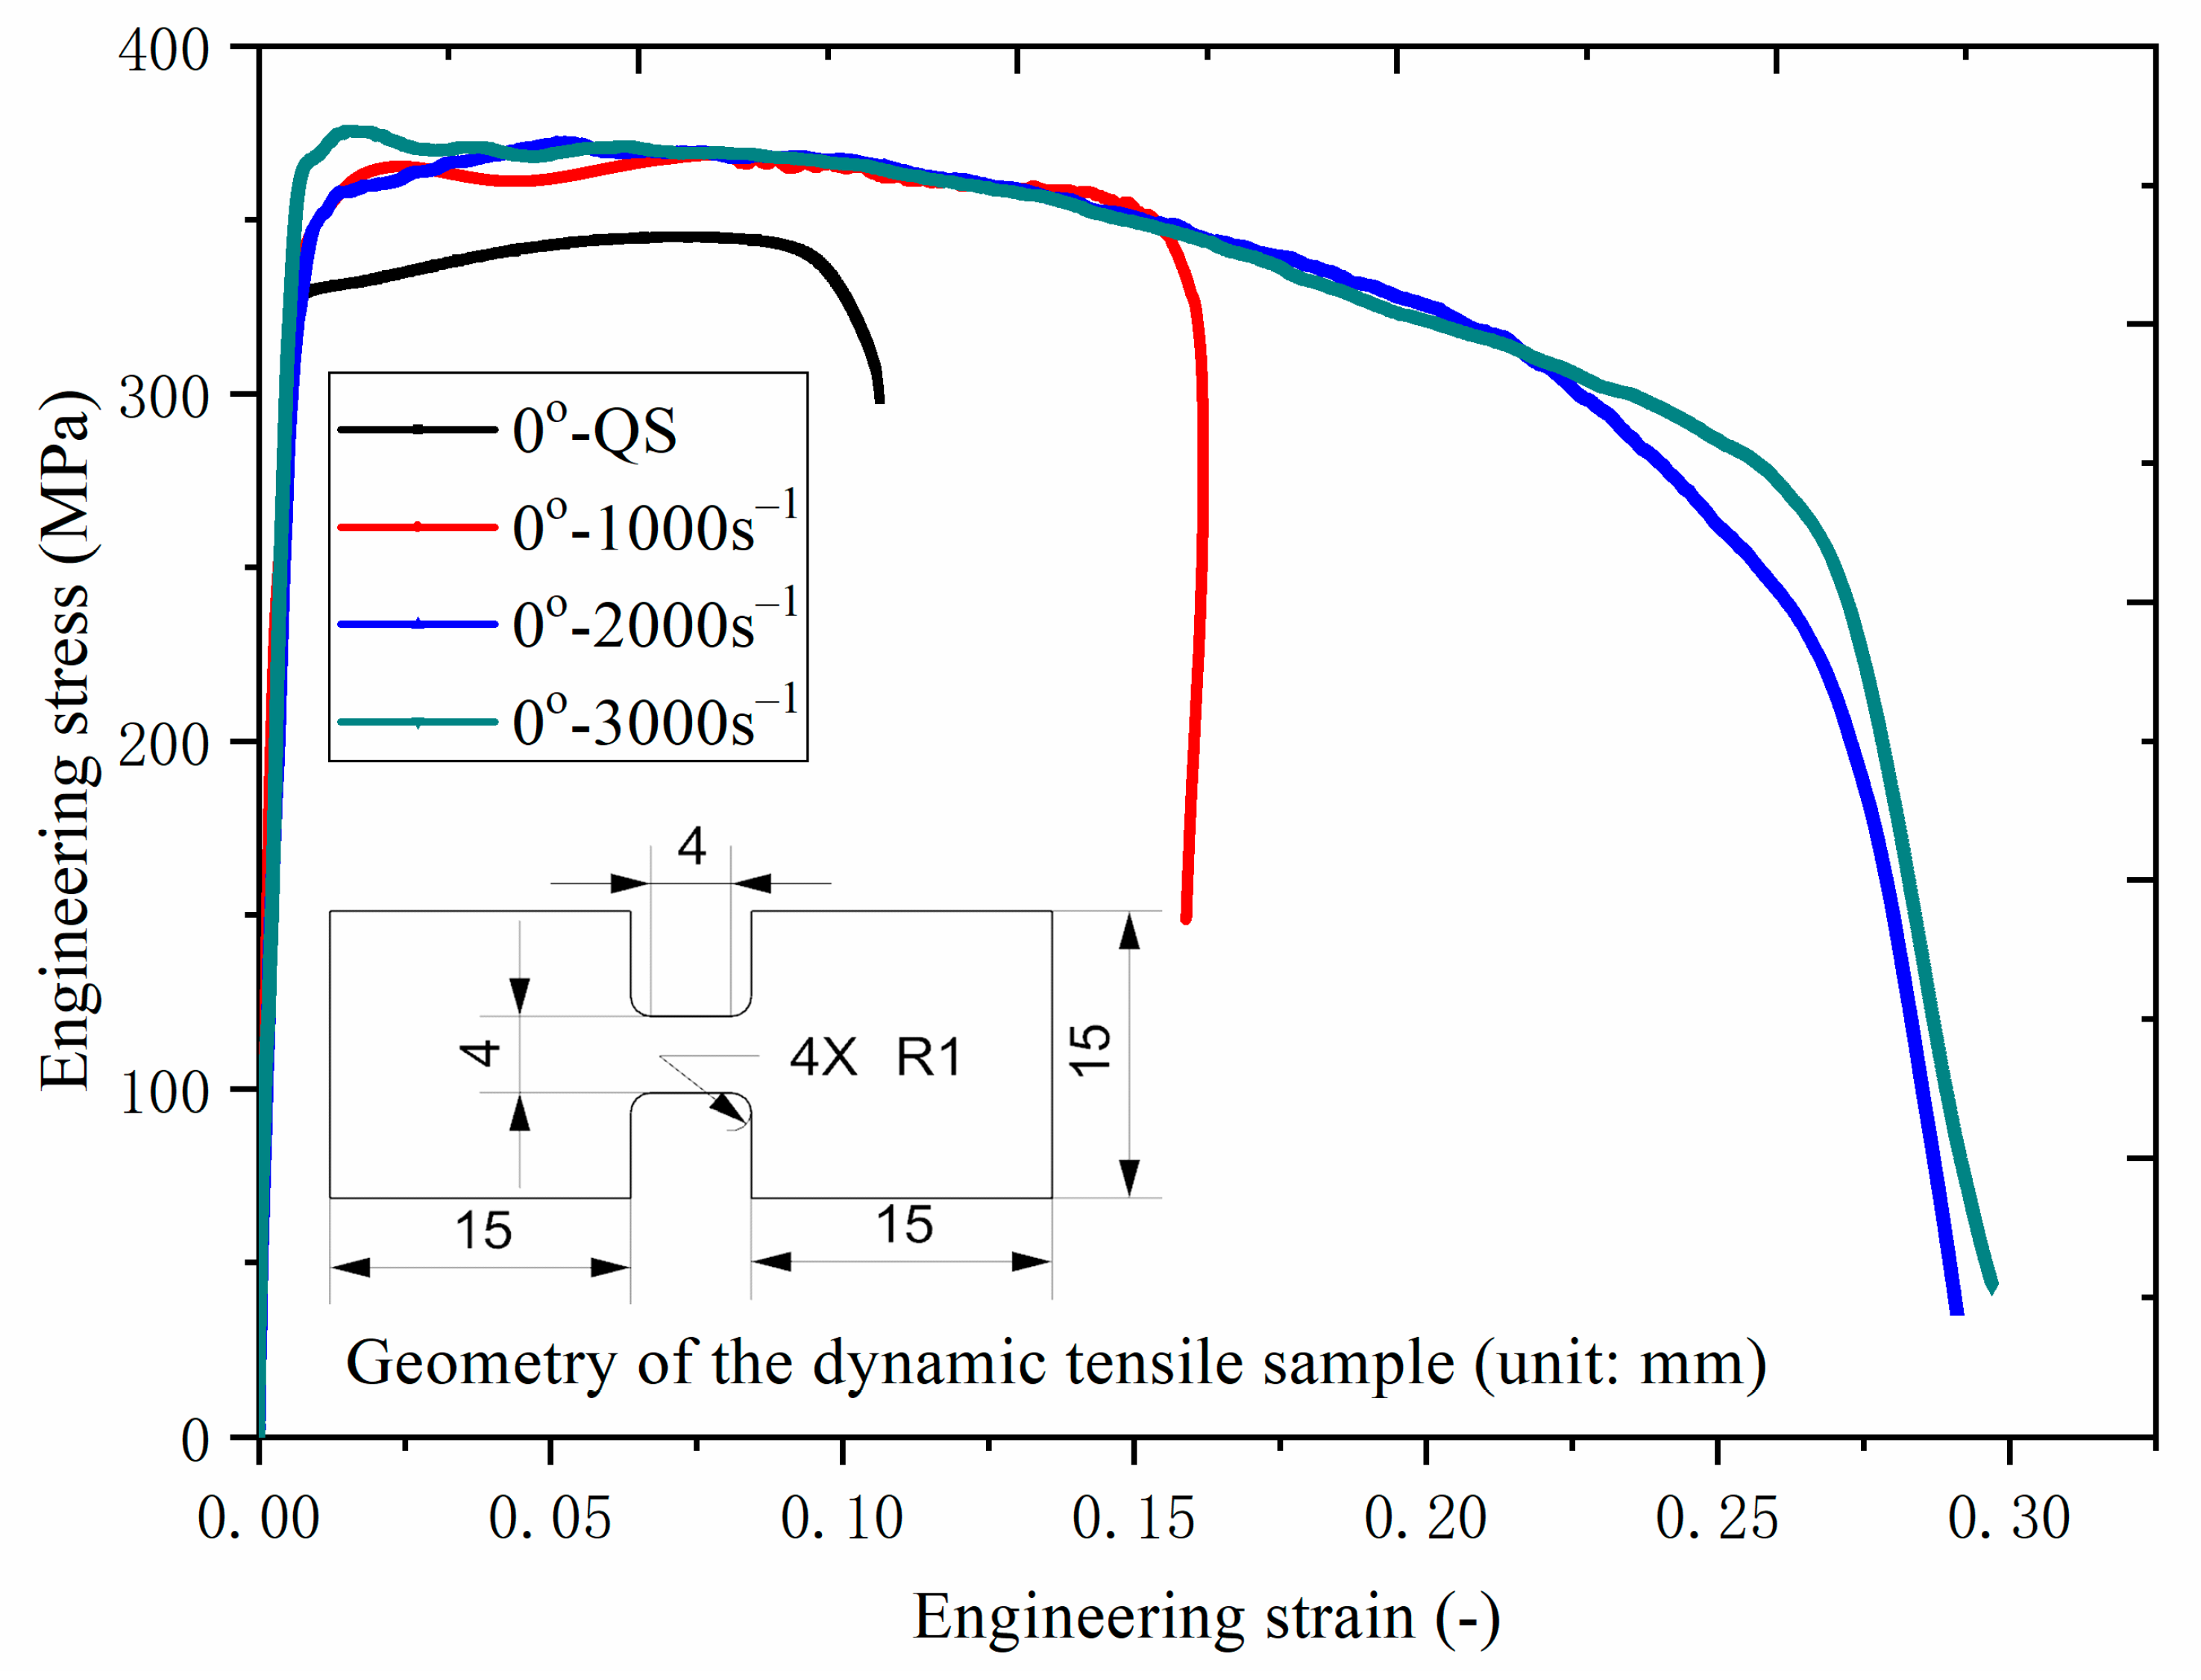
2.2. SHTB Tests at Various High Strain Rate Conditions

The split Hopkinson tensile bar (SHTB) tests are conducted at ambient temperature to achieve dynamic tensile characterization of this aluminum alloy under strain rates from 1000 s−1 to 3000 s−1. The samples for dynamic tensile tests were prepared along three directions (0°, 45°and 90° to rolling directions) to investigate the material’s anisotropy at high strain rate conditions. As shown in Figure 1b, the SHTB system consists of the incident bar, transmitter bar and stretching bar. The material of the incident bar and transmitter bar is 60Si2Mn, the diameters of the two bars are both 15 mm, and the lengths of the two bars are 2000 mm and 1000 mm, respectively. During the dynamic tensile tests, the sample was clamped between the incident bar and transmitter bar using pins. The stretching bar and the incident bar stretched the sample to produce a tensile stress wave. When the stress pulse in the incident bar reached the contact surface with the sample, part of it is reflected and a reflected wave was formed in the incident bar, the other part of it entered into the transmitter bar through the sample to form a transmitter wave. A detailed description of the stress pulse measurement based on SHTB system can be found from the literature [23,24].
As for our study, the experimental time-varying reflecting pulse signals and transmitter signals under the three strain rates for samples along rolling direction are shown in Figure 3. The tensile stress pulse can be transformed into the stress–strain data based on the following formula.
ε ˙ = 2 c b / L s ε r
ε = 2 c b / L s 0 t ε r dt
σ = A b / A s E b ε t
where   ε r   and   ε t are the reflecting strain and transmitter pulse, respectively. A s and L s are the cross-sectional area and the gauge length of the sample, A b , E b and c b are the cross-sectional area, Young modulus and the elastic wave speed of the bars.
In this study, the experimental engineering flow stress curves for the 6XXX aluminum alloy sheets under different high strain rates (ranging among 1000 s−1, 2000 s−1 and 3000 s−1) along the rolling direction are calculated and shown in Figure 4. In addition, the geometric shapes of the sample for the dynamic tensile tests are also shown in Figure 4. It can be seen that the sample for dynamic tensile tests is much smaller than the one for the uniaxial tensile tests at quasi-static condition. Comparing the high strain rate data from the SHTB tests with the quasi-static data from the uniaxial tensile tests, it is clear that this material shows significant different plastic deformation characterization from the quasi-static condition to the dynamic tensile condition. The ductility of the material increases greatly with the increase of strain rate, which is quite different from the case for the steel material [25]. It should also be noted that the flow stresses for high strain rates ranging from 1000 s−1 to 3000 s−1 are quite similar to each other. Roughly, the flow stresses at high strain rates are more than 6% higher than the flow stress data at quasi-static condition.
Figure 5 also presents the SHTB results (true stress–strain curves) under three high strain rate conditions along three angles with the rolling direction. The uniaxial tensile cases with the same strain rates show similar hardening behavior, while the ductility of the materials along different tensile directions are somewhat different. The detailed difference among the stress–strain curves will be analyzed in the following Section 3.
Table 2 sums up the average initial yield stress (YS) and ultimate tensile stress (UTS) for all the samples along three directions and under four strain rate conditions. It should be explained that, since there is no clear definition on the initial yield stress under high strain rate condition, so here based on the experimental data, the true stress data at the true strain of 0.01 are determined as the initial yield stress for all the cases. It can be seen from Table 2, at strain rates from 1000 s−1 to 3000 s−1, that the yield stress increases gradually with the increase of strain rate, while the ultimate tensile strengths for the three high strain rate cases are very close to each other. Compared with the case under quasi-static data, the YS and UTS increases greatly at high strain rate conditions. The maximum improvement of YS and UTS, about 20.3% and 17.0% higher than the case at quasi-static strain rate, is the case at the strain rate of 3000 s−1 with 90° along the rolling direction, and the case at the strain rate of 2000 s−1 with 90° along the rolling direction, respectively.

3. Material Modeling Analysis

In recent years, finite element simulation has been widely used to predict the metal flow and optimize various sheet metal forming processes. In order to obtain reliable FE simulation results, the accurate material models must be applied as input. The hardening model defines the materials’ stress–strain behavior and the yield function reflects the materials’ anisotropy and yielding behavior in stress space. The abovementioned constitutive models are indispensable for the accurate FE prediction.

3.1. Stress-Strain Hardening Model

The Johnson–Cook model [26] is widely applied to evaluate the influence of strain rate and temperature on the hardening behavior of different metal plates. The prediction accuracy of this model has been validated for AA7075 in literature [18], Mg-7Gd-5Y-1.2Nd-0.5Zr in literature [27] B500A in literature [28] and so on. To well describe the hardening behavior of 6XXX aluminum alloy sheet, the Johnson–Cook model that neglects the influence of temperature was used here. It should be noted that the experimental stress-strain data prior to necking are used to obtain the parameters of the theoretical hardening model. The model is defined by the following equation.
σ = [ A + B ε n ] [ 1 + Cln ( ε ˙ / ε ˙ 0 ) ]
where ε is the effective plastic strain, ε ˙ is the strain rate, ε ˙ 0 is the reference strain, A , B , C and n are fitting coefficients of the hardening model.
According to Equation (5), the parameters of A , B and n can be determined based on the uniaxial tensile data under quasi-static condition, and a parameter of C can be obtained by averaging the values at the plastic strain of 0.02 and 0.12 under different strain rates. Based on the experimental data along the rolling direction shown in Figure 4, the Johnson–Cook model for this aluminum alloy sheet can be achieved as follows,
σ = [ 333.4 + 309.78 ε 0.774 ] [ 1 + 0.003737 ln ( ε ˙ / ε ˙ 0 ) ]
The comparison results between the experimental stress–strain data and the predicted one based on the Johnson–Cook model are shown in Figure 6. Results show that the Johnson–Cook model can well describe the plastic deformation behavior of this aluminum alloy at quasi-static condition and at higher strain regions for high strain rate condition. However, it somewhat underestimates the yielding stress at the initial tensile stage for the cases with high strain rate, especially for the case with a strain rate of 3000 s−1. The difference may be caused by the inevitable experimental error induced by vibration, since the theoretical prediction at initial yielding region is 6% less than the experimental data. The traditional Johnson–Cook model can be regarded as an appropriate hardening model to describe the plastic deformation behavior of this 6XXX aluminum alloy sheet at all strain rates.
Moreover, it should be noted from Figure 6 that, for the cases at high strain rates, the flow stress increases greatly at first, and then it reaches saturation quickly, and thus it presents an obvious stress softening phenomenon, which is quite common for many studies [12]. According to Yan et al. [19], the softening degree can be quantitatively evaluated by the following equation.
ε softening = ( σ peak σ fracture ) / σ peak
where σ peak and σ fracture are the maximum stress and the stress that fracture occurs, respectively. Subsequently, the softening degree at different strain rate conditions for the dynamic tensile samples along different angles to the rolling direction are calculated and shown in Figure 7. Obviously, at high strain rate condition, the softening ratio is greatly increased compared with the case under quasi-static condition. This softening effect is caused by the fact that the heat generated by the rapid deformation has not enough time to diffuse, so the temperature of the sample can be enhanced to reduce the flow stress.
In addition, the elongation during the uniaxial tensile tests are also shown in Figure 7. The maximum strain also increases dramatically with the increase of strain rate. These results partially prove that high strain rate deformation can significantly improve the ductility of this aluminum alloy sheet.

3.2. Anistropic Yield Function

The yield behavior of one material is very important for the sheet metal forming process, so the theoretical models to describe the sheet metals’ yield behavior are developed widely. For this section, the first is to determine the proper yield function for the experimental aluminum alloy sheet at quasi-static condition. Generally speaking, Barlat and Lian’s 1989 yield function [29] is the most widely used anisotropic yield function for aluminum alloys due to its simple forms. However, their predicted accuracy is restricted due to limited input parameters if the anisotropic behavior of the metal sheet is significant. Here in this study, Barlat and Lian’s 1989 yield function and Yld2003 proposed by Aretz [30] are compared to describe the initial yield surface shape of this aluminum alloy sheet.
According to Barlat and Lian’s 1989 yield function, the plastic yielding condition can be expressed as follows.
σ ¯ = ( ( a | ( σ x x + h σ y y ) / 2 + ( ( σ x x h σ y y ) / 2 ) 2 + ( p ) 2 σ x y 2 | m 1 + a | ( σ x x + h σ y y ) / 2 ( ( σ x x h σ y y ) / 2 ) 2 + ( p ) 2 σ x y 2 | m 1 + c | 2 ( ( σ x x h σ y y ) / 2 ) 2 + ( p ) 2 σ x y 2 | m 1 ) / 2 ) 1 / m 1
where σ x x , σ y y and σ x y are the components of the stress tensor. This yield function contains 5 parameters. m 1 is a material parameter associated with the crystal structure of the sheet metal. For BCC and FCC metals, the values of m 1 are equal to 6 and 8, respectively. For the experimental aluminum alloy sheet, the value of m 1 is 8. The anisotropic material constants a , c , h and p are obtained from r 0 , r 45 , and r 90 . Based on the experimental yield stresses at quasi-static condition shown in Table 2, the anisotropic parameters of Barlat and Lian’s 1989 yield function is calculated and shown in Table 3.
According to the Yld2003 yield function, the material’s yield condition can be described by the following equations,
σ ¯ = ( ( | ( a 8 σ x x + a 1 σ y y ) / 2 + ( ( a 2 σ x x a 3 σ y y ) / 2 ) 2 + ( a 4 ) 2 σ x y 2 | m 2 + | ( a 8 σ x x + a 1 σ y y ) / 2 ( ( a 2 σ x x a 3 σ y y ) / 2 ) 2 + ( a 4 ) 2 σ x y 2 | m 2 + | 2 ( ( a 5 σ x x a 6 σ y y ) / 2 ) 2 + ( a 7 ) 2 σ x y 2 | m 2 ) / 2 ) 1 / m 2
For the Yld2003 yield function, there are 9 parameters. Same as m 1 , for the experimental aluminum alloy sheet, the value of m 2 is 8. Due to the limitation of the existing experimental data, assuming σ b = σ 0 and a 8 = 1 , and based on the mechanical properties listed in Table 2, the other 7 anisotropic parameters ( a 1 a 7 ) of the Yld2003 yield function are obtained according to the Newton–Raphson numerical method, as shown in Table 4.
Figure 8 shows the experimental and predicted r -value anisotropy and yield stress anisotropy for 6XXX aluminum alloy at quasi-static condition. The comparisons between the theoretical prediction and the experiments show that the Yld2003 yield function describes well both the r-value anisotropy and yield stress anisotropy, while Barlat and Lian’s 1989 yield function significantly overestimates the uniaxial tension yield stress in 45° and 90° with respect to the rolling direction. This is because the anisotropic parameters of Barlat and Lian’s 1989 yield function are only calculated based on r-values, so the predicted yield stress anisotropy may produce a large error. Thus, the Yld2003 yield function is more suitable to describe the initial yield behavior of 6XXX aluminum alloy at quasi-static conditions.
For the cases under high strain rate conditions, the yield behavior with anisotropic characterization of the aluminum alloy sheets should also be considered. Because the deformation process during the SHTB test is finished within microseconds, there is no proper method to obtain the anisotropic r-value at high strain rate conditions (no report in the literature), so here only the initial yielding stress of the samples at high strain rate conditions along three directions are compared. Table 2 shows the true stress data for each case at the experimental plastic strain of 0.01 as the initial yield stress value. From the view of stress anisotropy, the samples at quasi-static condition show regular principle. That is, the YS and UTS decreases with the increase of the tensile angle along the rolling direction. However, the YS and UTS of the dynamic tensile samples at 90° with the rolling direction are generally larger than the data of the sample that is stretched along the rolling direction. So, considering the above factors, it can be concluded that the stress anisotropic behavior of this aluminum alloy sheet is changed from the quasi-static condition to the dynamic condition. Supporting the anisotropic coefficients (r-values) of the aluminum alloy under high strain rate condition are the same as that under quasi-static condition, the anisotropic parameters for the Yld2003 yield function can be calculated based on the initial yield stress data shown in Table 2. Figure 9 shows the variation of the anisotropic parameters of the 7-parameter Yld2003 yield function under different high strain rate conditions. As can be seen from Figure 10, the reliability of the Yld2003 yield function under different high strain rate conditions to well predict the yield stress anisotropy and r-value anisotropy were validated. It is clear that the anisotropic behavior of the aluminum alloy is associated with the strain rate. The results shown in Figure 9 can be used to describe the initial yield behavior of this aluminum alloy sheet at both quasi-static and high strain rate conditions. By fitting the seven anisotropic parameters as the function of strain rate, the anisotropic yield behavior of this material under different strain rates can be simply obtained.

4. Microstructure Analysis

The evolution of the microstructure for the 6XXX aluminum alloy samples under various strain rate conditions was investigated based on SEM technology based on “VEGA 3 SBH” (TESCAN, Brno, Czech Republic). Figure 11 shows the uniaxial tension samples after fracture, in which the high strain rate samples are small sections cut from the HSPB apparatus. There is an obvious difference between the fracture of the samples under quasi-static condition and that under high strain rate condition. The cross section of the fracture under quasi-static condition is oblique (along 45° orientation) to the tensile condition, and there is no obvious change in fracture width. However, the cross section of the fracture under high strain rate condition is almost perpendicular to the tensile condition, and the width of the fracture is significantly reduced.
Figure 12 also presents the macroscopic and microscopic fracture appearance of the samples at the initial state, under quasi-static tensile condition and high strain rate tensile condition along rolling directions. From a macroscopic point of view, the fracture surface of the samples after the quasi-static tension is relatively flat and there is no obvious necking on the fracture surface, while the fracture surface of the samples after dynamic tension changes greatly, and there are obvious fluctuations. From a microcosmic point of view, the uniformly distributed dimple-like morphology is observed for a quasi-static tensile fracture surface, and it demonstrates the typical characteristic of ductile fracture mode. The average diameter of the dimple at quasi-static condition is 50 µm. However, under high strain rate condition, the dimples of the fracture surface have varied strongly in size. The diameter of the larger dimple is up to 150 µm, and smaller dimples with a diameter of 20 µm can be observed in some larger dimples (or called nesting dimples). As explained in the work of Li et al. [31], the nesting dimples can produce a larger deformation, and thus it improves the formability to a certain extent. From a strain rate of 1000 s−1 to 3000 s−1, there is no obvious variation along the fracture surface. The above analysis indicates that the fracture mechanism has changed from the quasi-static condition to the dynamic tensile condition, which contributes to the enhancement of the formability of this aluminum alloy sheet in high strain rate condition.
Figure 13 also shows the microscopic fracture appearance of the samples under various strain rate conditions along the other two tensile directions. Similarly, both the samples at quasi-static condition show the characteristics of ductile fracture mode. For high strain rate cases along 45° and 90° to the rolling direction, the uniformity of the dimples is significantly deteriorated compared with the cases at quasi-static condition. As strain rate increased to 3000 s−1 (as shown in Figure 13g,h), the number of larger dimples are increased significantly; this means that the necking phenomenon has lasted for a long time, and thus the plasticity of the aluminum alloy sheet has been improved macroscopically. In addition, stepped slip band can be observed at the edge of the larger dimples, which indicates that the fracture model has changed from typical ductile fracture at quasi-static condition to the mixture of both ductile fracture and shear fracture at high strain rate conditions. This observation is similar to that of Ahmed et al. (2017) in the case of electrohydraulic forming of an AA5052 aluminum alloy. It should be noted that some significant round components are observed in Figure 13f, while they are not obviously seen in other Figures. This may be due to the contamination of the fracture surface in the environment, the corresponding chemical composition would be measured in future work.

5. Conclusions

Here in this paper, the material characterizations of 6XXX aluminum alloy at quasi-static condition and at high strain rate conditions are investigated through experiments and theoretical models. The uniaxial tensile tests at quasi-static condition and the split Hopkinson tensile bar tests at different high strain rates along different orientations to the rolling direction were carried out to capture the stress–strain data, then the Johnson–Cook model and two anisotropic yield functions (Barlat and Lian’s 1989 and Yld2003) were used to describe the hardening behavior and the yielding behavior of the aluminum alloy, respectively. Besides, the SEM measurements were carried out to investigate the influence of high strain rate on the fractograph. The key conclusions can be summarized as follows:
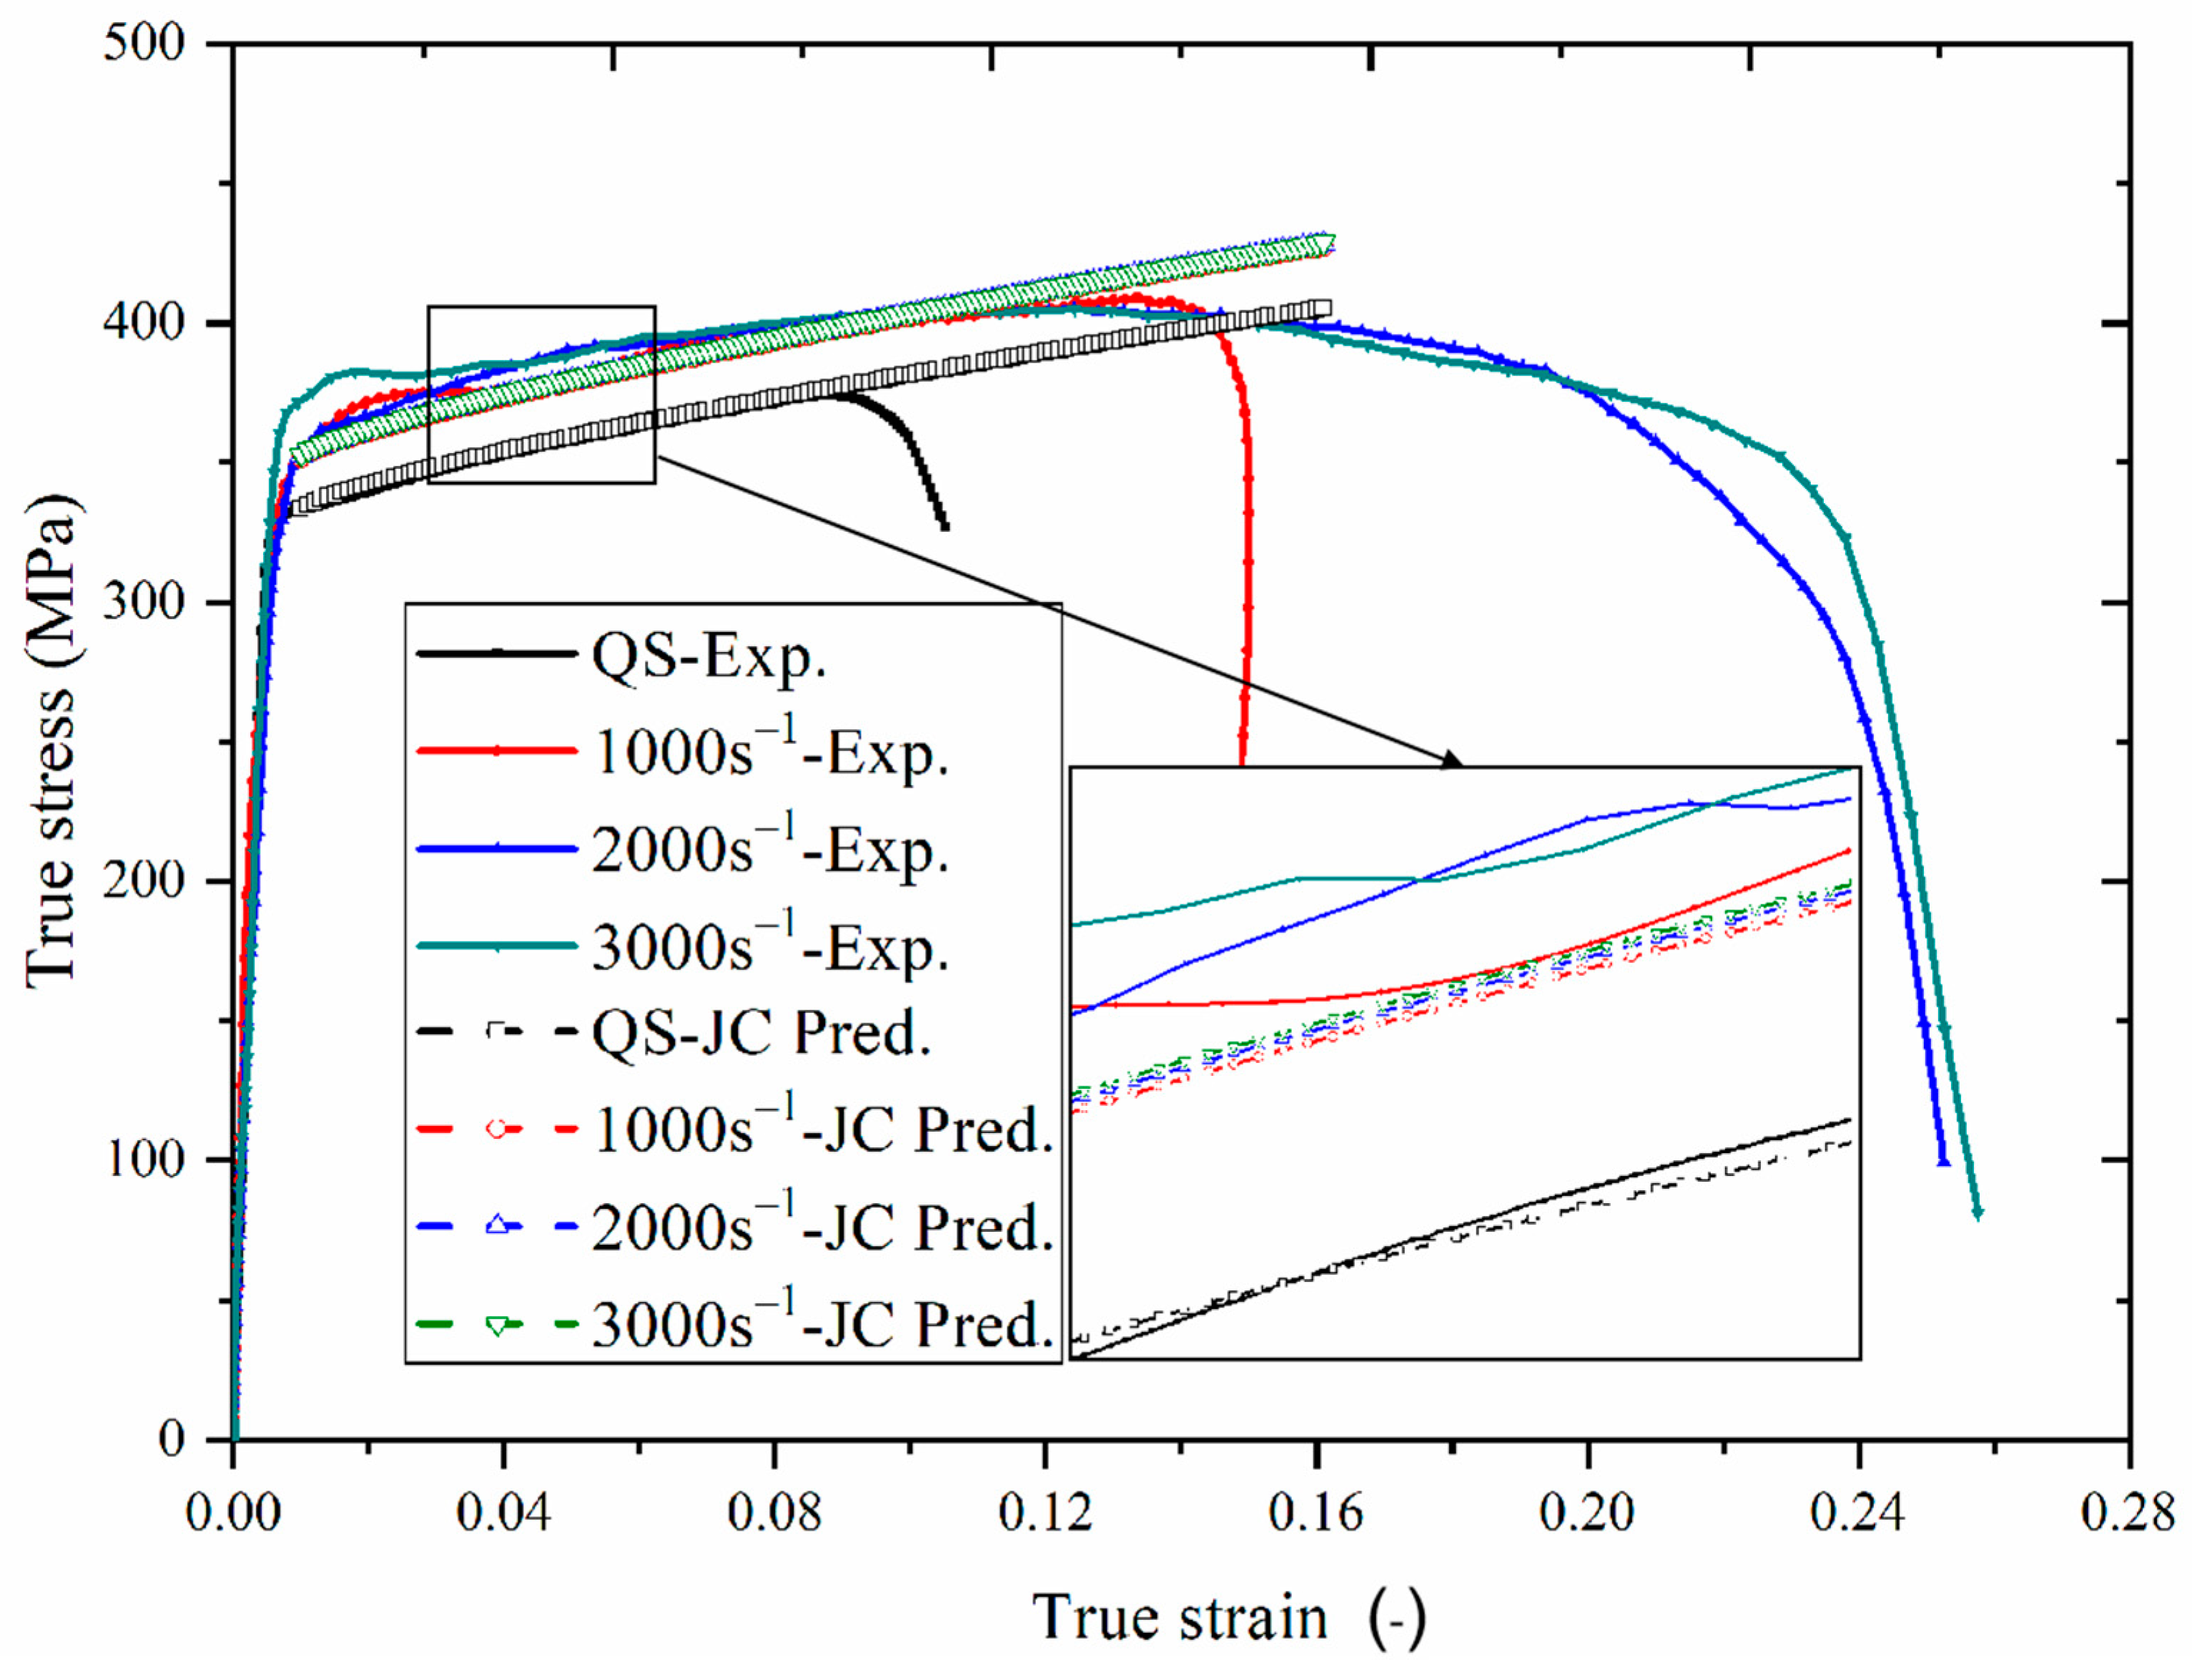
  • 6XXX aluminum alloy sheet has obvious strain-rate-dependent and certain anisotropic characteristics. The Johnson–Cook model can describe the stress–strain characterization of the aluminum alloy at both quasi-static condition and high strain rate condition quite well.
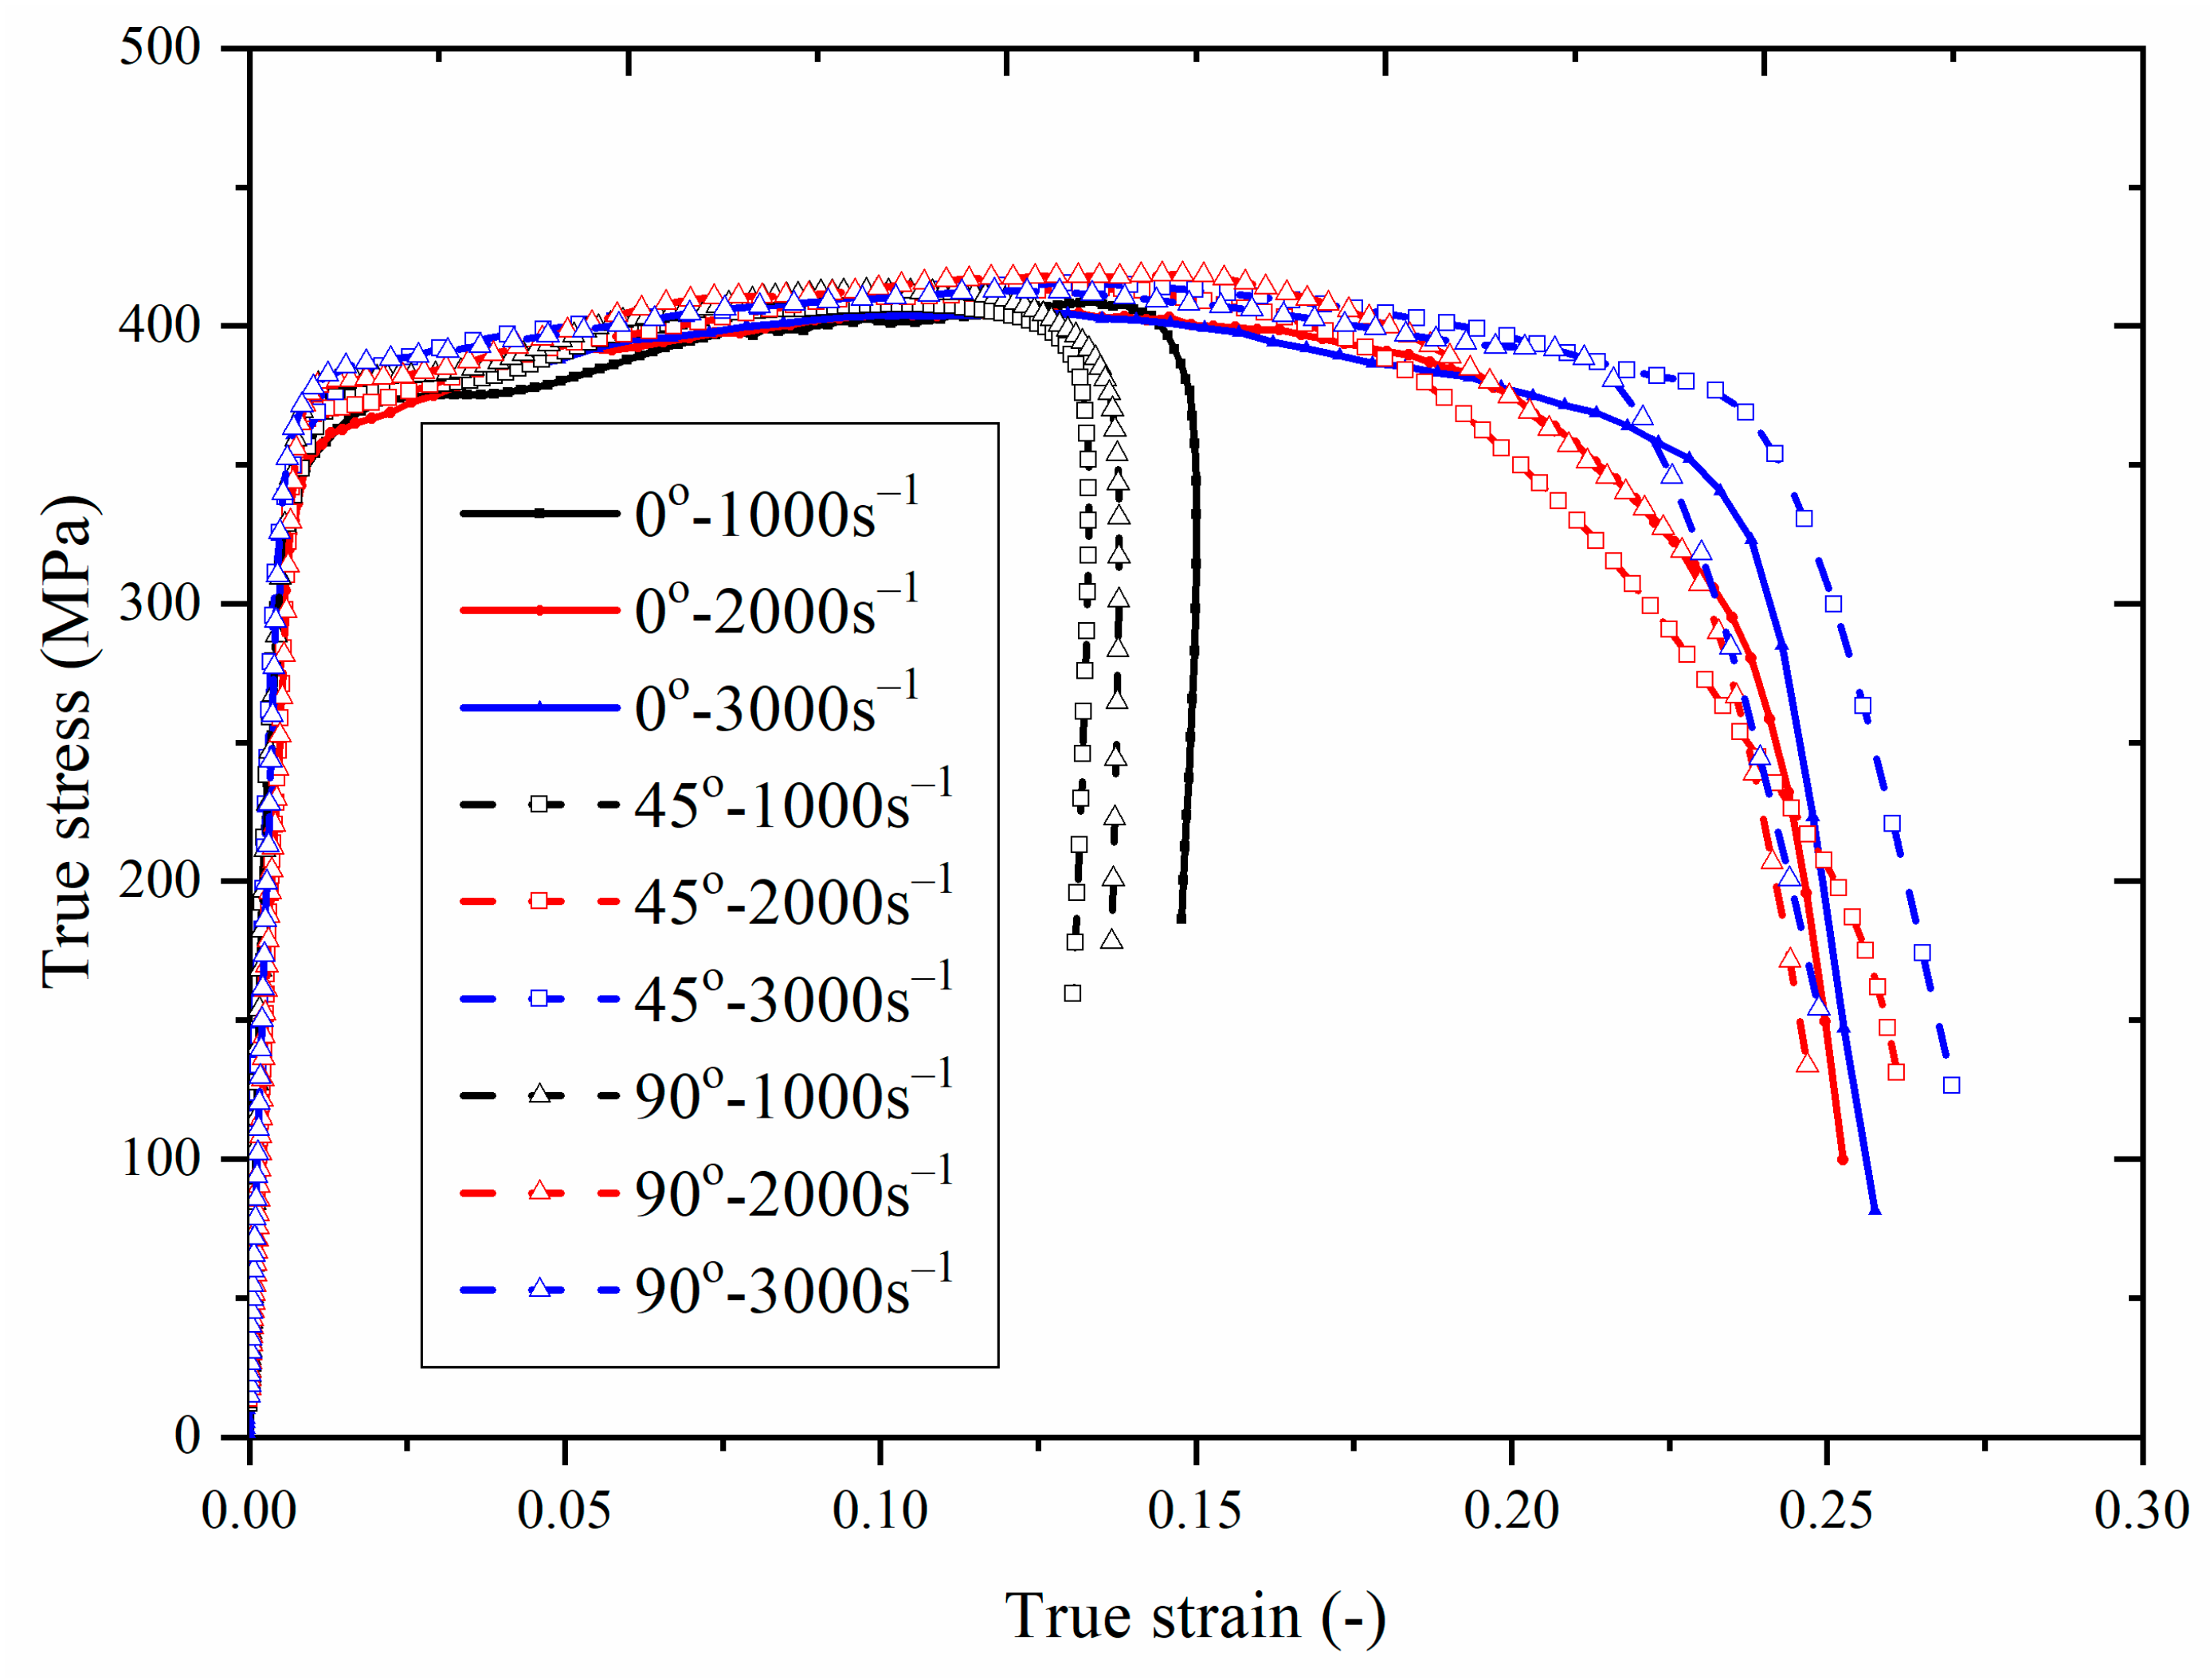
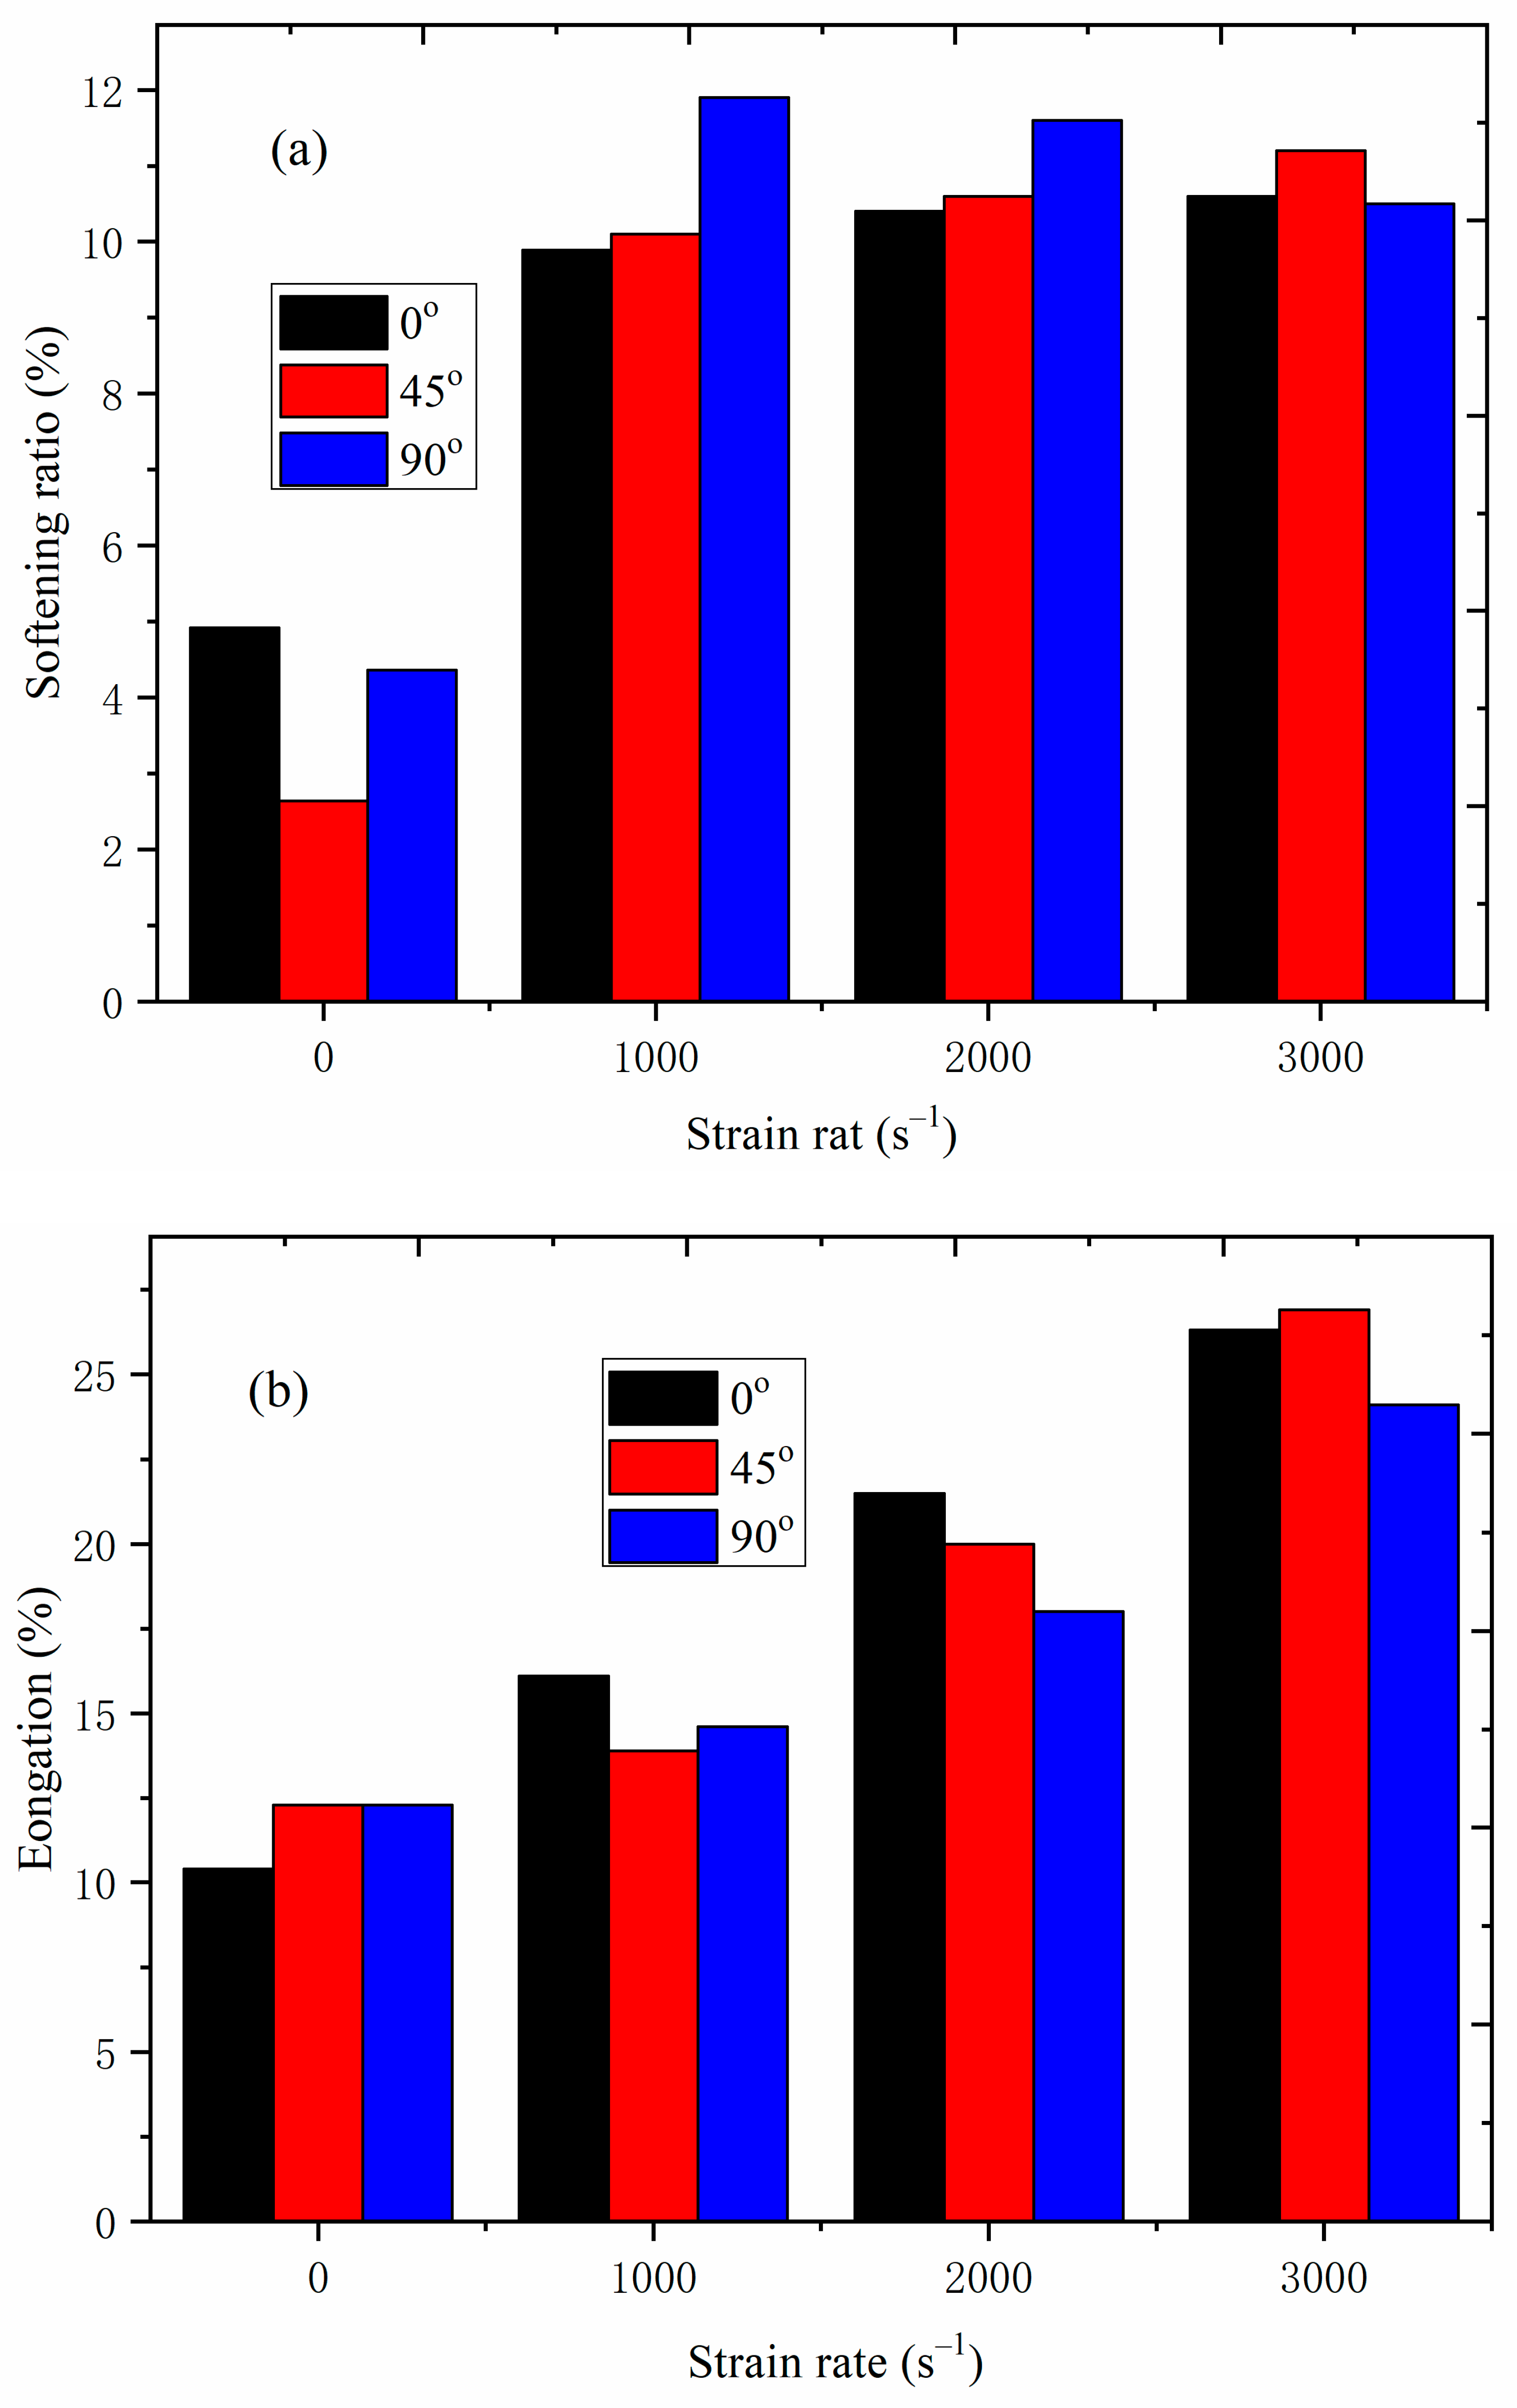
  • The yield stress, tensile strength, maximum strain (or ductility) and the softening degree of 6XXX aluminum alloy sheet increase greatly with the increase of strain rate.
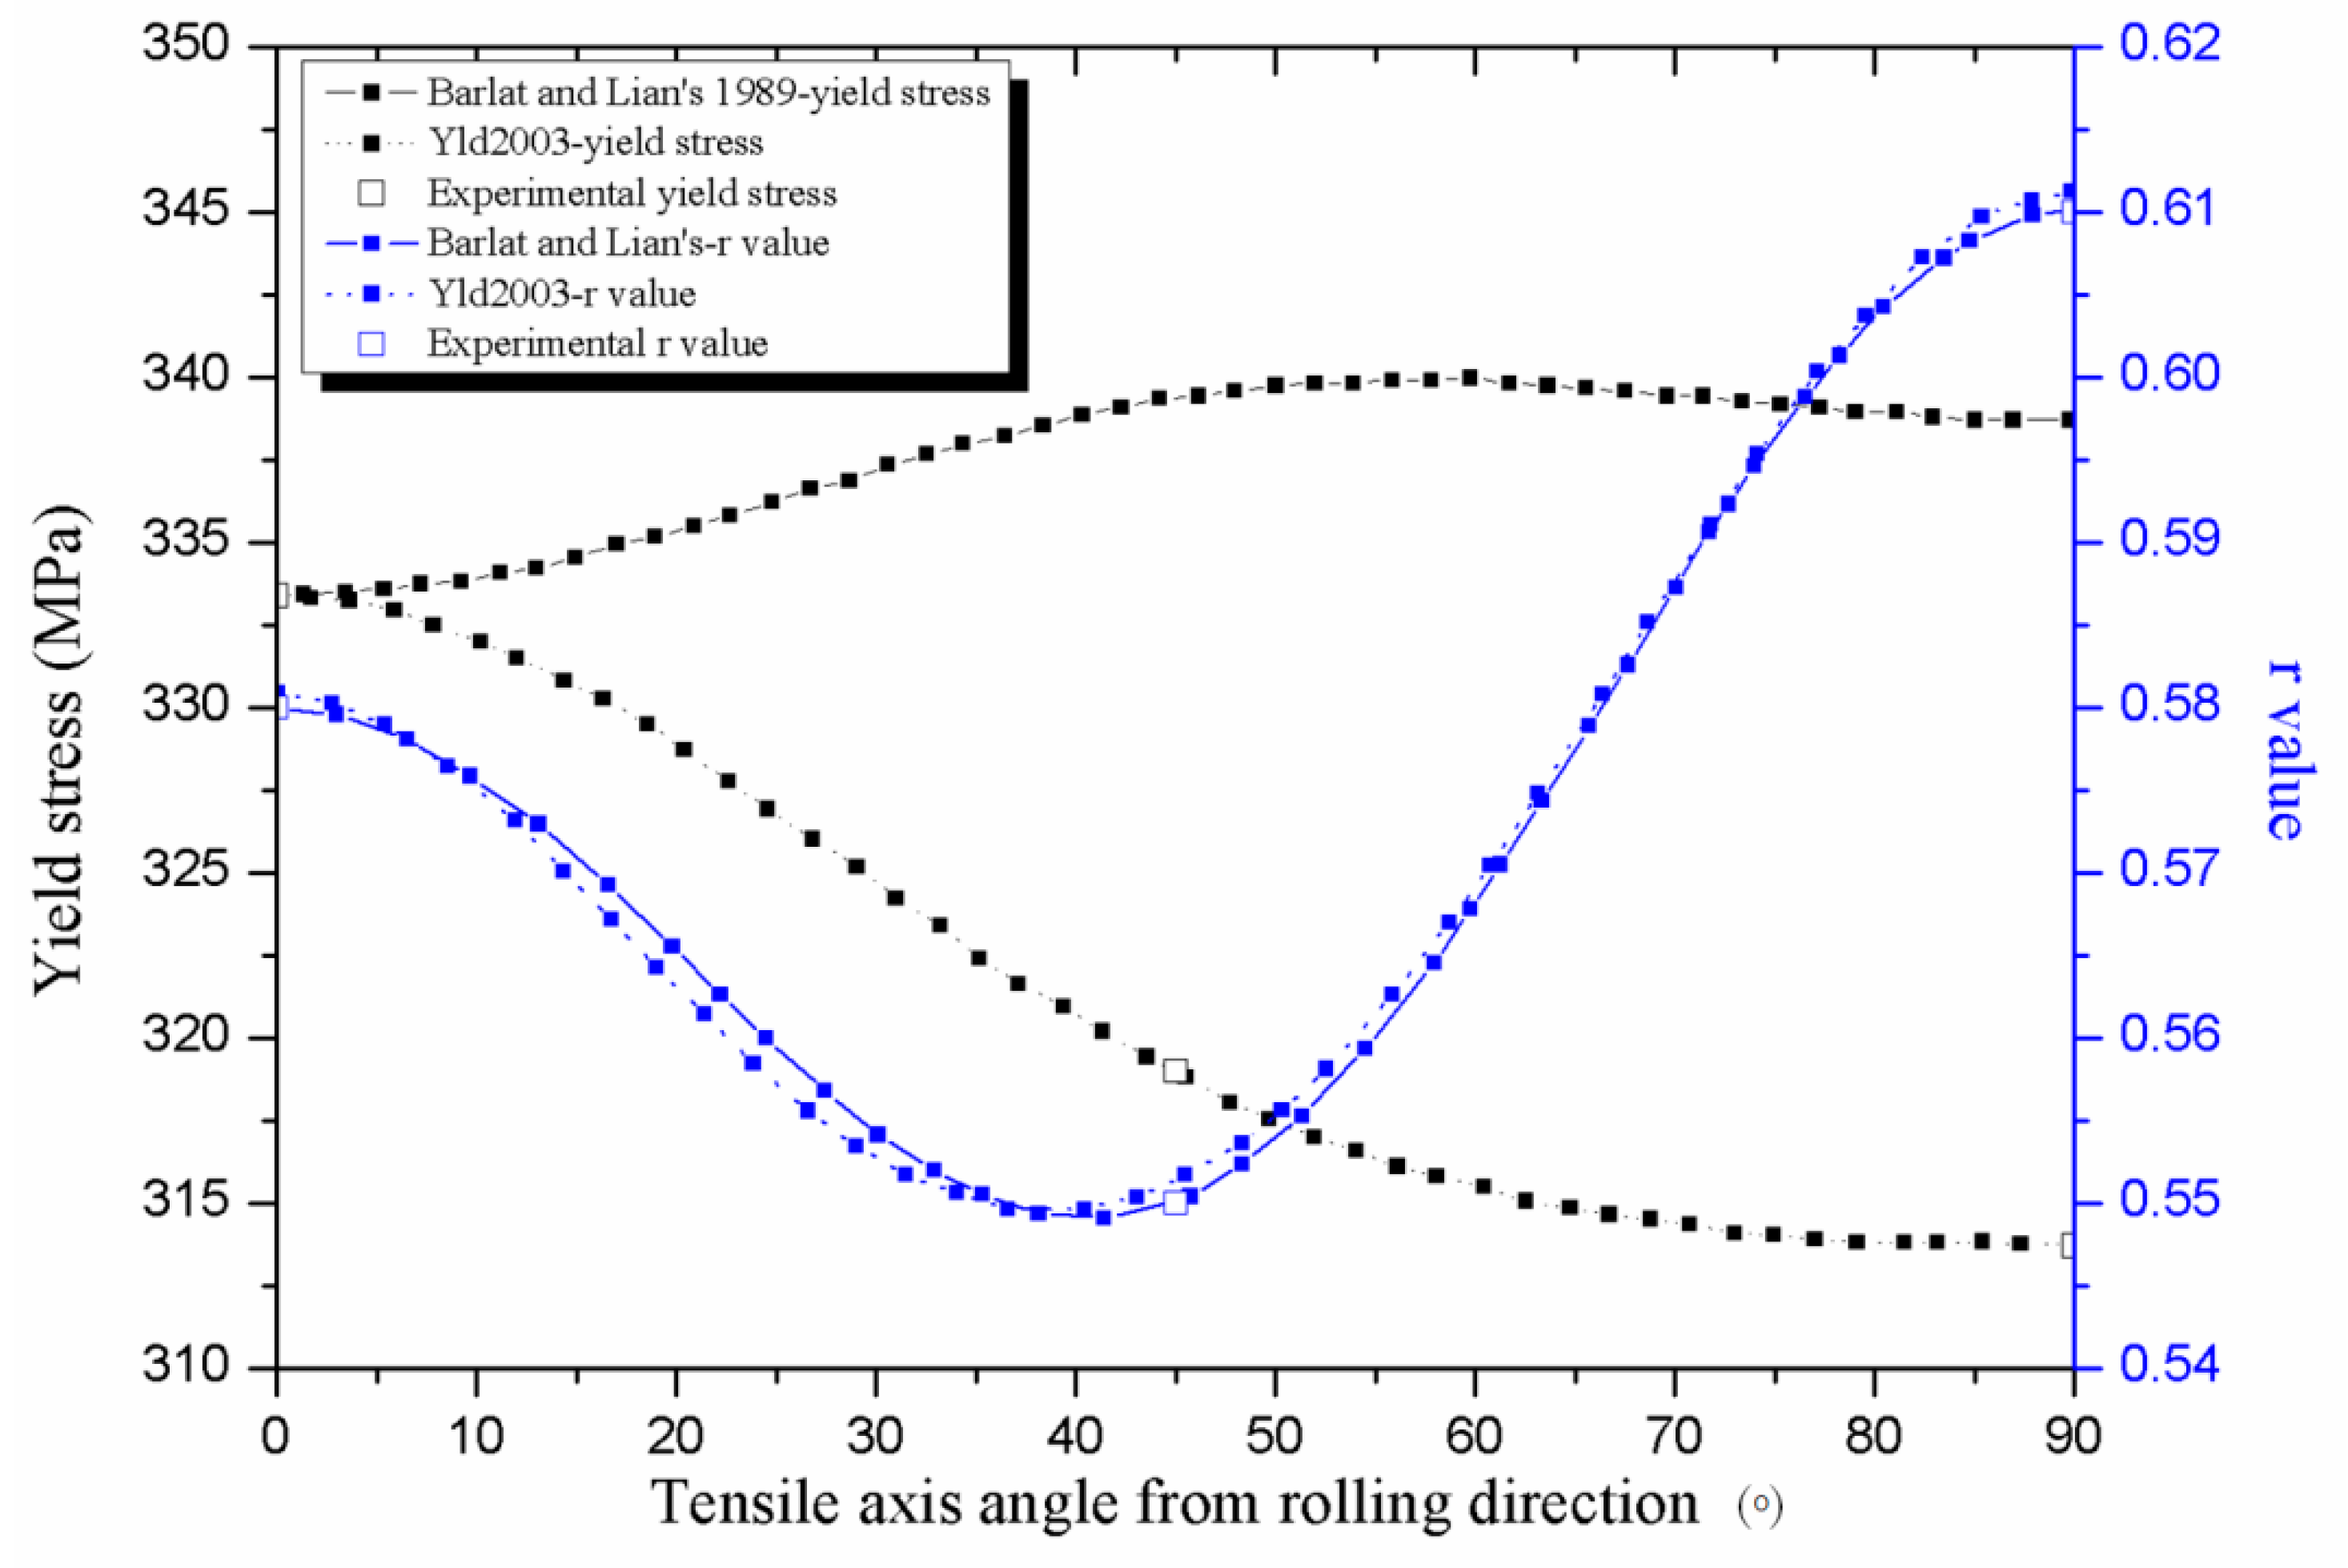
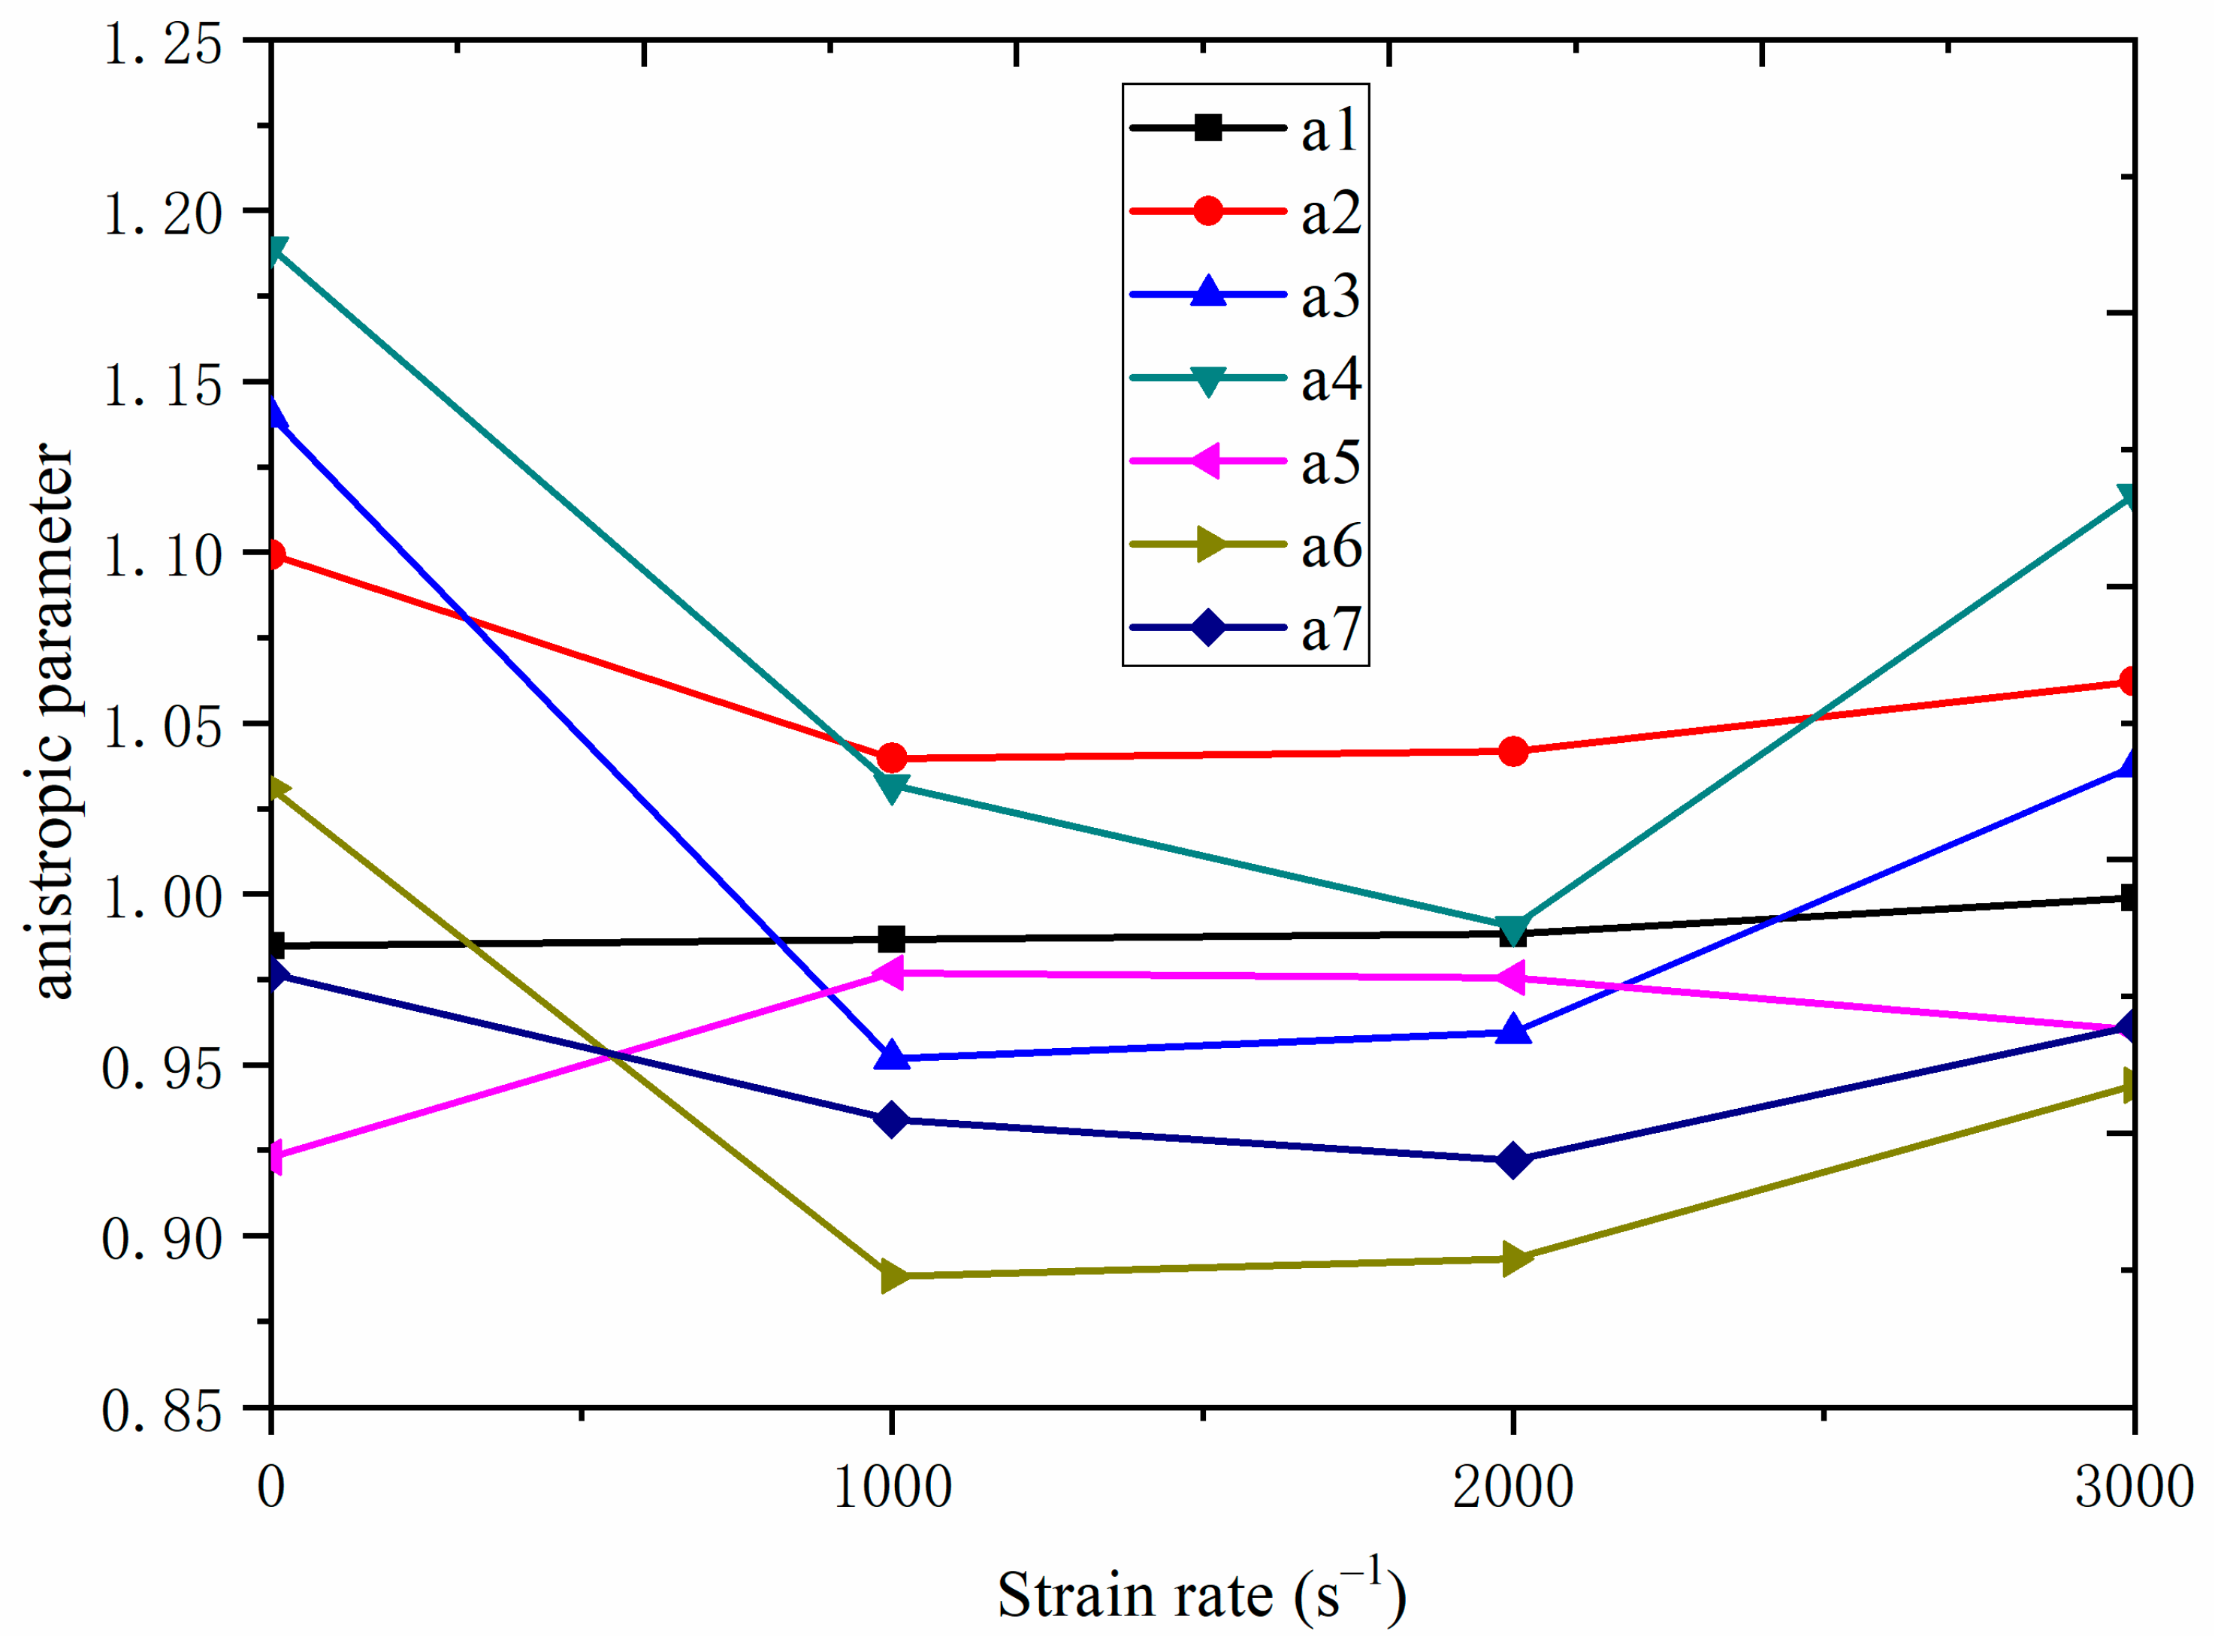
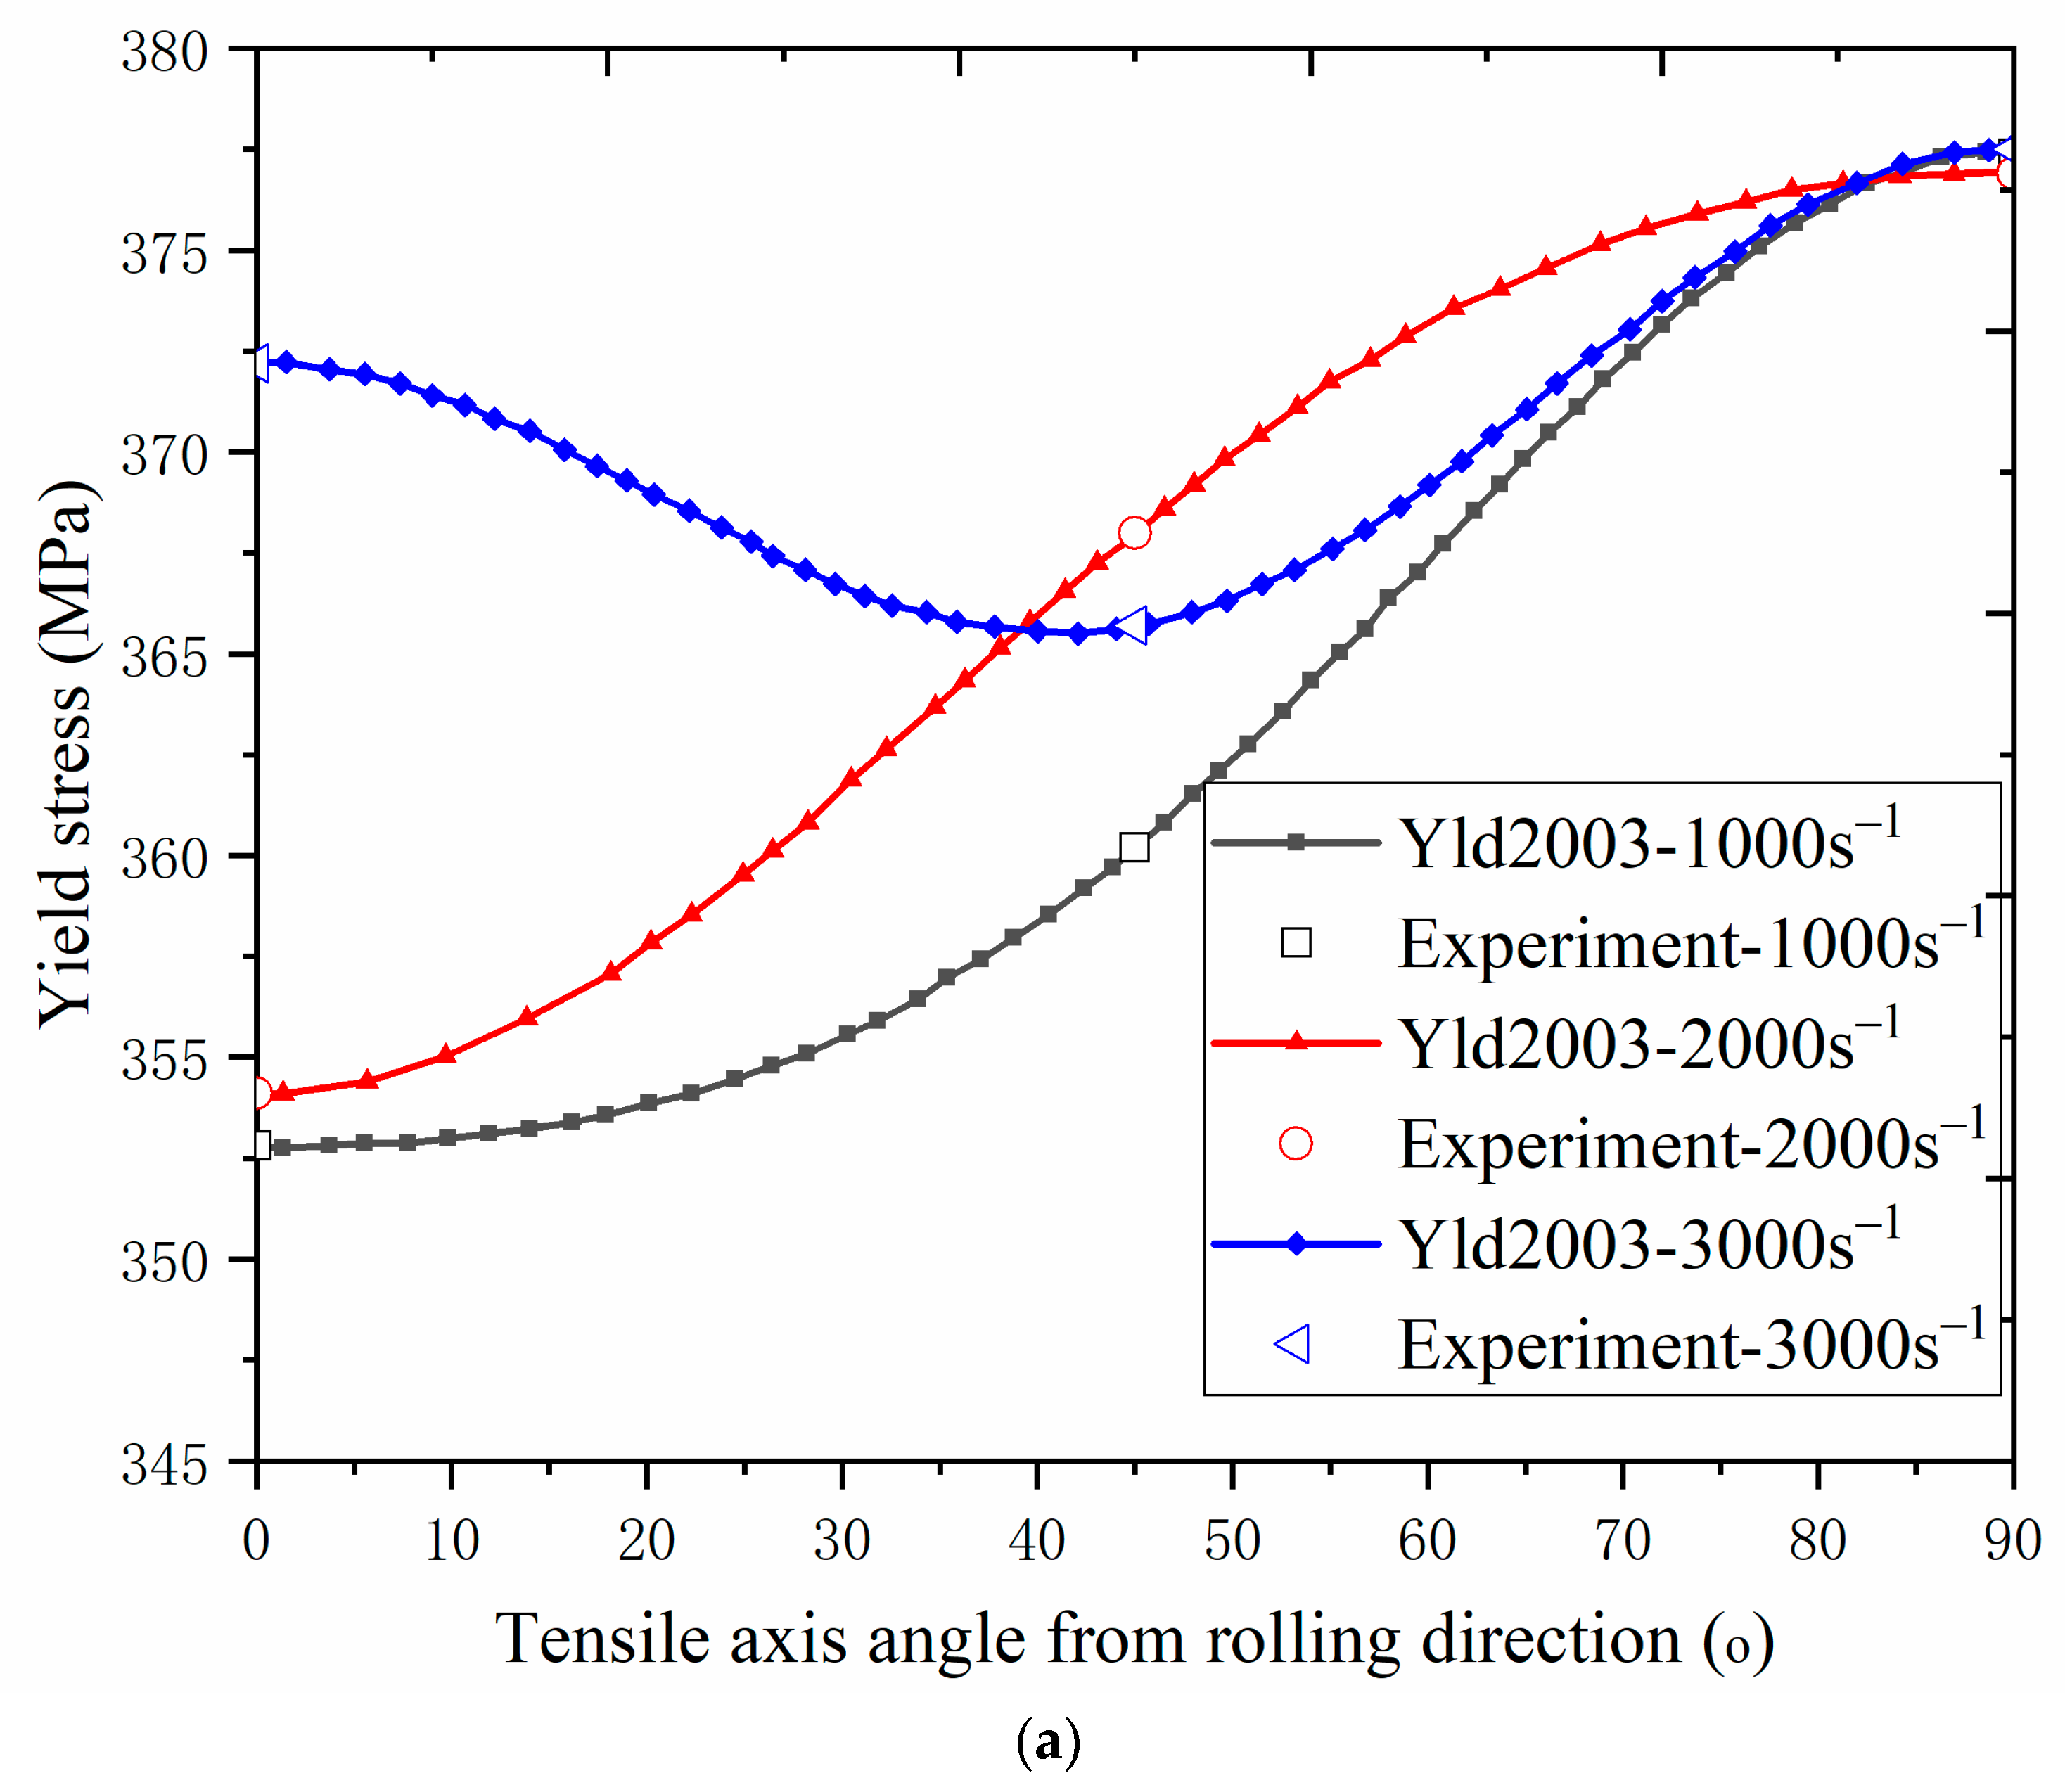
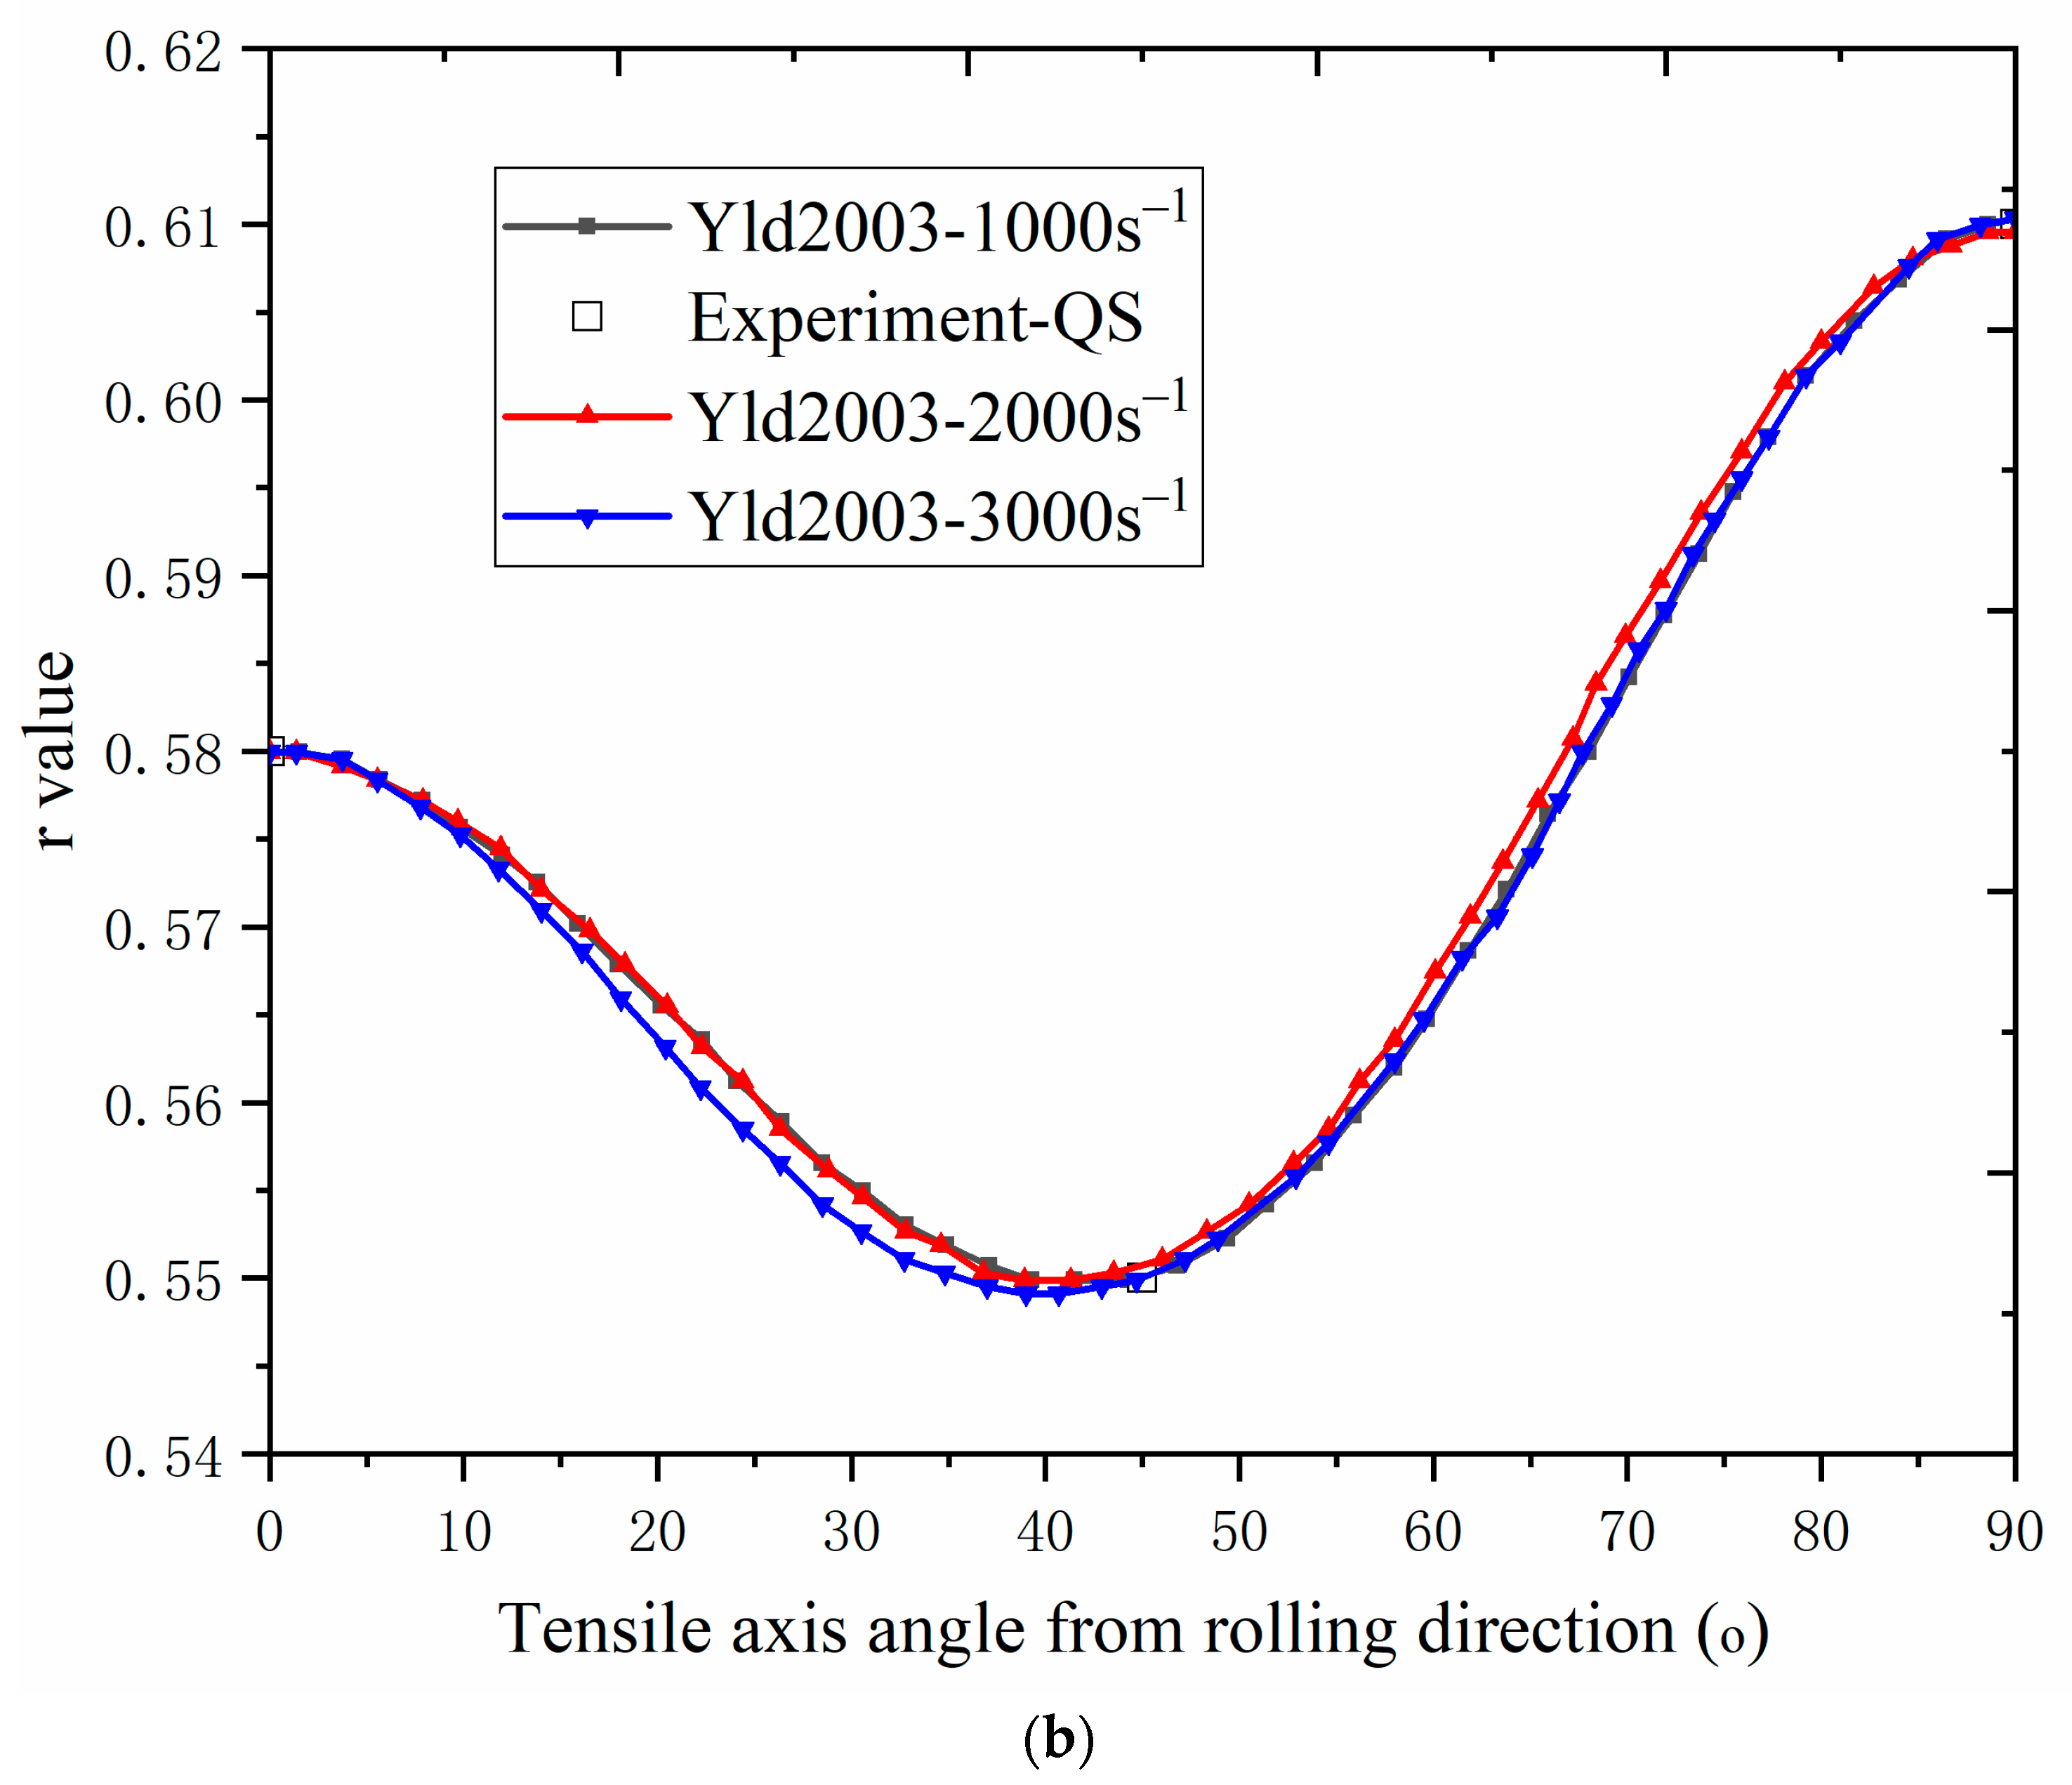
  • Compared with Barlat and Lian’s 1989 yield function, the Yld2003 yield function with variable anisotropic parameters associated with strain rate can better predict the yielding behavior of the aluminum alloy under quasi-static condition and high strain rate conditions. In addition, the stress anisotropic behavior of this aluminum alloy sheet is changed from the quasi-static condition to the dynamic condition.
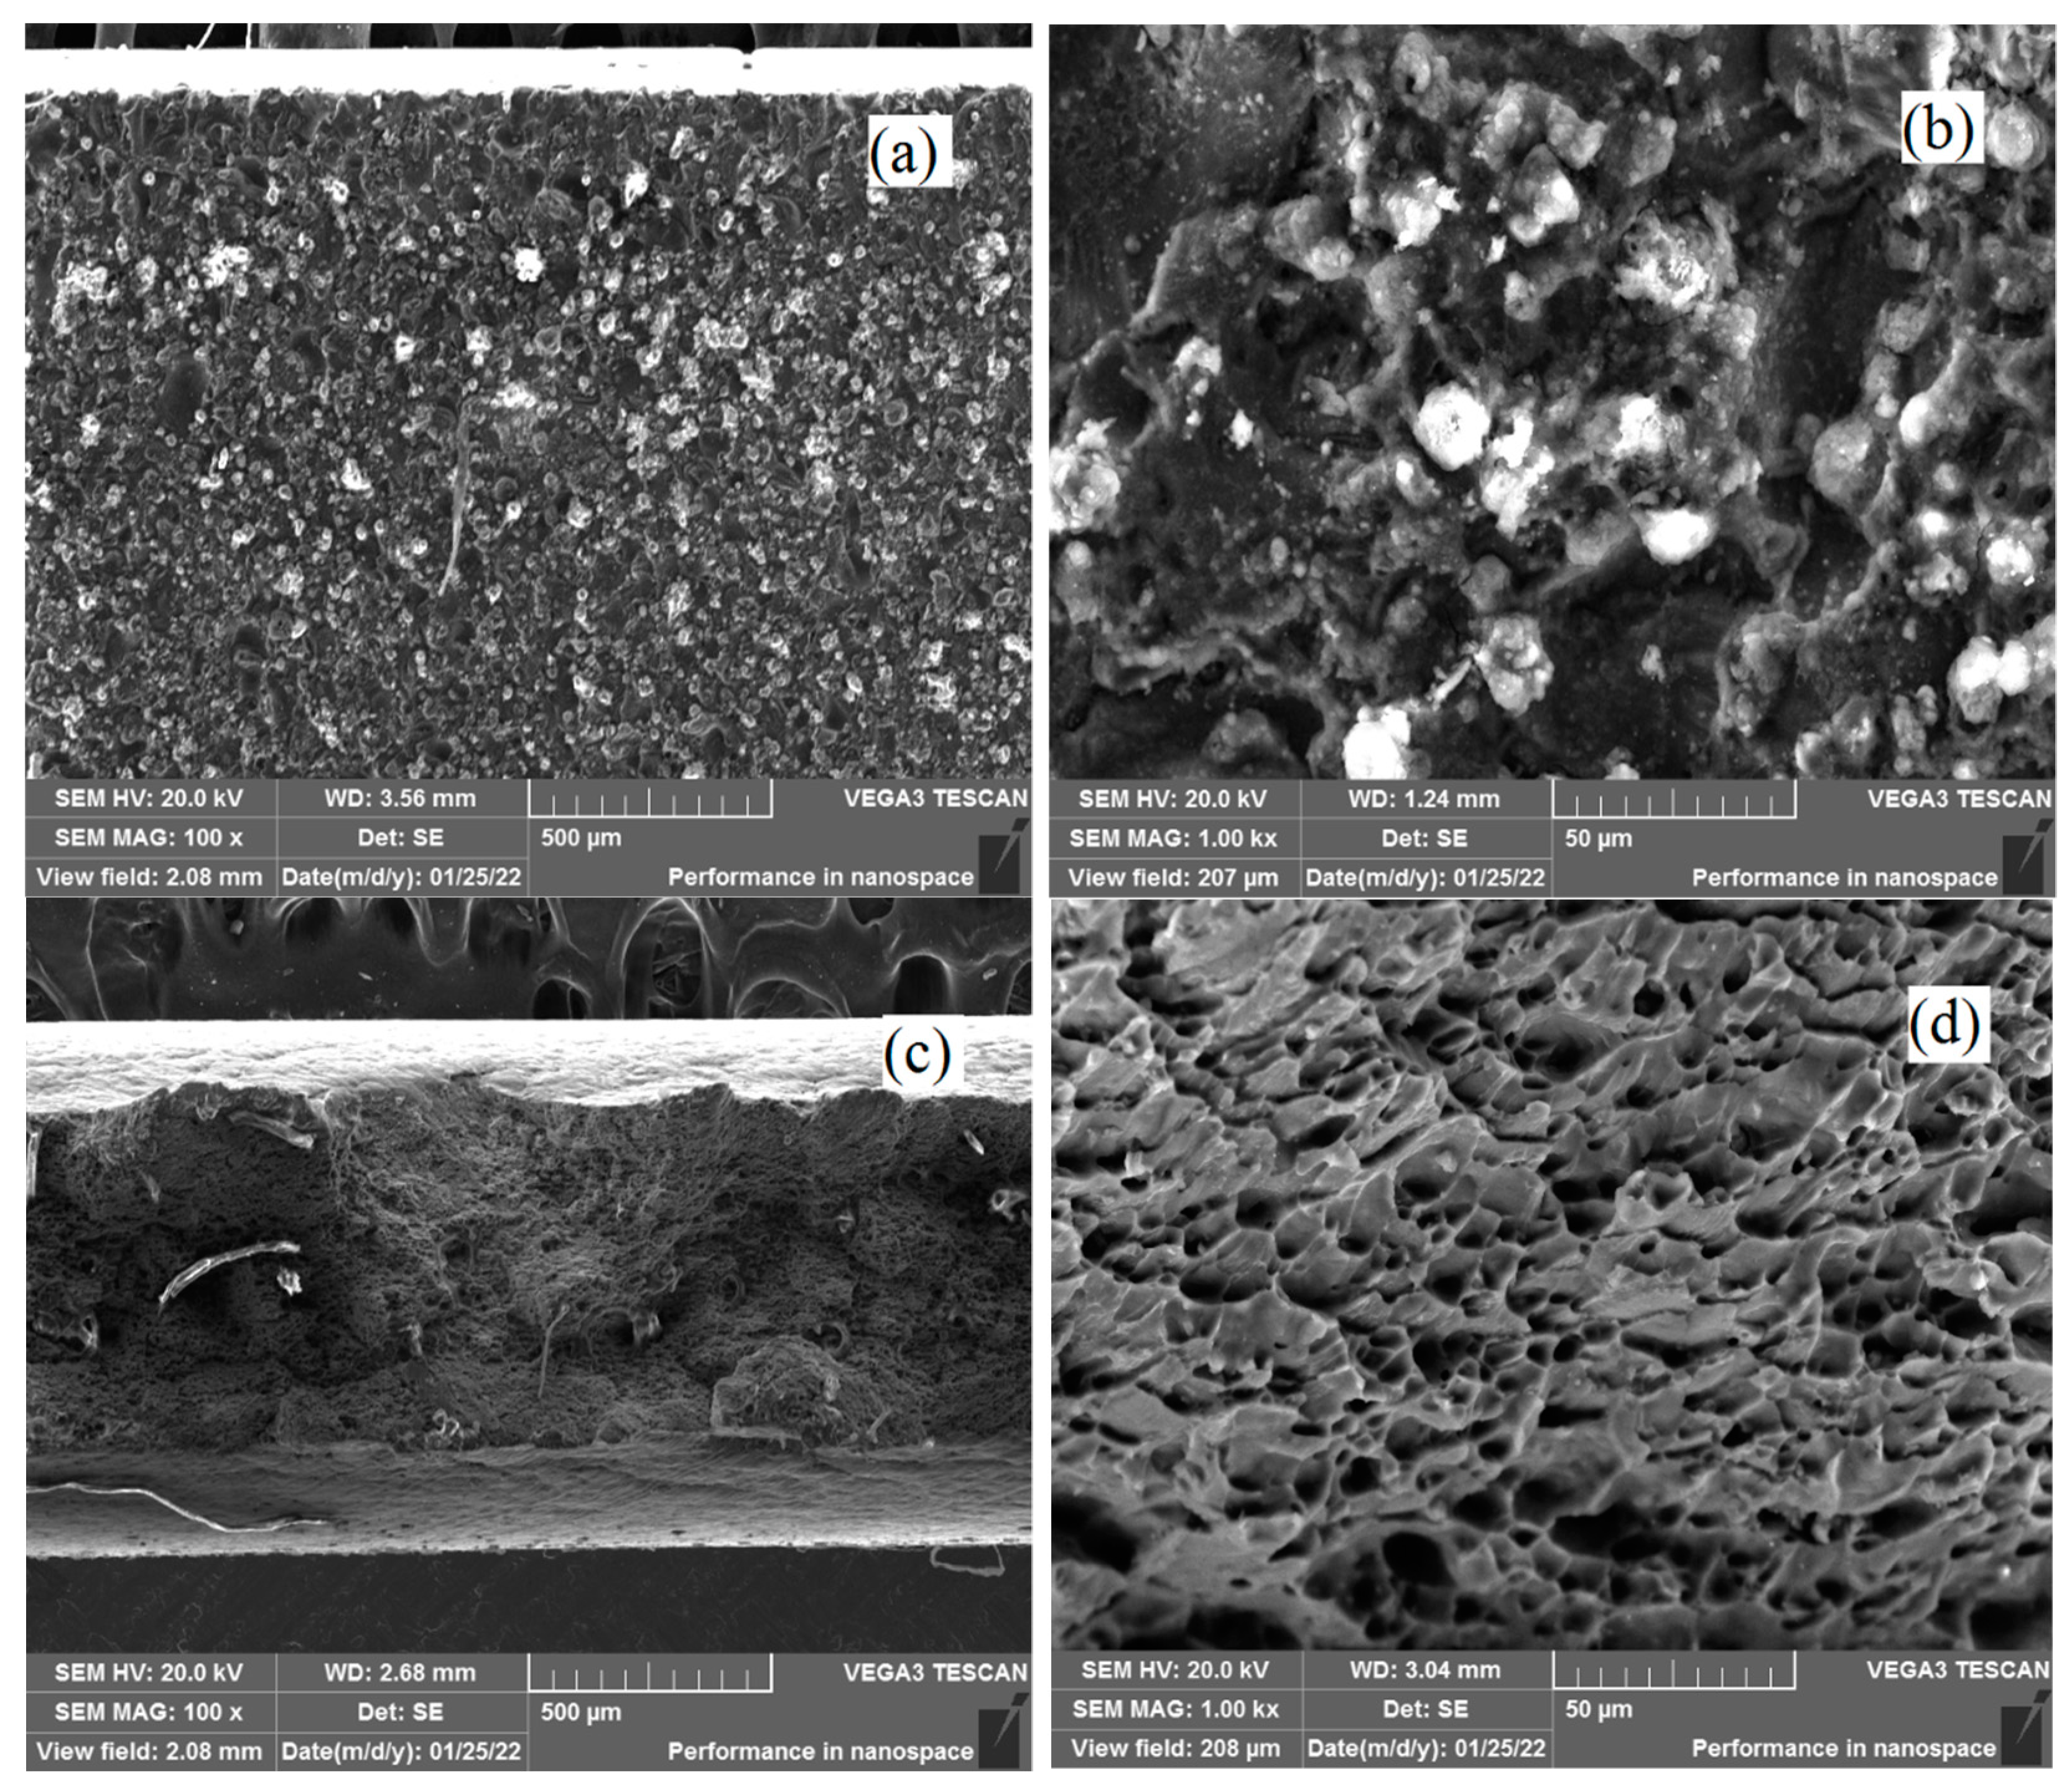
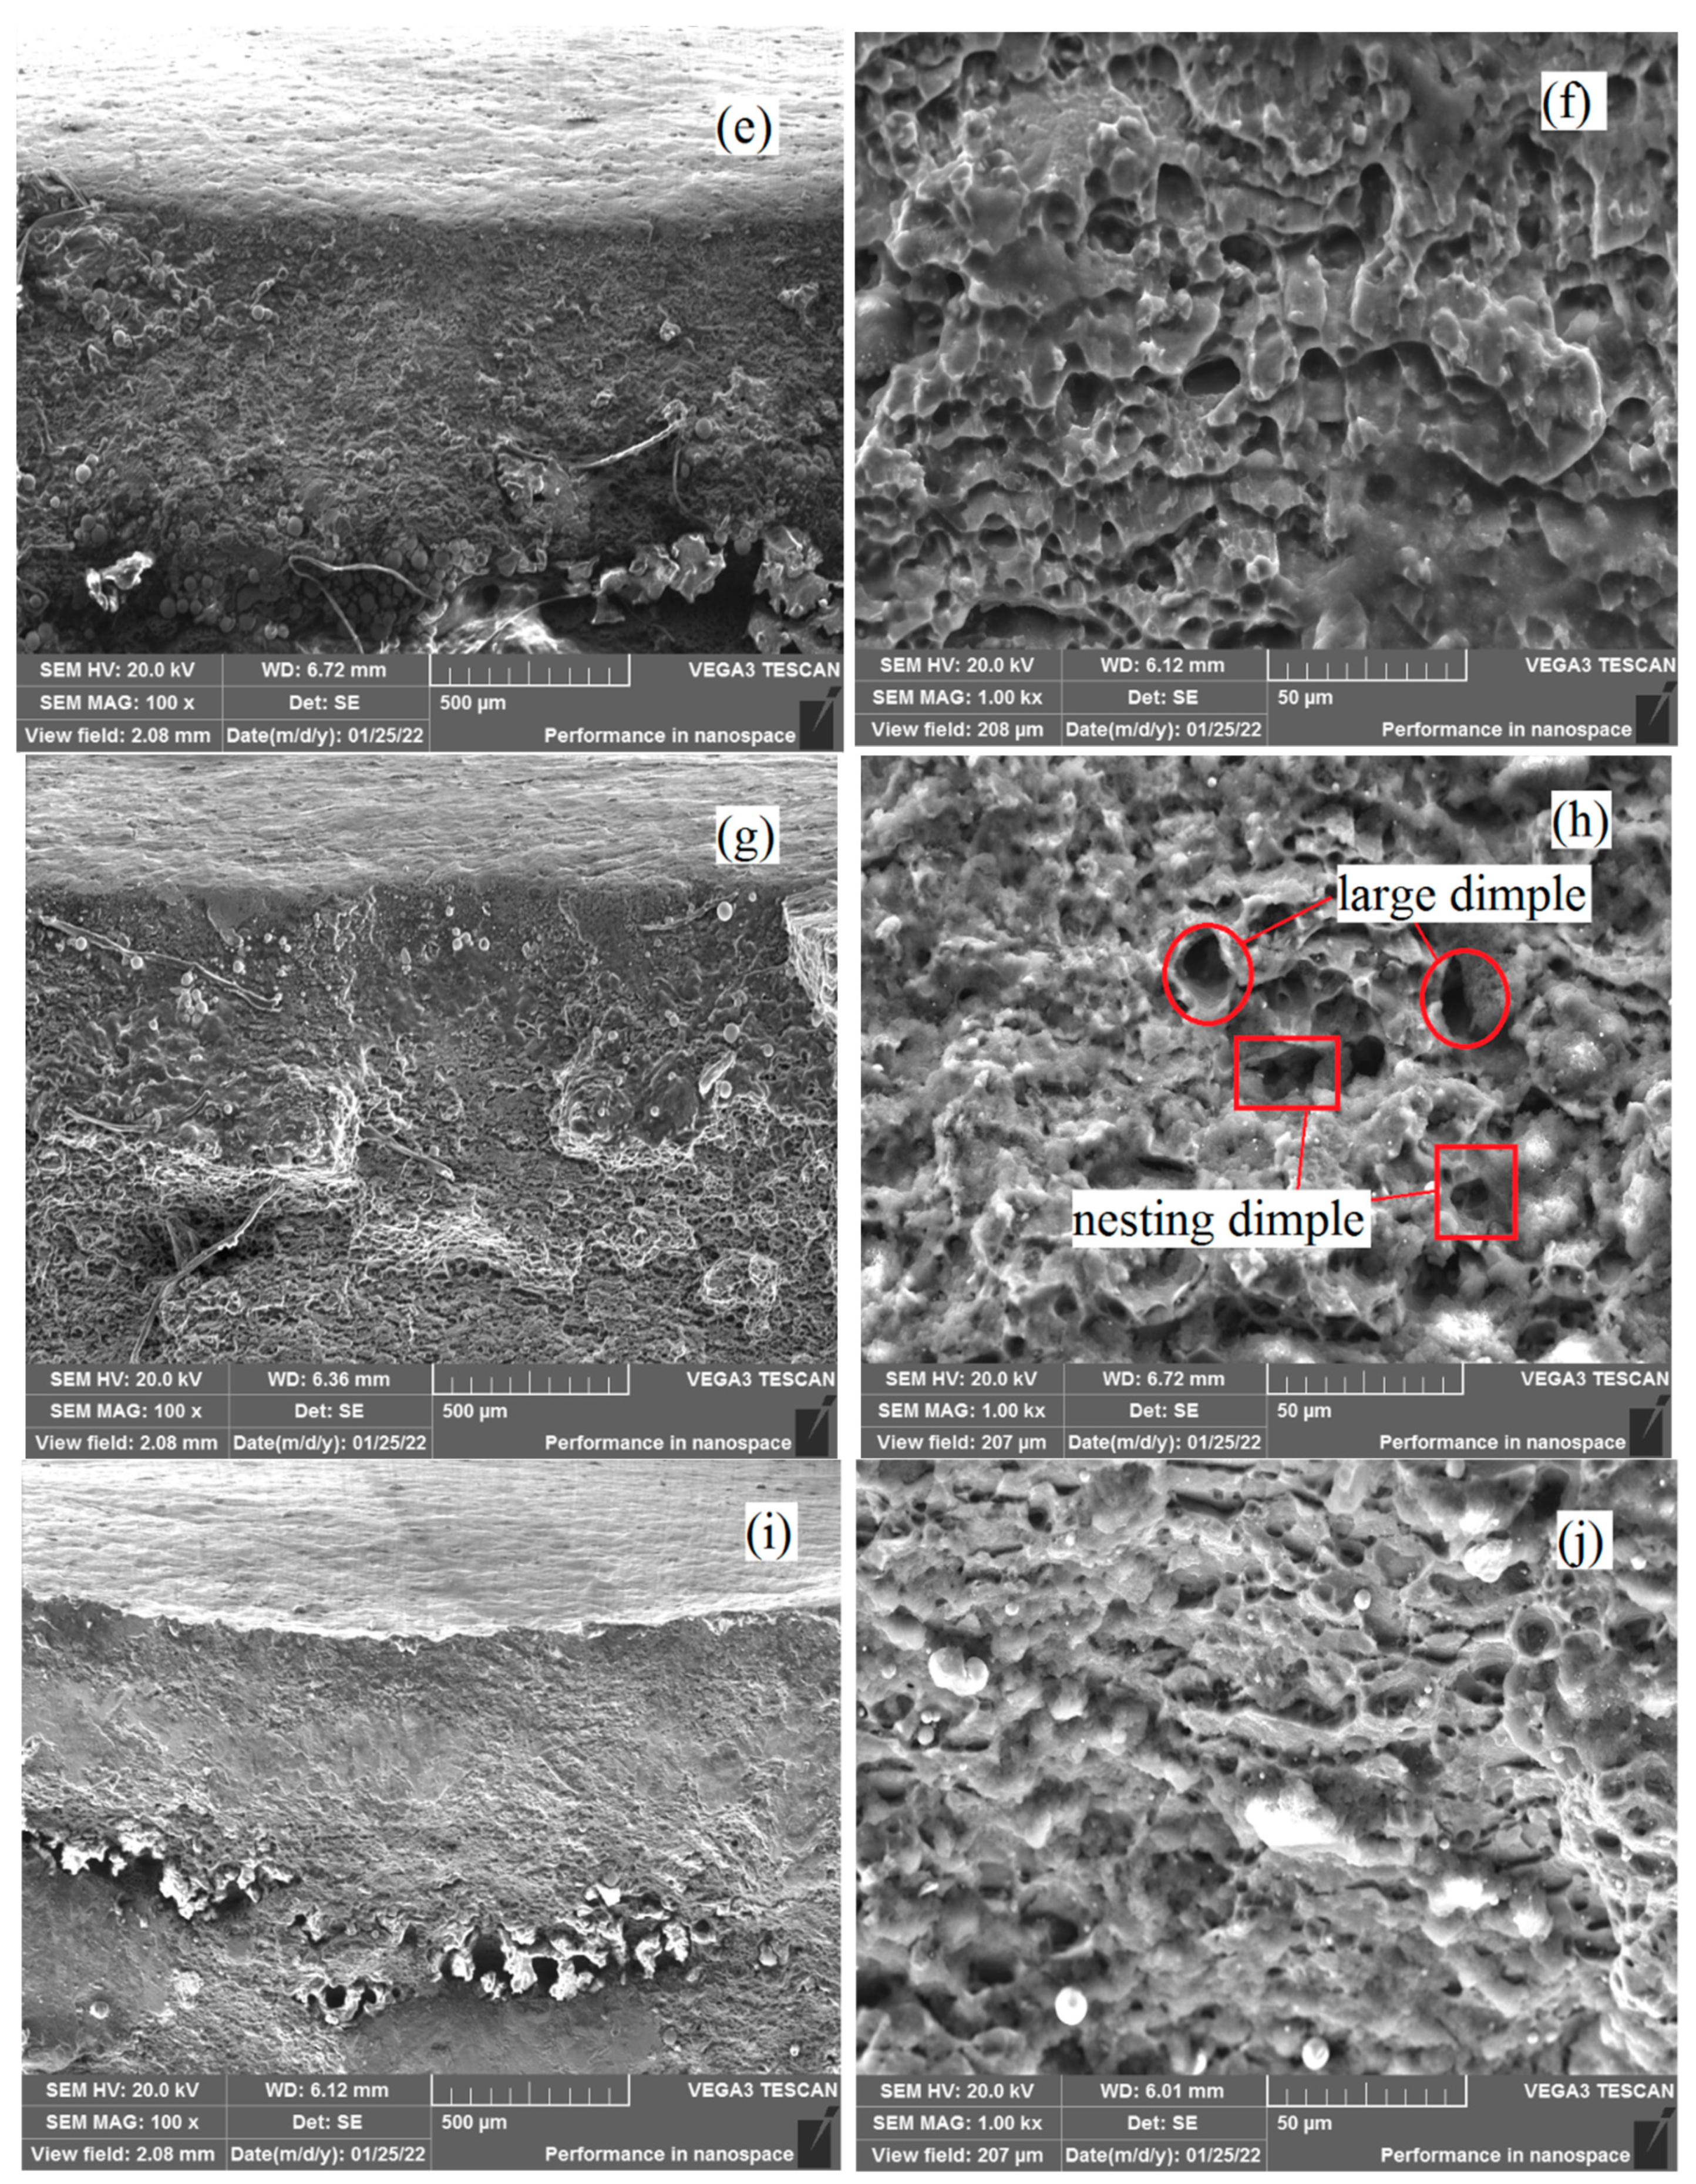
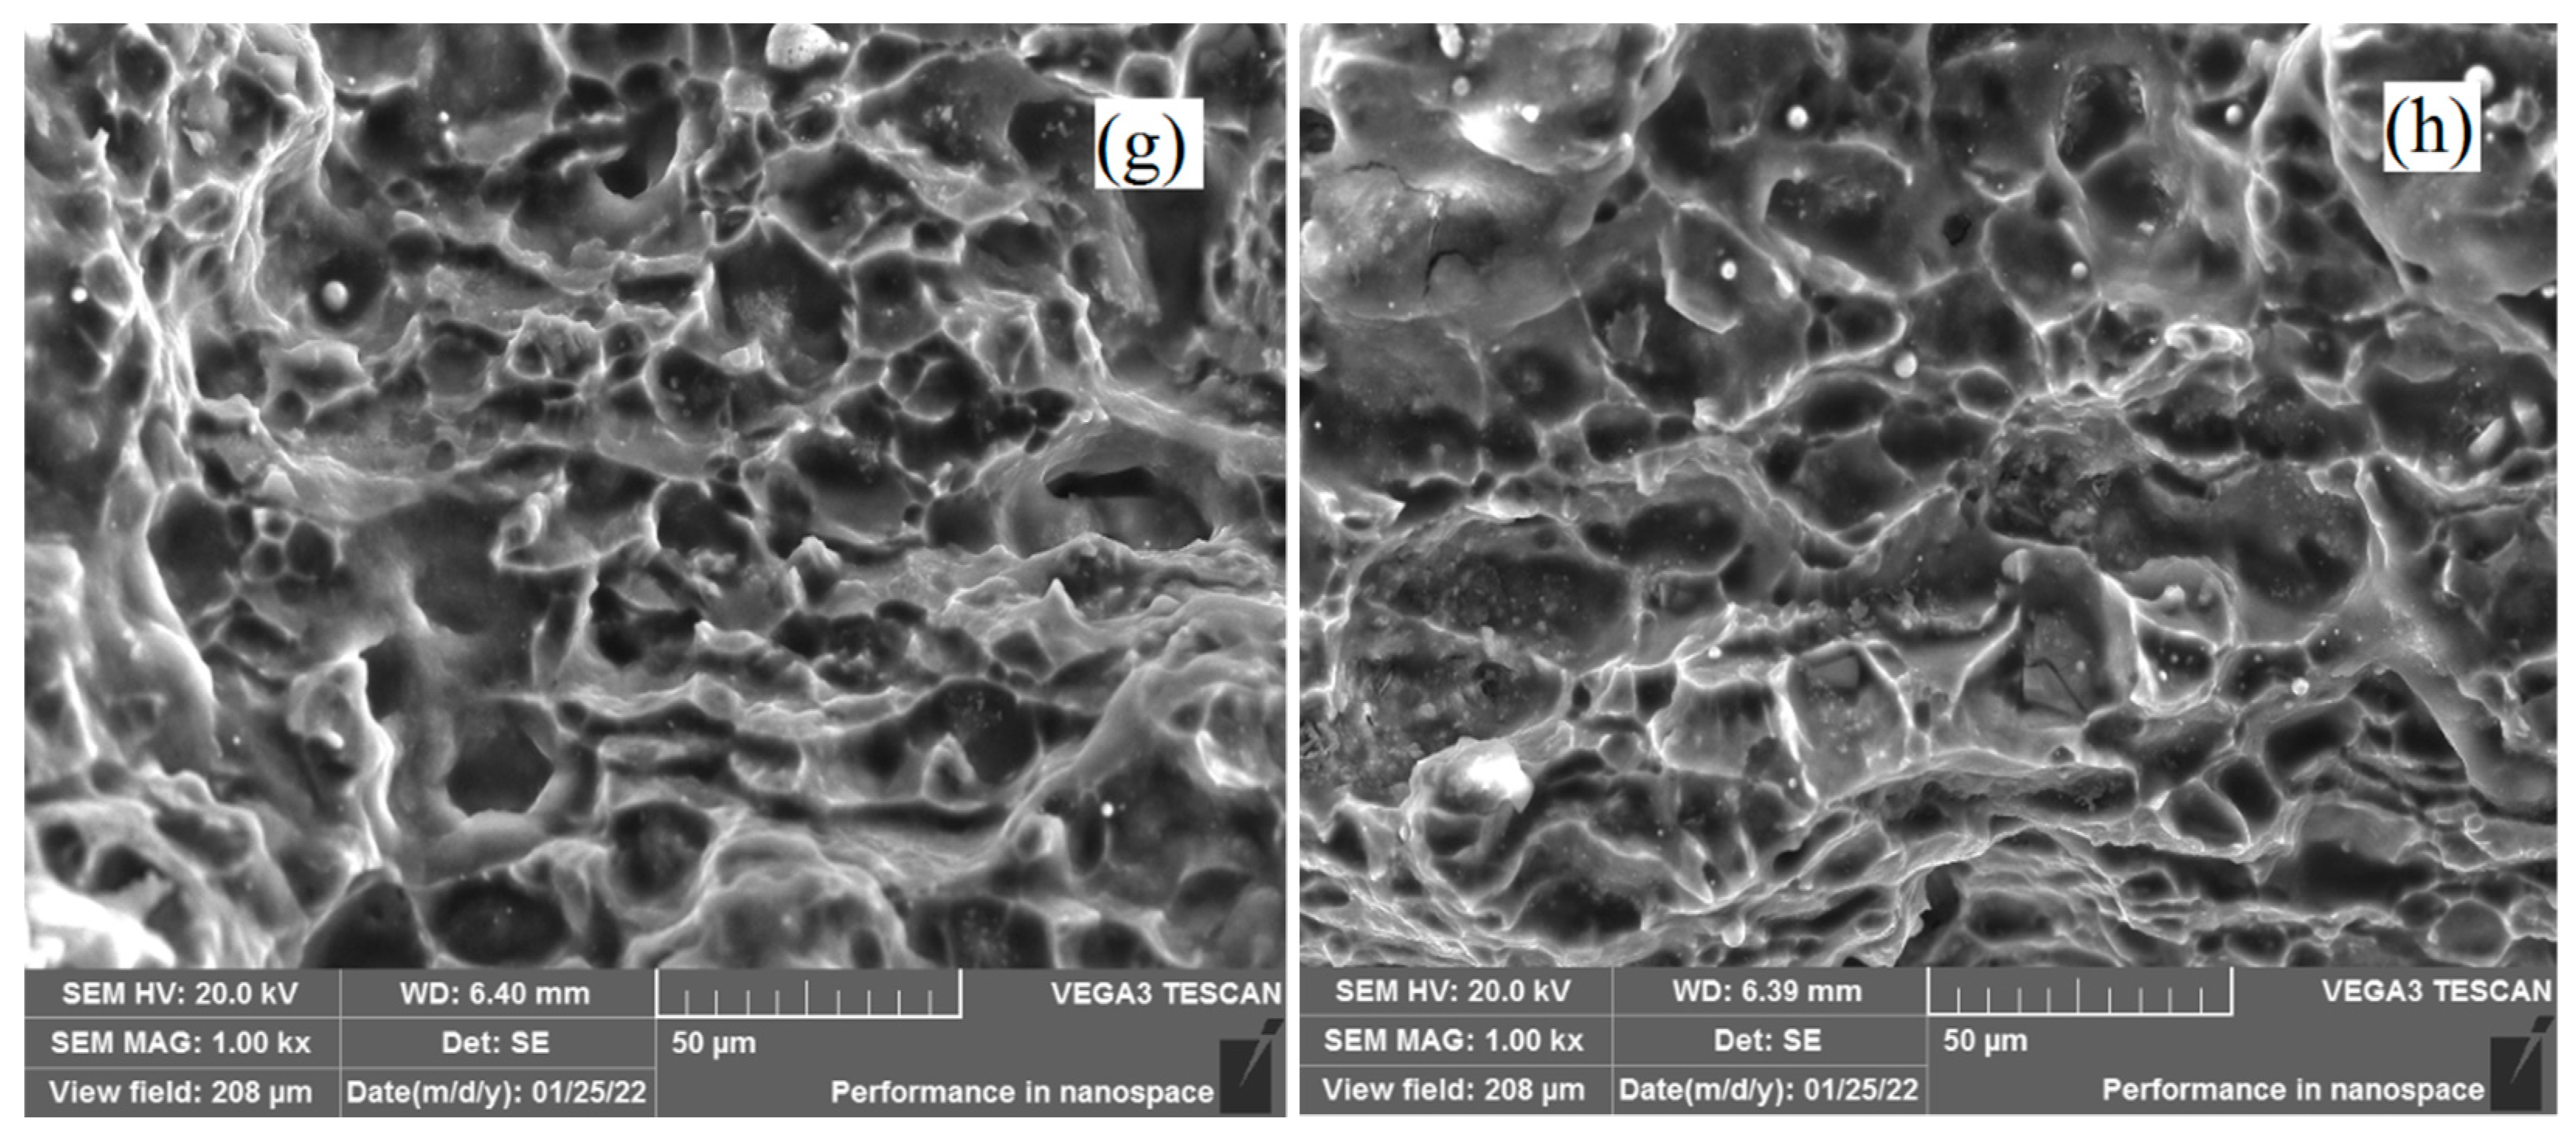
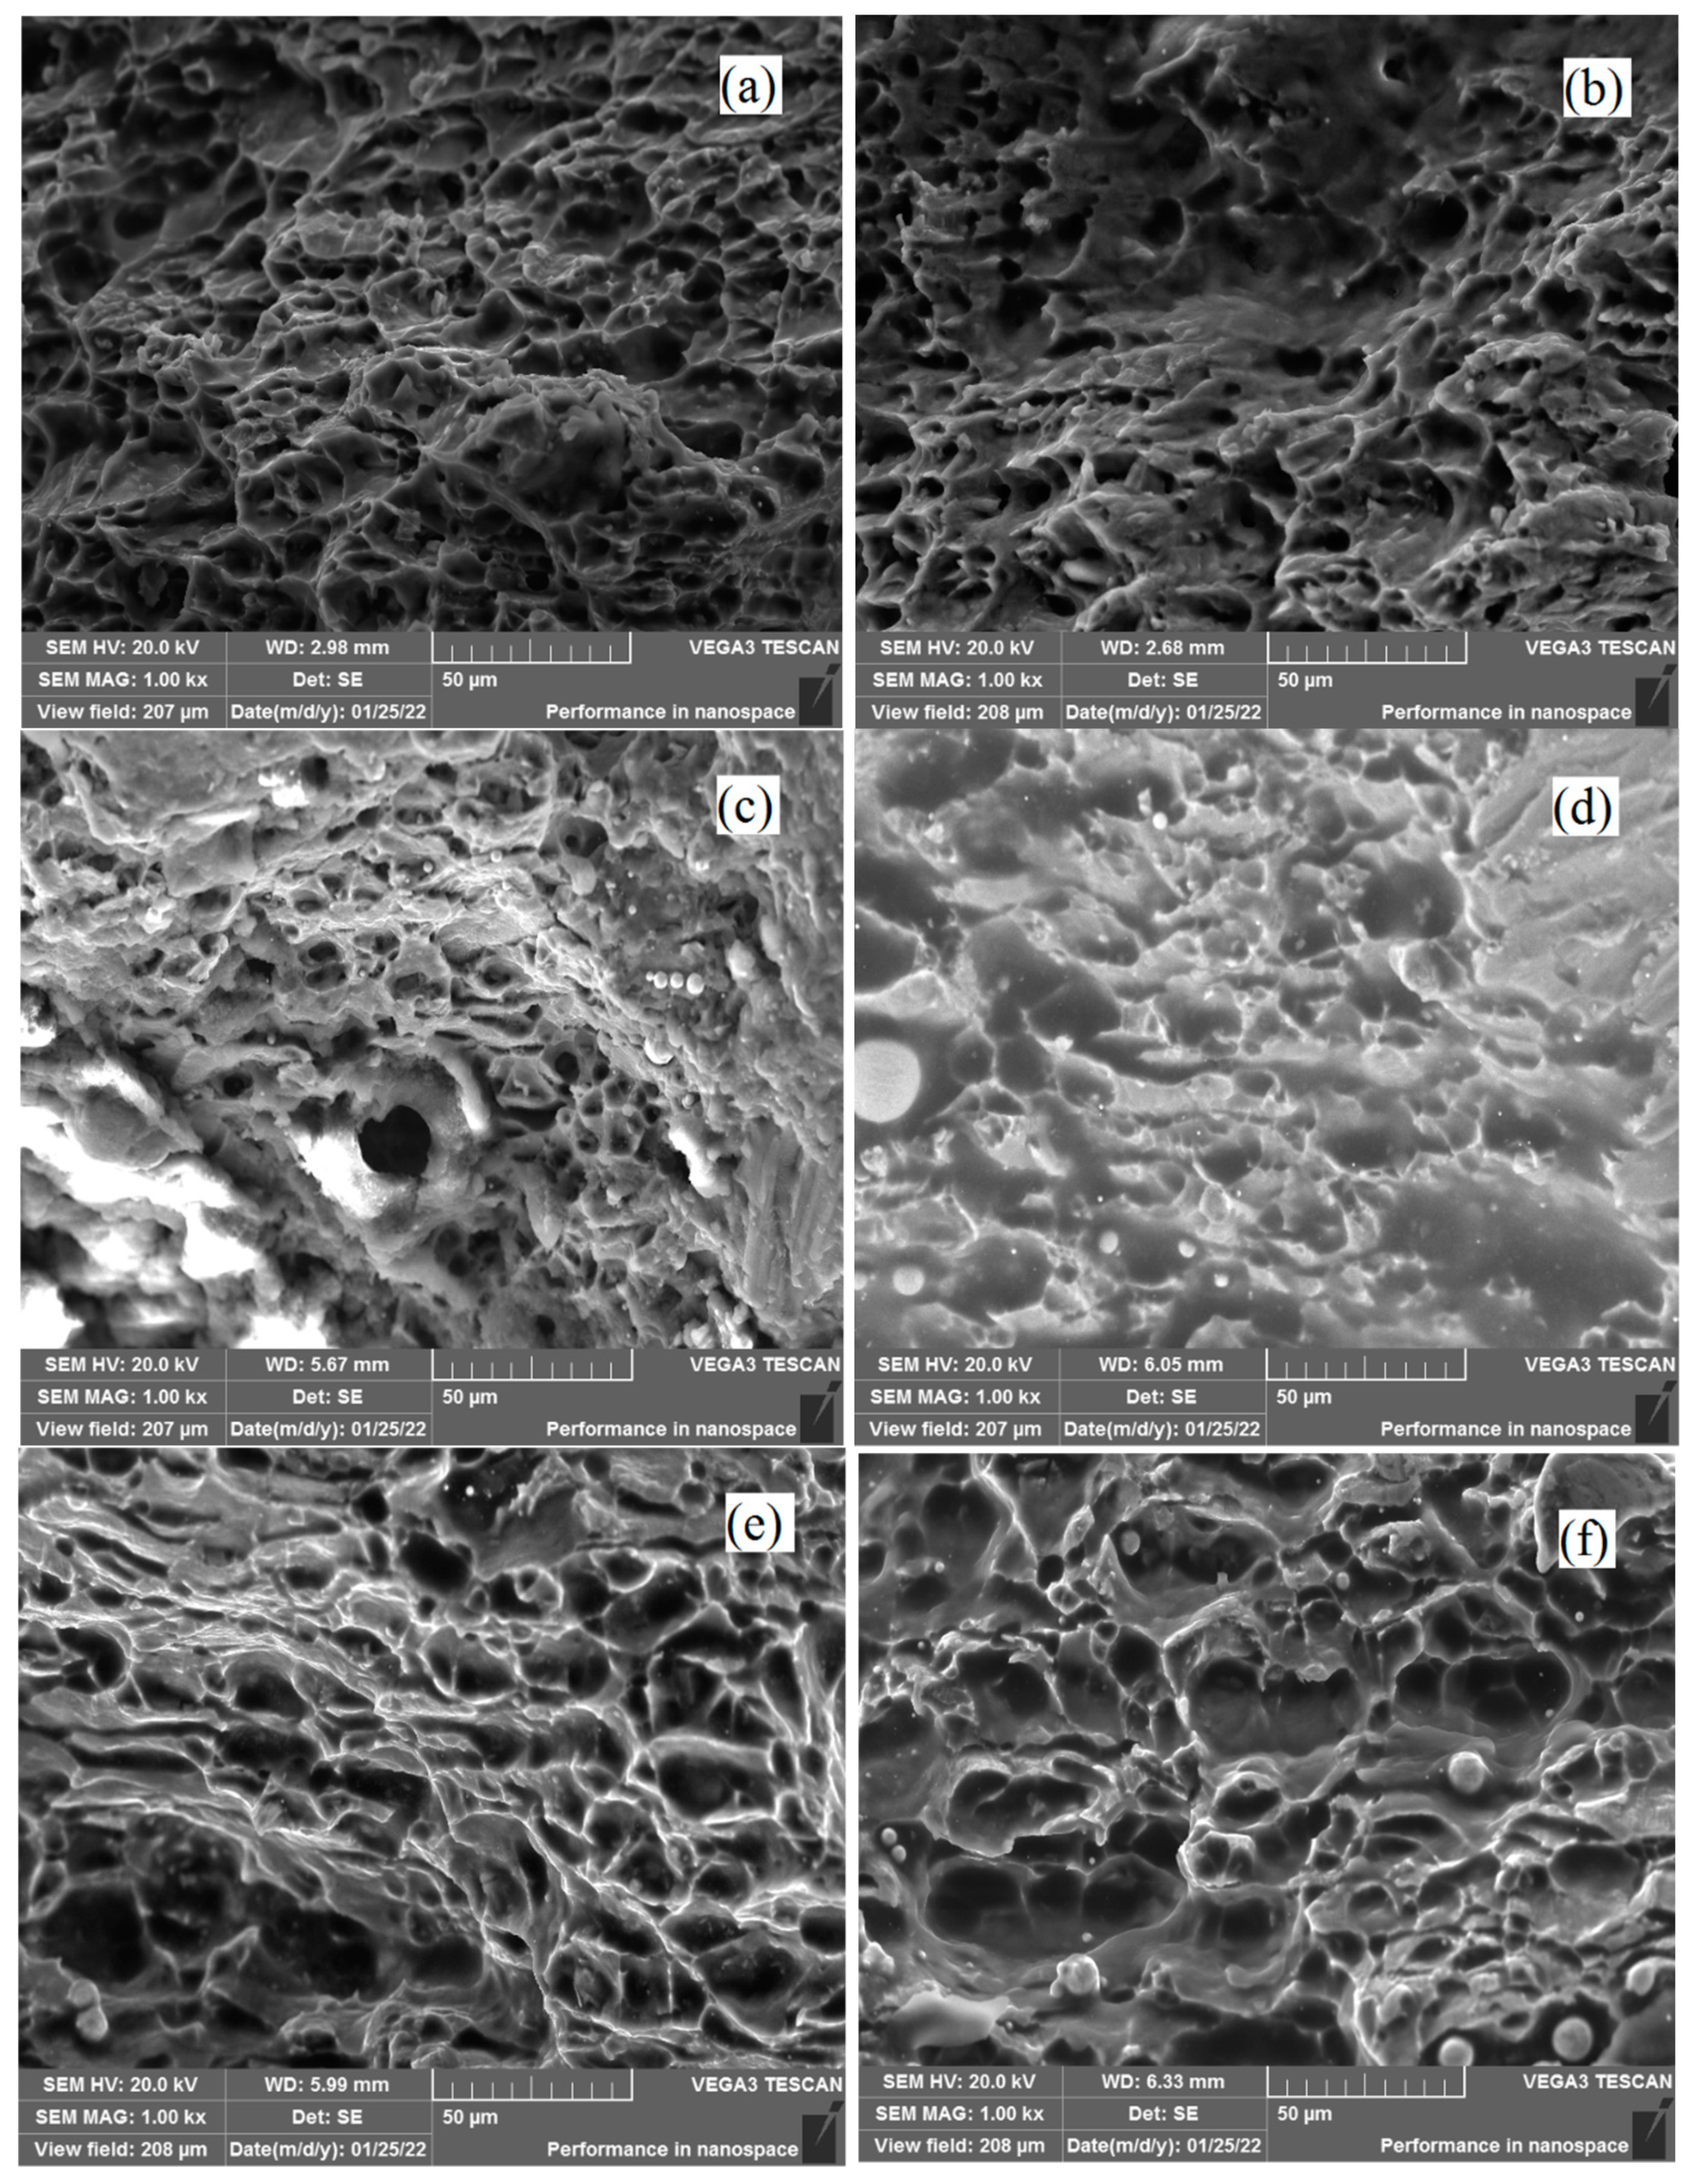
  • The fracture morphology of this aluminum alloy is significantly different under quasi-static and high strain rate conditions. From quasi-static condition to the high strain rate condition, the fracture mode is changed from ductile fracture to the mixture of ductile fracture and shear fracture. In addition, there is no significant difference of the fracture morphology for the high strain rate cases along different tensile directions.
It should be noted that the material models obtained in this study are suitable to describe the plastic deformation behavior of this material during high strain rate forming processes. More appropriate experiments should be carried out to validate whether they are applicable to describe the plastic deformation behavior under the intermediate strain rate condition.

Author Contributions

Conceptualization, K.H.; methodology, F.Z.; formal analysis, F.Z.; investigation, F.Z. and B.H.; data curation, F.Z. and Z.L.; writing—original draft preparation, F.Z.; writing—review and editing, K.H., Z.L. and B.H.; supervision, B.H.; project administration, F.Z.; funding acquisition, F.Z. and B.H. All authors have read and agreed to the published version of the manuscript.

Funding

This research was funded by the Guangdong Basic and Applied Basic Research Foundation, grant number 2019A1515012035, and the National Natural Science Foundation of China, grant numbers 52105414 and 52105518.

Institutional Review Board Statement

Not applicable.

Informed Consent Statement

Not applicable.

Data Availability Statement

Data will be available upon request through the corresponding author. The data used to support the findings of this study are included within the article.

Acknowledgments

We thank SIAT-CUHK Joint Laboratory of Precision Engineering for supporting the research work.

Conflicts of Interest

The authors declare no conflict of interest.

References

  1. Miller, W.S.; Zhuang, L.; Bottema, J.; Wittebrood, A.J.; De Smet, P.; Haszler, A.; Vieregge, A. Recent development in aluminium alloys for the automotive industry. Mater. Sci. Eng. A 2000, 280, 37–49. [Google Scholar] [CrossRef]
  2. Joost, W.J. Reducing vehicle weight and improving U.S. energy efficiency using integrated computational materials engineering. JOM 2012, 64, 1032–1038. [Google Scholar] [CrossRef]
  3. Georgantzia, E.; Gkantou, M.; Kamaris, G.S. Aluminium alloys as structural material: A review of research. Eng. Struct. 2021, 227, 111372. [Google Scholar] [CrossRef]
  4. Chen, L.; Fang, S.; Zhao, K.; Xiao, R.; Zhao, H. Forming limit prediction using an integrated model for 7075 aluminum alloy sheets at an elevated temperature. Int. J. Solids Struct. 2020, 202, 475–485. [Google Scholar] [CrossRef]
  5. Balanethiram, V.S.; Daehn, G.S. Enhanced formability of interstitial free iron at high strain rates. Scripta Metall. Mater. 1992, 27, 1783–1788. [Google Scholar] [CrossRef]
  6. Imbert, J.M.; Winkler, S.L.; Worswick, M.J.; Oliveira, D.A.; Golovashchenko, S. The effect of tool-sheet interaction on damage evolution in electromagnetic forming of aluminum alloy sheet. J. Eng. Mater. Technol. 2005, 127, 145–153. [Google Scholar] [CrossRef]
  7. Ahmed, M.; Kumar, D.R.; Nabi, M. Enhancement of formability of AA5052 alloy sheets by electrohydraulic forming process. J. Mater. Eng. Perform. 2017, 26, 439–452. [Google Scholar] [CrossRef]
  8. Khan, A.S.; Suh, Y.S.; Chen, X.; Takacs, L.; Zhang, H. Nanocrystalline aluminum and iron: Mechanical behavior at quasi-static and high strain rates, and constitutive modeling. Int. J. Plast. 2006, 22, 195–209. [Google Scholar] [CrossRef]
  9. Cheng, T.C.; Lee, R.S. The influence of grain size and strain rate effects on formability of aluminium alloy sheet at high-speed forming. J. Mater. Process. Techol. 2018, 253, 134–159. [Google Scholar] [CrossRef]
  10. Adesola, A.O.; Odeshi, A.G.; Lanke, U.D. The effects of aging treatment and strain rates on damage evolution in AA 6061 aluminum alloy in compression. Mater. Des. 2013, 45, 212–221. [Google Scholar] [CrossRef]
  11. Braun, R. Effect of thermal exposure on the microstructure, tensile properties and the corrosion behavior of 6061 aluminum alloy sheet. Mater. Corros. 2005, 56, 159–162. [Google Scholar] [CrossRef]
  12. Yu, H.; Jin, Y.; Hu, L.; Wang, Y. Mechanical properties of the solution treated and quenched Al-Cu-Li alloy (AA2195) sheet during high strain rate deformation at room temperature. Mater. Sci. Eng. A 2020, 793, 139880. [Google Scholar] [CrossRef]
  13. Jenab, A.; Sarraf, I.S.; Green, D.E.; Rahmaan, T.; Worswick, M.J. The use of genetic algorithm and neural network to predict rate-dependent tensile flow behavior of AA5182-O sheets. Mater. Des. 2016, 94, 62–273. [Google Scholar] [CrossRef]
  14. Zhang, C.; Chu, X.; Guines, D.; Leotoing, L.; Ding, J.; Zhao, G. Effects of temperature and strain rate on the forming limit curves of Aa5086 sheet. In Proceedings of the 11th International Conference on Technology of Plasticity, ICTP 2014, Nagoya, Japan, 19–24 October 2014. [Google Scholar] [CrossRef]
  15. Lee, W.S.; Tang, Z.C. Relationship between mechanical properties and microstructural response of 6061-T6 aluminum alloy-impacted at elevated temperature. Mater. Des. 2014, 58, 116–124. [Google Scholar] [CrossRef]
  16. Lee, W.S.; Shyu, J.C.; Chiou, S.T. Effect of strain rate on impact response and dislocation substructure of 6061-T6 aluminum alloy. Scripta Mater. 2000, 42, 51–56. [Google Scholar] [CrossRef]
  17. Owolabi, G.M.; Odeshi, A.G.; Singh, M.N.K.; Bassim, M.N. Dynamic shear band formation in aluminum 6061-T6 and aluminum 6061-T6/Al2O3 composites. Mater. Sci. Eng. A 2007, 457, 114–119. [Google Scholar] [CrossRef]
  18. Gupta, M.K. Numerical simulation of AA7075 under high strain rate with different shape of striker of split Hopkinson pressure bar. Mater. Today Commun. 2021, 26, 102178. [Google Scholar] [CrossRef]
  19. Yan, S.L.; Yang, H.; Li, H.W.; Ren, G.Y. Experimental study of macro-micro dynamic behaviors of 5A0X aluminum alloys in high velocity deformation. Mater. Sci. Eng. A 2014, 598, 197–206. [Google Scholar] [CrossRef]
  20. Ji, C.; Li, Z.; Liu, J. Development of an improved MMC-based fracture function characterizing the anisotropic and strain rate-dependent behavior of 6061-T5 aluminum alloy. Mech. Mater. 2020, 150, 103598. [Google Scholar] [CrossRef]
  21. Chen, D.Y.; Xu, Y.; Zhang, S.H.; Ma, Y.; El-Aty, A.A.; Banabic, D.; Pokrovsky, A.I.; Bakinovskaya, A.A. A novel method to evaluate the high strain rate formability of sheet metals under impact hydroforming. J. Mater. Process. Technol. 2021, 287, 116553. [Google Scholar] [CrossRef]
  22. Zhang, F.; Chen, J.; Chen, J.; Zhu, X. Forming limit model evaluation for anisotropic sheet metals under through-thickness normal stress. Int. J. Mech. Sci. 2014, 89, 40–46. [Google Scholar] [CrossRef]
  23. Forni, D.; Chiaia, B.; Cadoni, E. Strain rate behavior in tension of S355 steel: Base for progressive collapse analysis. Eng. Struct. 2016, 119, 164–173. [Google Scholar] [CrossRef]
  24. Zhong, T.; Zhong, Z.Y.; Huang, J.W.; Sun, T.; Fezzaa, K.; Huang, J.Y.; Luo, S.N. Rate-dependent phase transition of high density polyethylene. Materialia 2019, 6, 100274. [Google Scholar] [CrossRef]
  25. Jin, H.; Sanborn, B.; Lu, W.Y.; Song, B. Mechanical characterization of 304L-VAR stainless steel in tension with a full coverage of low, intermediate, and high strain rates. Mech. Mater. 2021, 152, 103654. [Google Scholar] [CrossRef]
  26. Johnson, G.R.; Cook, W.H. A constitutive model and data for metals subjected to large strains, high strain rates, and high temperatures. In Proceedings of the 7th International Symposium on Ballistics, The Hague, The Netherlands, 19–21 April 1983; pp. 541–547. [Google Scholar]
  27. Tang, W.; Liu, S.; Liu, Z.; Kang, S.; Mao, P.; Zhou, L.; Wang, Z. Microstructure evoluation and constitutive relation establishment of Mg-7Gd-5Y-1.2Nd-0.5Zr alloy under high strain rate after severe multi-directional deformation. Mater. Sci. Eng. A 2021, 809, 140994. [Google Scholar] [CrossRef]
  28. Cadoni, E.; Forni, D. Mechanical behaviour of B500A rebars: Effect of elevated temperature and high strain-rate. Fire Saf. J. 2021, 122, 103321. [Google Scholar] [CrossRef]
  29. Barlat, F.; Lian, J. Plastic behavior and stretchability of sheet metals. Part I: A yield function for orthotropic sheet under plane stress conditions. Int. J. Plast. 1989, 5, 51–66. [Google Scholar] [CrossRef]
  30. Aretz, H. Applications of a new plane stress yield function to orthotropic steel and aluminum sheet metals. Model. Simul. Mater. Sci. Eng. 2004, 12, 491–509. [Google Scholar] [CrossRef]
  31. Li, F.Q.; Mo, J.H.; Li, J.J.; Huang, L.; Zhou, H.Y. Formability of Ti-6Al-4V titanium alloy sheet in magnetic pulse bulging. Mater. Des. 2013, 52, 337–344. [Google Scholar] [CrossRef]
Figure 1. Experimental apparatus: (a) Quasi-static uniaxial tensile apparatus; (b) SHTB apparatus.
Metals 12 01430 g001
Figure 2. Experimental engineering stress–strain curves obtained by the quasi-static uniaxial tensile tests and the corresponding tensile samples.
Metals 12 01430 g002
Figure 3. Experimental signals obtained from a split Hopkinson tensile bar tests for strain rate from 1000 s−1 to 3000 s−1 for samples along rolling direction.
Metals 12 01430 g003
Figure 4. Experimental engineering stress–strain curves obtained by the SHTB tests and the corresponding tensile samples.
Metals 12 01430 g004
Figure 5. Experimental true stress–strain curves for dynamic tensile samples along three tensile directions.
Metals 12 01430 g005
Figure 6. Johnson–Cook model predictions vs. experimental data for 6XXX aluminum alloy sheet.
Metals 12 01430 g006
Figure 7. Softening ratio and elongation for 6XXX aluminum alloy under different strain rates along different uniaxial tensile directions: (a) softening ratio, (b) elongation.
Metals 12 01430 g007
Figure 8. Comparison of experimental and predicted yield stress and r-value for 6XXX sheet at quasi-static condition.
Metals 12 01430 g008
Figure 9. Variable anisotropic parameters of Yld2003 for 6XXX aluminum alloy sheet under different strain rate conditions.
Metals 12 01430 g009
Figure 10. Comparison of experimental and predicted anisotropy for 6XXX sheet at high strain rate condition: (a) yield stress; (b) r-value.
Metals 12 01430 g010aMetals 12 01430 g010b
Figure 11. Uniaxial tension samples after fracture (a) at quasi-static condition; (b) at high strain rate condition.
Metals 12 01430 g011
Figure 12. Fractograph of 6XXX aluminum alloy sheet along rolling direction: (a) initial state, macroscopic view; (b) initial state, microcosmic view; (c) quasi-static state, macroscopic view; (d) quasi-static state, microcosmic view; (e) 1000 s−1, macroscopic view; (f) 1000 s−1, microcosmic view; (g) 2000 s−1, macroscopic view; (h) 2000 s−1, microcosmic view; (i) 3000 s−1, macroscopic view; (j) 3000 s−1, microcosmic view.
Metals 12 01430 g012aMetals 12 01430 g012b
Figure 13. Microcosmic fractograph of 6XXX aluminum alloy sheet along 45° and 90° to the rolling direction: (a) quasi-static state, 45°; (b) quasi-static state, 90°; (c) 1000 s−1, 45°; (d) 1000 s−1, 90°; (e) 2000 s−1, 45°; (f) 2000 s−1, 90°; (g) 3000 s−1, 45°; (h) 3000 s−1, 90°.
Metals 12 01430 g013aMetals 12 01430 g013b
Table 1. Chemical composition of the 6XXX aluminum alloy sheet in this study (wt%).
ElementSiFeCuMnMgCrNiZnTiZrAl
StandardMin.0.4-0.15-0.80.04----Bal.
Max.0.80.70.40.151.20.35-0.250.15-Bal.
Actual0.630.390.220.021.00.1-0.060.32-Bal.
Table 2. Yield stress and ultimate tensile stress of uniaxial tensile samples.
Strain Rate (s−1)Yield Stress (MPa)Ultimate Tensile Stress (MPa)
45°90°45°90°
QS333.4319313.7374.3363.6358
1000 s−1352.8360.2377.4408.2407.9412.7
2000 s−1354.1368376.9405.2413.7418.7
3000 s−1372.2365.7377.5405.1415.3412.7
Table 3. Anisotropic parameters for Barlat and Lian’s 1989 yield function of 6XXX aluminum alloy ( m 1 = 8).
a c h p
1.25410.74590.98430.978
Table 4. Anisotropic parameters for the Yld2003 yield function of 6XXX aluminum alloy ( m 2 = 8).
a 1 a 2 a 3 a 4 a 5 a 6 a 7 a 8
0.98481.09941.19331.18910.92291.03110.97651.0
Publisher’s Note: MDPI stays neutral with regard to jurisdictional claims in published maps and institutional affiliations.

