Abstract
Achieving online inspection and recognition of laser welding quality is essential for intelligent industrial manufacturing. The weld penetration status is an important indicator for assessing the welding quality, and the optical signal is the most common changing feature in the laser welding process. This paper proposes a new method based on a photoelectric signal and neural network for laser welding penetration status identification. A laser welding experimental system platform based on a photoelectric sensor is built, the laser welding experimental material is DC01 mild steel, and the photoelectric signal in the laser welding process is collected. The collected signal is then processed, and features are extracted using wavelet packet transform and probability density analyses. The mapping relationship between the signal features and weld penetration status is investigated. A deep learning convolutional neural network (CNN)-based weld penetration status recognition model is constructed, with multiple eigenvalue vectors as input, and the model training and recognition results are analyzed and compared. The experimental results show that the photoelectric signal features are highly correlated with the weld penetration status, and the constructed CNN weld penetration status recognition model has an accuracy of up to 98.5% on the test set, demonstrating excellent performance in identifying the quality of the laser welding. This study provides the basis for the online inspection and intelligent identification of laser welding quality.
1. Introduction
Laser welding technology has become increasingly popular in the auto body [1], new energy power battery, and other industrial manufacturing industries due to its high energy density, fast welding speed, low welding distortion, and stress [2,3,4]. When a high-power laser is applied to the surface of the workpiece, the material vaporizes and forms a ‘keyhole’. Then, with the movement of the laser beam, a continuous weld seam is created, which may contain several defects, such as deep or shallow penetration [5,6]. Capturing the signal characteristics of the laser welding process, which contains a considerable amount of information regarding the welding quality, is essential. This includes collecting welding information from the optics [7,8], acoustics [9], images [10,11], X-rays [12], ultrasounds [13], etc. Therefore, it is of great engineering importance to deeply analyze the effective information in the signal characteristics to ensure the quality of the laser welding [14,15].
Optical signal monitoring and vision monitoring are the key methods in the laser welding process [16] and signal changes in real time according to the varying penetration status. The morphological characteristics of the keyhole, molten pool, spatters, plasma plume, etc., are constantly changing during the laser welding process [17]. Photoelectric sensing is the main method of detecting this optical radiation [18]. In recent years, research on the photoelectric signal and vision system detection of the welding process has made substantial progress [19,20]. Stavropoulos et al. [21] introduced an online approach that utilizes machine learning methods on data captured from an infrared ray (IR) camera. The model was developed under a different number of process parameters and weld quality criteria, and the results show that the quality prediction uncertainty of the models depends on the proximity of the points of the process parameter space [22]. A novel multi-functional, web-based, real-time quality diagnostic platform was proposed, incorporating decision support, data visualization, storage, and post-processing functions in the context of laser welding applications [23]. A multi-sensor detecting system for high-power disk laser welding was designed to obtain multi-signals, including an ultraviolet sensing camera, an X-ray television system, a visible light-sensing photodiode, a reflected laser–sensing photodiode, and a spectrometer [24]. By carrying out a series of experiments under different laser welding conditions, the experimental results show that the proposed method can be applied to recognize the high-power disk laser welding state in real time. Gao et al. [25] believe that optical characteristics are related to the welding quality of the laser welding process, with optically induced plasma and the visible light generated by laser reflection being the key elements that reflect the weld quality. They conducted an in-depth analysis of the high-frequency component of the optical signal, extracting various welding characteristics and important information on welding status recognition in the laser welding process from the sensor optical signal. This led to the establishment of a real-time recognition system model of the laser welding quality status. You et al. [26,27] proposed an effective method for predicting geometric parameters and detecting weld defects using optical features. A photodiode was used to collect optical signals in the laser welding process, welding characteristics were obtained through signal processing and analysis, and the correlation between different features was analyzed to quantitatively assess the stability of the laser welding process. In [28], You et al. used two high-speed cameras to capture the images of spatters in the near-infrared and ultraviolet light together. It was found that ultraviolet light and visible light were more appropriate for spatter detection. Huang et al. [29,30] explored the characteristics of plasma electrical signals during the generation of laser-deep penetration welding defects based on the principle of the plasma sheath effect. Wavelet packet transform and empirical mode decomposition were used to extract signal features and establish a signal feature database for the prediction of a probabilistic neural network model, which enabled the identification of the quality status of the laser weld. Zhang et al. [31,32,33] applied a photoelectric sensor to obtain the reflected laser changes from keyholes and visible light radiation signals in the welding area during laser welding. Wavelet packet decomposition was used to extract signal frequency characteristics to study the relationship between the time–frequency analysis characteristics of photoelectric sensor signals and the quality of welded joints. A convolutional deep learning model was then established to identify and predict the laser welding quality status. Miao et al. [34,35,36] concluded that deep learning algorithms can collect a large amount of sample data from the welding process and automatically train and learn statistical features, and the database can be built in conjunction with the identification and prediction of the welding quality. Based on a large number of welding sample data, quality identification models and welding prediction models were established. When weld defects were automatically detected, the classification of the specific type of defect and the simultaneous diagnosis of the cause could greatly improve the quality status of the laser welding. Ma et al. [37,38] proposed a new method for identifying and detecting laser-welded porosity defects in an aluminum alloy based on multi-sensor signal diagnosis and deep learning. A multi-sensor platform was established to collect weld feature signals, and the morphological feature signals were then analyzed and processed using a sliding window algorithm. Signals in each window were processed using wavelet packet transform to obtain time spectrum diagrams. Finally, a convolutional neural network was used to identify the spectrogram to achieve online detection of the laser welding. Huang et al. [39,40] used rolling mean and standard deviation methods to calculate the fluctuation degree index of the visual information and optical radiation information obtained by a photoelectric sensor. Three improved one-dimensional convolutional neural network models were investigated and developed to implement weld quality prediction in the laser welding process [41,42].
In this paper, an approach of laser welding quality status recognition based on the multi-eigenvalue signal of photoelectric sensing is proposed. Through a photoelectric sensor to obtain the radiation intensity signal in the welding, wavelet packet transform and probability density analysis methods were used to extract the multi-eigenvalue in the signal and study the mapping relationship between the eigenvalue and the laser welding quality status. The main analysis of different laser power under the influence of weld forming quality law and the establishment of a neural network model based on photoelectric signal eigenvalues and laser welding melt-through status to achieve the identification of laser welding quality and provide new methods and new ideas for the online detection of laser welding status were undertaken. The approach proposed in this paper can identify the quality status of laser welding more reliably under the current complex industrial environment factors and make full use of the various information characteristics of light in the welding process. The signal analysis and extraction feature vector methods in this paper can be applied to many signal analyses in the field of welding. The laser welding identification system based on a photoelectric signal and neural network can accelerate the intellectualization and automation of industrial manufacturing and improve the welding quality of laser welding.
2. Materials and Methods
2.1. Architecture of the Proposed Approach
There are four stages of the proposed approach, as shown in Figure 1. They are welding process, welding feature extraction, process monitoring, and weld defect definition. In the welding process stage, the laser welding experimental system platform is built, and the signal data are obtained through the photoelectric sensor. In the phase of welding feature extraction, welding feature values are extracted through different signal analysis and processing methods. After model construction and training, the iterative accuracy is constantly optimized to complete the identification of laser welding penetration status.
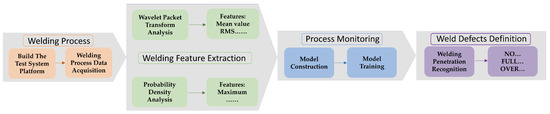
Figure 1.
Schematic of laser welding penetration status identification approach.
2.2. Experimental Equipment
As shown in Figure 2, the laser welding experimental system consists of an optical fiber laser welding system, a robot driving system, a photoelectric sensor, and an acquisition module. The experimental equipment is equipped with an optical fiber welding device (HWF40) with a maximum power of 4 kW, a 400 μm diameter laser beam, a wavelength of 1070 nm, a defocus range of −4~+4 mm, and a welding speed range of 1–5 m/min. Argon is used as the protective gas, with a gas flow control range of 0–30 L/min, and the vertical tilt angle of the laser head is 30° to ensure the lens is not damaged by the intensity of the reflected light during welding. The laser head employs a one-way reflector and focusing lens to capture the light intensity during welding and transmit it to the photoelectric sensor. The laser welding process is driven by the a robot. The photoelectric sensor converts the light intensity during welding into an amplitude signal, which is sent to the acquisition module; the wavelength detection range of the photoelectric sensor is 400–1100 nm. The sampling frequency of the acquisition card is 200 kHz. The photoelectric sensor and acquisition module collect the photoelectric signal and transmit it to the industrial computer for analysis.
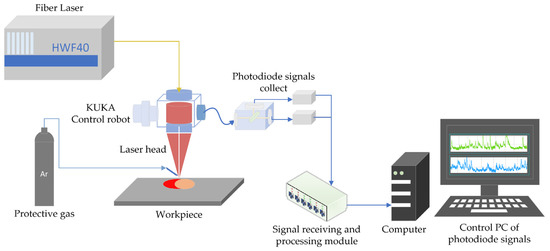
Figure 2.
Experimental equipment for laser welding photoelectric signal acquisition.
2.3. Experimental Materials and Method
The material used in the laser welding experiment was DC01 mild steel sheet with a thickness of 0.7 mm, whose chemical composition is shown in Table 1. In welding experiments, different laser power will lead to different penetration status of laser welding under certain welding process parameters [43]. The experimental conditions of laser welding, as shown in Table 2, included a welding speed of 2 m/min, a defocus of 0 mm, a flow rate of argon gas of 25 L/min, and an adjustable laser power from 1.5 kW to 3.5 kW. By controlling the different laser welding powers, two mild steel sheets were welded in the lap welding mode with a lap gap of 0 mm, resulting in a variety of weld penetration statuses.

Table 1.
Chemical composition of the material used in the study (wt. %).
Table 2.
Experimental parameters and sample results of laser welding.
3. Results and Discussion
3.1. Characteristics of Laser Welding Photoelectric Signal
The changes in laser penetration status and photoelectric signal under the aforementioned experimental conditions were studied and analyzed, and the welding penetration status was divided into three types: no penetration, full penetration, and over-penetration. Figure 3 displays the three different weld quality status back-penetration images and the corresponding photoelectric signal characteristics. It is evident that with the increase in penetration depth, the photoelectric signals have obvious differences in amplitude characteristics; the amplitude range of signals in the no-penetration status is generally 0.02–0.06 V, the amplitude range of signals in the full-penetration status is generally 0.05–0.2 V, the amplitude range of signals in the over-penetration status is generally 0.2–0.6 V, and the degree of fluctuation of the photoelectric signal varies across the three welding penetration statuses.
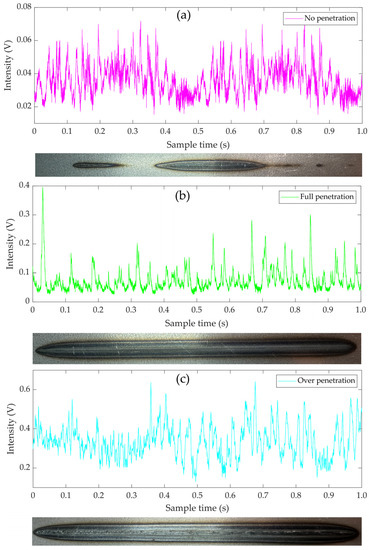
Figure 3.
Signal amplitudes at different penetration statuses: (a) no penetration, (b) full penetration, (c) over-penetration.
In order to more clearly demonstrate the differences in optical radiation signal characteristics in the same temporal dimension under three different penetration statuses, the three signal characteristics were plotted in a three-dimensional diagram, as shown in Figure 4. This allows for the amplitude range and fluctuation degree of the signal characteristics to be clearly seen. The degree of weld penetration is affected by the light intensity and heat in laser welding. The deeper the penetration, the greater the amplitude of the optical signal and the larger the corresponding fluctuation range.
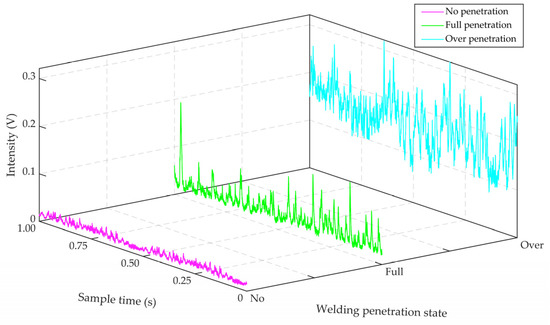
Figure 4.
Three-dimensional diagram of signal characteristics under three penetration statuses.
3.2. Wavelet Packet Transform Analysis of Photoelectric Signals
The optical signal in laser welding is a transient, non-stationary, and non-periodic time-varying signal. As demonstrated by the amplitude fluctuation of the photoelectric signal curve in the figure above, the signal presents an irregular, non-periodic status. Traditional Fourier transform can only simply analyze the frequency distribution of the signal and cannot obtain the signal mutation information of the respective frequency in a certain time, nor can it realize the comprehensive analysis of the signal in the time and frequency domains. Wavelet packet transform, developed on the basis of fast Fourier transform, is a signal analysis method that has been widely used in the time–frequency analysis of nonlinear and non-stationary signals. It can reflect the characteristics of a signal in both the time and frequency domains, thus effectively determining the position and level of variation of the signal. It is, therefore, an excellent method for solving the problem of complex signal time–frequency analysis.
The original signal is decomposed into low-frequency approximation coefficients and detailed high-frequency coefficients by wavelet packet transform. During signal analysis, the low-frequency approximation coefficients and detailed high-frequency coefficients are iteratively decomposed according to the desired frequency in order to obtain more detailed multi-scale analysis features. Wavelet packet transform analysis is able to adaptively select the frequency band to match the signal spectrum and decompose the original signal through low-pass and high-pass filters. These filters are determined by the scale function and wavelet function:
where hk and gk are the filter coefficients in the low-frequency band and the filter coefficients in the high-frequency band, respectively. Let W0(t) = φ(t) and W1(t) = ψ(t), then the recursive wavelet packet function can be expressed as:
where n represents the number of decomposition layers of the wavelet packet, and the final form of the wavelet packet decomposition of the original signal can be expressed as:
where p is the amount of shift. According to the wavelet packet decomposition principle, after the three-layer decomposition of the original signal, 23 (8) different signals are obtained, with each feature signal being matched to the corresponding frequency channel. In this paper, the fifth order Daubechies wavelet function is used for this purpose. Figure 5 shows the eight different sub-band signals (S31, S32, ..., S38) that were obtained after recon-structing the sub-node signals. It can be seen from the decomposition and reconstruction of the signal that the main effective features of the photoelectric signal are concentrated in the S31 band (corresponding to Figure 5a). Therefore, signal feature extraction in subsequent studies is mainly aimed at the S31 band signal.
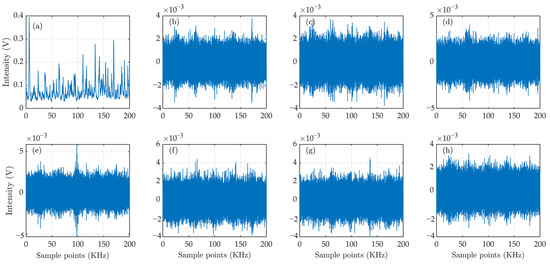
Figure 5.
The signal of sub-band after wavelet packet decomposition and reconstruction: (a) S31, (b) S32, (c) S33, (d) S34, (e) S35, (f) S36, (g) S37, (h) S38.
Each wavelet packet decomposition divides the signal’s frequency band in order to extract the components of the corresponding sub-band. The original signal’s characteristic information can be found in the sub-band signal, and the energy distribution characteristic of the wavelet packet decomposition can be used as the fundamental basis for signal identification. By extracting the energy of the band, the characteristics of the signal can be analyzed and identified in the time–frequency domain. The wavelet packet energy value can be used to calculate the characteristics of the photoelectric signal. The analysis of several experimental data shows that the main energy of the signal is concentrated in the S31 frequency band, accounting for up to 99.93%, which is consistent with the conclusion of the wavelet packet signal after its decomposition and reconstruction. Therefore, the energy value extracted from the S31 frequency band can be used as a characteristic value of the photoelectric signal, which reflects different laser welding penetration quality statuses.
3.3. Probability Density Analysis of Photoelectric Signals
Due to the intense thermal reaction process in laser welding, the intensity of the original signal changes rapidly depending on the welding quality status. To identify the effective characteristics directly related to the penetration status of laser welding, this paper employs the probability density method to analyze the original signal. Using the relative density of the distribution of sampled data points in the time domain of the original signal, a mathematical probability density statistical analysis was conducted to carry out the probability density statistics of the signals in the welding interval. This method extracts the probability distribution of the original signal on the amplitude and fits the probability density function and its characteristic curve. By applying this method, a complex non-stationary welding photoelectric signal is converted into a simple probability density function curve, which reveals obvious trend characteristic information. Conversion to the probability density function curve does not cause data points of the original signal to be lost, and thus the converted curve can represent the effective characteristics of laser welding. As illustrated in Figure 6a,b, it is evident that the complex amplitude changes and fluctuations of non-stationary original signals are converted into simpler characteristic curves after probability density analysis, thus making it easier to extract the characteristic value of the photoelectric signal of welding.
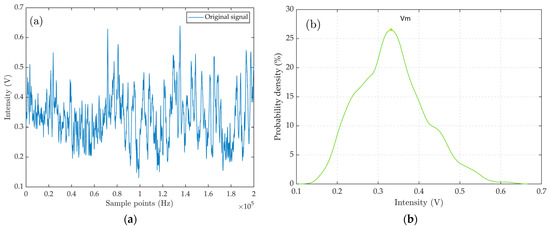
Figure 6.
Probability density conversion diagram: (a) original signal, (b) probability density curve.
The characteristic curve in Figure 6b is obtained after the probability density analysis of the original signal. The position of the gravity center of the probability density curve represents the area where the original signal has the highest amplitude distribution in the time domain. The position Vm in Figure 6b is the photoelectric intensity value with the greatest frequency of occurrence, highest probability, and most concentrated effect. Thus, the corresponding photoelectric intensity value can be extracted from the vertex position of the probability density curve, which can be used as a characteristic parameter that indicates the penetration status of laser welding and is defined as Vm. The probability density curve characteristics vary significantly under different welding conditions; the curve characteristics are associated with different laser welding penetration statuses. It can be used as a basis for recognizing the penetration status of laser welding.
3.4. Feature Extraction of Photoelectric Signal
It is one-sided to merely distinguish the status of laser welding using a single signal characteristic value. The presence of different welding statuses but similar signal characteristic values can make it difficult to identify welding defects. Thus, extracting multiple signal characteristic values can more accurately reflect the status of laser welding, and the fusion of such values contributes to a more accurate identification of weld penetration status. In this paper, the radiation intensity in the welding process was captured by a photoelectric sensor with a sampling frequency of 200 kHz, which allowed us to collect 200 k data points within one second. For the original photoelectric signal collected, every 2000 data points were intercepted into an analysis sample, and 100 samples could be obtained within a second, with a sampling interval of 0.01 S. By analyzing and processing the signal characteristic values of each data sample, the status of laser welding penetration could be reflected in real time.
The wavelet packet transform and probability density analyses were carried out for each data sample to extract signal characteristic values. In this paper, root mean square, mean value, standard deviation, and energy were used to extract characteristic values of the S31 band signals after wavelet packet decomposition and reconstruction. After probability density analysis, the photoelectric amplitude intensity Vm with the highest probability of extracting the data sample signal and the maximum photoelectric amplitude intensity in the data sample signal were defined as PK. A total of six characteristic values were selected as the characteristics of the laser welding photoelectric signal:
- (a)
- Mean value: the mean value of the data sample S31 band signal, which reflects the average optical radiation intensity of the laser welding process, is expressed as:
- (b)
- Root mean square (RMS): the RMS value of the data sample S31 band signal is used to measure the deviation between the observed and true values, which can be expressed as:
- (c)
- Standard deviation: this reflects the dispersion degree of the S31 band signal of the data sample, which can be expressed as:
- (d)
- Energy: the energy value of the data sample S31 band signal expressed as:
- (e)
- Maximum probability signal amplitude intensity Vm: after probability density analysis and processing, the data sample signals are extracted and expressed as:where the value of the horizontal coordinate X corresponds to the position of the apex of the center of gravity line in the probability density curve;
- (f)
- PK: the maximum value in the data sample signal, which can be expressed as:
In order to verify the correlation between the extracted signal characteristic values and the welding penetration status, the correlation coefficients between the above characteristic values and the tensile shear strength of the workpiece weld were calculated. The results are shown in Table 3. The correlation coefficient can be calculated using the following formula:
where N is the number of variable samples, and yi is the critical value of tensile shear strength to determine the welding penetration status. It can be concluded from Table 3 that the six kinds of signal characteristic values extracted above present a highly linear correlation with the welding penetration status.
Table 3.
Correlation coefficient of extracted signal characteristic values.
Randomly selected experimental data from 100 samples from each of the three different welding penetration statuses (no penetration, full penetration, and over-penetration), totaling 300 data samples, were used. The mean value, root mean square, standard deviation, energy, Vm, and PK of the data sample signals were extracted, respectively, and plotted in sequence. As shown in Figure 7a–f, it is clear that the extracted signal characteristic values are significantly different in each of the different welding penetration statuses. In Figure 7a, the signal mean value in the no-penetration status is generally less than 0.1, the signal mean value in the full-penetration status ranges from (0.2 to 0.4), and the mean value of the signal in the over-penetration status ranges from (0.5 to 0.8). As the penetration degree of the weld increases, the amplitude fluctuation range of the signal characteristic value also increases. Additionally, the signal mean value for each penetration status has an obvious division line, indicating that the signal mean value characteristics can reflect the quality of the laser welding. The other five signal characteristic values in Figure 7b–f also show similar trends, and there are significant differences in the amplitude range and fluctuation degree across the three different welding penetration statuses. Therefore, the characteristic values obtained by the above signal analysis and the processing method can accurately reflect the different welding penetration statuses in the laser welding process.
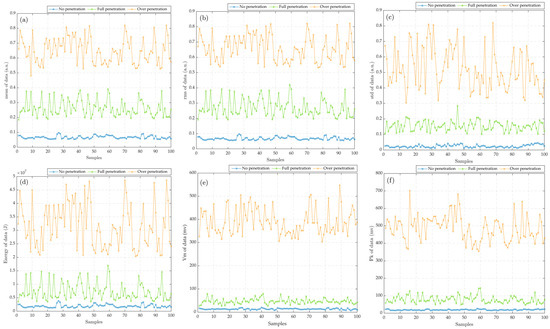
Figure 7.
Comparison of signal characteristic values extracted under different penetration statuses: (a) mean of data, (b) rms of data, (c) std of data, (d) energy of data, (e) Vm of data, (f) Pk of data.
3.5. CNN Network Model
Convolutional neural networks are multi-layer supervised learning neural networks containing convolutional computations and deep structures, representing one of the most prominent algorithms of deep learning. CNNs typically consist of an input layer, convolutional layer, pooling layer, fully connected layer, and output layer [30]. The convolutional layer is the core operation of the CNN network model. In this layer, the output features of the previous layer are convolved by a learnable convolutional kernel, combining these convolutional operations and inputting the obtained results to an activation function to obtain an output feature expressed as:
where is the output matrix of the convolution layer I, is the input matrix into the convolution layer I, is the weight matrix, is the bias of the features, Mj is the set of input features, and f(.) is the activation function.
The pooling layer, also known as the down-sampling layer, reduces the size of the input feature matrix, as well as the weight parameters, in order to prevent overfitting of the model. The expression for this layer is as follows:
where function down(.) is the pooling function, is the multiplicative bias, and is the additive bias.
The fully connected layer converts the feature matrix processed by the convolution and pooling layers into a one-dimensional vector, which is then combined with the softmax layer to calculate the probability that the features belong to each category and form the judgment classification result. The softmax function can be expressed as:
where T is the number of output categories and its value is 3 in this paper, indicating that there are 3 welding penetration statuses. Yk and Yl are the calculated values in the previous fully connected layer connected to the softmax layer, and Sk is the output probability value of the Kth output category.
In the training process, the cross entropy is taken as the loss of the training network, and the loss is propagated back to the previous layer in order to optimize the network model’s weights and deviations. The loss function of the model in this paper is a binary cross entropy function, and its expression is:
where (x, y) ∈ M is the dataset of labeled samples, y is the true label value of the samples, and y’ is the predicted probability value of the feature set X.
In this paper, the CNN network model is illustrated in Figure 8. Six feature values extracted from the original signal are taken as parameters of the input layer. The model has a depth of four, meaning that there are four convolutional layers with a kernel size of 3 × 3 and a stride of 1, indicating that there are 32 convolutional kernels of size 3 × 3 in the first convolutional layer. A pooling layer is connected after each convolutional layer, with a core size of 2 and a stride of 1, followed by the last pooling layer connected to the full connection layer. In addition, a dropout layer is attached to each convolutional layer to reduce the risk of overfitting. The full-connection layer is followed by the softmax layer to complete the task of signal feature mapping and identification and classification of the laser welding quality penetration status. The network model adjusts the weight parameters in the network layer by layer using the gradient descent method to minimize the loss function, thus improving the accuracy of the network through frequent iterative training.
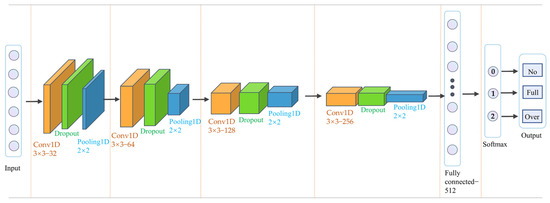
Figure 8.
Architecture diagram of CNN network model constructed in the study.
4. Analysis of CNN Model Recognition Results
In this study, the model outputs had three different laser welding penetration statuses: no penetration, full penetration, and over-penetration. To train the CNN network model, 11,396 (no penetration: 3630, full penetration: 3920, over-penetration: 3846) data samples under different welding penetration statuses were collected, of which 1500 samples were randomly selected as a test dataset with each penetration status containing 500 samples, and the remaining samples were used as a training dataset. The training dataset was utilized to train the established CNN recognition model for laser welding penetration status, and a comparison model B, with only one eigenvalue parameter input, was established to verify the influence of multiple eigenvalues on model recognition accuracy. Model A, the CNN recognition model established above, had an input layer of the six feature values discussed in this paper, while the input layer of model B was only the mean value. The recognition accuracy of the two models is shown in Figure 9a; the multi-feature value recognition model A had a training set accuracy of up to 99.2%, with a verification set accuracy of 98.5%, which was significantly higher than the single-feature value recognition model B, which had a training set accuracy of 91.2% and a verification set accuracy of 90.8%. The results show that the multi-eigenvalue input training model has high accuracy and reliability in identifying laser welding quality. The loss value curve of the recognition model is shown in Figure 9b. After 20 epochs of training, the loss value of model B converged stably at 0.173 and 0.208 in the training set and verification set, respectively, while that of model A converged stably at 0.007 and 0.008. The loss value became smaller and smaller, indicating that the performance and accuracy of the recognition model were steadily increasing.
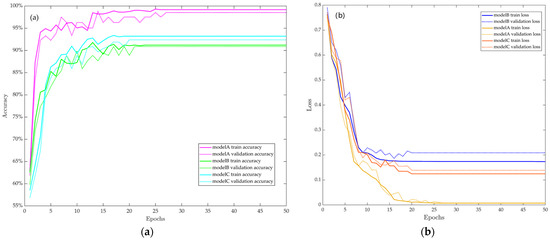
Figure 9.
The accuracy and loss of CNN model training process: (a) accuracy, (b) loss.
The performance of the established model was compared with the typical back-propagation (BP) neural network method. BP neural network model C was established, and the BP neural network model was set to take the above six feature values as input layer nodes, with three hidden layers, the number of neurons being 256-128-64, and three different welding penetration statuses in the output layer. The network training parameters were set with a learning rate of 0.1, the training set and the verification set were 80% and 20% of the sample number, respectively, and the rectified linear unit (Relu) function was used as the activation function between neurons in the hidden layer. In Figure 9, Model C is compared with the model proposed in this study. The training set accuracy of the BP neural network model C is 93.2%, and the validation set accuracy is 92.5%, with loss values of 0.125 and 0.138, respectively. The results show that the performance of the established CNN model is better than that of the BP neural network model.
The trained CNN recognition model was used to identify and classify 1500 samples in the test set to verify the reliability of the model recognition accuracy. Figure 10 shows the confusion matrix of the classification and recognition results of the three kinds of penetration statuses. The recognition accuracy of the no-penetration status was 97.6%, the full-penetration status was 98.6%, and the over-penetration status was 99.4%, with an average recognition accuracy of 98.5%. As shown in Figure 6, the extracted features have a certain boundary region between no-penetration and full-penetration status, but the range width of the boundary region is smaller than that presented by the over-penetration status, and the critical differentiation degree is slightly worse than that of the over-penetration status. Therefore, the accuracy of the model in the recognition of no penetration and full penetration is slightly lower than that in the recognition of the over-penetration status. Figure 11 shows the welding quality penetration status identification results of the model for the test set samples. It can be seen that the model can distinguish the weld penetration status well and meet the requirements of accurate identification in laser welding process detection.
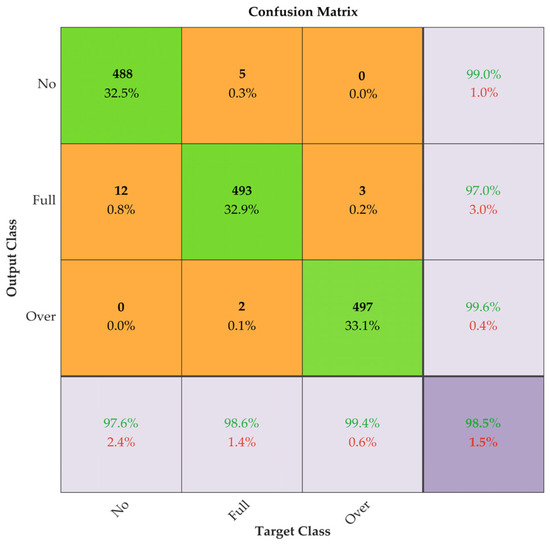
Figure 10.
The confusion matrix of CNN recognition model.
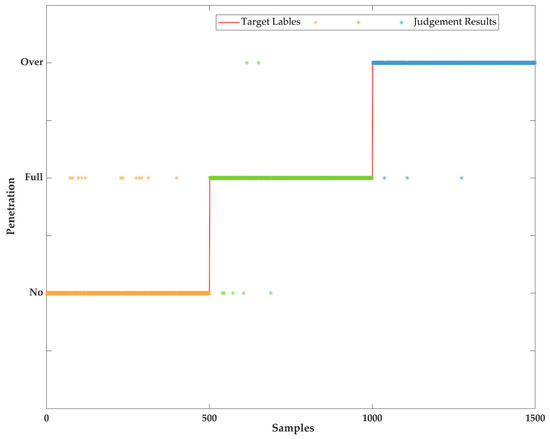
Figure 11.
The result of CNN recognition model classification.
5. Conclusions
In order to achieve the online detection and recognition of laser welding quality status, signal analysis and feature extraction methods were employed to analyze the correlation between laser welding weld penetration status and photoelectric signal characteristics. Signal characteristic values were then extracted to construct a deep learning neural network model based on a CNN in order to complete the classification and recognition of the weld penetration status. The main conclusions were as follows:
- In the laser welding process, a photoelectric sensor was used to obtain the light intensity signal characteristics of the welding process. There were obvious differences in the amplitude intensity and fluctuation degree of the photoelectric signal under different welding penetration statuses, and the welding penetration status was highly correlated with the characteristics of the photoelectric signal;
- Wavelet packet transform and probability density analysis were used to process the signal and extract the time–frequency characteristics of the signal. The analysis showed that the extracted signal characteristic values could effectively reflect the weld penetration status;
- The welding penetration status recognition model based on a multi-eigenvalue CNN was constructed. The accuracy of the training set was 99.2%, and the classification recognition accuracy could reach 98.5%, which provided the basic method and technology for the online detection of laser welding quality.
Author Contributions
Conceptualization, X.G.; methodology, Y.N.; validation, Y.N. and X.G.; investigation, Y.N.; resources, X.G.; data curation, Y.N. and X.G.; writing—original draft preparation, Y.N.; writing—review and editing, P.P.G. and X.G.; visualization, Y.N.; supervision, P.P.G. and X.G.; project administration, X.G.; funding acquisition, X.G. All authors have read and agreed to the published version of the manuscript.
Funding
This work was supported in part by the National Natural Science Foundation of China under Grant (52275317), the Guangdong Provincial Natural Science Foundation of China (2023A1515012172), and the Guangzhou Municipal Special Fund Project for Scientific and Technological Innovation and Development under Grant (2023B03J1326).
Institutional Review Board Statement
Not applicable.
Informed Consent Statement
Not applicable.
Data Availability Statement
Not applicable.
Conflicts of Interest
The authors declare no conflict of interest.
References
- Zhou, Z.; Gao, X.; Zhang, Y. Research Progress on Characterization and Regulation of Forming Quality in Laser Joining of Metal and Polymer, and Development Trends of Lightweight Automotive Applications. Metals 2022, 12, 1666. [Google Scholar] [CrossRef]
- Huang, Y.; Gao, X.; Zhang, Y.; Ma, B. Laser joining technology of polymer-metal hybrid structures-A review. J. Manuf. Process. 2022, 79, 934–961. [Google Scholar] [CrossRef]
- Qiao, J.; Yu, P.; Wu, Y.; Chen, T.; Du, Y.; Yang, J. A Compact Review of Laser Welding Technologies for Amorphous Alloys. Metals 2020, 10, 1690. [Google Scholar] [CrossRef]
- Wang, J.; Fu, X.; Zhang, L.; Zhang, Z.; Liu, J.; Chen, S. A short review on laser welding/brazing of aluminum alloy to steel. Int. J. Adv. Manuf. Technol. 2021, 112, 2399–2411. [Google Scholar] [CrossRef]
- Quazi, M.M.; Ishak, M.; Fazal, M.A.; Arslan, A.; Rubaiee, S.; Qaban, A.; Aiman, M.H.; Sultan, T.; Ali, M.M.; Manladan, S.M. Current research and development status of dissimilar materials laser welding of titanium and its alloys. Opt. Laser Technol. 2020, 126, 106090. [Google Scholar] [CrossRef]
- Zhang, H.; Jiang, M.; Chen, X.; Wei, L.; Wang, S.; Jiang, Y.; Jiang, N.; Wang, Z.; Lei, Z.; Chen, Y. Investigation of Weld Root Defects in High-Power Full-Penetration Laser Welding of High-Strength Steel. Materials 2022, 15, 1095. [Google Scholar] [CrossRef] [PubMed]
- Jiang, Z.; Jiang, Z.; Ding, H. Optical coherence tomography for laser welding applications. Optik 2022, 257, 168784. [Google Scholar] [CrossRef]
- Yu, J.; Lee, H.; Kim, D.-Y.; Kang, M.; Hwang, I. Quality Assessment Method Based on a Spectrometer in Laser Beam Welding Process. Metals 2020, 10, 839. [Google Scholar] [CrossRef]
- Stepanova, K.A.; Kinzhagulov, I.Y.; Yakovlev, Y.O.; Kovalevich, A.S.; Ashikhin, D.S.; Alifanova, I.E. Applying Laser-Ultrasonic and Acoustic-Emission Methods to Nondestructive Testing at Different Stages of Deformation Formation in Friction Stir Welding. Russ. J. Nondestruct. Test. 2020, 56, 191–200. [Google Scholar] [CrossRef]
- Fan, X.a.; Gao, X.; Liu, G.; Ma, N.; Zhang, Y. Research and prospect of welding monitoring technology based on machine vision. Int. J. Adv. Manuf. Technol. 2021, 115, 3365–3391. [Google Scholar] [CrossRef]
- Xiao, R.; Xu, Y.; Hou, Z.; Chen, C.; Chen, S. An adaptive feature extraction algorithm for multiple typical seam tracking based on vision sensor in robotic arc welding. Sens. Actuators A-Phys. 2019, 297, 111533. [Google Scholar] [CrossRef]
- Zhang, X.; Tang, Z.; Wu, Y.; Devoino, O.; Wang, H.; Wang, H. Progress in in situ x-ray imaging of welding process. Rev. Sci. Instrum. 2022, 93, 071501. [Google Scholar] [CrossRef] [PubMed]
- Zeng, W.; Cai, M.; Wang, P.; Lu, T.; Yao, F. Application of laser ultrasonic technique for detecting weld defect based on FDST method. Optik 2020, 221, 165366. [Google Scholar] [CrossRef]
- Gao, X.; Mo, L.; You, D.; Li, Z. Tight butt joint weld detection based on optical flow and particle filtering of magneto-optical imaging. Mech. Syst. Signal Process. 2017, 96, 16–30. [Google Scholar] [CrossRef]
- Gao, X.; Sun, Y.; Katayama, S. Neural Network of Plume and Spatter for Monitoring High-Power Disk Laser Welding. Int. J. Precis. Eng. Manuf. Green Technol. 2014, 1, 293–298. [Google Scholar] [CrossRef]
- Stavropoulos, P.; Bikas, H.; Sabatakakis, K.; Theoharatos, C.; Grossi, S. Quality assurance of battery laser welding: A data-driven approach. Procedia CIRP 2022, 111, 784–789. [Google Scholar] [CrossRef]
- Cai, W.; Wang, J.Z.; Jiang, P.; Cao, L.C.; Mi, G.Y.; Zhou, Q. Application of sensing techniques and artificial intelligence-based methods to laser welding real-time monitoring: A critical review of recent literature. J. Manuf. Syst. 2020, 57, 1–18. [Google Scholar] [CrossRef]
- Elefante, A.; Nilsen, M.; Sikstrom, F.; Christiansson, A.-K.; Maggipinto, T.; Ancona, A. Detecting beam offsets in laser welding of closed-square-butt joints by wavelet analysis of an optical process signal. Opt. Laser Technol. 2019, 109, 178–185. [Google Scholar] [CrossRef]
- Feng, Y.; Gao, X.; Zhang, Y.; Peng, C.; Gui, X.; Sun, Y.; Xiao, X. Simulation and experiment for dynamics of laser welding keyhole and molten pool at different penetration status. Int. J. Adv. Manuf. Technol. 2021, 112, 2301–2312. [Google Scholar] [CrossRef]
- Wang, T.; Gao, X.; Seiji, K.; Jin, X. Study of Dynamic Features of Surface Plasma in High-Power Disk Laser Welding. Plasma Sci. Technol. 2012, 14, 245–251. [Google Scholar] [CrossRef]
- Stavropoulos, P.; Sabatakakis, K.; Papacharalampopoulos, A.; Mourtzis, D. Infrared (IR) quality assessment of robotized resistance spot welding based on machine learning. Int. J. Adv. Manuf. Technol. 2022, 119, 1785–1806. [Google Scholar] [CrossRef]
- Stavropoulos, P.; Papacharalampopoulos, A.; Sabatakakis, K. Robust and Secure Quality Monitoring for Welding through Platform-as-a-Service: A Resistance and Submerged Arc Welding Study. Machines 2023, 11, 298. [Google Scholar] [CrossRef]
- Stavropoulos, P.; Papacharalampopoulos, A.; Stavridis, J.; Sampatakakis, K. A three-stage quality diagnosis platform for laser-based manufacturing processes. Int. J. Adv. Manuf. Technol. 2020, 110, 2991–3003. [Google Scholar] [CrossRef]
- Gao, X.; Li, Z.; Wang, L.; Zhou, X.; You, D.; Gao, P.P. Detection of weld imperfection in high-power disk laser welding based on association analysis of multi-sensing features. Opt. Laser Technol. 2019, 115, 306–315. [Google Scholar] [CrossRef]
- Gao, X.; You, D.; Katayama, S. The high frequency characteristics of laser reflection and visible light during solid state disk laser welding. Laser Phys. Lett. 2015, 12, 76003. [Google Scholar] [CrossRef]
- You, D.; Gao, X.; Katayama, S. A Novel Stability Quantification for Disk Laser Welding by Using Frequency Correlation Coefficient Between Multiple-Optics Signals. IEEE Asme Trans. Mechatron. 2015, 20, 327–337. [Google Scholar] [CrossRef]
- You, D.; Gao, X.; Katayama, S. WPD-PCA-Based Laser Welding Process Monitoring and Defects Diagnosis by Using FNN and SVM. IEEE Trans. Ind. Electron. 2015, 62, 628–636. [Google Scholar] [CrossRef]
- You, D.Y.; Gao, X.D.; Katayama, S. Visual-based spatter detection during high-power disk laser welding. Opt. Lasers Eng. 2014, 54, 1–7. [Google Scholar] [CrossRef]
- Huang, Y.; Hou, S.; Xu, S.; Zhao, S.; Yang, L.; Zhang, Z. EMD- PNN based welding defects detection using laser-induced plasma electrical signals. J. Manuf. Process. 2019, 45, 642–651. [Google Scholar] [CrossRef]
- Li, J.; Zhang, Y.; Liu, W.; Li, B.; Yin, X.; Chen, C. Prediction of penetration based on plasma plume and spectrum characteristics in laser welding. J. Manuf. Process. 2022, 75, 593–604. [Google Scholar] [CrossRef]
- Zhang, Y.; Gao, X.; You, D.; Jiang, X. Online judgment of laser welding process based on time-frequency analyses of in-situ high-speed optical signals. Optik 2022, 265, 169552. [Google Scholar] [CrossRef]
- Zhang, Y.; Gao, X.; You, D.; Zhang, N. Data-Driven Detection of Laser Welding Defects Based on Real-Time Spectrometer Signals. IEEE Sens. J. 2019, 19, 9364–9373. [Google Scholar] [CrossRef]
- Zhang, Y.; You, D.; Gao, X.; Wang, C.; Li, Y.; Gao, P.P. Real-time monitoring of high-power disk laser welding statuses based on deep learning framework. J. Intell. Manuf. 2020, 31, 799–814. [Google Scholar] [CrossRef]
- Miao, R.; Gao, Y.; Ge, L.; Jiang, Z.; Zhang, J. Online defect recognition of narrow overlap weld based on two-stage recognition model combining continuous wavelet transform and convolutional neural network. Comput. Ind. 2019, 112, 103115. [Google Scholar] [CrossRef]
- Miao, R.; Shan, Z.; Zhou, Q.; Wu, Y.; Ge, L.; Zhang, J.; Hu, H. Real-time defect identification of narrow overlap welds and application based on convolutional neural networks. J. Manuf. Syst. 2022, 62, 800–810. [Google Scholar] [CrossRef]
- Zhang, Y.; You, D.; Gao, X.; Katayama, S. Online Monitoring of Welding Status Based on a DBN Model During Laser Welding. Engineering 2019, 5, 671–678. [Google Scholar] [CrossRef]
- He, K.; Xia, Z.; Si, Y.; Lu, Q.; Peng, Y. Noise Reduction of Welding Crack AE Signal Based on EMD and Wavelet Packet. Sensors 2020, 20, 761. [Google Scholar] [CrossRef]
- Ma, D.; Jiang, P.; Shu, L.; Geng, S. Multi-sensing signals diagnosis and CNN-based detection of porosity defect during Al alloys laser welding. J. Manuf. Syst. 2022, 62, 334–346. [Google Scholar] [CrossRef]
- Huang, W.; Gao, X.; Huang, Y.; Zhang, Y. Improved Convolutional Neural Network for Laser Welding Defect Prediction. Int. J. Precis. Eng. Manuf. 2023, 24, 33–41. [Google Scholar] [CrossRef]
- Yang, Y.; Pan, L.; Ma, J.; Yang, R.; Zhu, Y.; Yang, Y.; Zhang, L. A High-Performance Deep Learning Algorithm for the Automated Optical Inspection of Laser Welding. Appl. Sci. Basel 2020, 10, 933. [Google Scholar] [CrossRef]
- Hartl, R.; Bachmann, A.; Habedank, J.B.; Semm, T.; Zaeh, M.E. Process Monitoring in Friction Stir Welding Using Convolutional Neural Networks. Metals 2021, 11, 535. [Google Scholar] [CrossRef]
- Shin, S.; Jin, C.; Yu, J.; Rhee, S. Real-Time Detection of Weld Defects for Automated Welding Process Base on Deep Neural Network. Metals 2020, 10, 389. [Google Scholar] [CrossRef]
- Pastras, G.; Fysikopoulos, A.; Chryssolouris, G. A numerical approach to the energy efficiency of laser welding. Int. J. Adv. Manuf. Technol. 2017, 92, 1243–1253. [Google Scholar] [CrossRef]


Disclaimer/Publisher’s Note: The statements, opinions and data contained in all publications are solely those of the individual author(s) and contributor(s) and not of MDPI and/or the editor(s). MDPI and/or the editor(s) disclaim responsibility for any injury to people or property resulting from any ideas, methods, instructions or products referred to in the content. |
© 2023 by the authors. Licensee MDPI, Basel, Switzerland. This article is an open access article distributed under the terms and conditions of the Creative Commons Attribution (CC BY) license (https://creativecommons.org/licenses/by/4.0/).