Abstract
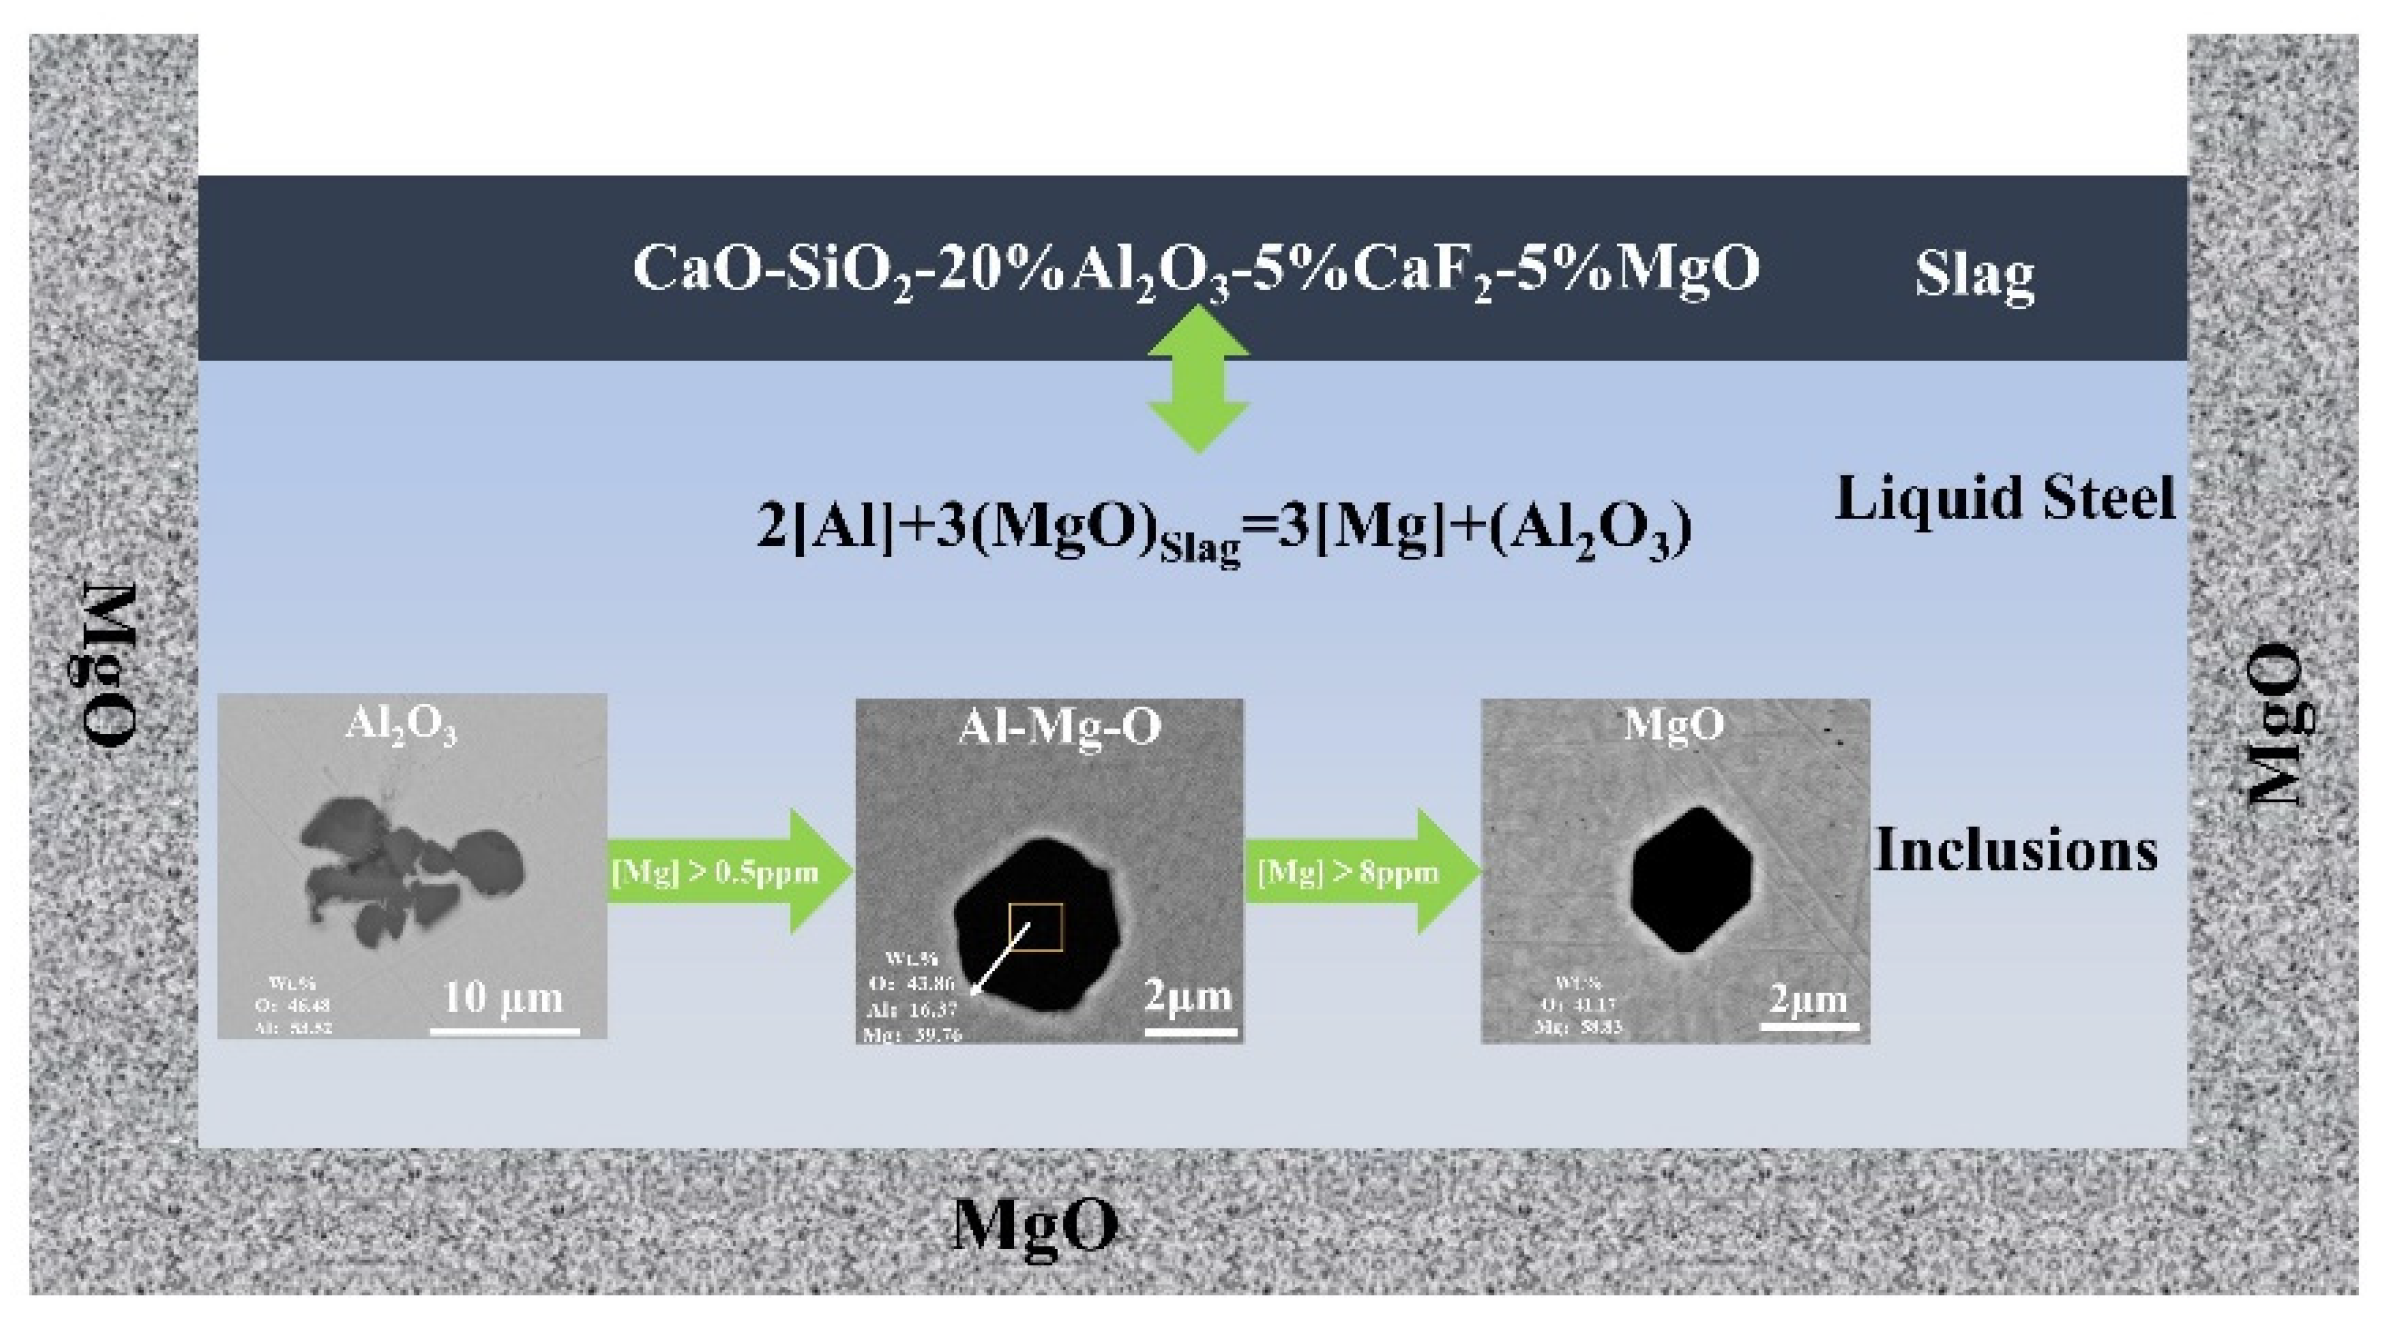
Few reports exist on the effect of the basicity of refining slag on inclusions in 15-5PH stainless steel and its removal efficiency. In this study, the effects of various basicities on the formation and removal efficiency of inclusions in molten steel were investigated. To investigate the effect of the chemical makeup of slag on the non-metallic inclusions in liquid steel, laboratory experiments and thermodynamic calculations were conducted on CaO-MgO-SiO2-Al2O3-CaF2 slag with various slag basicities and 15-5PH stainless steel. In the steel samples that had reacted with high-basicity slag samples, the magnesium content and aluminum yield were higher. Thermodynamic findings according to the ion and molecule coexistence theory showed that log () decreases as slag basicity increases. This increases the Al concentration in liquid steel while decreasing the Si content. Log () also increases, increasing the Mg content of the molten steel. With this, the transformation order of oxide inclusions is Al2O3 → MgAl2O4 → MgO. High-basicity slag increases the attachment of slag to inclusions and generates MgAl2O4 inclusions that are more easily adsorbed by inclusions in molten steel, thereby improving the cleanliness of molten steel.
1. Introduction
As one of the main properties of slag, basicity has a direct effect on the control of O and S content in steel. Research has shown that when slag basicity increases, the total number of inclusions in steel increases and the total area and average radius of the inclusions decrease [1,2,3,4]. The proportion of inclusions with a radius less than 2 μm increases significantly, indicating that increasing the basicity of the slag can play a role in refining inclusions. Jiang et al. [5] discovered that, with an increase in slag basicity, the number of Al2O3 and brittle inclusions in steel increased and the number of SiO2 and plastic inclusions decreased. The number of chain inclusions in steel also increases under high-basicity, where the size of point inclusions is large and their number is small; more point inclusions with smaller sizes exist in steel with low basicity, whereas the number of chain inclusions is smaller [6,7,8]. Li and Yoon et al. [9,10] studied the low-basicity refining slag smelting of high-carbon steel and discovered that in steel acid soluble aluminum [Als] in the range of 0.0005–0.0010%, the Al2O3 content of the inclusions in steel was approximately 20%, CaO/Al2O3 < 2, and inclusions with good plasticity could be obtained.
Non-metallic impurities must be removed from molten steel via flotation, separation, and dissolution. Initially, inclusions migrate to the steel/slag contact. Subsequently, the surface tension of the steel breaks, stabilizing the inclusions at the steel/slag interface. In the final stage, the inclusion returns to molten steel upon dissolution and is eliminated [11,12]. If the last two steps cannot occur, the inclusions re-enter the molten steel via entrainment, depending on the flow pattern in the ladle or tundish. Previous studies have demonstrated that the separation of solid inclusions occurs extremely rapidly. As per calculations, when a standard slag was added to a secondary refining, the solid inclusions destroyed the surface tension of the steel within 7–4 s after flotation. This reinforces the discovery of Lee et al. [12,13] in the experimental analysis of solid particles. However, when studying liquid inclusions, up to 7 s was recorded for these inclusions to reach the steel/slag interface. The time difference was caused by the small contact angle between the liquid particles and the molten steel [14,15,16,17]. However, the dissolution time of the liquid inclusions was negligible as they were miscible in the slag. Therefore, inclusion removal was the most pronounced for solid inclusions. These inclusions have limited solubility in the slag and are therefore sensitive to the physical and chemical properties, temperature gradient, and volume of the slag [18,19,20,21]. Therefore, the removal behavior of solid inclusions is controlled by the mass transfer, reaction kinetics, and chemical interaction with the slag. Thus, dissolution becomes the control step for removing solid inclusions [22,23,24,25,26].
However, few reports exist on the effect of the basicity of refining slag on inclusions in 15-5PH stainless steel and its removal efficiency. In this study, the effects of various basicities on the formation and removal efficiency of inclusions in molten steel were investigated using slag-steel reaction experiments.
2. Experimental Method
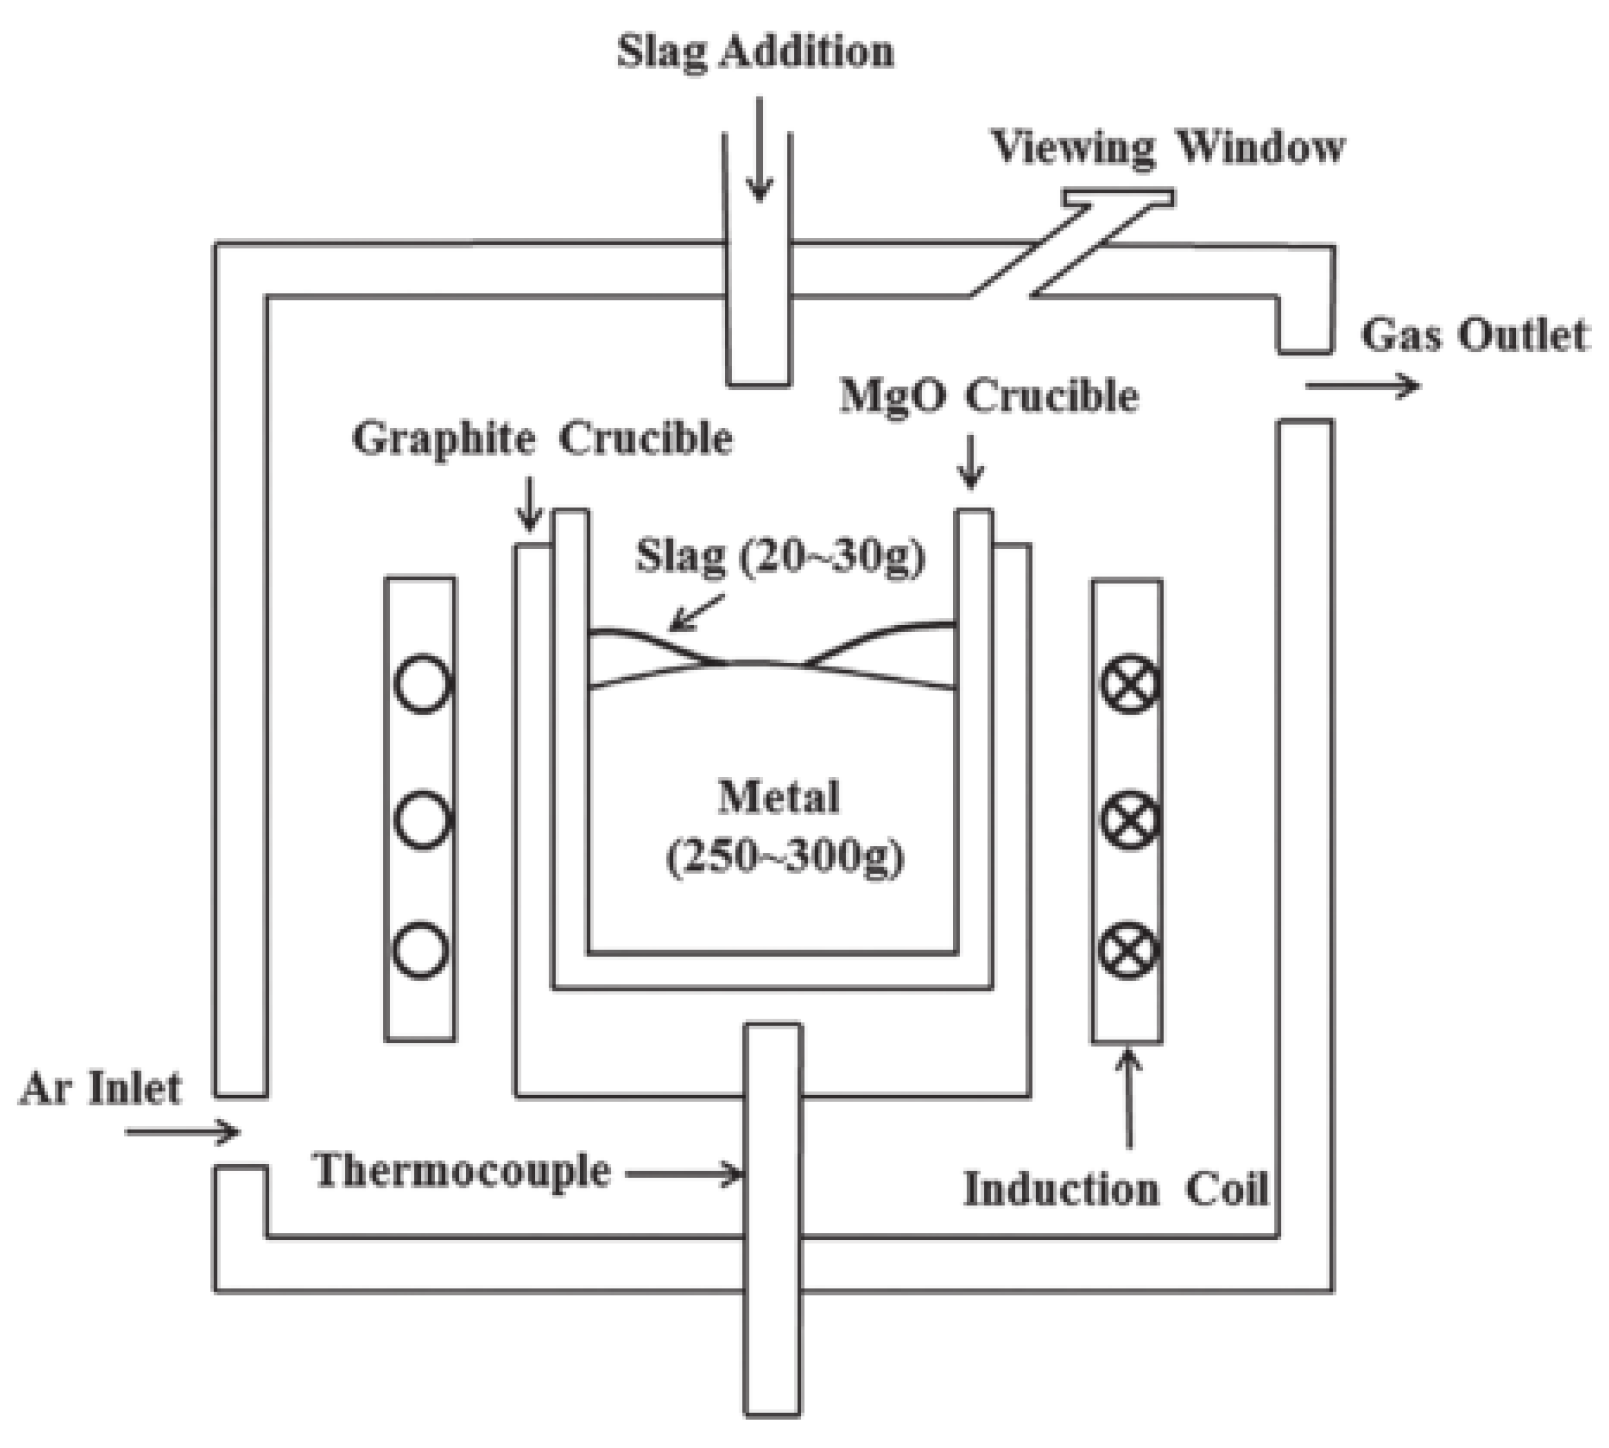
Regarding sample preparation, 15-5PH stainless steel was pre-melted in a MgO crucible to fabricate steel sample A. CaO-MgO-SiO2-Al2O3-CaF2 was pre-melted in a Mo crucible to fabricate slag samples S1, S2, and S3 before reaction with steel. All experiments were conducted under an Ar atmosphere using a vacuum induction furnace. Steel sample A and the pre-melted CaO-MgO-SiO2-Al2O3-CaF2 slag were balanced in a MgO crucible with a vacuum induction furnace in an Ar atmosphere for 60 min as a preliminary equilibrium experiment. Figure 1 shows a schematic of the experimental setup.
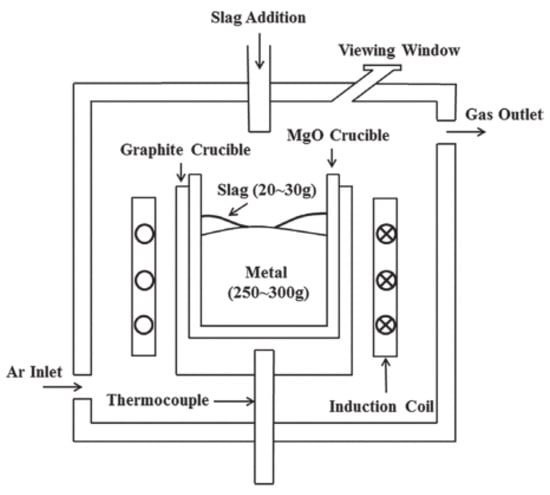
Figure 1.
Diagram of the testing equipment.
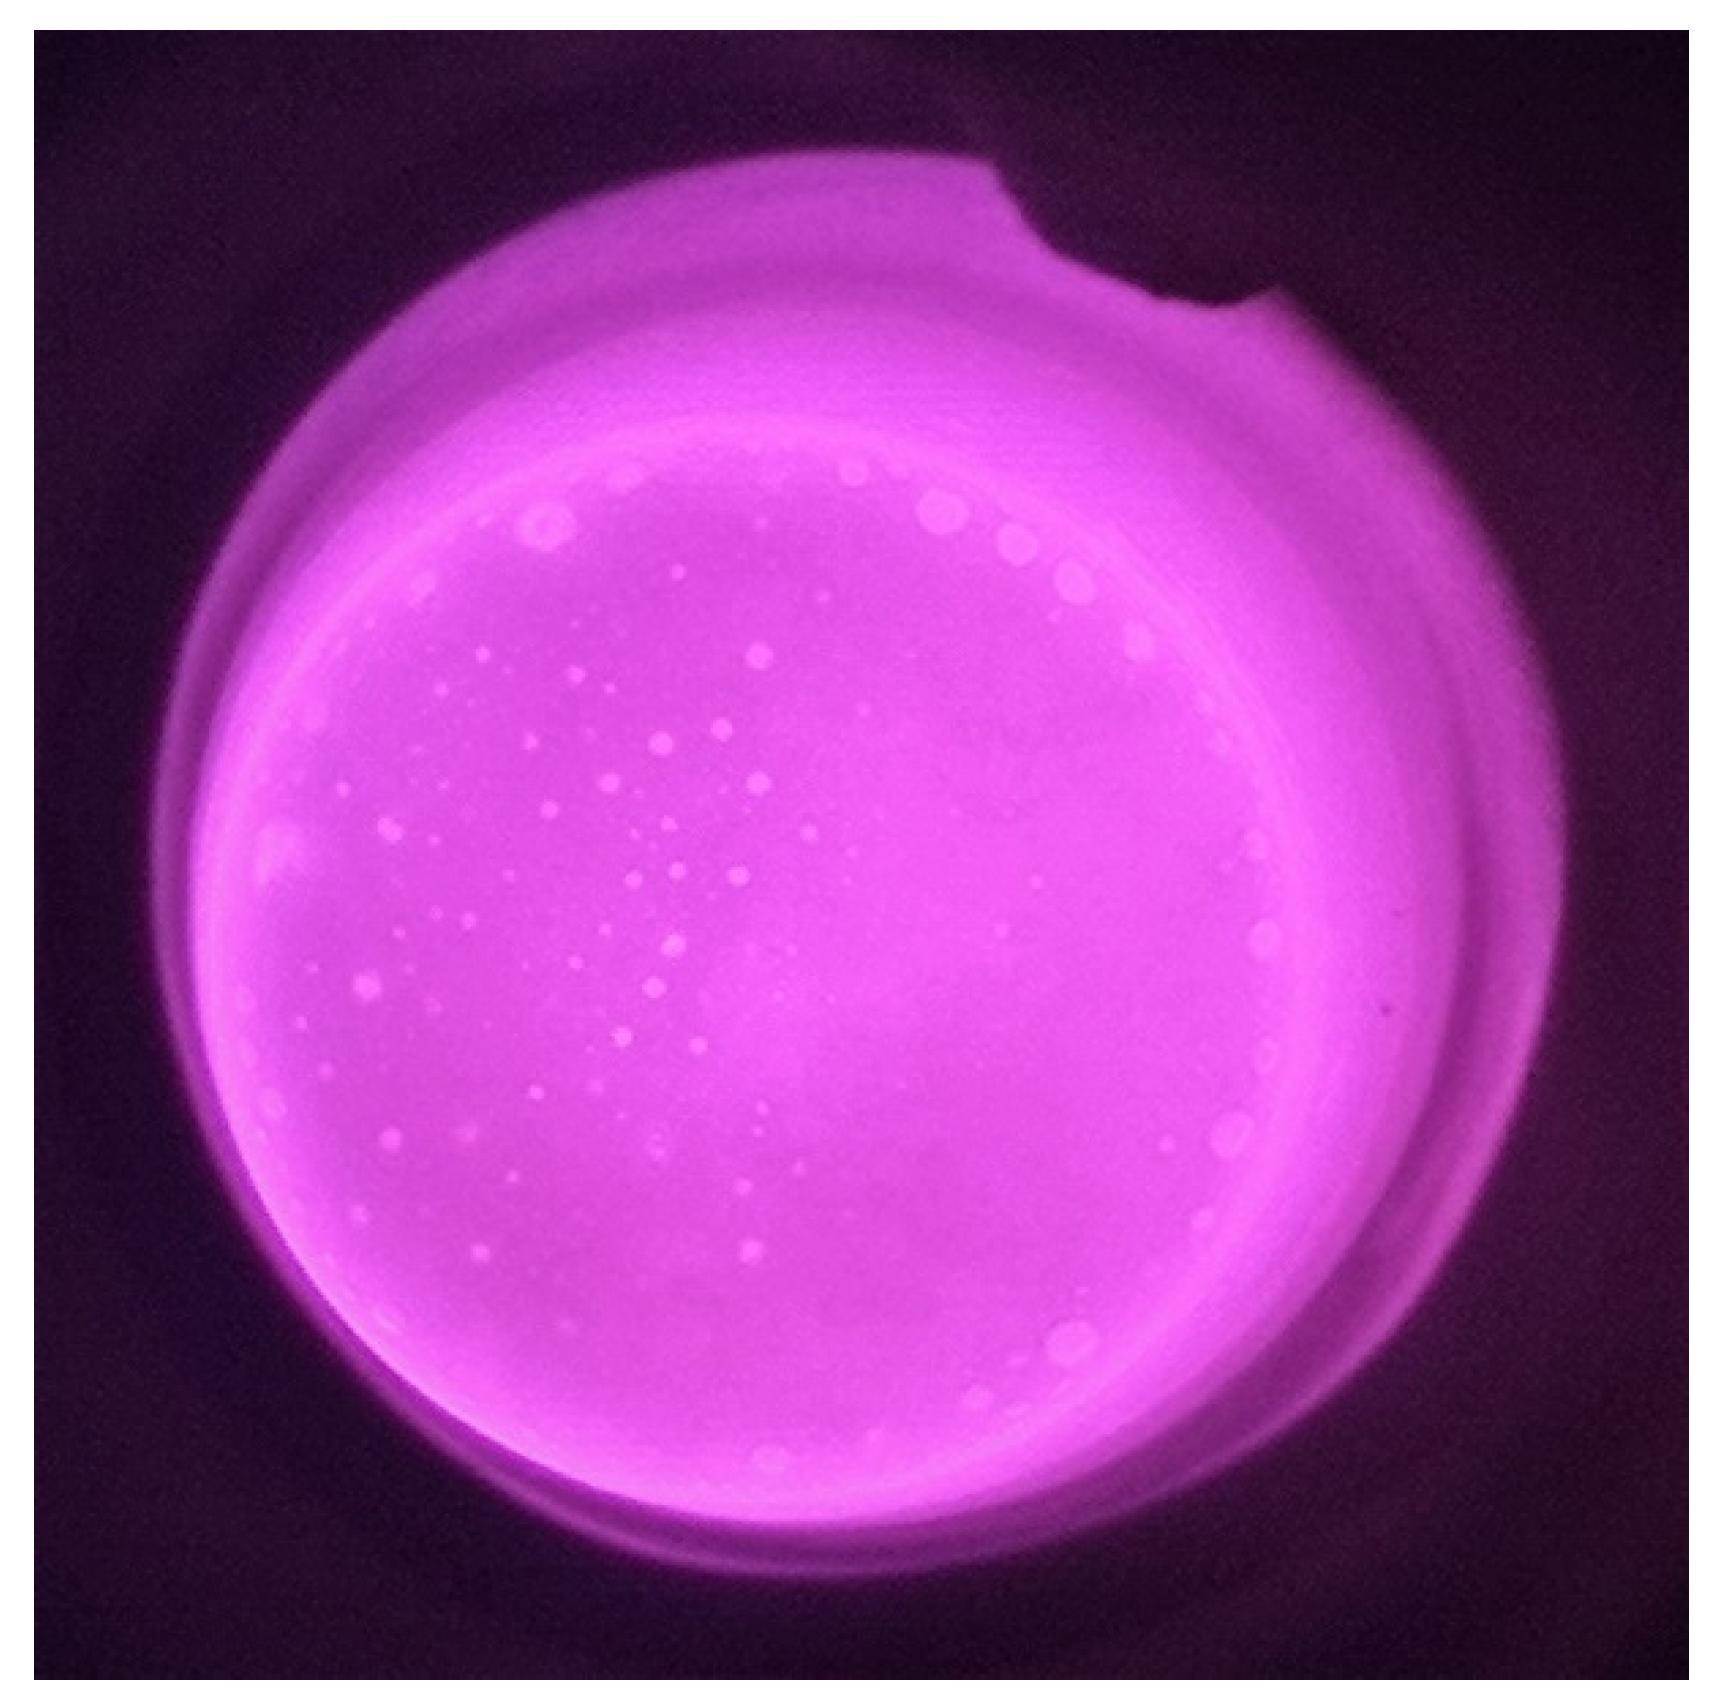
An amount of 250–300 g of the pre-melted steel was placed in a MgO crucible. The slag/metal reaction chamber was then filled with Ar, followed by induction heating. After the temperature reached 1600 °C, 20–30 g of pre-melted slag was added. The steel and slag samples were removed after the slag was melted at 1600 °C for 60 min. Figure 2 shows a direct observation of the slag/metal reaction process.
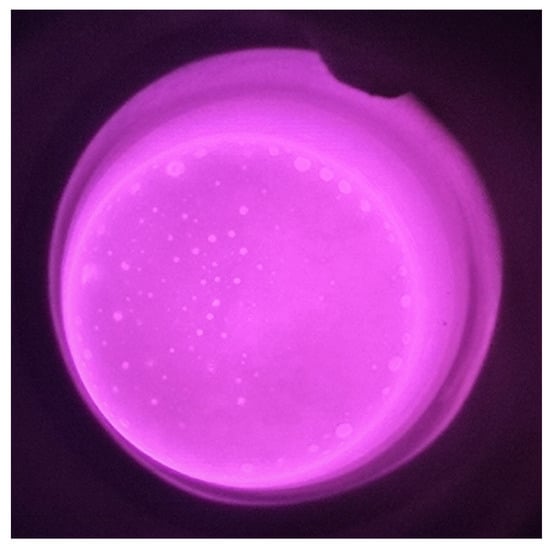
Figure 2.
Direct monitoring of the slag/steel interaction.
The [Si], [Als], [Ca], and [Mg] contents in the steel samples were determined using inductively coupled plasma optical emission spectrometry (ICP-OES) with a relative standard deviation of ±5%. The Cr content in the steel samples was determined using the alkali fusion acid dissolution method. The total oxygen content in the steel samples was analyzed using the inert gas melting-infrared absorption method, with an accuracy of ±1 ppm. The compositions of the slag samples were determined using X-ray fluorescence spectrometry. Table 1 and Table 2 show the compositions of the pre-melted steel and slag, respectively. Table 3 and Table 4 present the compositions of the steel and slag samples, respectively, after 90 min of the steel slag/metal reaction. The surface of the machined steel sample (10 × 10 × 10 mm3) was polished with 240, 400, 800, 1200, and up to 2000 mesh SiC sandpaper. The surface was then ground with a diamond abrasive paste containing a particle diameter of 2.5 μm to determine the size distribution of inclusions in the sample. The characteristics of the inclusions in the steel samples were analyzed using automatic scanning electron microscopy (EVO18-INCAsteel, ZEISS Co., Ltd., Bremen. Germany) combined with scanning electron microscopy W(SEM) and energy-dispersive X-ray spectroscopy (EDS).

Table 1.
Chemical composition of pre-melted steel Sample A (mass percentage).

Table 2.
Chemical composition of premelted slag (Mass percentage).

Table 3.
Chemical composition of the steel samples following the metal/slag reaction (mass percentage).

Table 4.
Chemical makeup of the samples of slag following the interaction of slag with metal (mass percentage).
3. Results and Discussion
3.1. Characterization of Inclusions
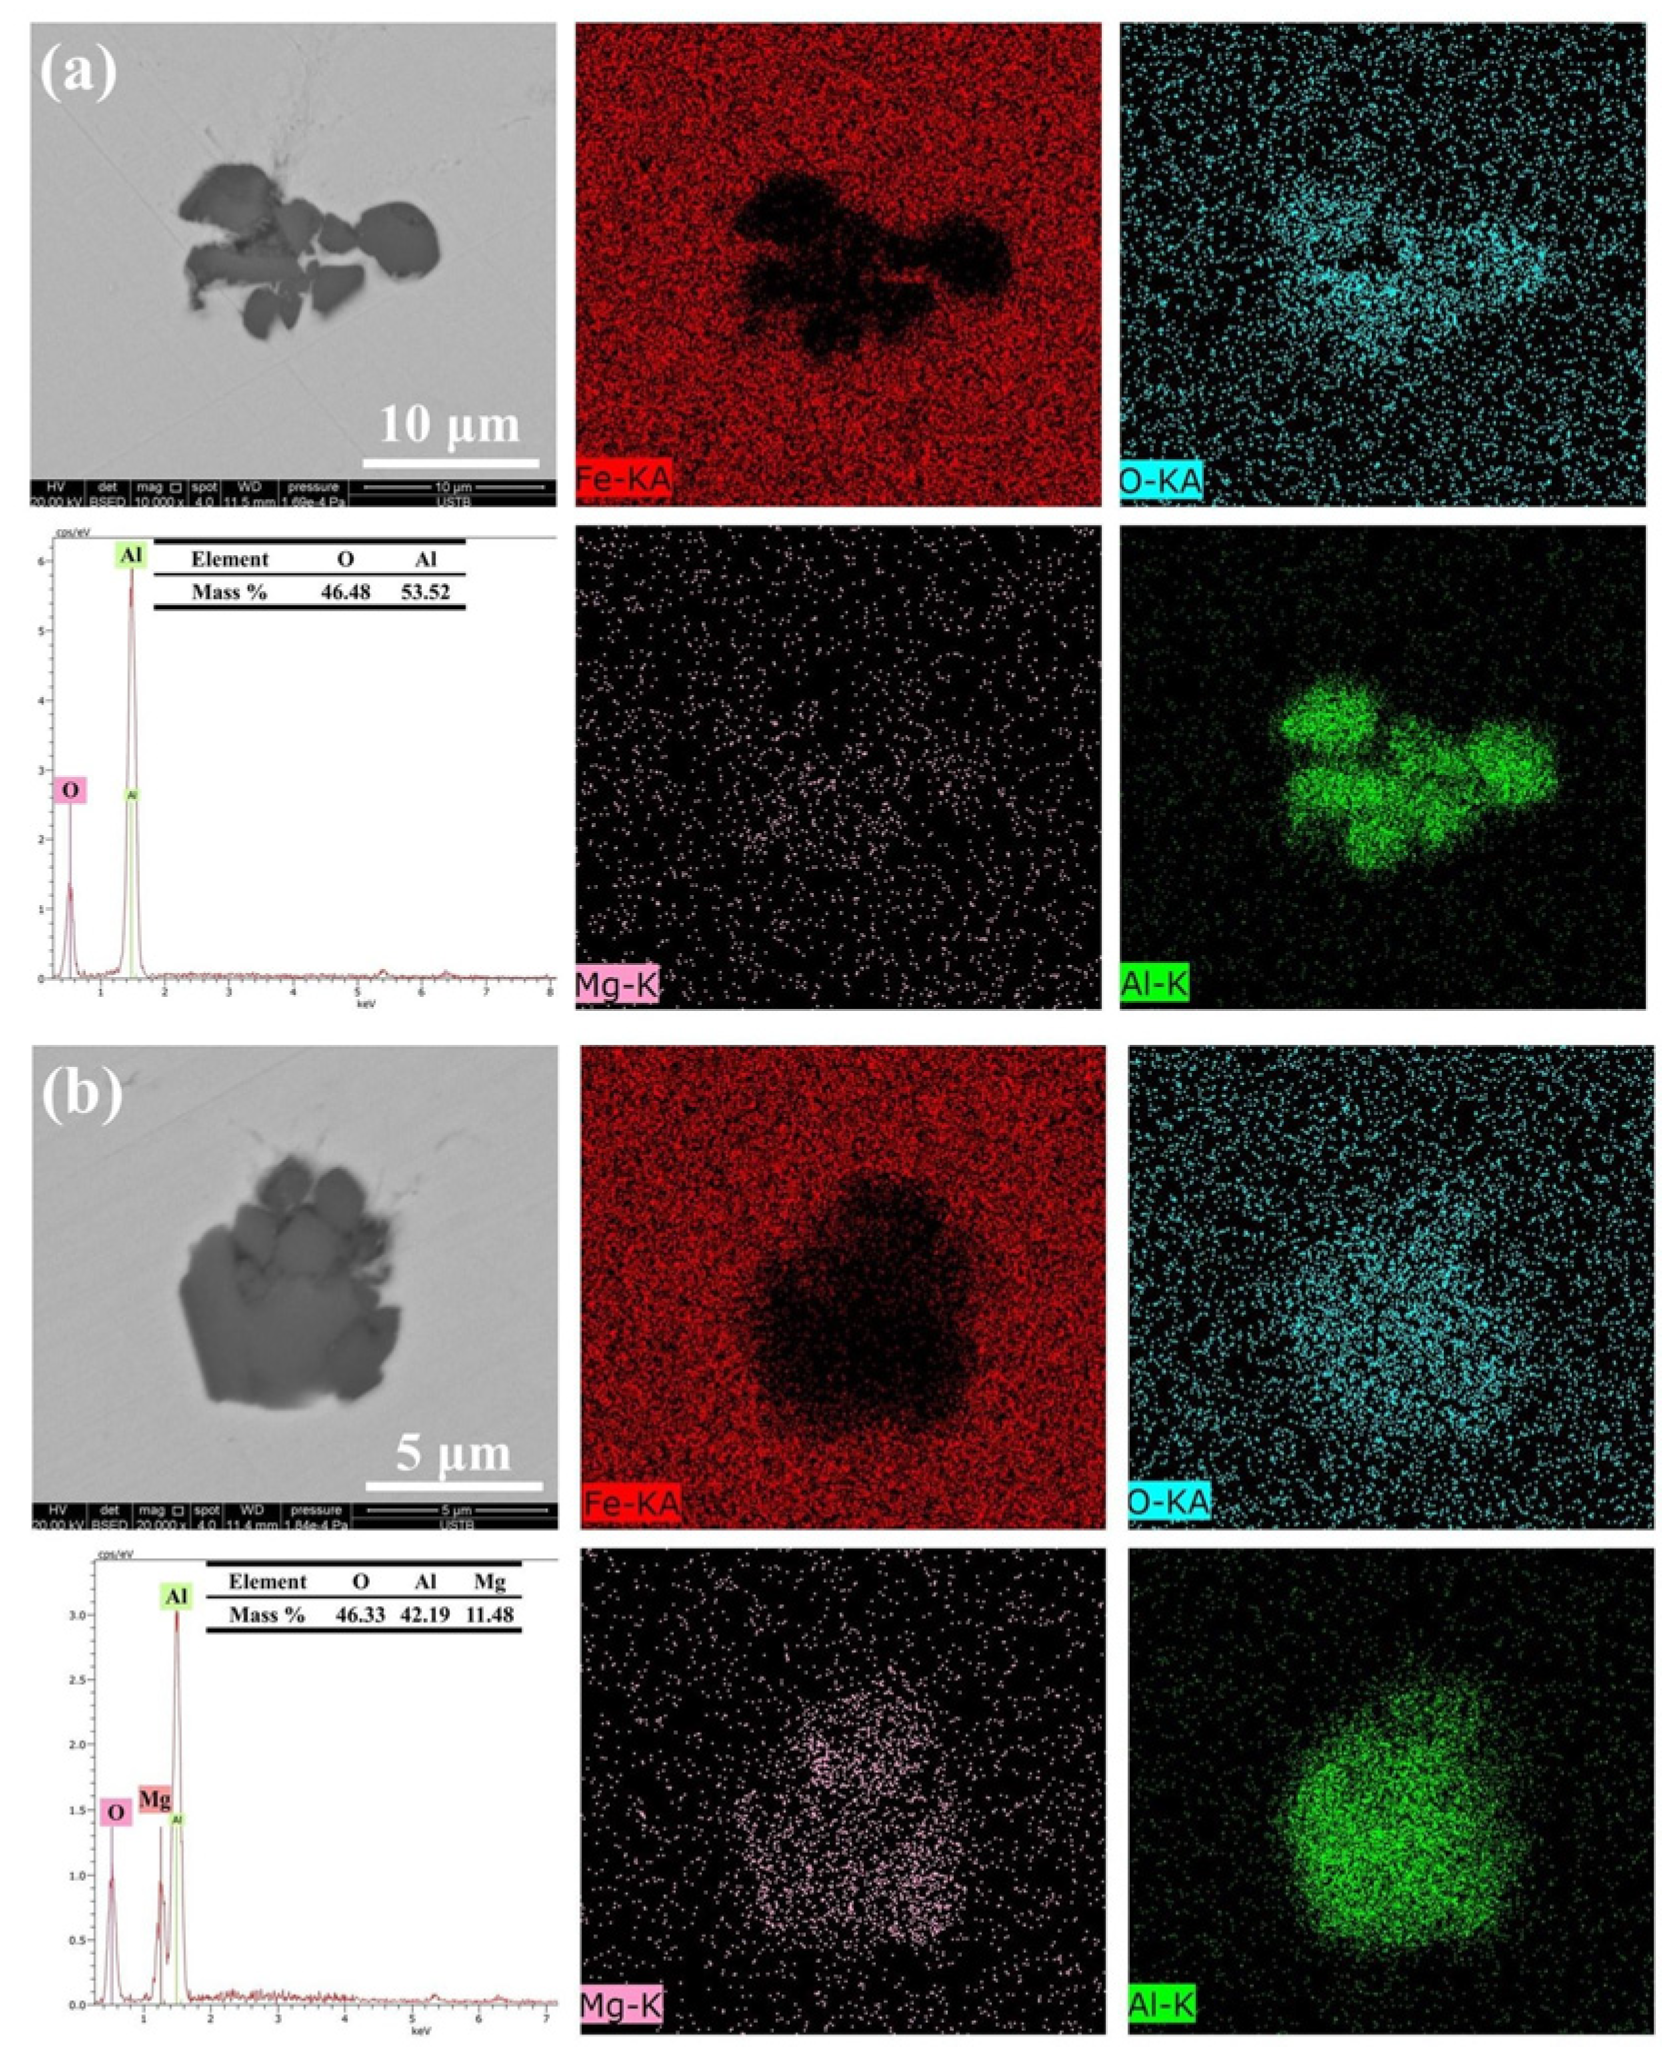
Approximately 30 inclusions from each sample collected at various slag compositions were chosen for characterization. Al2O3 and a small quantity of Al-Mg-O are the two primary inclusions in Sample A. The elements distribution, EDS spectra, and SEM image of the typical inclusions in Sample A are displayed in Figure 3. The numbers represent the mass percentages discovered during EDS analysis. The Al-Mg-O inclusions exhibit uneven forms, and the majority of the Al2O3 inclusions are clusters created by irregular shapes.
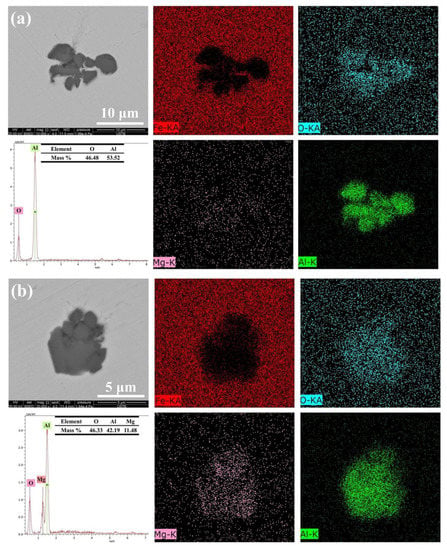
Figure 3.
Typical inclusion morphology and makeup of Sample A: (a) Al2O3 inclusion; (b) Al2O3·MgO inclusion.
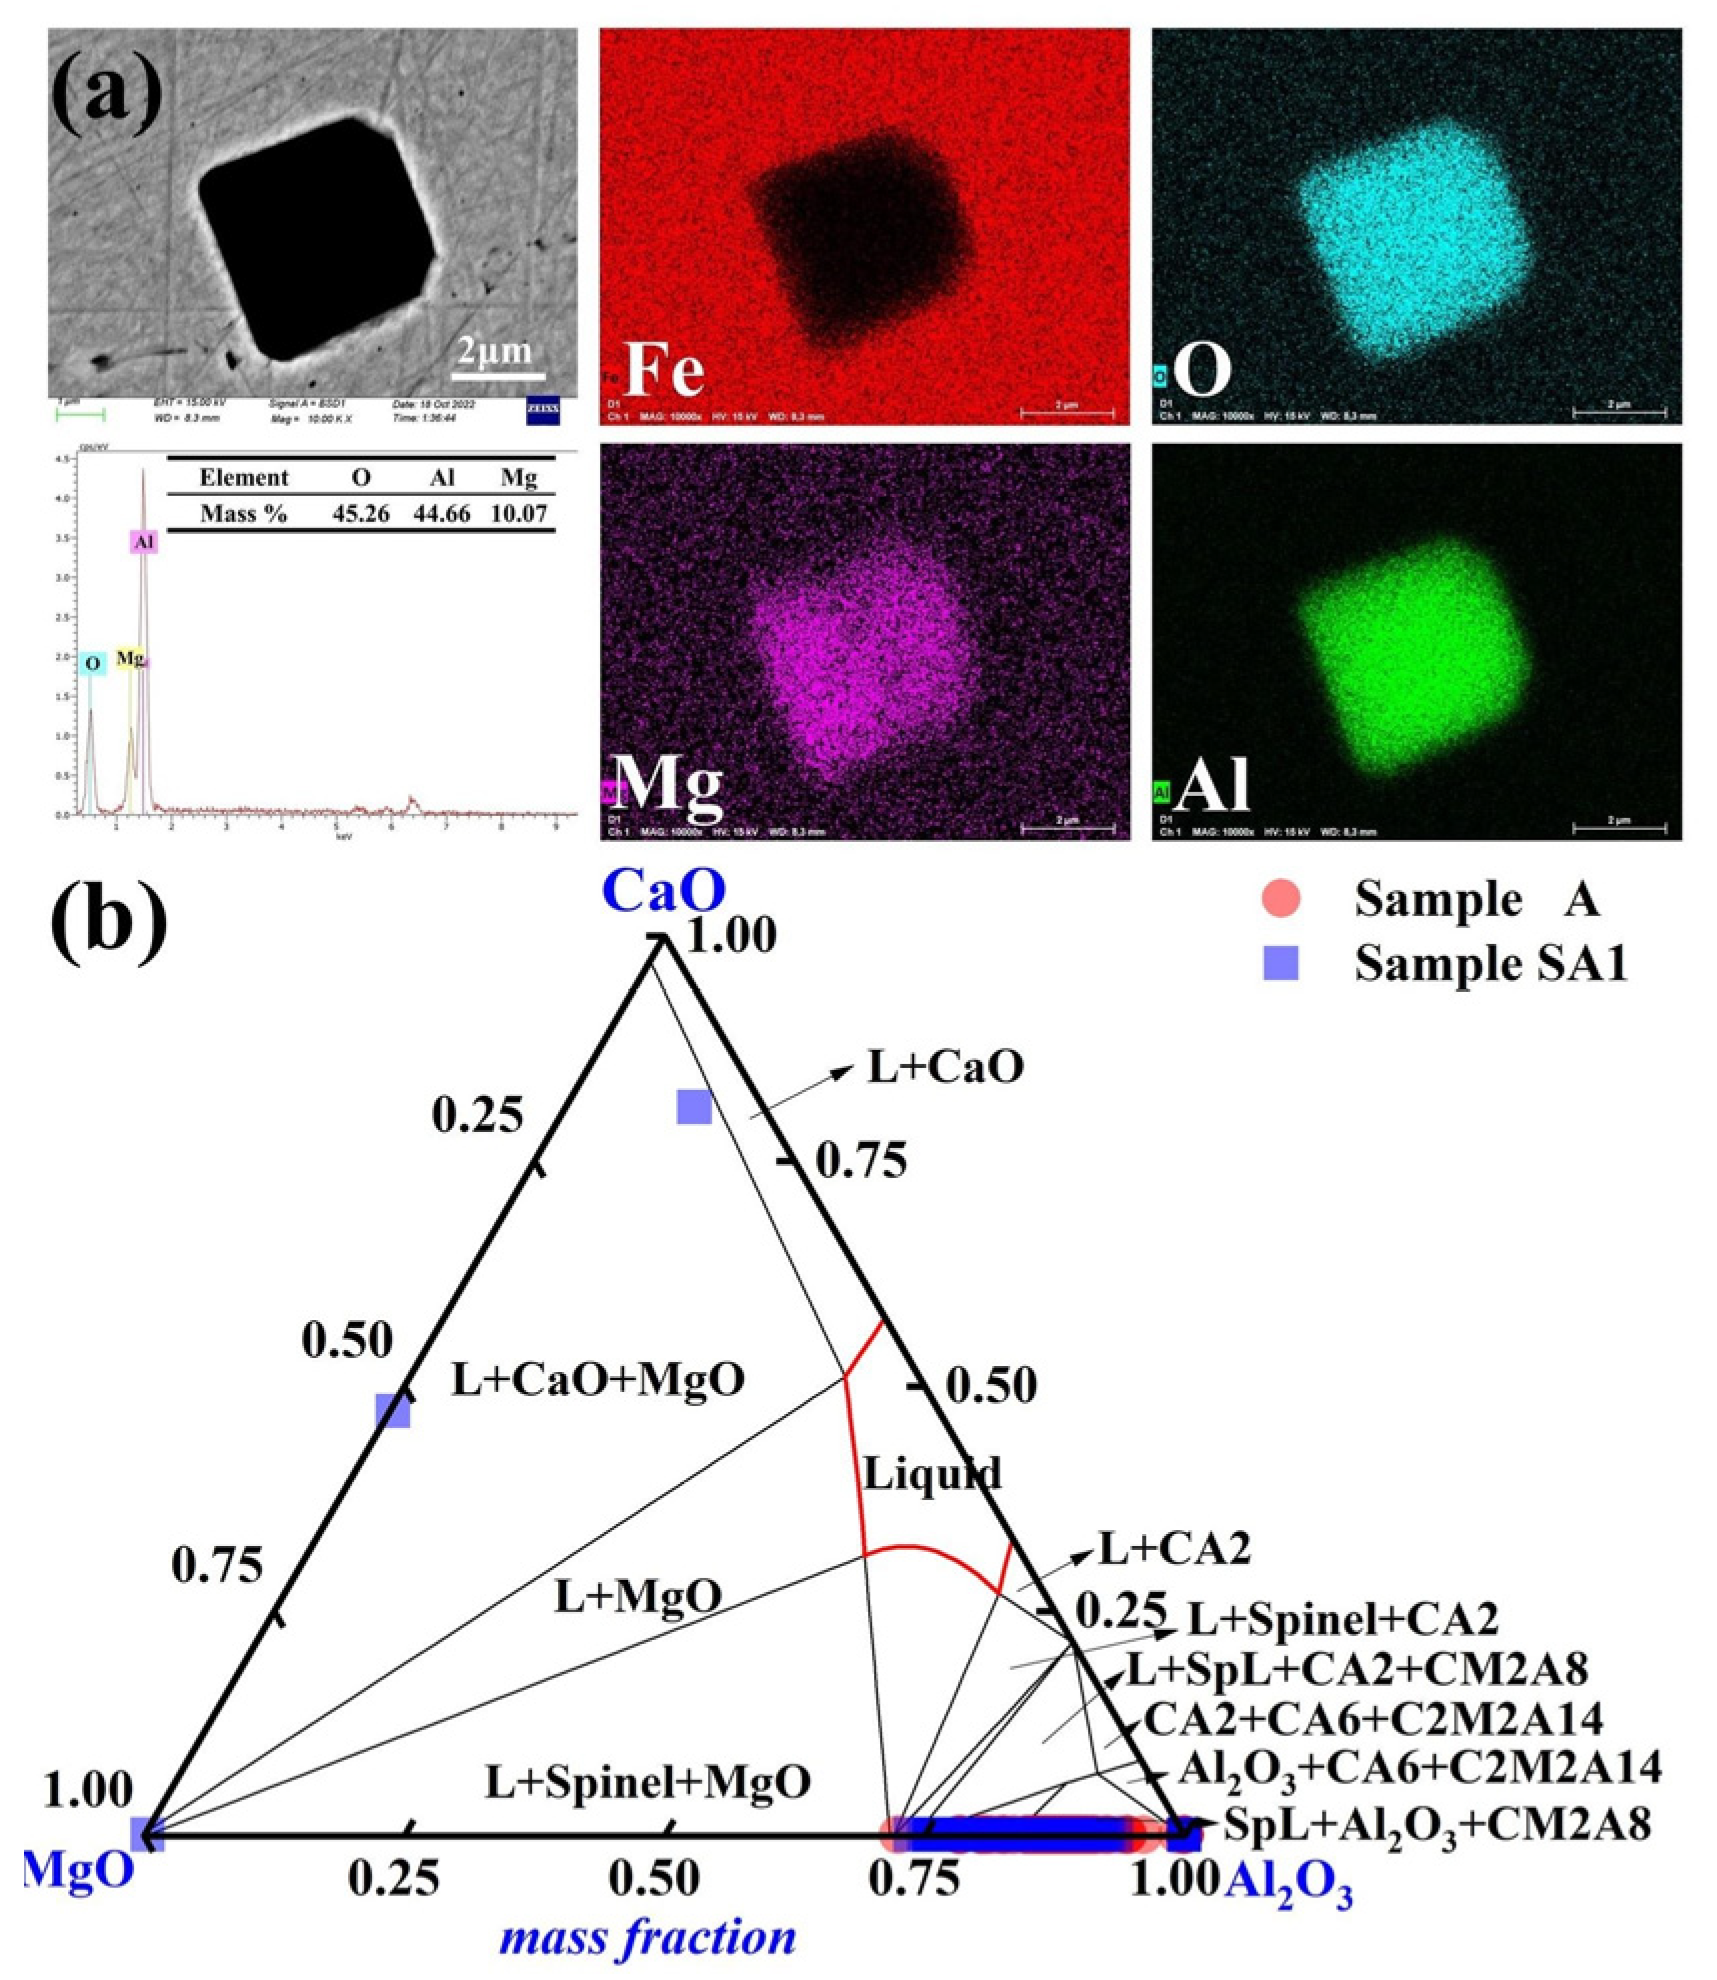
The predominant inclusion in steel sample A1 following a 90-min reaction with slag S1 was Mg-Al-O, as shown in Figure 4a. The majority of inclusions exhibit erratic forms and much smaller sizes. In Figure 4b, the inclusions in samples A and A1 are highlighted to emphasize the development of inclusions in the molten steel. The liquid region (red) of the MgO-Al2O3-CaO ternary phase diagram was computed using FactSageTM 8.2 software. The inclusions of Sample A mostly lacked MgO. The 90-min reaction between steel Sample A and slag S1 resulted in a considerable alteration in the steel inclusion makeup. The amount of Al-Mg-O inclusions considerably increased in Sample A1. The Mg level of Sample A1 also increased to 3 ppm (in comparison to 2 ppm for Sample A). Most of the inclusions in Sample A1 had an Al2O3 concentration of more than 80%.
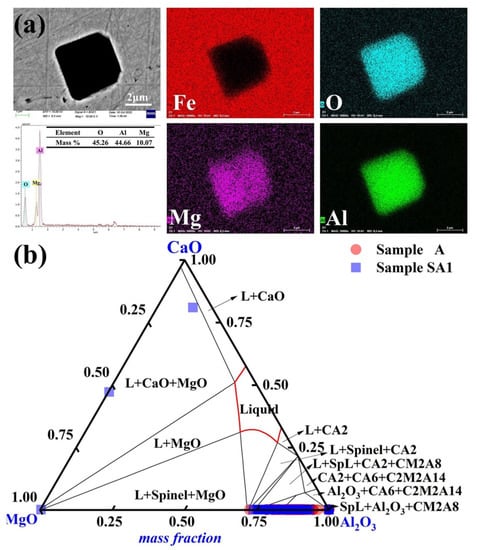
Figure 4.
Common inclusions in Sample A1 had the following morphology and composition: (a) elemental distribution of the point inclusions and (b) composition distributions of the inclusions in Samples A and A1 in the MgO-Al2O3-CaO phase diagram. At 1600 °C, the solid lines depict the boundaries between several phases.
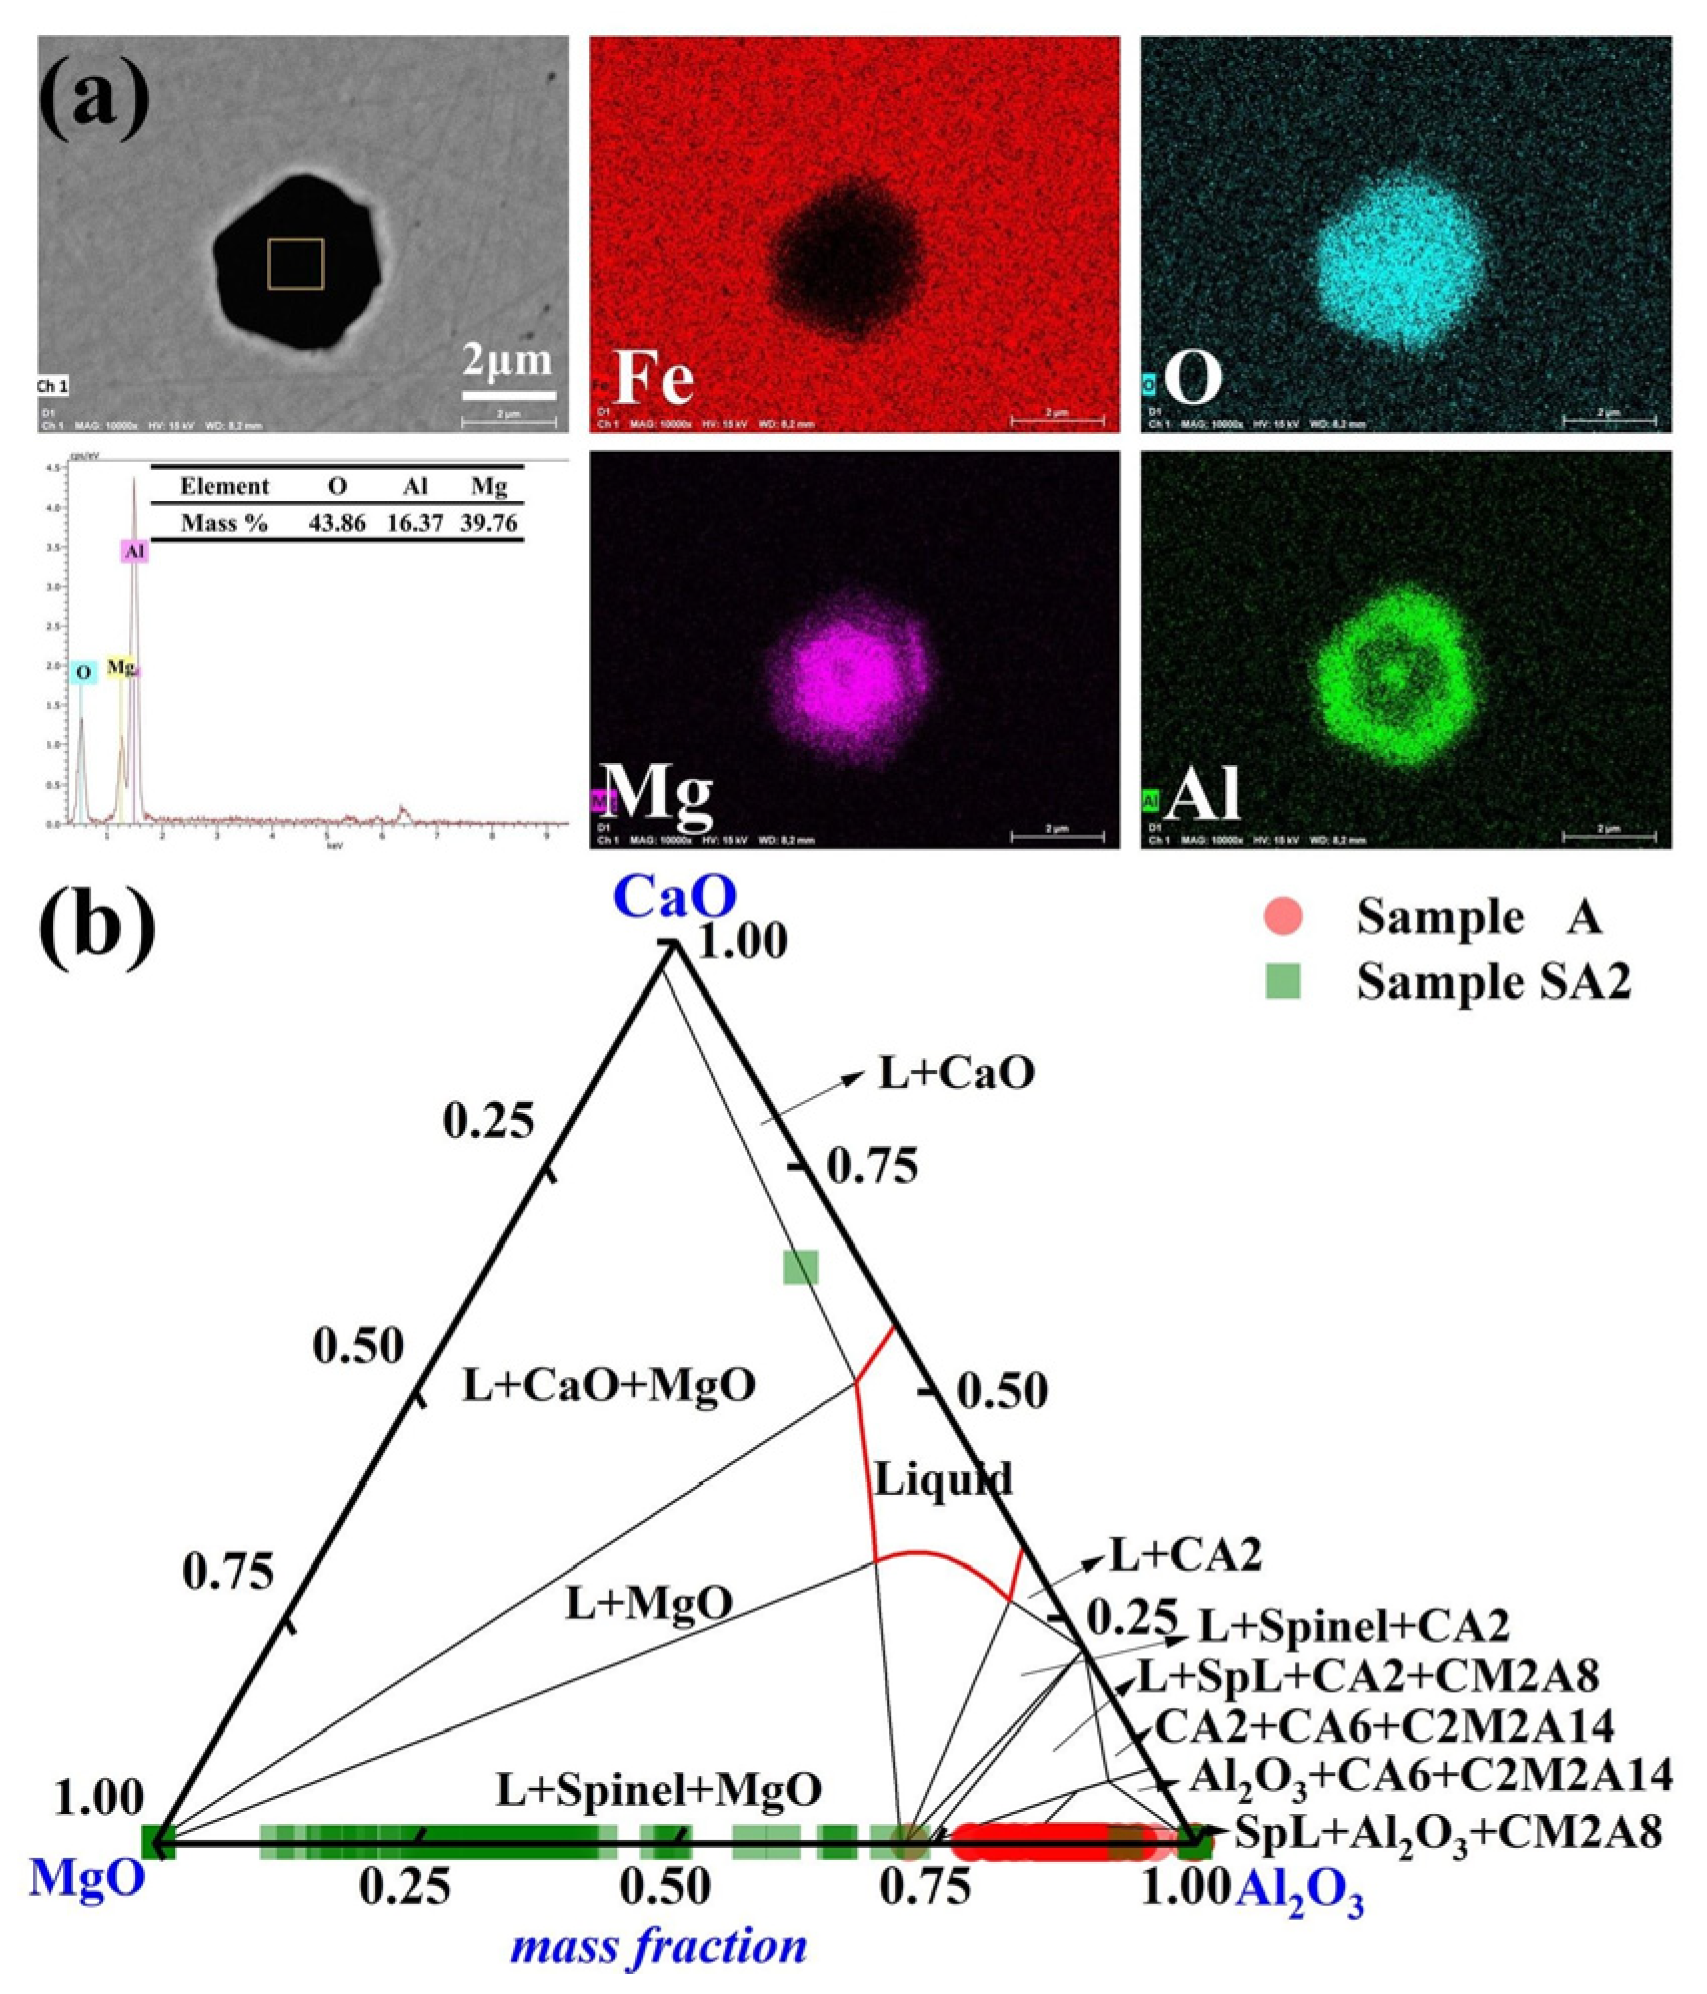
The primary inclusions in steel sample A2 were MgO-Al2O3 following a 90-min reaction between steel sample A and slag sample S2. The distribution of the typical MgO- Al2O3 inclusions in Sample A2 is shown in Figure 5a. The inclusions have an irregular polygonal form. The compositions of the inclusions in Samples A and A2 are shown in Figure 5b. The MgO concentration of the majority of the inclusions in Sample A2 grew to more than 60% of the mass after 90 min of the slag/metal reaction. Moreover, Sample A2 had a Mg concentration of up to 8 ppm, which was considerably greater than those of Samples A and A1.
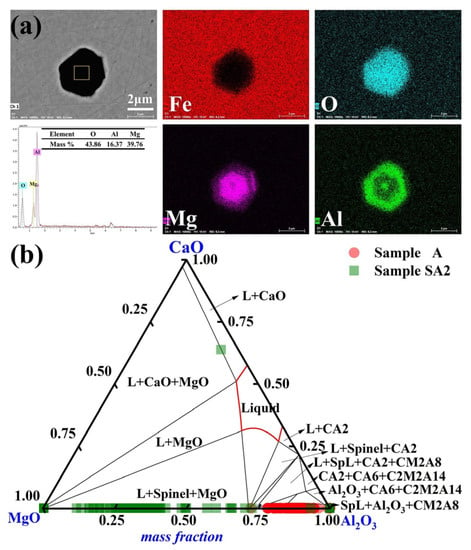
Figure 5.
Common inclusions in Sample A2 had the following morphology and composition: (a) elemental distribution of the point inclusions and (b) composition distributions of the inclusions in Samples A and A2 in the MgO-Al2O3-CaO phase diagram. At 1600 °C, the solid lines depict the boundaries between several phases.
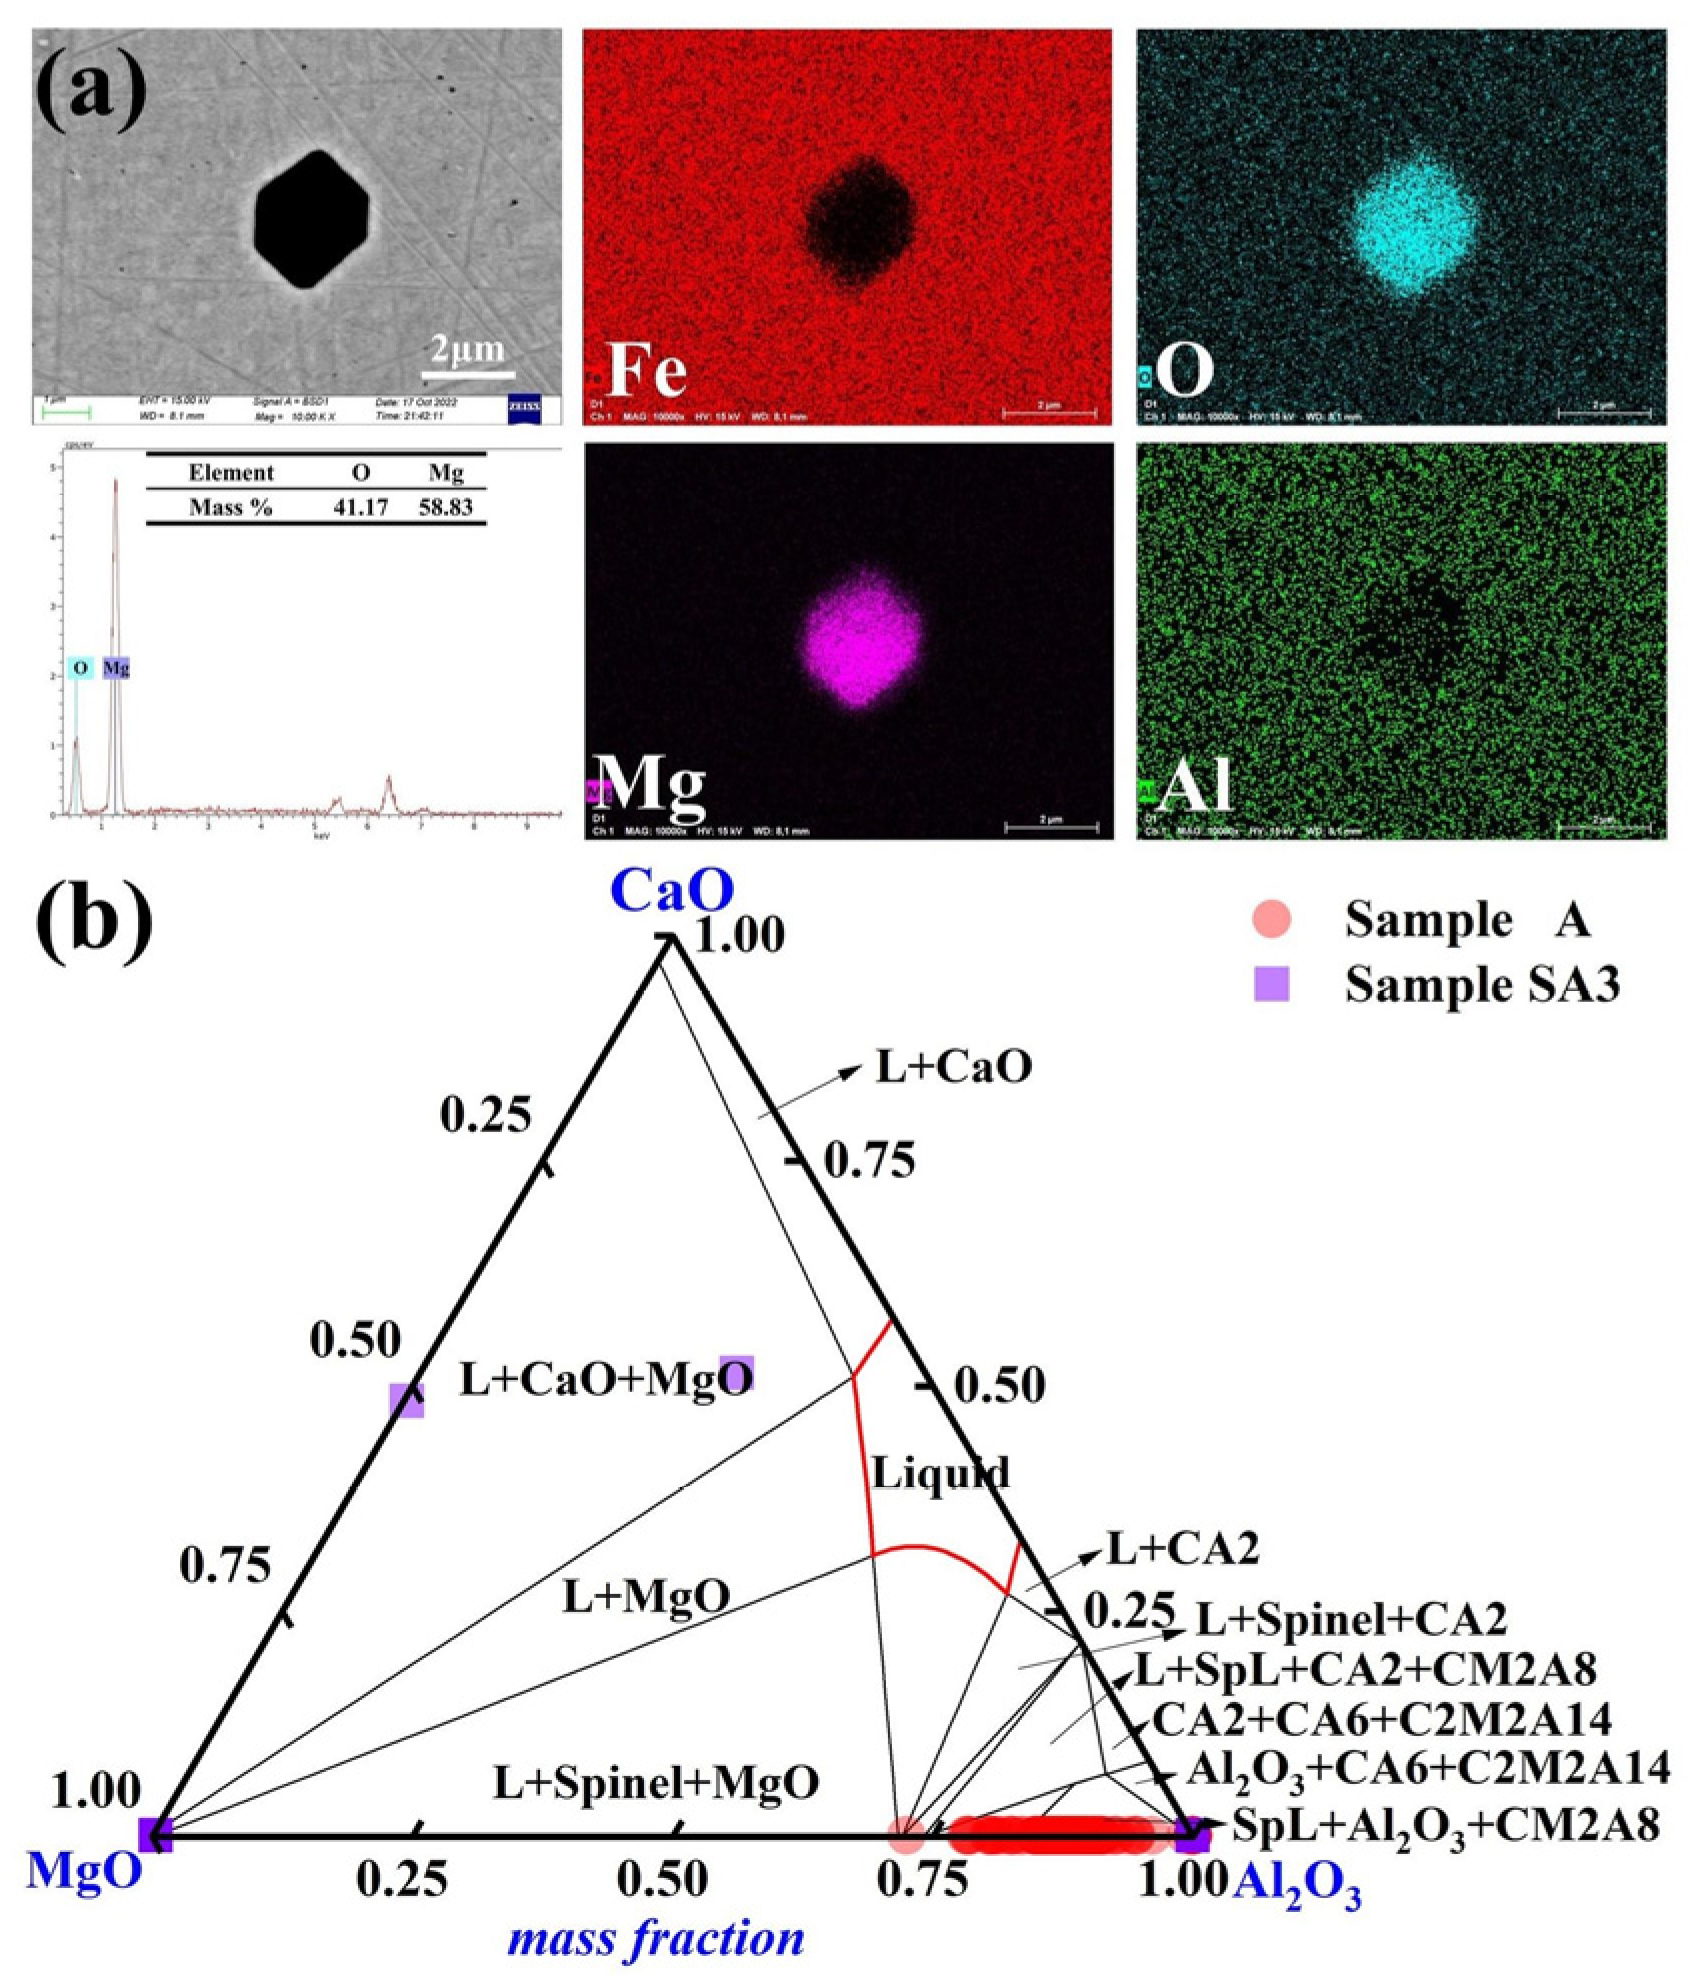
Pure MgO inclusions became predominant in steel sample A3 following a 90-min reaction with the slag with the highest basicity, S3. The elemental distribution of the typical inclusions in Sample A3 is depicted in Figure 6a. Most inclusions had an amorphous irregular polygonal form. The MgO-Al2O3-CaO ternary diagram in Figure 6b highlights the composition of inclusions in Samples A and A3. Compared to the other steel samples, Sample A3 had a higher Mg concentration of 12 ppm. The features of inclusions in molten steel were considerably influenced by the slag/metal interaction.
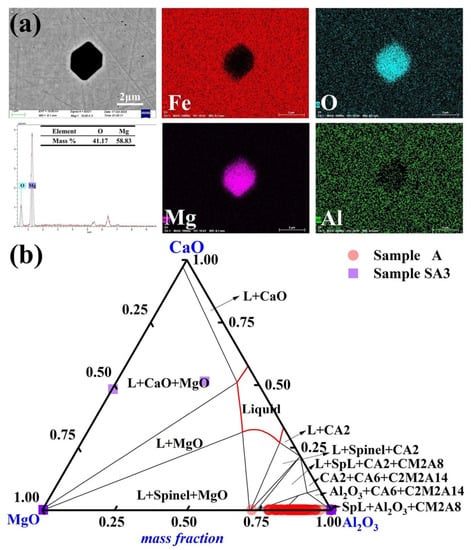
Figure 6.
Morphology and makeup of the typical inclusions in Sample A3: (a) elemental distribution of the point inclusions and (b) composition distributions of the inclusions in Samples A and A3 in the MgO-Al2O3-CaO phase diagram. At 1600 °C, the solid lines depict the boundaries between several phases.
3.2. Sizes of the Inclusions and Their Densities
Using SEM, EDS, and an automated scanning electron microscope (EVO18-INCAsteel, Zeiss), the shapes and contents of the non-metallic inclusions on the mirror-polished surfaces of the steel specimens were examined. The size of an inclusion was defined as its largest diameter. Because the interaction volume might permeate into the steel and excite electrons from the surroundings of inclusions with a diameter of less than 1 μm, the size was designed to be more than 1 μm.
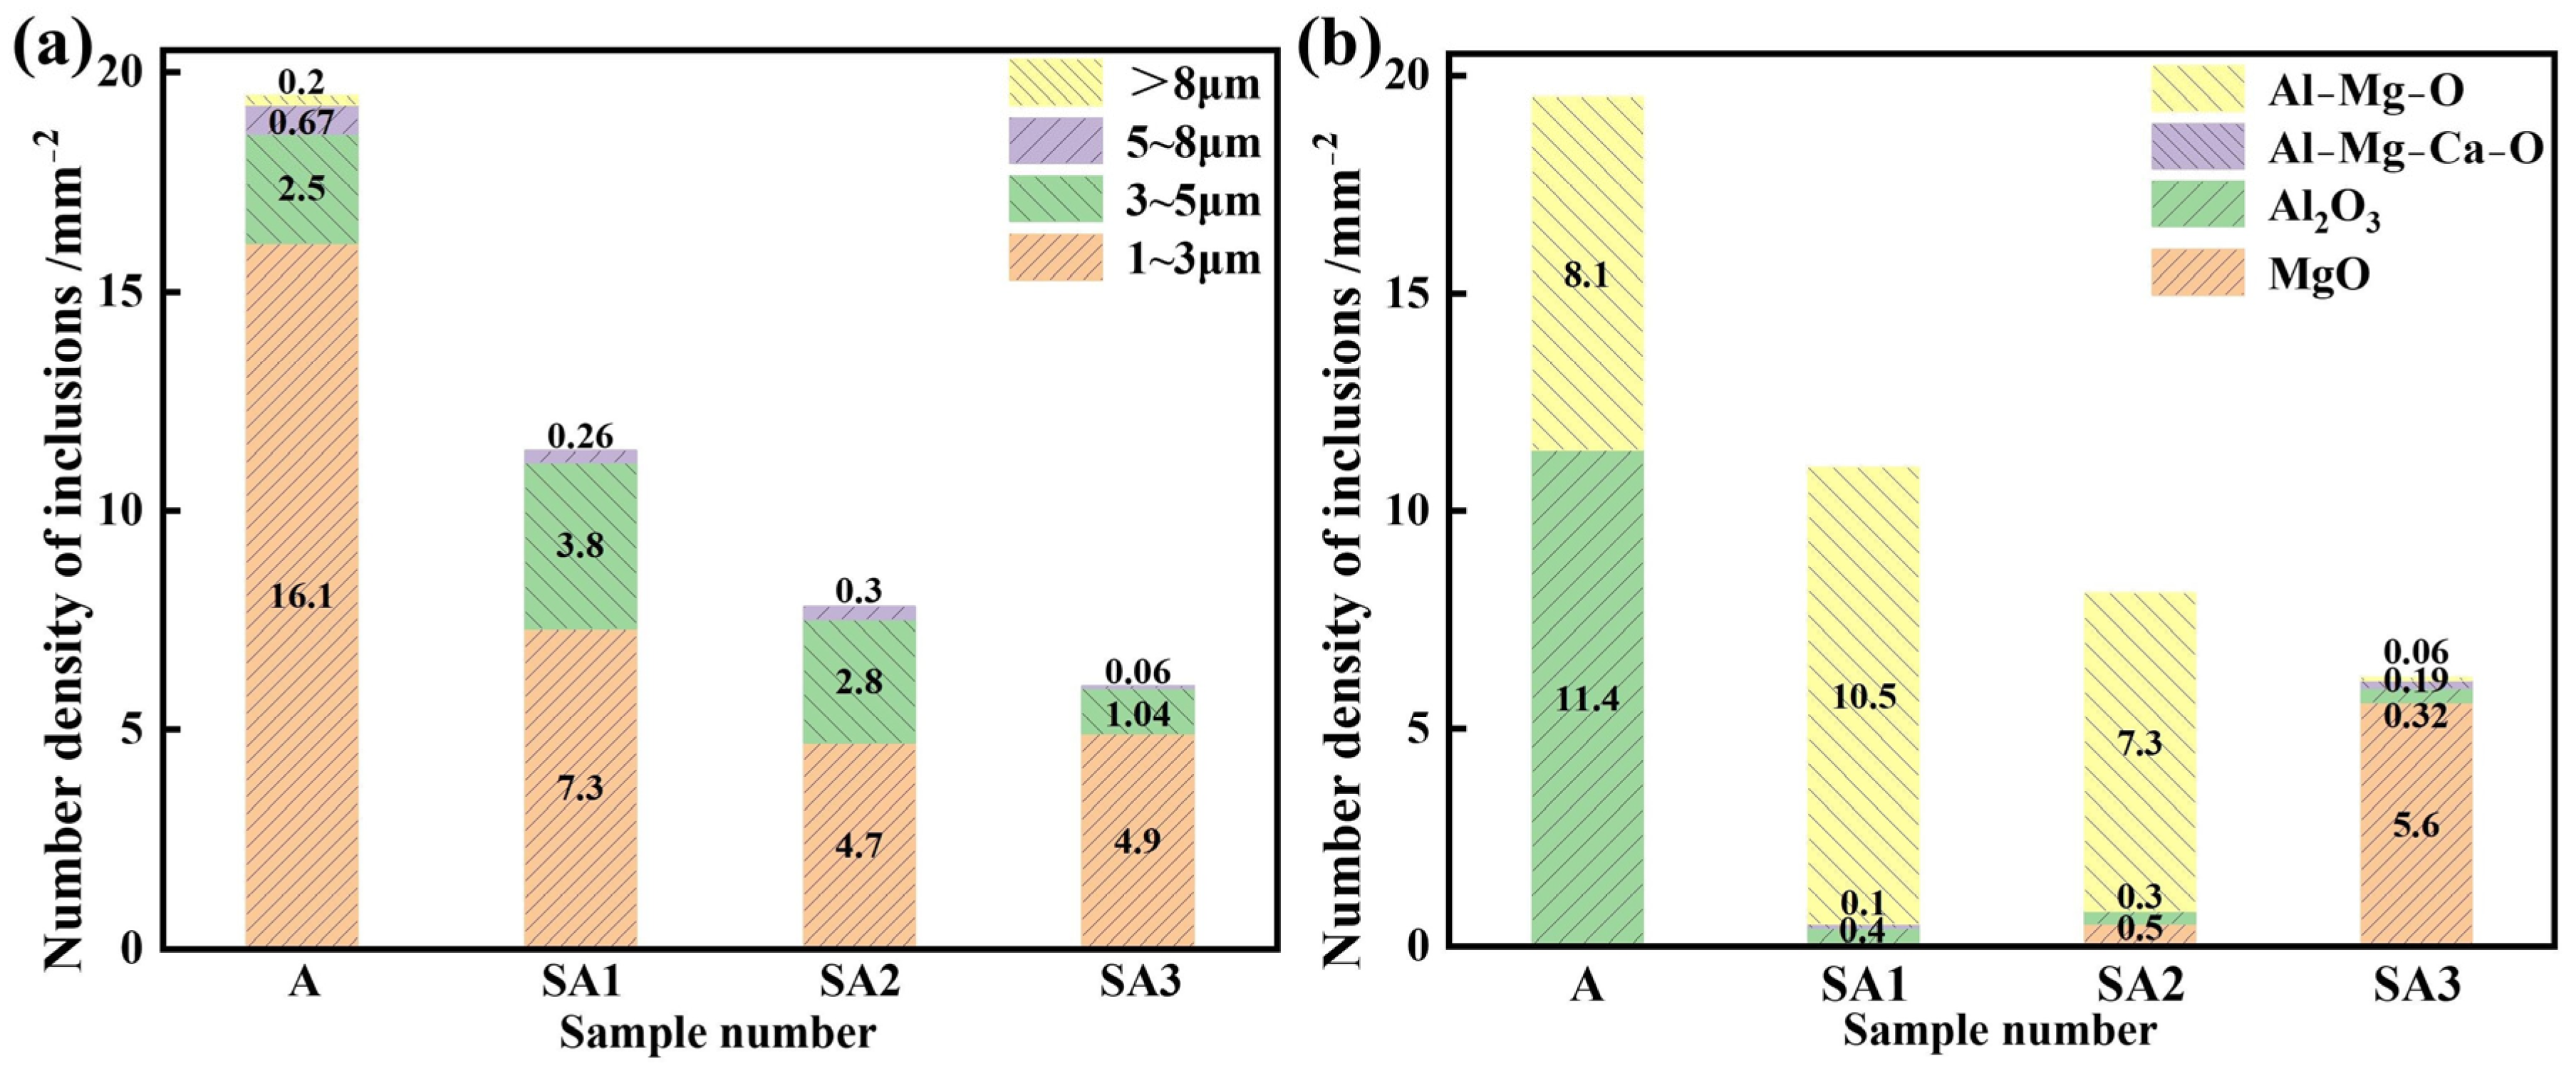
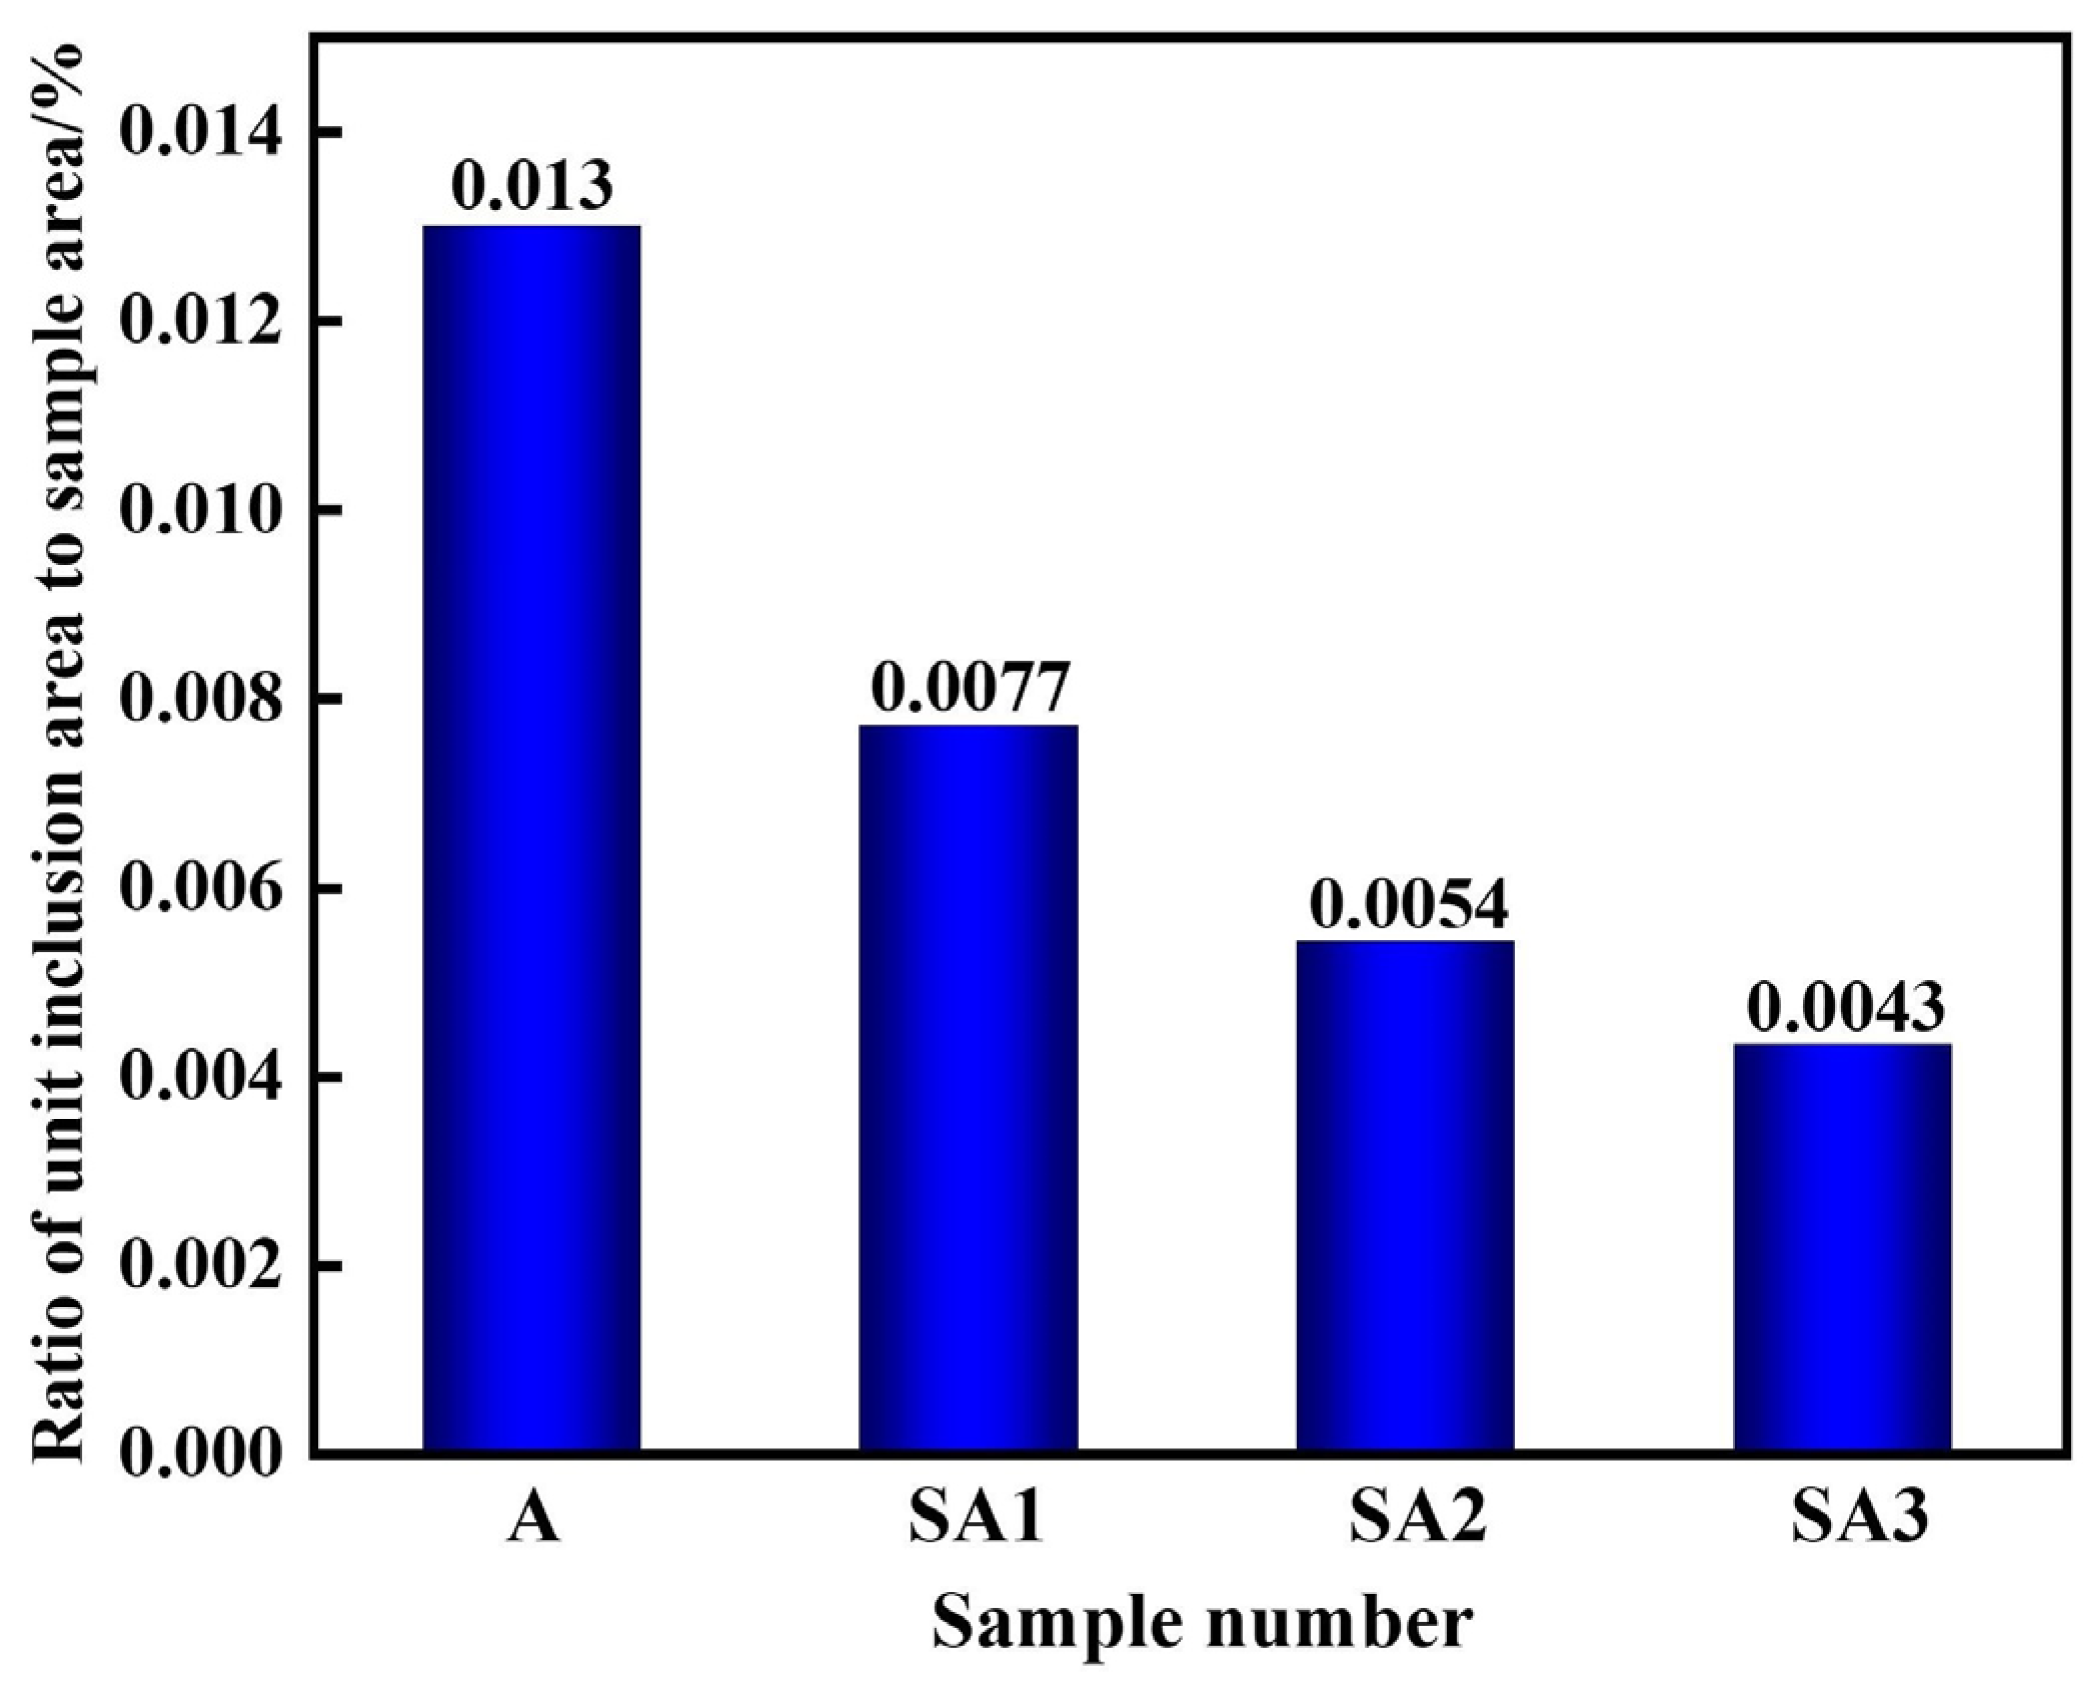
The size range of inclusions in the three samples, ranging from A to E, is shown in Figure 7. The stainless steel inclusion sizes and number densities in various experimental groups varied considerably. The lowest observed number density of inclusions was found in Experiment C, which involved refining steel with 50.56%, CaO-14.44%, SiO2-15%, Al2O3-10%, and MgO-5% CaF2 slag. Furthermore, the lowest area percentage of all inclusions was 0.052%. It was also similar to the outcomes of Experiment B. The majority of inclusions in steel were 1–2 μm in size; however, some of them were up to 5 μm. Slag from the refining process may be used more effectively to eliminate bigger particles. The overall number of inclusions in steel decreased from 19.48 mm−2 to 11.04, 7.79, and 6.04 mm−2 when S1–S3 were refined. Before the response, the area fraction of the total inclusions per unit area decreased from 0.0130% to 0.0077, 0.0054, and 0.0043%. The S3 slag exhibited the lowest inclusion density and area proportion of all inclusions per unit area when compared to the other two refining slags. Therefore, the S3 slag shows the strongest capacity to refine and absorb inclusions. Importantly, a significant correlation existed between the total oxygen concentration and inclusion distribution density in steel. As indicated in Table 3, the total oxygen content of steel decreases with decreasing inclusion distribution density.
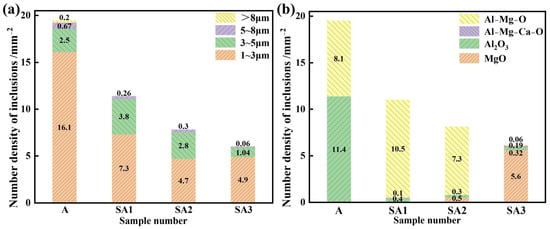
Figure 7.
Differences between S1 and S3 in the inclusion number density of the molten steel samples: (a) different inclusion sizes and (b) inclusion types.
The ratio of various inclusion types to the overall inclusion number density is shown in Figure 8. As slag basicity grew, the proportion of MgO inclusions in molten steel increased, the proportion of Al2O3 inclusions reduced. In the S1 slag, the proportion of Al-Mg-O inclusions peaked and then decreased. This resulted from changes in the magnesium concentration of molten steel as well as the various adsorption properties of slag on inclusions of Al2O3, MgAl2O4, and MgO.
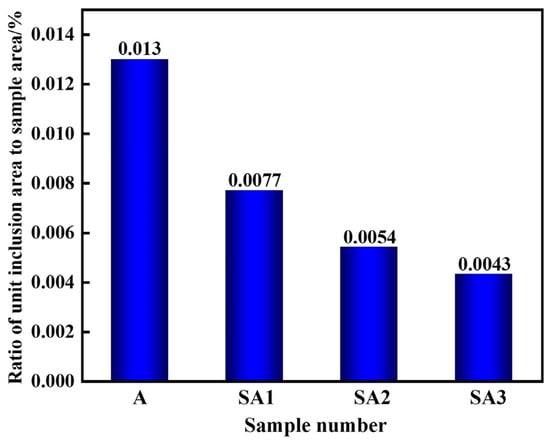
Figure 8.
Ratio of unit inclusion area to sample-scanning area in various samples after slag reaction.
Figure 9 shows the difference in chemical composition for various inclusion sizes. Figure 7 shows that the size of the inclusions is distributed in the range of 0–8 μm; therefore, this study focuses on this range. After the interaction of molten steel with slag, Al2O3 inclusions gradually changed into Al-Mg-O inclusions, and the MgO concentration of inclusions increased.

Figure 9.
Chemical make-up of the inclusions in samples of steel.
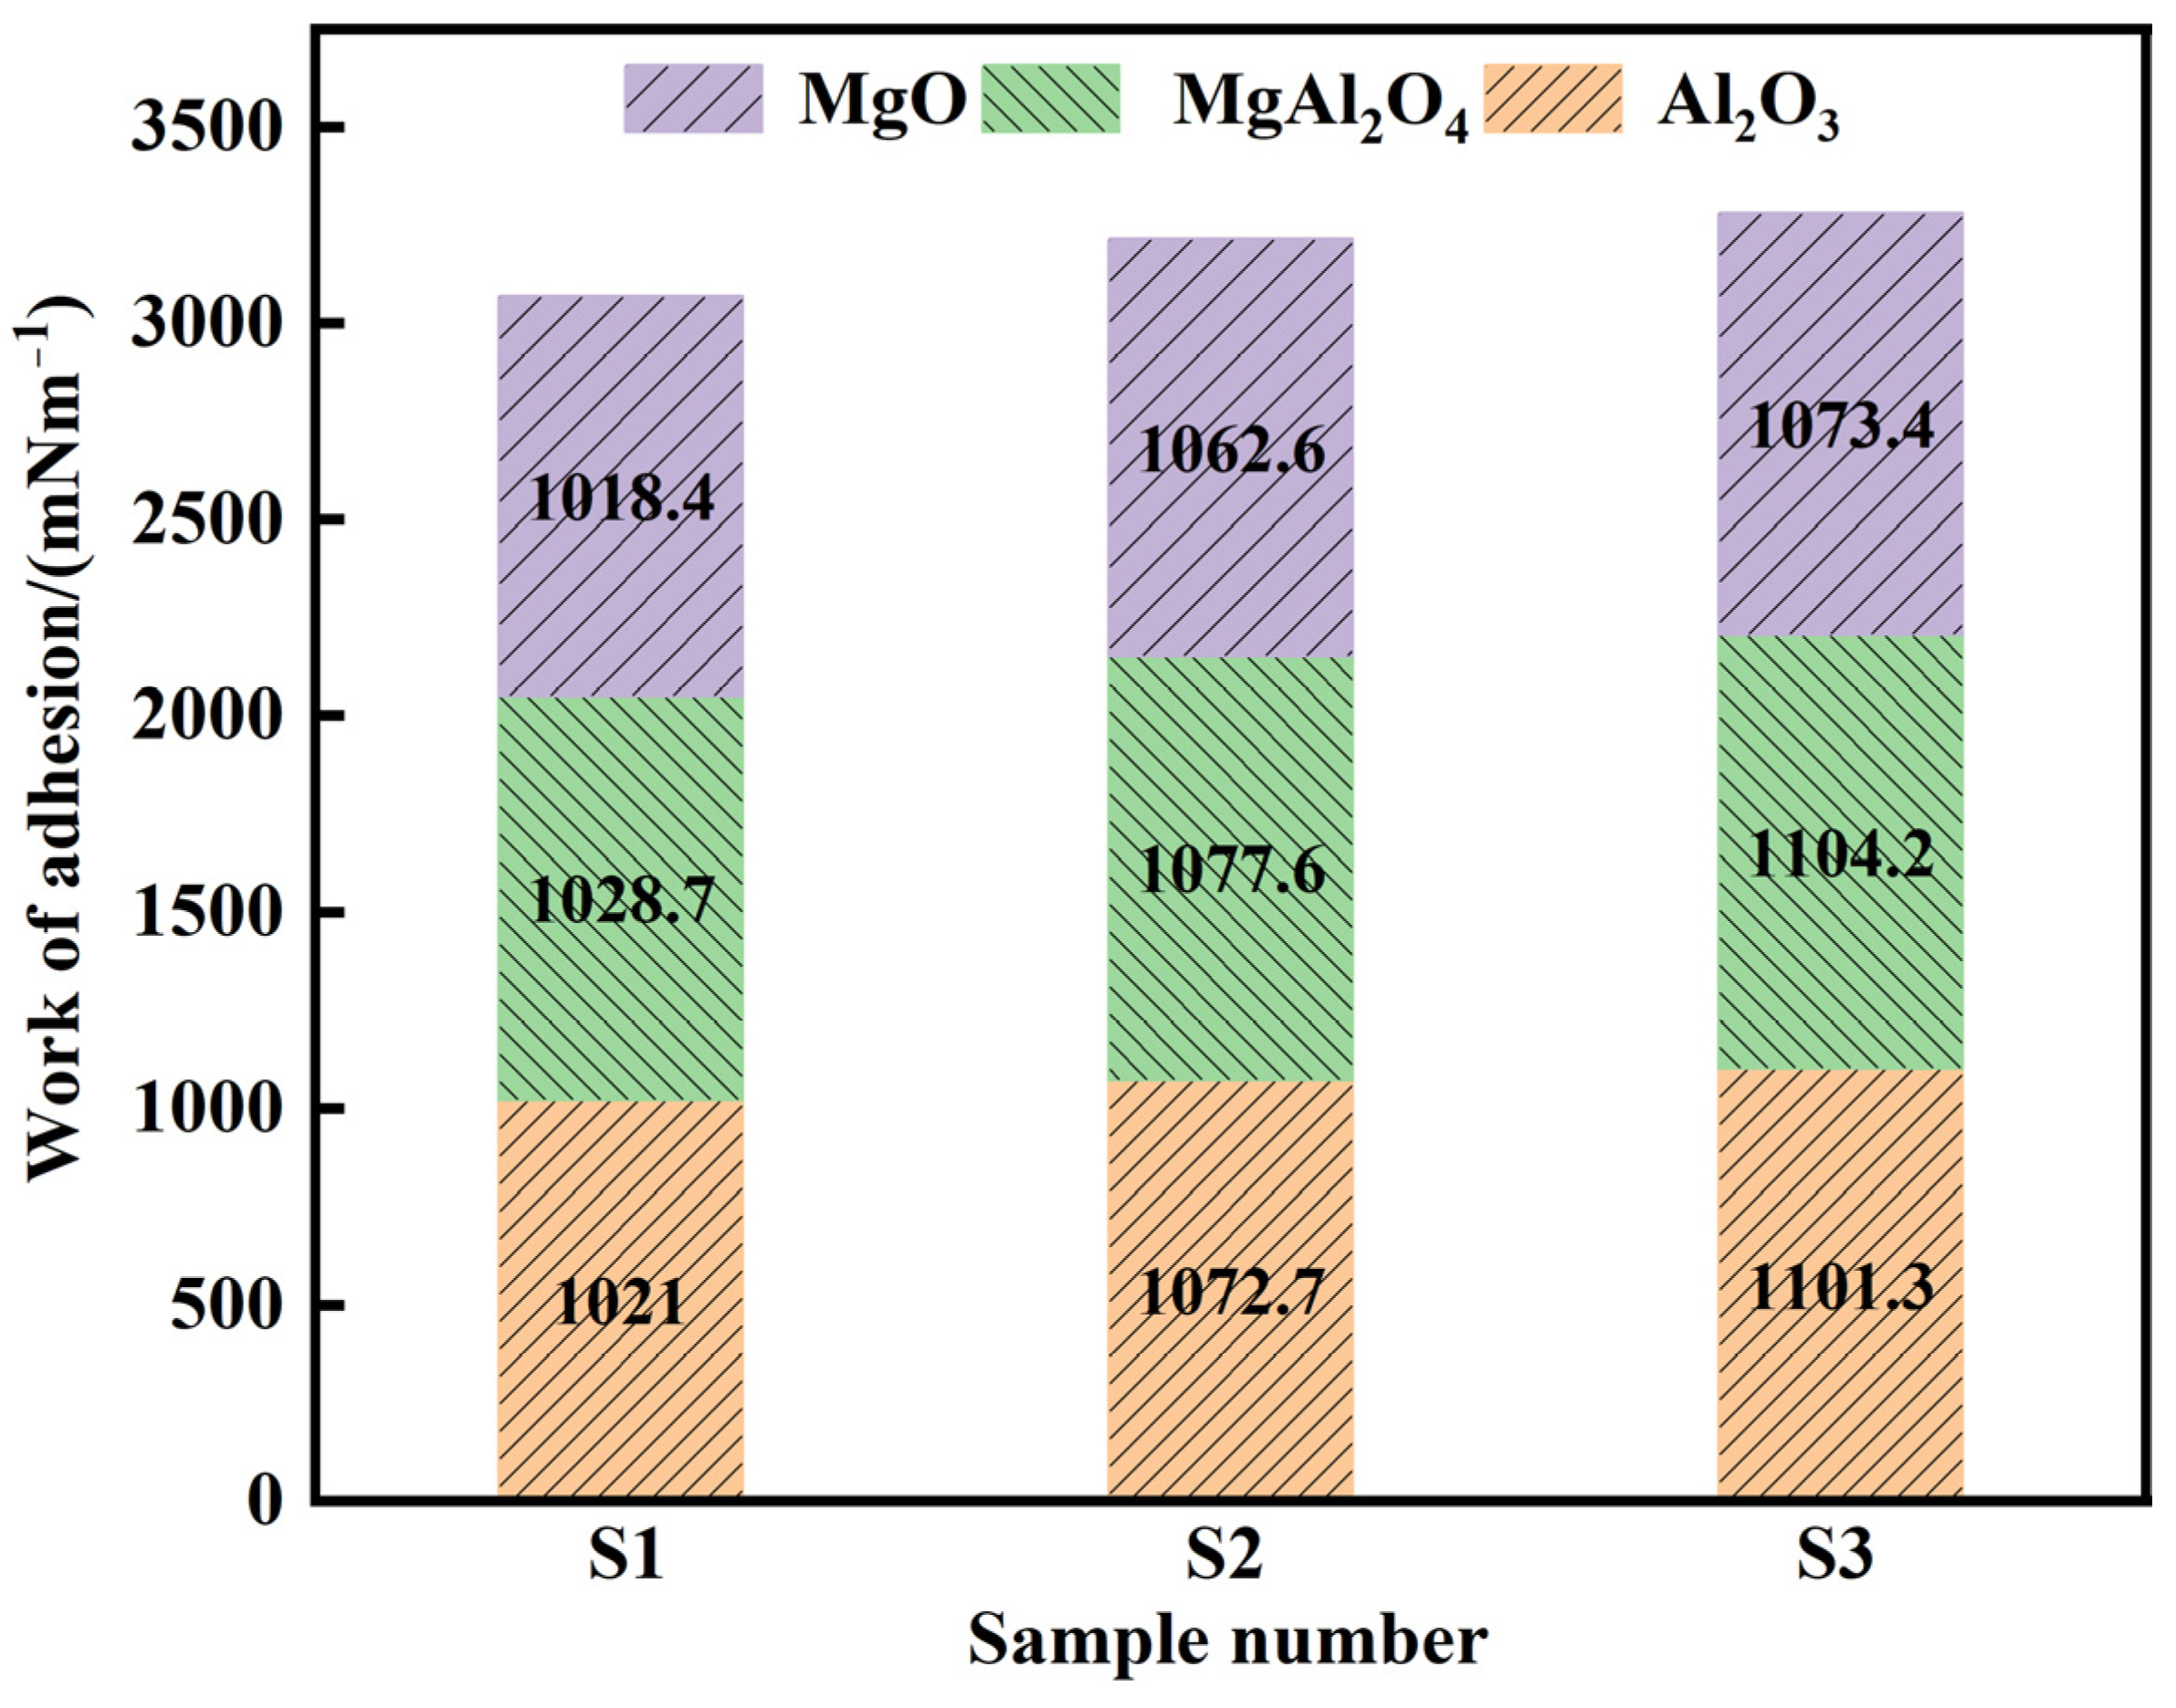
The equilibrium reaction with S1–S3 slags reduced the dissolved oxygen content in molten steel to less than 10 × 10−6. As shown in Figure 7, various refining slags had different adsorption effects on the Al2O3, MgAl2O4, and MgO inclusions. The slag with the highest alkalinity, S3, had the optimum adsorption capacity for these inclusions. In this study, the adhesion work W was used to evaluate the relative removal effect of refining slag on the Al2O3, MgAl2O4, and MgO inclusions in steel. By measuring the surface tension and contact angle of the molten metal, the adhesion work could be determined, that is, using the Young-Dupré equation [14,27], as shown in Equation (1) [28]:
where W is the adhesion work, is the surface tension of the refining slag, and is the contact angle between slag and substrate. The value of the slag was obtained using the National Physical Laboratory (NPL) slag model [2], and the slag composition after the reaction is presented in Table 4. The NPL model used to calculate is founded on the partial molar surface tension of the slag composition, as determined using Equation (2).
Here and represent the mole percentage and partial molar surface tension of the slag, respectively. Table 5 presents the surface tensions of each slag component [15,29]. The contact angles between slags of various basicities and the Al2O3, MgAl2O4, and MgO substrates were measured using the test method and are shown in Table 6 [30]. A larger W value indicates stronger bonding between the slag and the Al2O3, MgAl2O4, and MgO inclusions. Figure 10 shows the calculations of the adhesion work between the Al2O3, MgAl2O4, and MgO inclusions in various refining slags. The results show that under the same conditions, the adhesion work of slag S3 to Al2O3, MgAl2O4, and MgO inclusions was the largest at 1101.29, 1104.15, and 1073.41 mN·m−1, respectively, which is why S3 slag had a better adsorption effect on inclusions (Figure 7). Additionally, the adhesion work showed the trend WMgAl2O4 > W Al2O3 > WMgO for the inclusions of Al2O3, MgAl2O4, and MgO, and the removal efficiency was the highest in these inclusions.

Table 5.
Surface tension of each component in slag systems.

Table 6.
Contact angles between various substrates and slags at 1600 °C.
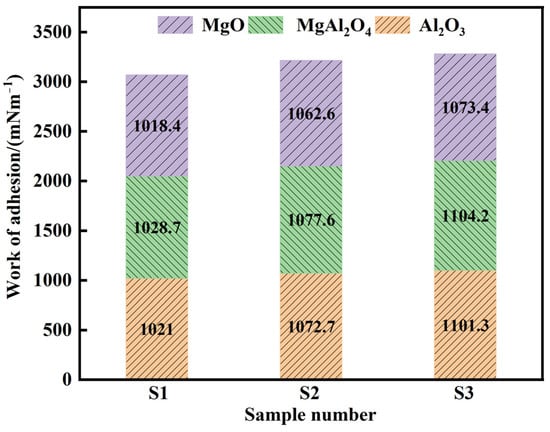
Figure 10.
Adhesion work between the Al2O3, MgAl2O4, and MgO inclusions in various refining slags.
3.3. Impact of Slag Composition on Molten Steel Inclusions
Duan et al. [31,32,33] calculated the activity of components in CaF2-CaO-Al2O3-B2O3-SiO2 slag system by IMCT model and FactSage thermodynamic software, respectively. The calculated activity coefficient of B2O3 in the slag at 1600 °C is γB2O3 = 4.79 × 10⁻⁴ by employing the IMCT model, which is much higher than that calculated by thermodynamic software. Peng et al. [34] reported that the γB2O3 = 2.45 × 10⁻⁴ in the CaF2-CaO-Al2O3-B2O3-SiO2 slag at 1600 °C using the agglomerated electron phase model. By comparing the activity coefficient of B2O3 calculated by different authors, the calculated γB2O3 by the IMCT model and the agglomerated electron phase model have the same order of magnitude. The value γB2O3 determined by Peng et al. is slightly lower than the result calculated by the IMCT model, which is likely due to the presence of MgO content reducing the activity coefficient of B2O3 in the 1600 °C slag. Duan et al. [35] passed the accuracy of the calculated activity of TiO2 in the CaF2–CaO–Al2O3–TiO2(–MgO) slags and that of Ce2O3 in the CaF2–CaO–Al2O3–MgO–Ce2O3 slag by the IMCT model has been proved by the slag-metal experimental results. Meanwhile, although the calculated activity of B2O3 in the CaF2–CaO–Al2O3–B2O3–SiO2 slag by the IMCT model is higher than that by the thermodynamic calculation software at 1600 °C due to the experimental measurement of the activity of B2O3 in the slag is rarely reported, the calculated γB2O3 = 4.79 × 10⁻⁴ by the IMCT model at 1600 °C is also testified by the slag-metal experimental results. These results imply that the IMCT model can be reliably applied to calculate the activity of components in slag. Therefore, it is ideal to use IMCT to calculate the slag melt containing CaF2.
According to Nikolopoulos et al. [36], 21 complex molecules exist in the CaO-CaF2-MgO-Al2O3-SiO2 slag system. Table 7 shows the expressions for each structural unit, mole number, and mass action concentration in the slag.

Table 7.
CaO-MgO-SiO2-Al2O3-CaF2 slags based on IMCT: expression of structural units as ion couplings or complex molecules, their mole numbers, and mass action concentrations.
Table 8 displays the reaction equations for the formation of various complex molecules in the slag system, standard Gibbs free energies, and mass action concentration expressions [37,38].

Table 8.
Potential complex molecular reaction formulae in CaO-MgO-SiO2-Al2O3-CaF2 slags.
According to the law of conservation of mass, the sum of the mass action concentrations of all structural units is 1, which can be expressed according to
The molar number of the five components in the slag is given by Equations (4)–(8).
Based on Equations (3)–(8), the mass action concentration of each component of the slag, that is, the bulk activity, can be obtained using MATLAB R2021b software. The surface phase activity of the slag component satisfies the coexistence theory, that is, the sum of the surface phase activities of all structural units is 1, as demonstrated in Equation (9).
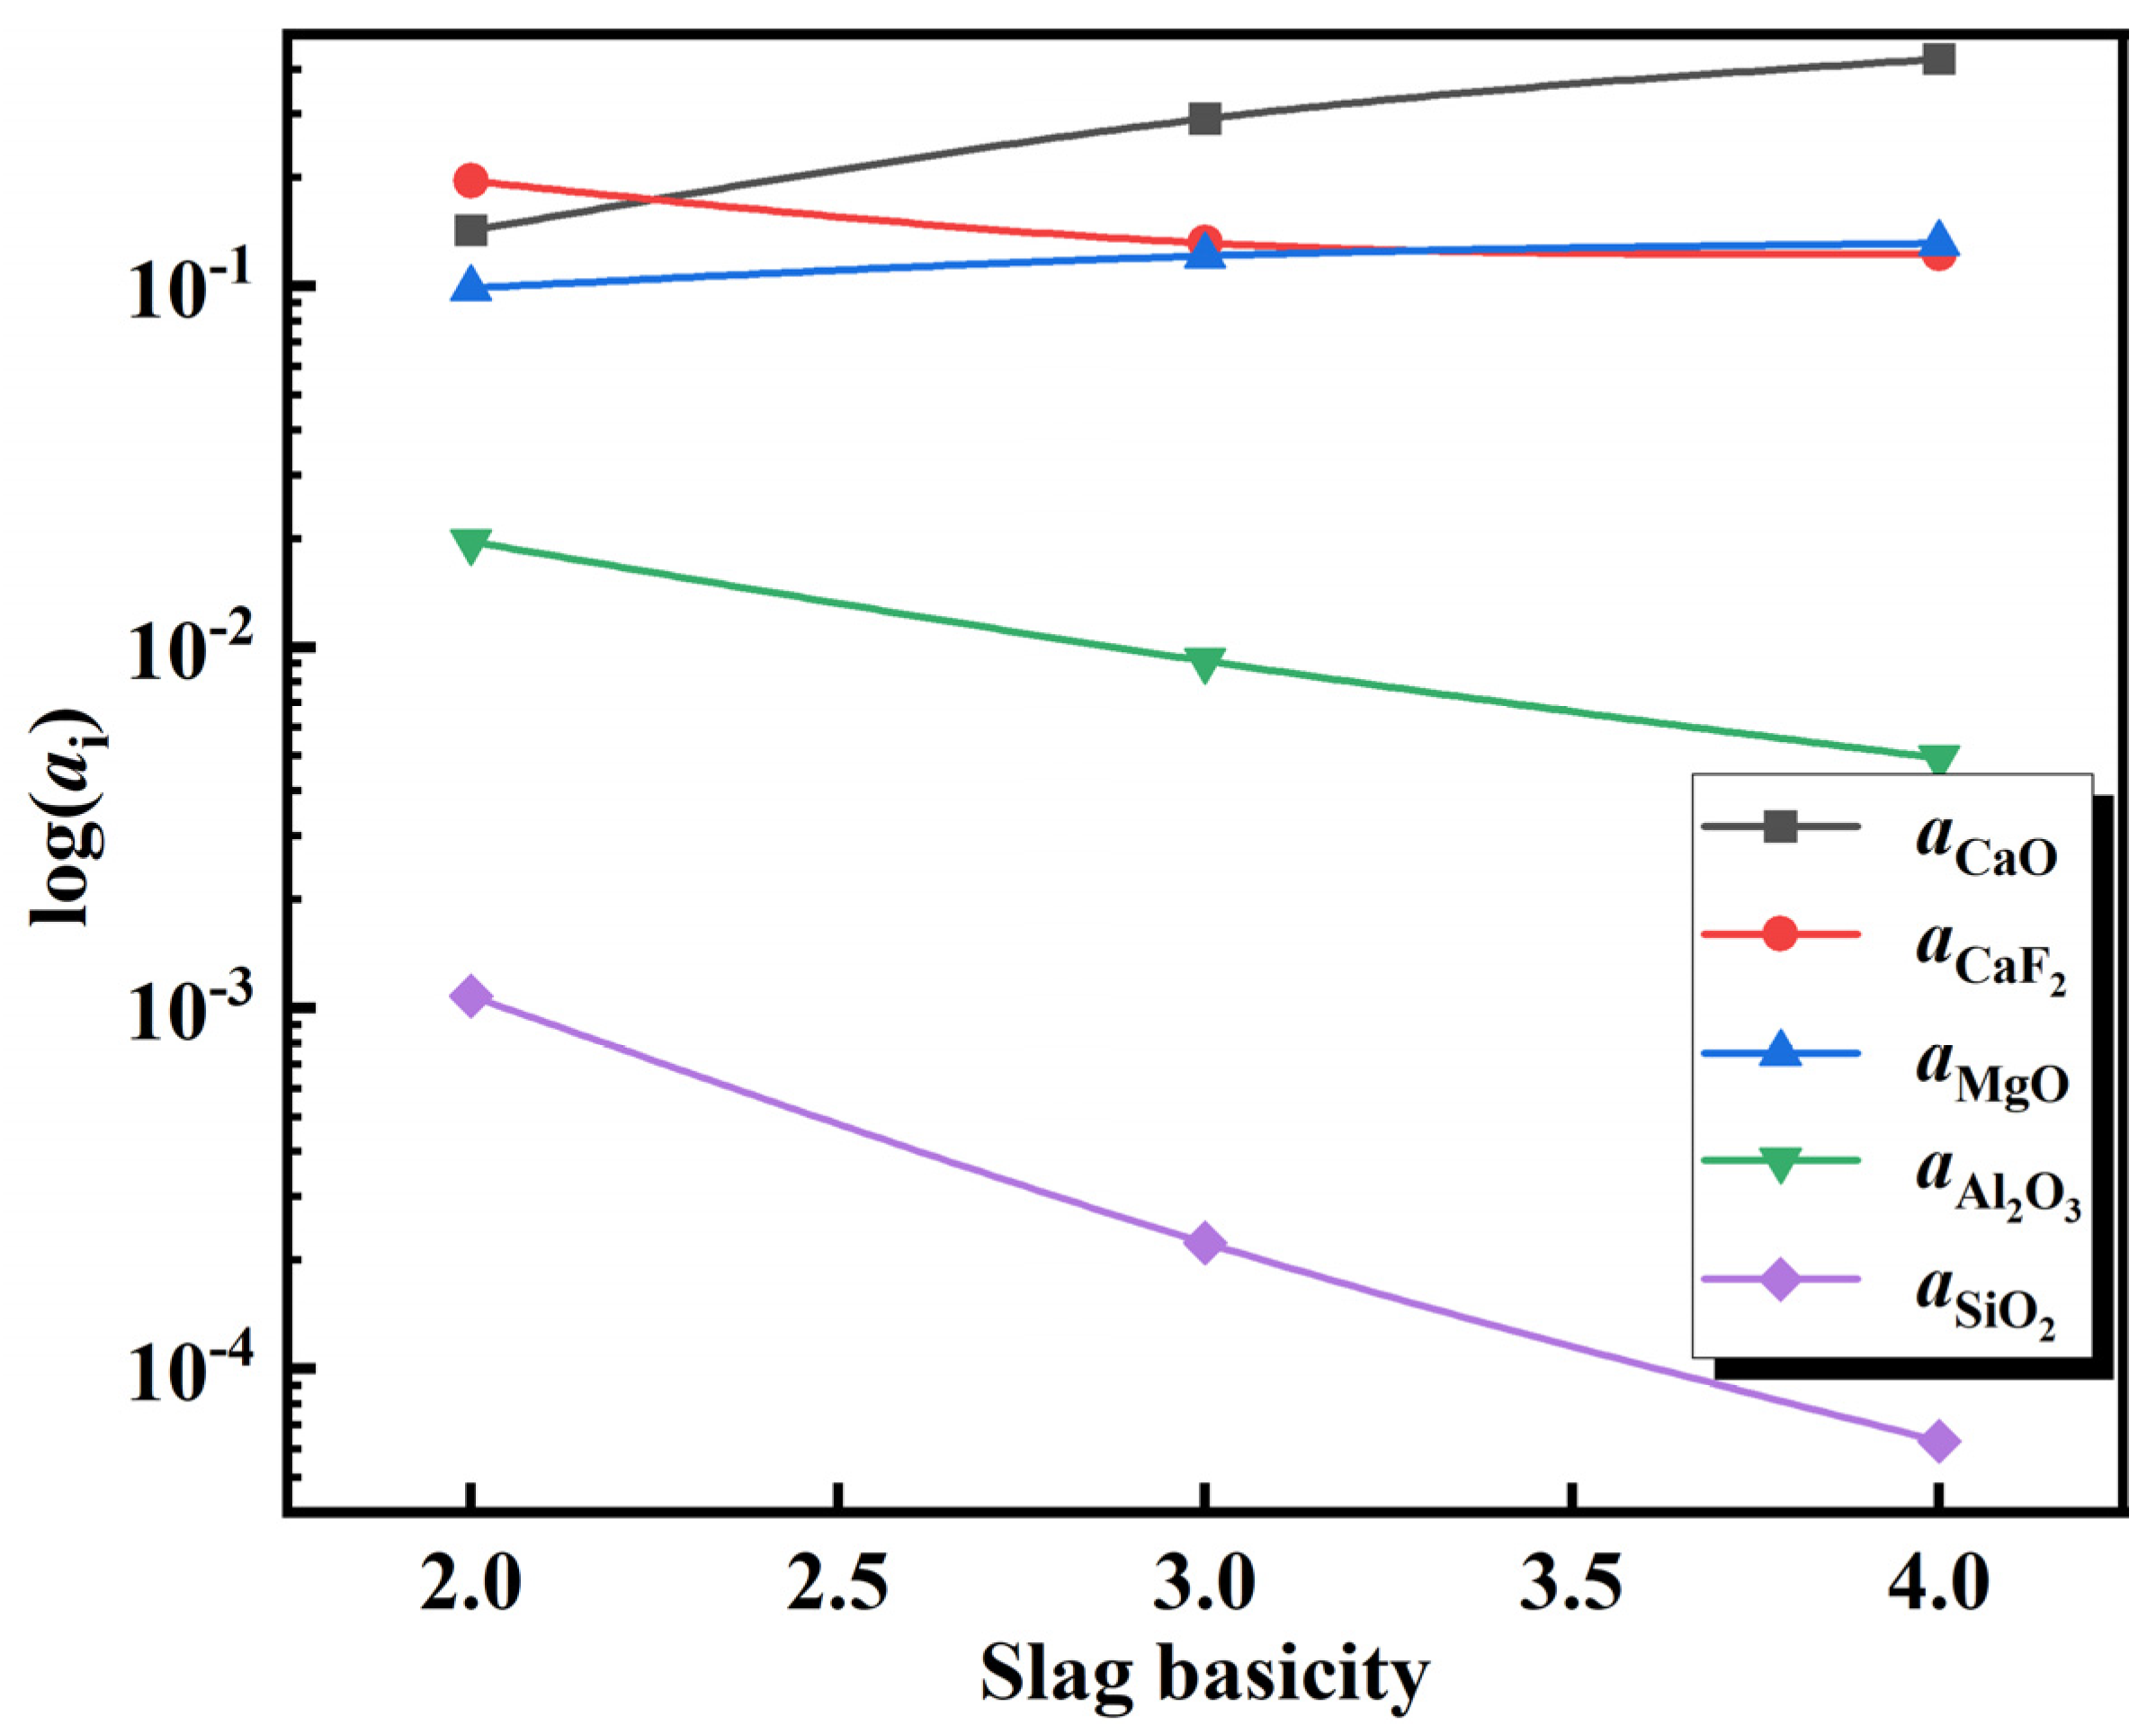
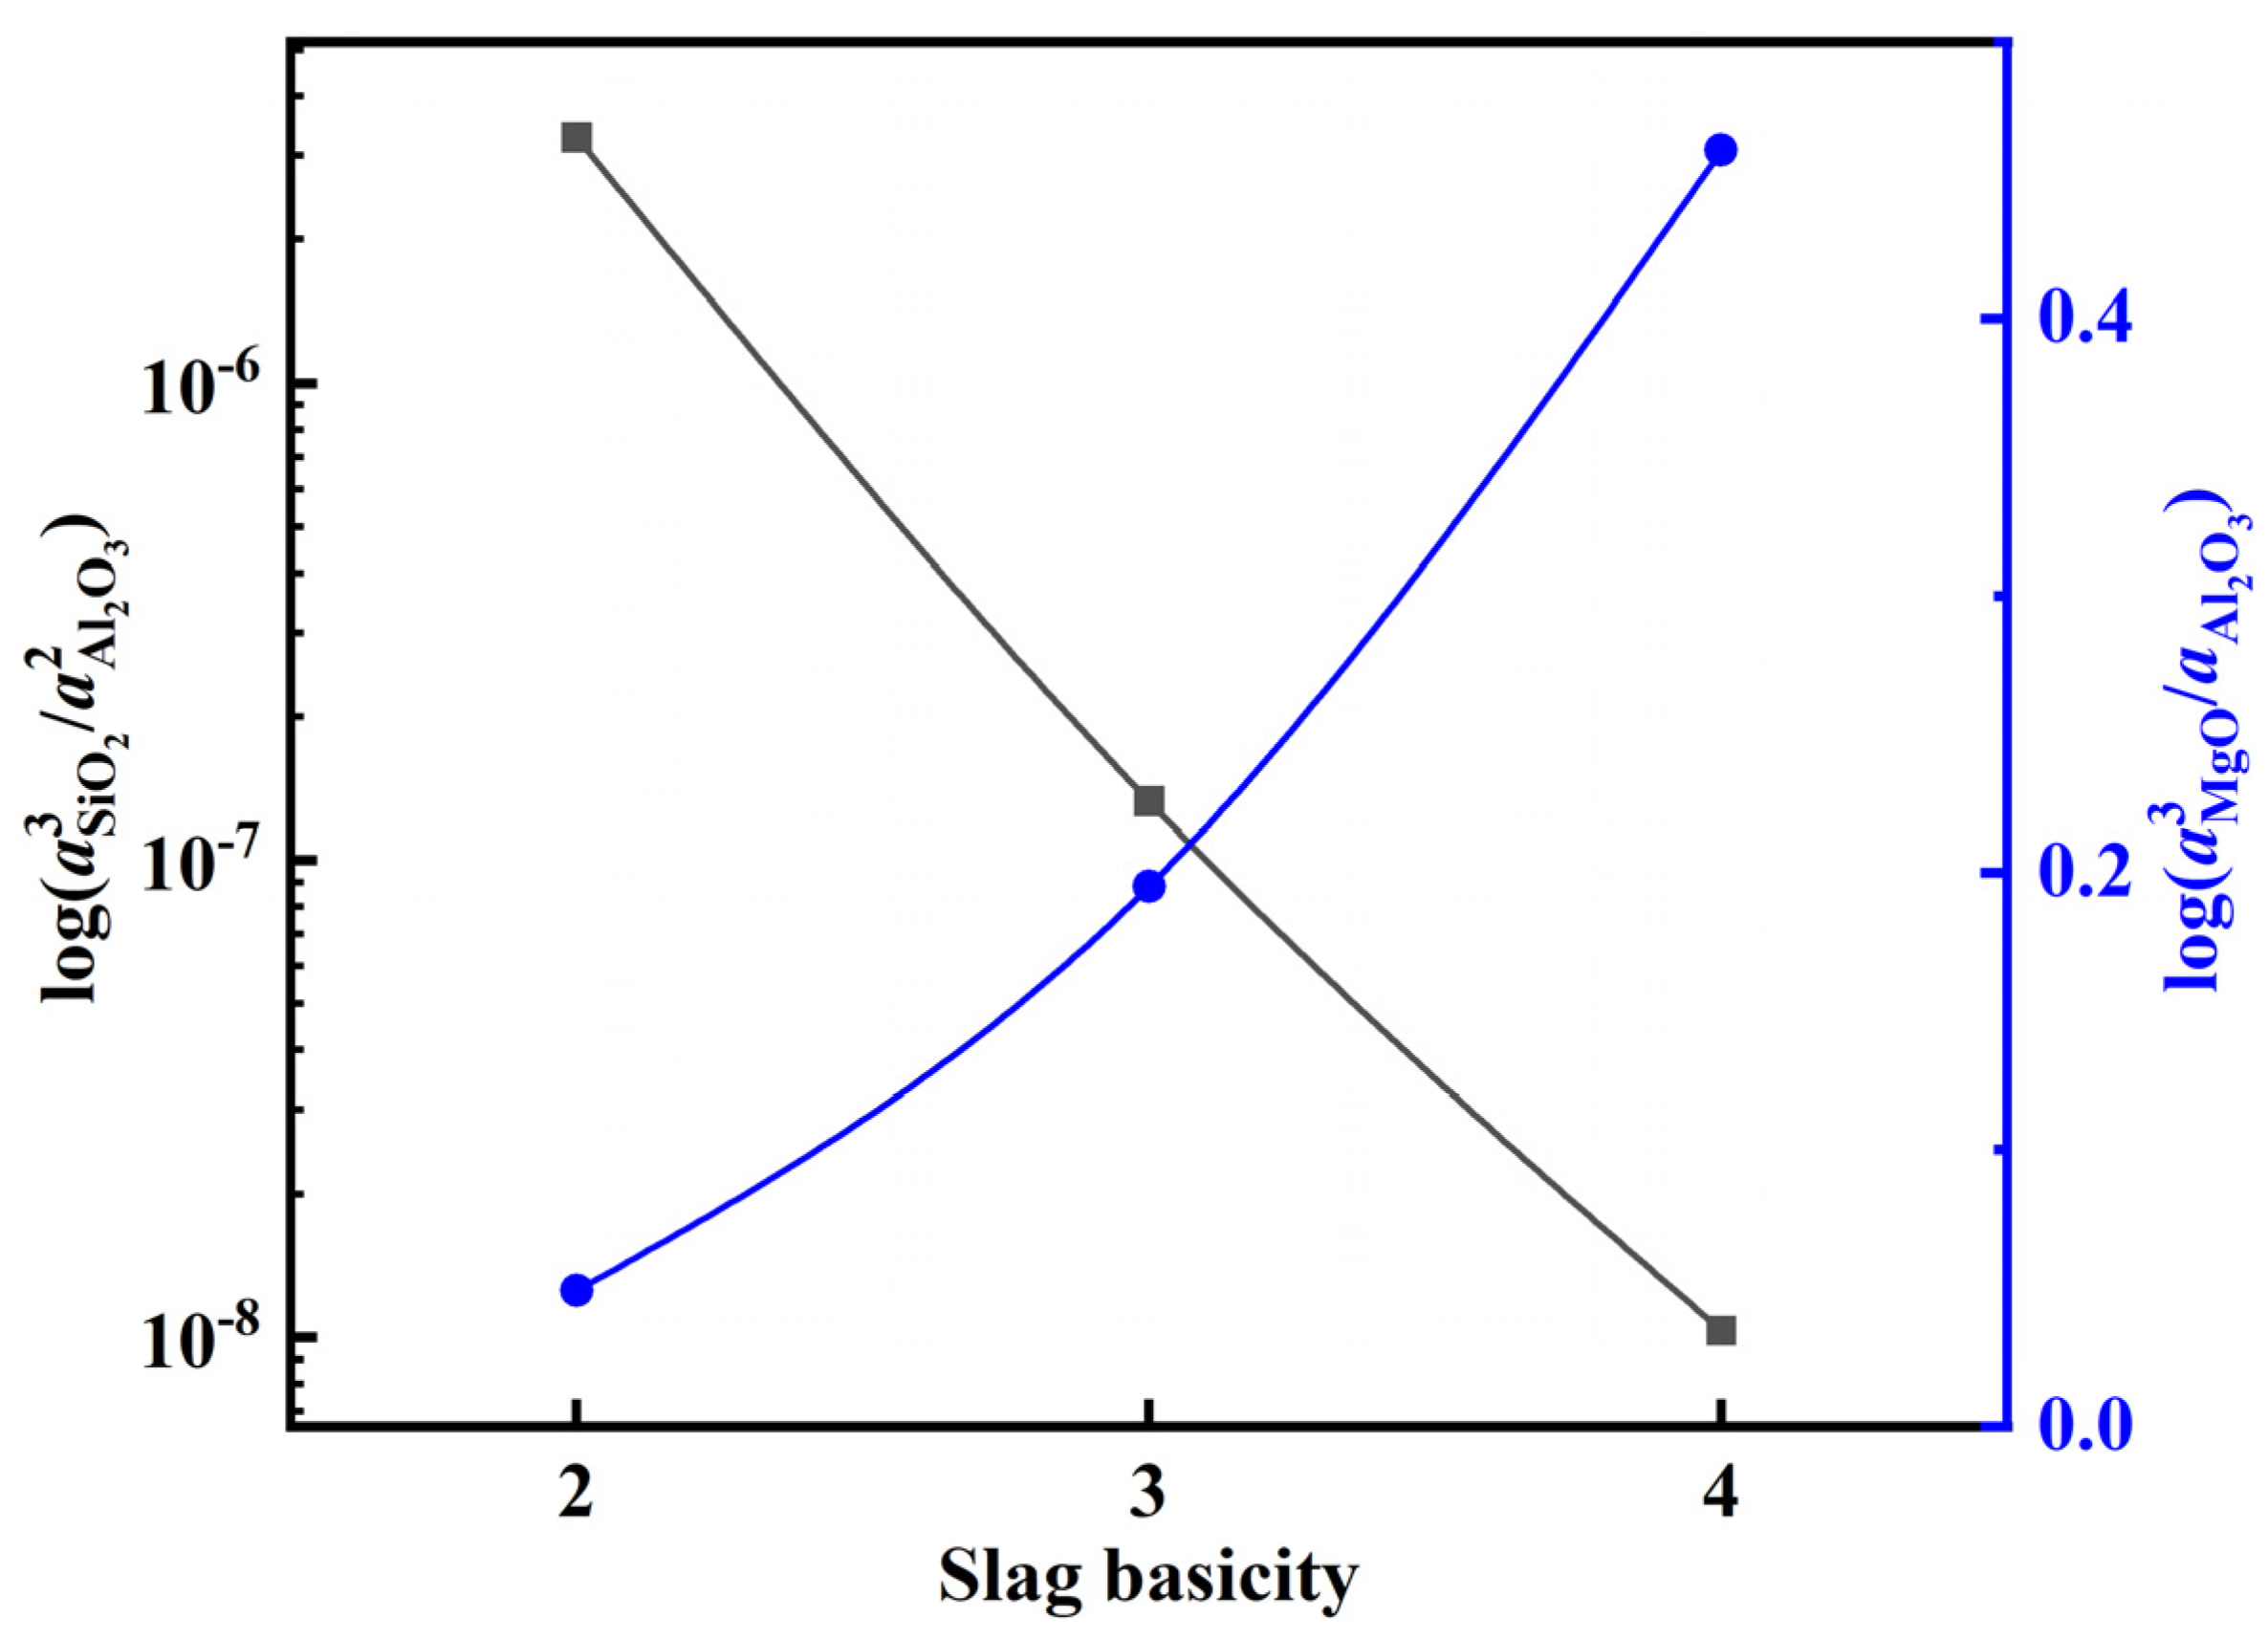
After adding the deoxidation alloy during the refining of 15-5PH stainless steel, the Al in the molten steel reacts with oxide components in the slag, resulting in the continuous loss of Al via burning. Typically, SiO2 and MgO in Al-deoxidized stainless steel refining slag react with Al in molten steel, as shown in Equations (10) and (13). These reactions are the main causes of aluminum burning in the molten steel. According to the theoretical model of slag coexistence, NSiO2, NAl2O3, and NMgO can be used to represent the activities of the slag components aSiO2, aAl2O3, and aMgO, respectively in Equations (12) and (14). The activity of each component in the slag at 1600 °C was calculated using the coexistence theory of the five-component slag established above. Accordingly, the activity changes of CaF2, Al2O3, and MgO at various slag basicities were calculated, and the results are shown in Figure 11. The calculation results show that with an increase in slag basicity, the activity of the CaF2 and Al2O3 components in the slag gradually decreases, whereas the activity of MgO increases. Furthermore, the variation in log () and log () with the increase in slag basicity can be extrapolated from Figure 11 (Figure 12). With an increase in slag basicity, log () decreases. According to Equation (12), the decrease in log () results in a higher Si content and lower Al content in molten steel, which increases the burning loss of Al and destroys the “slag-steel” balance, thus affecting the cleanliness of molten steel. With an increase in the slag basicity content, log() increases. According to Equation (15), an increase in log () can increase the Mg content in molten steel and lower the Al content. After 90 min of reaction between the molten steel and slag, the experimental findings reveal that the steel sample A1 with the greatest Mg content was obtained from the slag sample SA1 with the lowest slag basicity. The Mg concentration in steel sample A1 reached 12 ppm at this point.
4[Al] + 3(SiO2) = 3[Si] + 2(Al2O3)
2[Al] + 3(MgO) = 3[Mg] + (Al2O3)
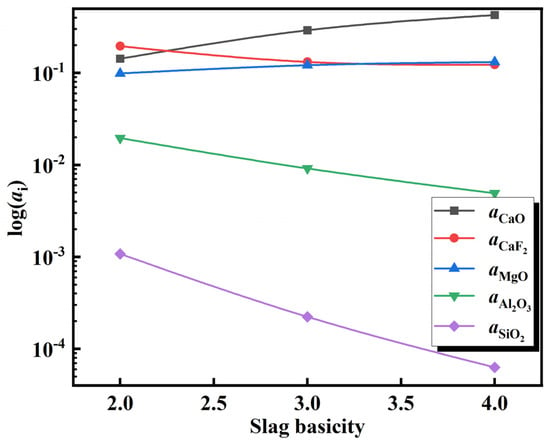
Figure 11.
Relationship of activity with slag basicity.
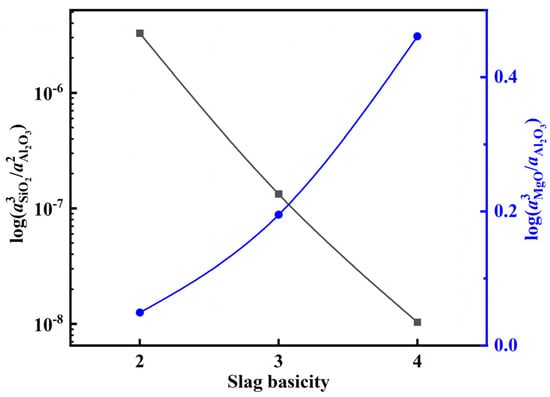
Figure 12.
Dependence of log () and log () on slag basicity.
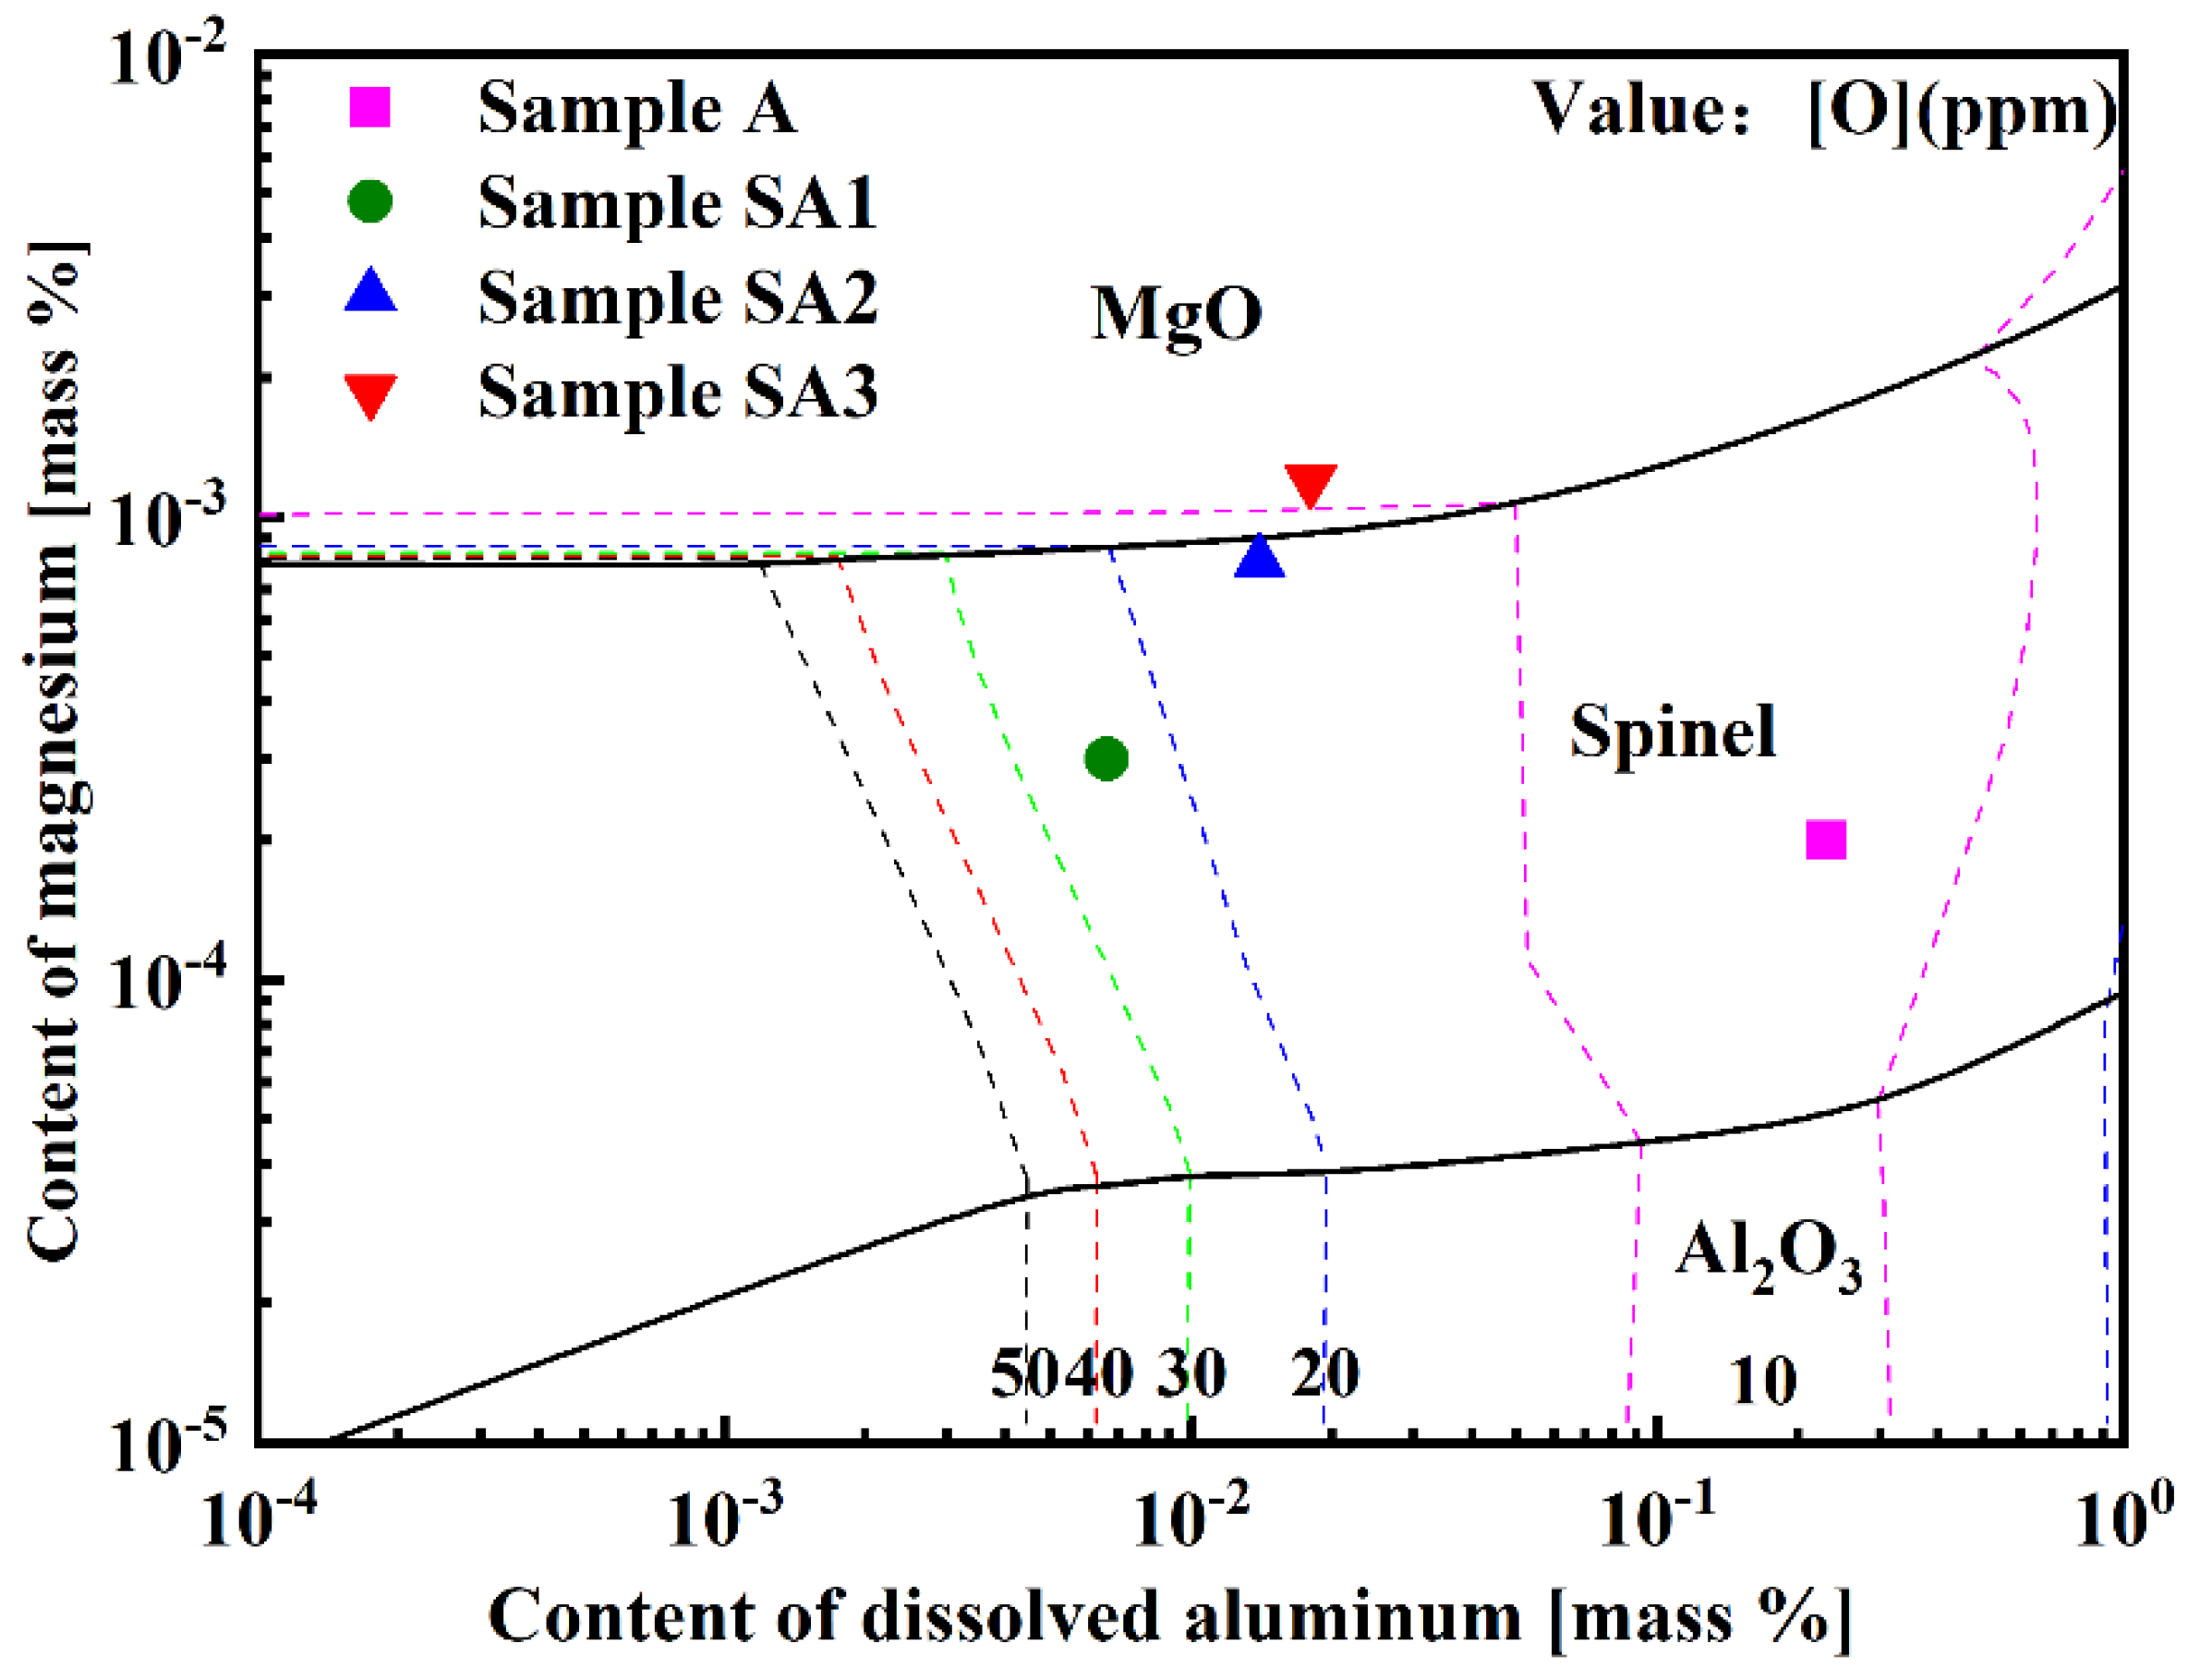
The production of inclusions in steel is substantially affected by the increase in the Mg concentration in molten steel. Using FactSageTM 8.2 software, the Al-Mg stable phase diagram of 15-5PH stainless steel at 1600 °C was predicted (Figure 13). The transition sequence of oxide inclusions changed from Al2O3 → MgAl2O4 → MgO when the Mg level in molten steel increased from 2 to 12 ppm. Figure 13 shows the Mg content of the experimental steel samples. The composition of Samples A1 and A2 was in the spinel phase, whereas the composition of Sample A3 was in the MgO phase, as shown in Figure 13. The experimental results were in strong agreement with the calculated results.
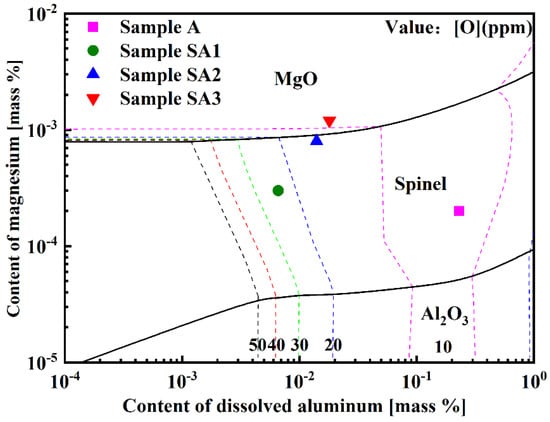
Figure 13.
Al-Mg stable phase diagram of 15-5PH stainless steel at 1600 °C.
3.4. Evolution Mechanism of the Inclusions in Steel
Figure 14 depicts the evolution mechanism of the reaction between oxide inclusions in 15-5PH stainless steel and CaO-MgO-SiO2-Al2O3-CaF2 slag with various basicities. This mechanism was determined via experimental findings and thermodynamic analysis.
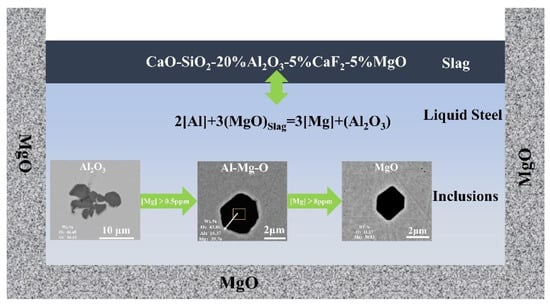
Figure 14.
The CaO-MgO-SiO2-Al2O3-CaF2 slag and inclusion reaction evolution mechanism in 15-5PH stainless steel.
The basicity of the slag affects the Al and Si contents in the molten steel. According to thermodynamic analysis, an extremely low basicity increases the Si content in molten steel as the increase in slag basicity reduces log () in the slag. The experimental results showed that the Si concentration in the lowest basicity steel, Sample A1, is 0.58%, which is consistent with the thermodynamic analysis. Furthermore, the Si content in the molten steel is the highest among all the samples, which reduces the purity of the molten steel and increases the loss of aluminum via burning.
The composition of the inclusions in molten steel is considerably influenced by the slag basicity. With an increase in slag basicity, log () increases; therefore, the Mg content in molten steel increases. The Mg content of the steel sample reacting with the high-basicity slag was higher, which agrees with the thermodynamic analysis. The development of MgO-Al2O3 inclusions in molten steel was shown to be influenced by Mg concentration, according to thermodynamic calculations. With an increase in the Mg content in the molten steel, the spinel phase (MgAl2O4) inclusions transformed into the MgO phase, increasing the MgO content in the inclusions. This is consistent with the results of Li et al. [33]. When the slag basicity increased from 2 in Sample S1 to 4 in Sample S3, the Mg content in the molten steel increased from 3 ppm in Sample A1 to 12 ppm in Sample A3. All inclusions in the steel changed to MgO. After the slag/metal reaction, the increase in the slag basicity causes an increase in the Mg content in the molten steel, which increases the MgO content in the inclusions in the steel until they are completely converted to MgO.
4. Conclusions
In this investigation, the slag/metal reaction at 1600 °C was used to examine the influence of the CaO-MgO-SiO2-Al2O3-CaF2 slag composition on the development of inclusions in 15-5PH stainless steel. The following conclusions were reached based on the experimental findings and thermodynamic analysis:
(1) The Si concentration is greater in the samples of slag steel with the lowest basicity. According to the thermodynamic findings based on IMCT, an increase in slag basicity lowers log () in the slag, increasing the Al yield of the steel. Si concentration is highest in steel Sample A3, which has the lowest basicity slag.
(2) The Mg content in molten steel is significantly affected by slag basicity. With an increase in slag basicity, log () decreases, and the Mg content in molten steel increases. Steel sample A3, with a slag basicity of 4 had a Mg content of 12 ppm, which was significantly higher than the A1 steel sample with a slag basicity of 2. As the content of Mg in the steel increases, the transitional order of oxide clamps is Al2O3 → MgAl2O4 → MgO.
(3) The order of the adhesion work of inclusions in molten steel is WMgAl2O4 > WAl2O3 > WMgO. The increase in slag basicity increases the adhesion work of slag to inclusions and forms inclusion types that are easier to remove, thus increasing the purity of molten steel.
Author Contributions
Conceptualization and writing, Z.Z.; original draft preparation, Z.Z. and Y.Z.; methodology and formal analysis, Z.Z., T.Q., G.W., Y.Z., R.S. and G.C.; validation and formal analysis, Z.Z., Y.Z. and G.C.; supervision, Z.Z. and Y.Z. All authors have read and agreed to the published version of the manuscript.
Funding
This study was supported by the National Natural Science Foundation of China (U1960201) and the National Key R&D Program of China (2019YFC1905701).
Data Availability Statement
Not applicable.
Conflicts of Interest
The authors declare no conflict of interest.
References
- Zhang, H.; Peng, Y.; Zhang, S.; Liu, C.; Cheng, R.; Ni, H. Effects of refining slag on transformation and removal of inclusions in type 430 stainless steel. Met. Mater. Trans. B 2022, 53, 702–715. [Google Scholar] [CrossRef]
- Peng, Y.; Liu, C.; Yang, L.; Hou, S.; Cheng, R.; Zhang, H.; Ni, H. Improving cleanliness of 30Cr2Ni4MoV low-pressure rotor steel by CaO–SiO2–MgO–Al2O3 slag refining. J. Iron Steel Res. 2022, 29, 1434–1445. [Google Scholar] [CrossRef]
- Sasai, K. Kinetics on formation, growth and removal of alumina inclusions in molten steel. Tetsu-to-Hagane 2021, 107, 785–795. [Google Scholar] [CrossRef]
- Jiang, M.; Li, K.; Wang, R.; Yang, E.; Wang, X. Cleanliness and control of inclusions in Al-deoxidized bearing steel refined by basic slags during LF-VD-Ar Bubbling. ISIJ Int. 2021, 62, 124–132. [Google Scholar] [CrossRef]
- Jiang, M.; Wang, X.; Chen, B.; Wang, W. Formation of MgO-Al2O3 inclusions in high strength alloyed structural steel refined by CaO-SiO2-Al2O3-MgO Slag. ISIJ Int. 2008, 48, 885–890. [Google Scholar] [CrossRef]
- Park, J.H.; Kang, Y. Inclusions in stainless steels—A review. Steel Res. Int. 2017, 88, 1700130. [Google Scholar] [CrossRef]
- Park, J.S.; Park, J.H. Effect of physicochemical properties of slag and flux on the removal rate of oxide inclusion from molten steel. Met. Mater. Trans. B 2016, 47, 3225–3230. [Google Scholar] [CrossRef]
- Hu, Y.; Chen, W. Influence of refining slag composition on cleanness and fatigue life of 60Si2MnA spring steel. Ironmak. Steelmak. 2016, 43, 340–350. [Google Scholar] [CrossRef]
- Li, M. Study on Cleanliness of Shougang Cord Steel; University of Science and Technology Beijing: Beijing, China, 2006. [Google Scholar]
- Yoon, B.; Heo, K.; Kim, J. Improvement of steel cleanliness by controlling slag composition. Ironmak. Steelmak. 2002, 29, 215–218. [Google Scholar] [CrossRef]
- Park, J.H.; Jung, I.H.; Lee, H.G. Dissolution behavior of Al2O3 and MgO inclusions in the CaO–Al2O3–SiO2 slags: Formation of ring-like structure of MgAl2O4 and Ca2SiO4 around MgO inclusions. ISIJ Int. 2006, 46, 1626–1634. [Google Scholar] [CrossRef]
- Valdez, M.; Shannon, G.S.; Sridhar, S. The ability of slags to absorb solid oxide inclusions. ISIJ Int. 2006, 46, 450–457. [Google Scholar] [CrossRef]
- Lee, S.; Tse, C.; Yi, K.W.; Misra, P.; Chevrier, V.; Orrling, C.; Sridhar, S.; Cramb, A.W. Separation and dissolution of Al2O3 inclusions at slag/metal interfaces. J. Non-Cryst. Solids 2001, 282, 41–48. [Google Scholar] [CrossRef]
- Ni, P.; Goto, H.; Nakamoto, M.; Tanaka, T. Neural network modelling on contact angles of liquid metals and oxide ceramics. ISIJ Int. 2020, 60, 1586–1595. [Google Scholar] [CrossRef]
- Mills, K.; Karagadde, S.; Lee, P.; Yuan, L.; Shahbazian, F. Calculation of physical properties for use in models of continuous casting process-Part 1: Mould slags. ISIJ Int. 2016, 56, 264–273. [Google Scholar] [CrossRef]
- Abdeyazdan, H.; Dogan, N.; Rhamdhani, M.; Chapman, M.; Monaghan, B. Dynamic wetting of CaO-Al2O3-SiO2-MgO liquid oxide on MgAl2O4 spinel. Met. Mater. Trans. B 2014, 46, 208–219. [Google Scholar] [CrossRef]
- Furukawa, T.; Saito, N.; Nakashima, K. Evaluation of interfacial energy between molten Fe and Fe-18%Cr-9%Ni alloy and non-metallic inclusion-type oxides. ISIJ Int. 2021, 61, 2381–2390. [Google Scholar] [CrossRef]
- Reis, B.H.; Bielefeldt, W.V.; Vilela, A.C.F. Absorption of non-metallic inclusions by steelmaking slags—A review. J. Mater. Res. Technol. 2014, 3, 179–185. [Google Scholar] [CrossRef]
- Todoroki, H.; Mizuno, K. Effect of silica in slag on inclusion compositions in 304 stainless steel deoxidized with aluminum. ISIJ Int. 2004, 44, 1350–1357. [Google Scholar] [CrossRef]
- Monaghan, B.; Chen, L.; Sorbe, J. Comparative study of oxide inclusion dissolution in CaO–SiO2–Al2O3 slag. Ironmak. Steelmak. 2013, 32, 258–264. [Google Scholar] [CrossRef]
- Ma, W.; Bao, Y.; Wang, M.; Zhao, D. Influence of slag composition on bearing steel cleanness. Ironmak. Steelmak. 2013, 41, 26–30. [Google Scholar] [CrossRef]
- Rocha, V.; Pereira, J.; Yoshioka, A.; Bielefeldt, W.; Vilela, A. Evaluation of secondary steelmaking slags and their relation with steel cleanliness. Met. Mater. Trans. B 2017, 48, 1423–1432. [Google Scholar] [CrossRef]
- He, X.; Wang, X.; Chen, S.; Jiang, M.; Huang, F.; Wang, W. Inclusion composition control in tyre cord steel by top slag refining. Ironmak. Steelmak. 2014, 41, 676–684. [Google Scholar] [CrossRef]
- Li, X.; Wang, L.; Yang, S.; Zhuang, C. Effect of slag composition on the cleanliness of drill rod steel. Ironmak. Steelmak. 2018, 46, 416–423. [Google Scholar] [CrossRef]
- Liu, C.; Gao, X.; Ueda, S.; Kitamura, S. Change in composition of inclusions through the reaction between Al-killed Steel and the slag of CaO and MgO saturation. ISIJ Int. 2019, 59, 268–276. [Google Scholar] [CrossRef]
- Mu, H.; Zhang, T.; Fruehan, R.; Webler, B. Reduction of CaO and MgO slag components by Al in Liquid Fe. Met. Mater. Trans. B 2018, 49, 1665–1674. [Google Scholar] [CrossRef]
- Yang, G.; Wang, X.; Huang, F.; Wang, W.; Yin, Y. Transient inclusion evolution during RH Degassing. Steel Res. Int. 2014, 85, 26–34. [Google Scholar] [CrossRef]
- Nakajima, K. Estimation of surface tension for multicomponent silicate Melts. Tetsu-to-Hagane 1994, 80, 599–604. [Google Scholar] [CrossRef]
- Nakajima, K. Estimation of interfacial tensions between phases in the molten iron-slag-inclusion (Alumina) system. Tetsu-to-Hagane 1994, 80, 383–388. [Google Scholar] [CrossRef]
- Gao, M.; Yu, H.; Cheng, G.; Zhang, Y. Experimental study on high temperature wetting behavior of molten metal/slag-oxide. Exp. Technol. Manag. 2022, 39, 5–11. [Google Scholar]
- Duan, S.; Lee, M.; Kim, D.; Park, J. Oxidation behavior of boron in 9CrMoCoB steel by CaF2-CaO-Al2O3-SiO2-B2O3 electroslag remelting (ESR) type slag. J. Mater. Res. Technol. 2022, 17, 574–585. [Google Scholar] [CrossRef]
- Zhang, J.; Wang, P. The widespread applicability of the mass action law to metallurgical melts and organic solutions. Calphad 2001, 25, 343–354. [Google Scholar] [CrossRef]
- Jiang, Z.; Hou, D.; Dong, Y.; Cao, Y.; Cao, H.; Gong, W. Effect of Slag on Titanium, Silicon, and Aluminum Contents in Superalloy During Electroslag Remelting. Met. Mater. Trans. B. 2016, 47, 1465–1474. [Google Scholar] [CrossRef]
- Peng, L.; Jiang, Z.; Geng, X. Design of ESR slag for Remelting 9CrMoCoB steel through experiments and thermodynamic calculations. Calphad 2020, 70, 342–351. [Google Scholar] [CrossRef]
- Duan, S.; Park, J. Comparison of Oxidation Behavior of Various Reactive Elements in Alloys during Electroslag Remelting (ESR) Process: An Overview. ISIJ Int. 2022, 62, 1561–1572. [Google Scholar] [CrossRef]
- Zouvelou, N.; Mantzouris, X.; Nikolopoulos, P. Interfacial energies in oxide/liquid metal systems with limited solubility. Int. J. Adhes. Adhes. 2007, 27, 380–386. [Google Scholar] [CrossRef]
- Li, J.; Cheng, G.; Ruan, Q.; Pan, J.; Chen, X. Formation and evolution of oxide inclusions in titanium-stabilized 18Cr stainless steel. ISIJ Int. 2018, 58, 2280–2287. [Google Scholar] [CrossRef]
- Li, J.; Cheng, G.; Ruan, Q.; Pan, J.; Chen, X. Effect of CaO-MgO-SiO2-Al2O3-TiO2 slags with different CaF2 contents on inclusions in Ti-stabilized 20Cr stainless steel. ISIJ Int. 2019, 59, 2013–2023. [Google Scholar] [CrossRef]
Disclaimer/Publisher’s Note: The statements, opinions and data contained in all publications are solely those of the individual author(s) and contributor(s) and not of MDPI and/or the editor(s). MDPI and/or the editor(s) disclaim responsibility for any injury to people or property resulting from any ideas, methods, instructions or products referred to in the content. |
© 2023 by the authors. Licensee MDPI, Basel, Switzerland. This article is an open access article distributed under the terms and conditions of the Creative Commons Attribution (CC BY) license (https://creativecommons.org/licenses/by/4.0/).

