Article

Formation Mechanism and Evolution of Plastic Damage in Billet during Reduction Pretreatment

National Engineering Research Center for Advanced Rolling and Intelligent Manufacturing, University of Science and Technology Beijing, Beijing 100083, China
*
Author to whom correspondence should be addressed.
Metals 2023, 13(4), 747; https://doi.org/10.3390/met13040747
Submission received: 19 March 2023 / Revised: 8 April 2023 / Accepted: 9 April 2023 / Published: 12 April 2023
(This article belongs to the Section Metal Casting, Forming and Heat Treatment)

Abstract

:
The formation mechanism and evolution of plastic damage in billet during reduction pretreatment were investigated using laboratory experiments and simulations. The microstructure and damage distribution were observed using reduction pretreatment experiments. Isothermal tension tests were designed to study the mechanism of damage under different deformation temperatures and strain rates. A plastic damage model based on tension tests was established to further analyze damage evolution during reduction pretreatment. Experimental results showed that the distribution of the damage was characterized by microvoids near the surface and microcracks along the grain boundary at the center. With the increase in strain rate, plastic damage above 1050 °C was transformed from grain boundary damage caused by grain boundary slip to inclusion damage caused by dislocation movement. The simulation results showed that the established plastic damage model was reliable and could be used to describe the plastic damage evolution during reduction pretreatment.

1. Introduction

Heavy plates are mainly applied to pipeline transportation, shipbuilding and hydropower stations. The solidification characteristics of large billets lead to uneven microstructure in the thickness direction, while, a large number of shrinkage porosities are formed at the center. Due to the limitation in the compression ratio, the uniform temperature-rolling technology has no obvious effect on eliminating center defects, which would seriously affect the mechanical properties of the finished product and reduce its service life [1,2]. The reduction pretreatment process following complete solidification [3,4,5,6,7,8] is a novel strategy for improving the quality of the center of the billet. During the process, the billet surface is maintained at 900 °C, while the core is maintained at 1300 °C; this typical temperature distribution can reduce resistance to central deformation. As a result, a small reduction can lead to considerable deformation of the center, alleviating porosities and refining center microstructure. However, deformation at the center should be controlled to within a reasonable range to prevent cracks. Until now, there have been few reports on crack formation mechanisms and how to effectively avoid cracks during the reduction pretreatment process.
Traditional hot rolling can lead to high plastic deformation of metal materials. Due to the differences in mechanical properties between non-metallic inclusions and the metal matrix, plastic damage will occur during separation of non-metallic inclusions from the metal matrix at a larger plastic deformation. Many researchers have studied the evolution of plastic damage [9,10]. The formation of plastic damage was generally considered the result of gradual formation and continuous expansion of microvoids, which undergo three main stages of damage: nucleation, growth and aggregation. Plastic deformation led to dislocation accumulation in the metal matrix, and the damage began to nucleate at the interface between non-metallic inclusions and the metal matrix [11]. As plastic deformation increased, there was increased damage, mainly due to the plastic flow at the tip of microvoids. As plastic deformation continued to increase, the microvoids converged into microcracks. Compared with traditional hot rolling, the deformation temperatures and strain rates during reduction pretreatment became more complicated, thus the mechanism of plastic damage at different positions on the billet needs to be investigated further.
In order to analyze the evolution of plastic damage nucleation and growth, it is vital to establish a plastic damage model that takes into account the interaction between different physical variables. Multiple models of plastic damage have been established based on different damage theories, including empirical model [12], micromechanics-based damage (MBD) model [13,14] and continuous damage mechanics (CDM) model [15,16]. The CDM model, which is based on continuous damage mechanics theory, combines the advantages of the empirical model and the MBD model, which has been the main model used in the development of damage theory for decades. In the CDM model, the microvoids damage in the material is taken as the average of the macroscopic continuous damage, and the damage factor is introduced into the model as a time-dependent variable to describe the evolution of plastic damage nucleation and growth. The effects of physical variables such as temperature, strain rate and microstructure on plastic damage are considered in the CDM model [17]. Therefore, the CDM model can be applied to identify the evolution of plastic damage during reduction pretreatment more objectively and accurately.
In this study, formation mechanism and evolution of plastic damage in billet during reduction pretreatment were investigated using laboratory experiments and simulations. First, the microstructure and damage distribution were observed using the reduction pretreatment experiment. Isothermal tension tests were then designed to study damage mechanisms under different temperatures and strain rates. Finally, a plastic damage model was established based on tension tests and used to further analyze the evolution of plastic damage during reduction pretreatment.

2. Materials and Experimental Methods

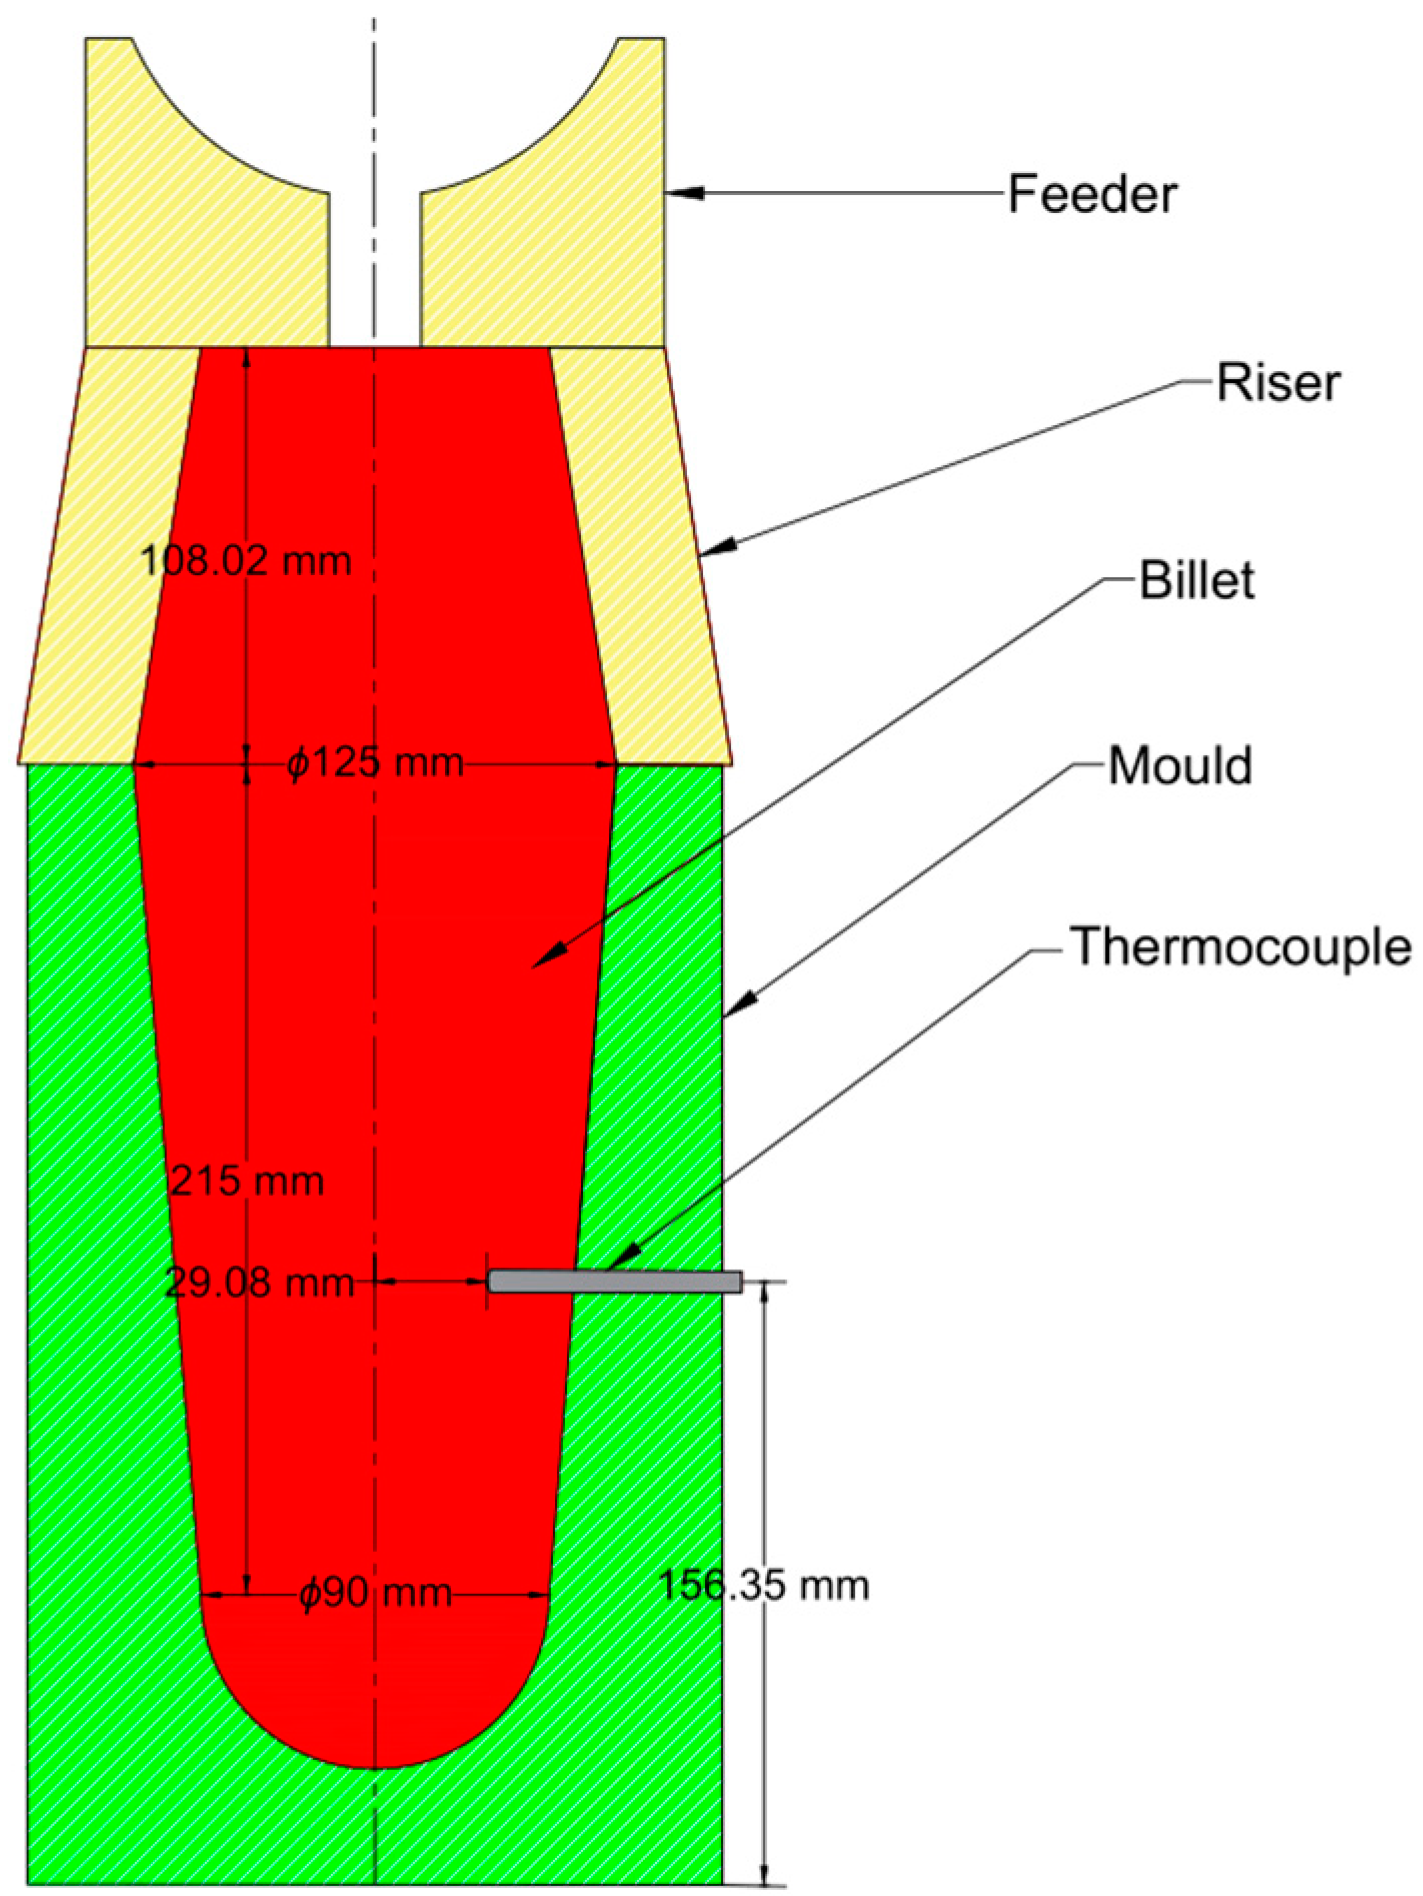
2.1. Materials and Experimental Procedure for Reduction Pretreatment

Two experimental billets (labeled Billet 1 and Billet 2) were prepared by casting. The steelmaking equipment was a vacuum induction furnace. Figure 1 shows the schematic diagram of the casting setup. The temperature change at the center of the billet was recorded using a thermocouple. After stripping, Billet 1 was cooled to room temperature with water without being rolled (as done for the control group). To simulate reduction pretreatment, Billet 2 was rolled when the temperature at the surface center point was cooled to 950 °C with water. The rolling schedule was characterized by a rolling speed of 0.36 m·s−1, a roller diameter of 330 mm, and a roll gap of 86 mm. After rolling, Billet 2 was cooled to room temperature with water. The chemical compositions of experimental billets were determined through chemical analysis. The results are listed in Table 1.
The schematic diagrams of the sampling process are shown in Figure 2. First, both experimental billets were sectioned in half in the rolling direction. For Billet 2 with reduction, three cubic specimens (P4, P5 and P6) with dimension of 10 mm × 10 mm × 10 mm were cut from the surface to the center at the position where the reduction level was 26% (Figure 2b). Three other cubic specimens (P1, P2 and P3) were cut from the corresponding positions of Billet 1 to act as a control group (Figure 2a). Finally, Billet 2 was sectioned along the width (width direction) at the position where the reduction was 26%; another three cubic specimens (P7, P8 and P9) were cut from the surface to the center along the width, as shown in Figure 2c. The specimens were polished and etched for 300 s in saturated picric acid solution. The microstructure and plastic damage in the billets were observed using a laser scanning confocal microscopy.

2.2. Isothermal Tension Tests

Isothermal tension tests have been conducted using a Gleeble-3500 thermo-mechanical simulator to study the mechanism of damage and the effects of temperature and strain rate on plastic damage. Cylindrical tension specimens with a diameter of 10 mm and a length of 120 mm were mechanically extracted from Billet 1. Figure 3 shows the experimental procedure for isothermal tension tests. First, each tension specimen was heated at 5 °C·s−1 to 1200 °C and soaked for 180 s to austenization. The tension specimens were then cooled or heated to different target deformation temperatures. Finally, the tension specimens were stretched under different strain rates to the true strains of ε f , 0.7 ε f , 0.3 ε f , and 0, where ε f represents the true strain when the specimen is cracked. Specimens were cooled immediately after deformation.
Isothermally deformed sections were cut from the tension specimens for experimental analysis. First, the fracture morphologies were observed under a scanning electron microscope. Then, the isothermally deformed sections were sectioned in half along the axial direction. The specimens were polished and etched for 300 s in saturated picric acid solution. Microstructures and plastic damage were observed using a laser scanning confocal microscope. The grain size was measured using Image-Pro software.

3. Experimental Results and Discussions

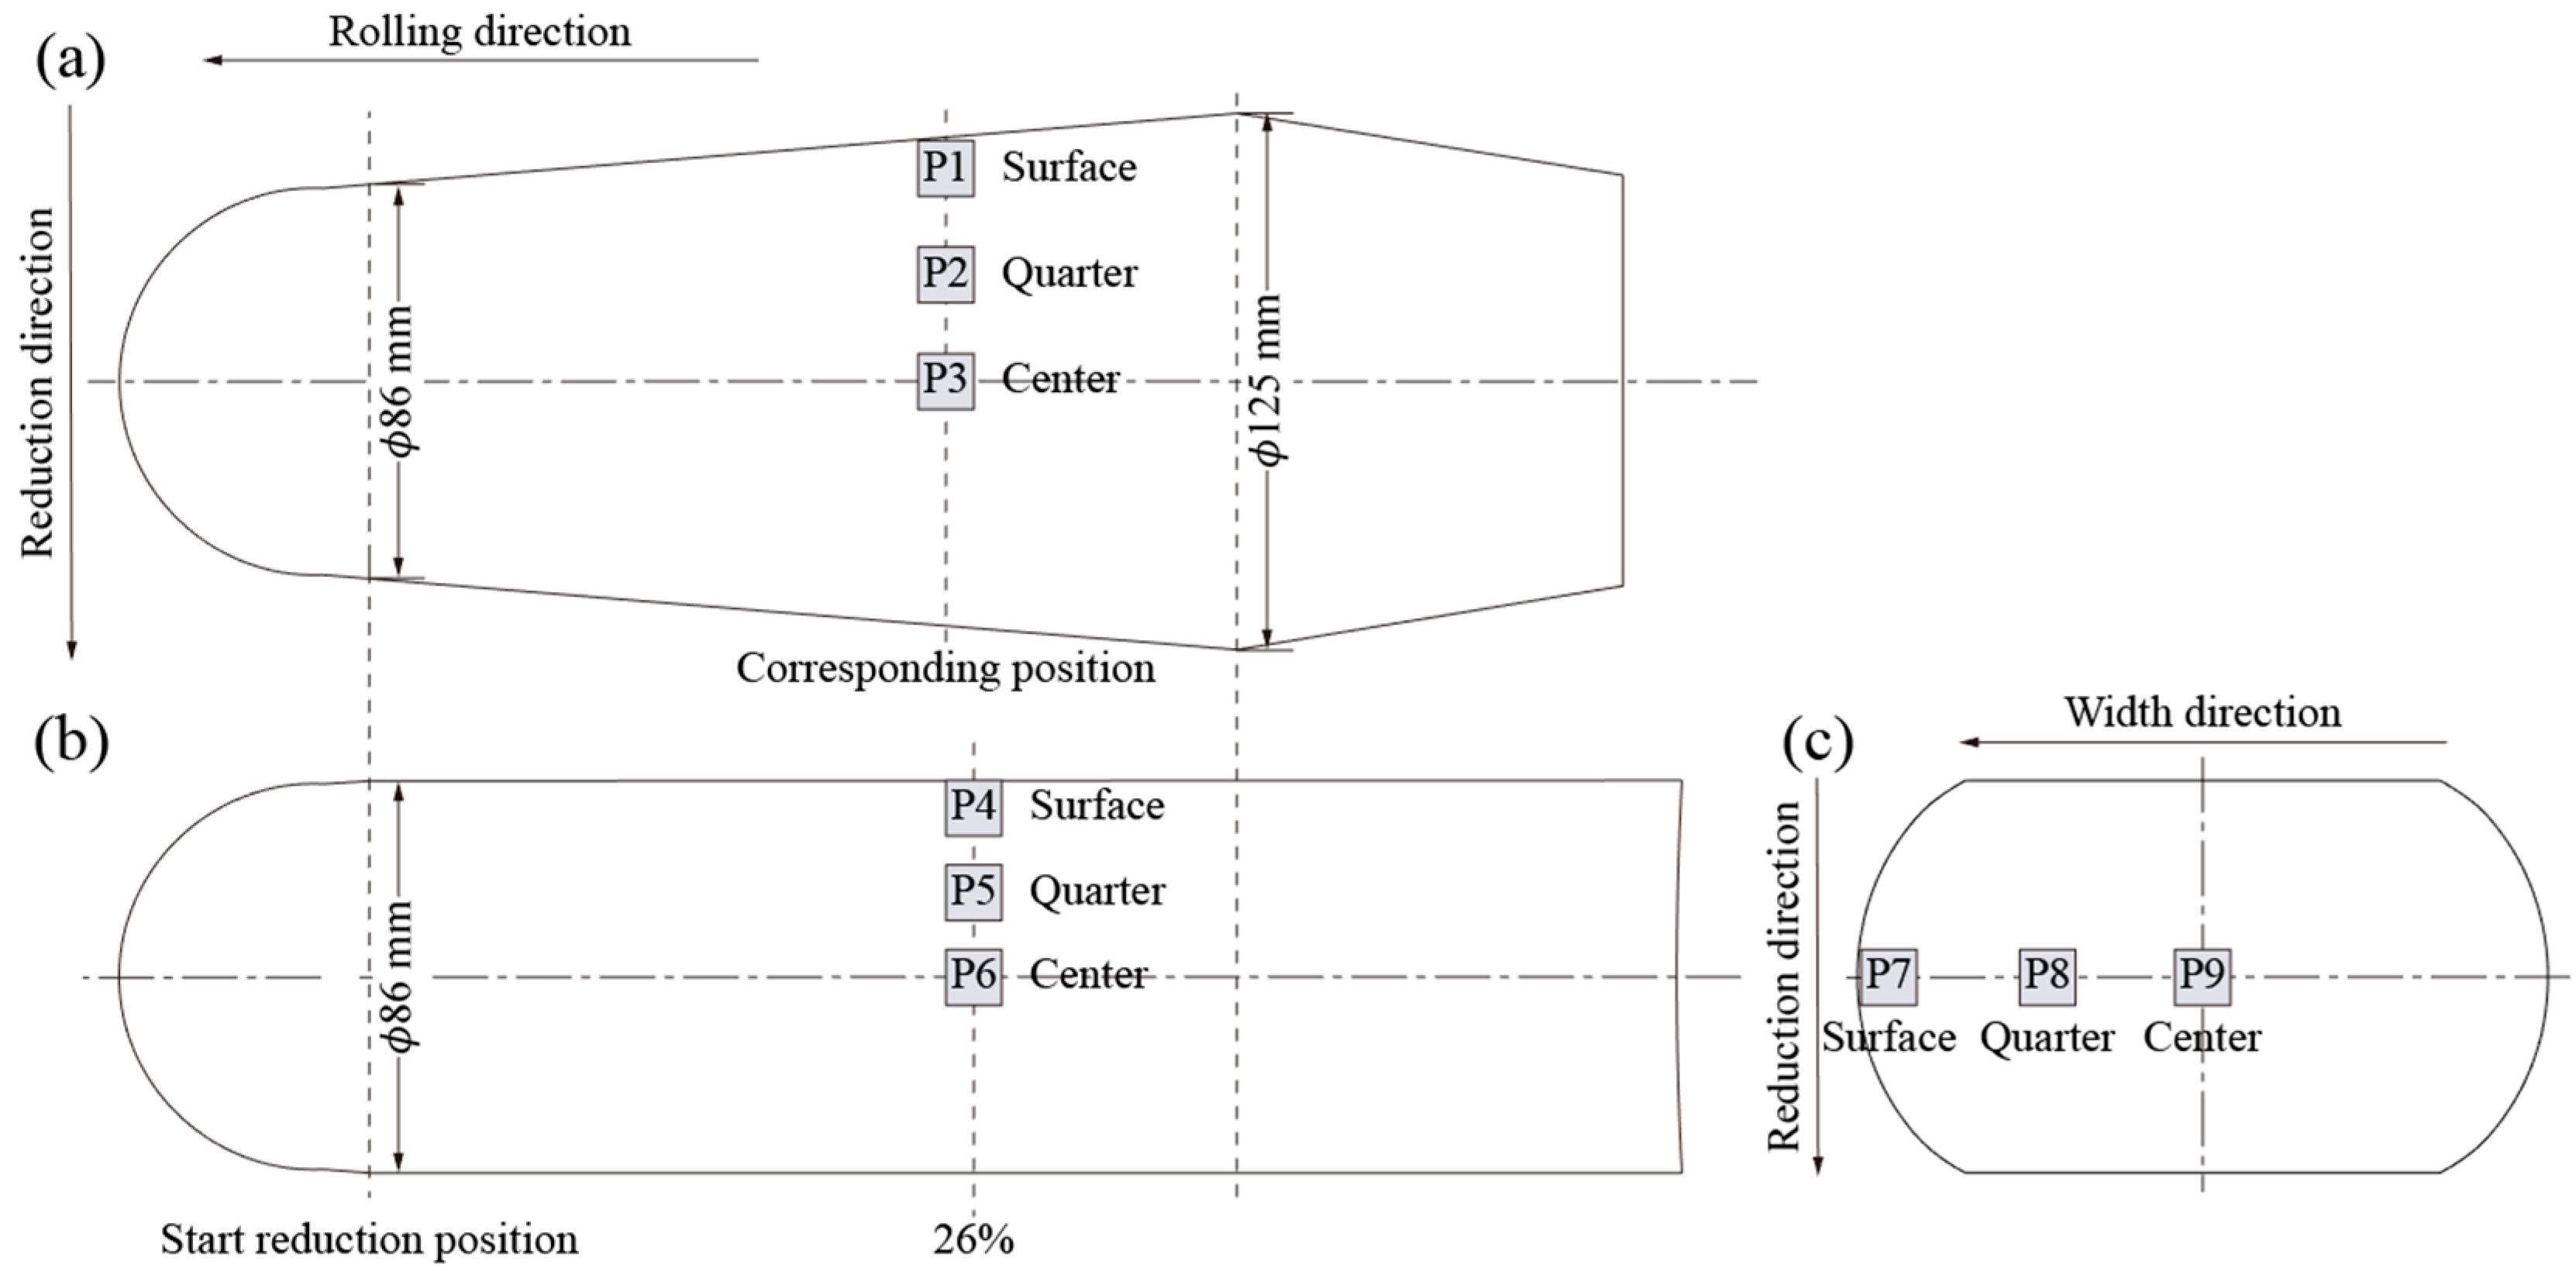
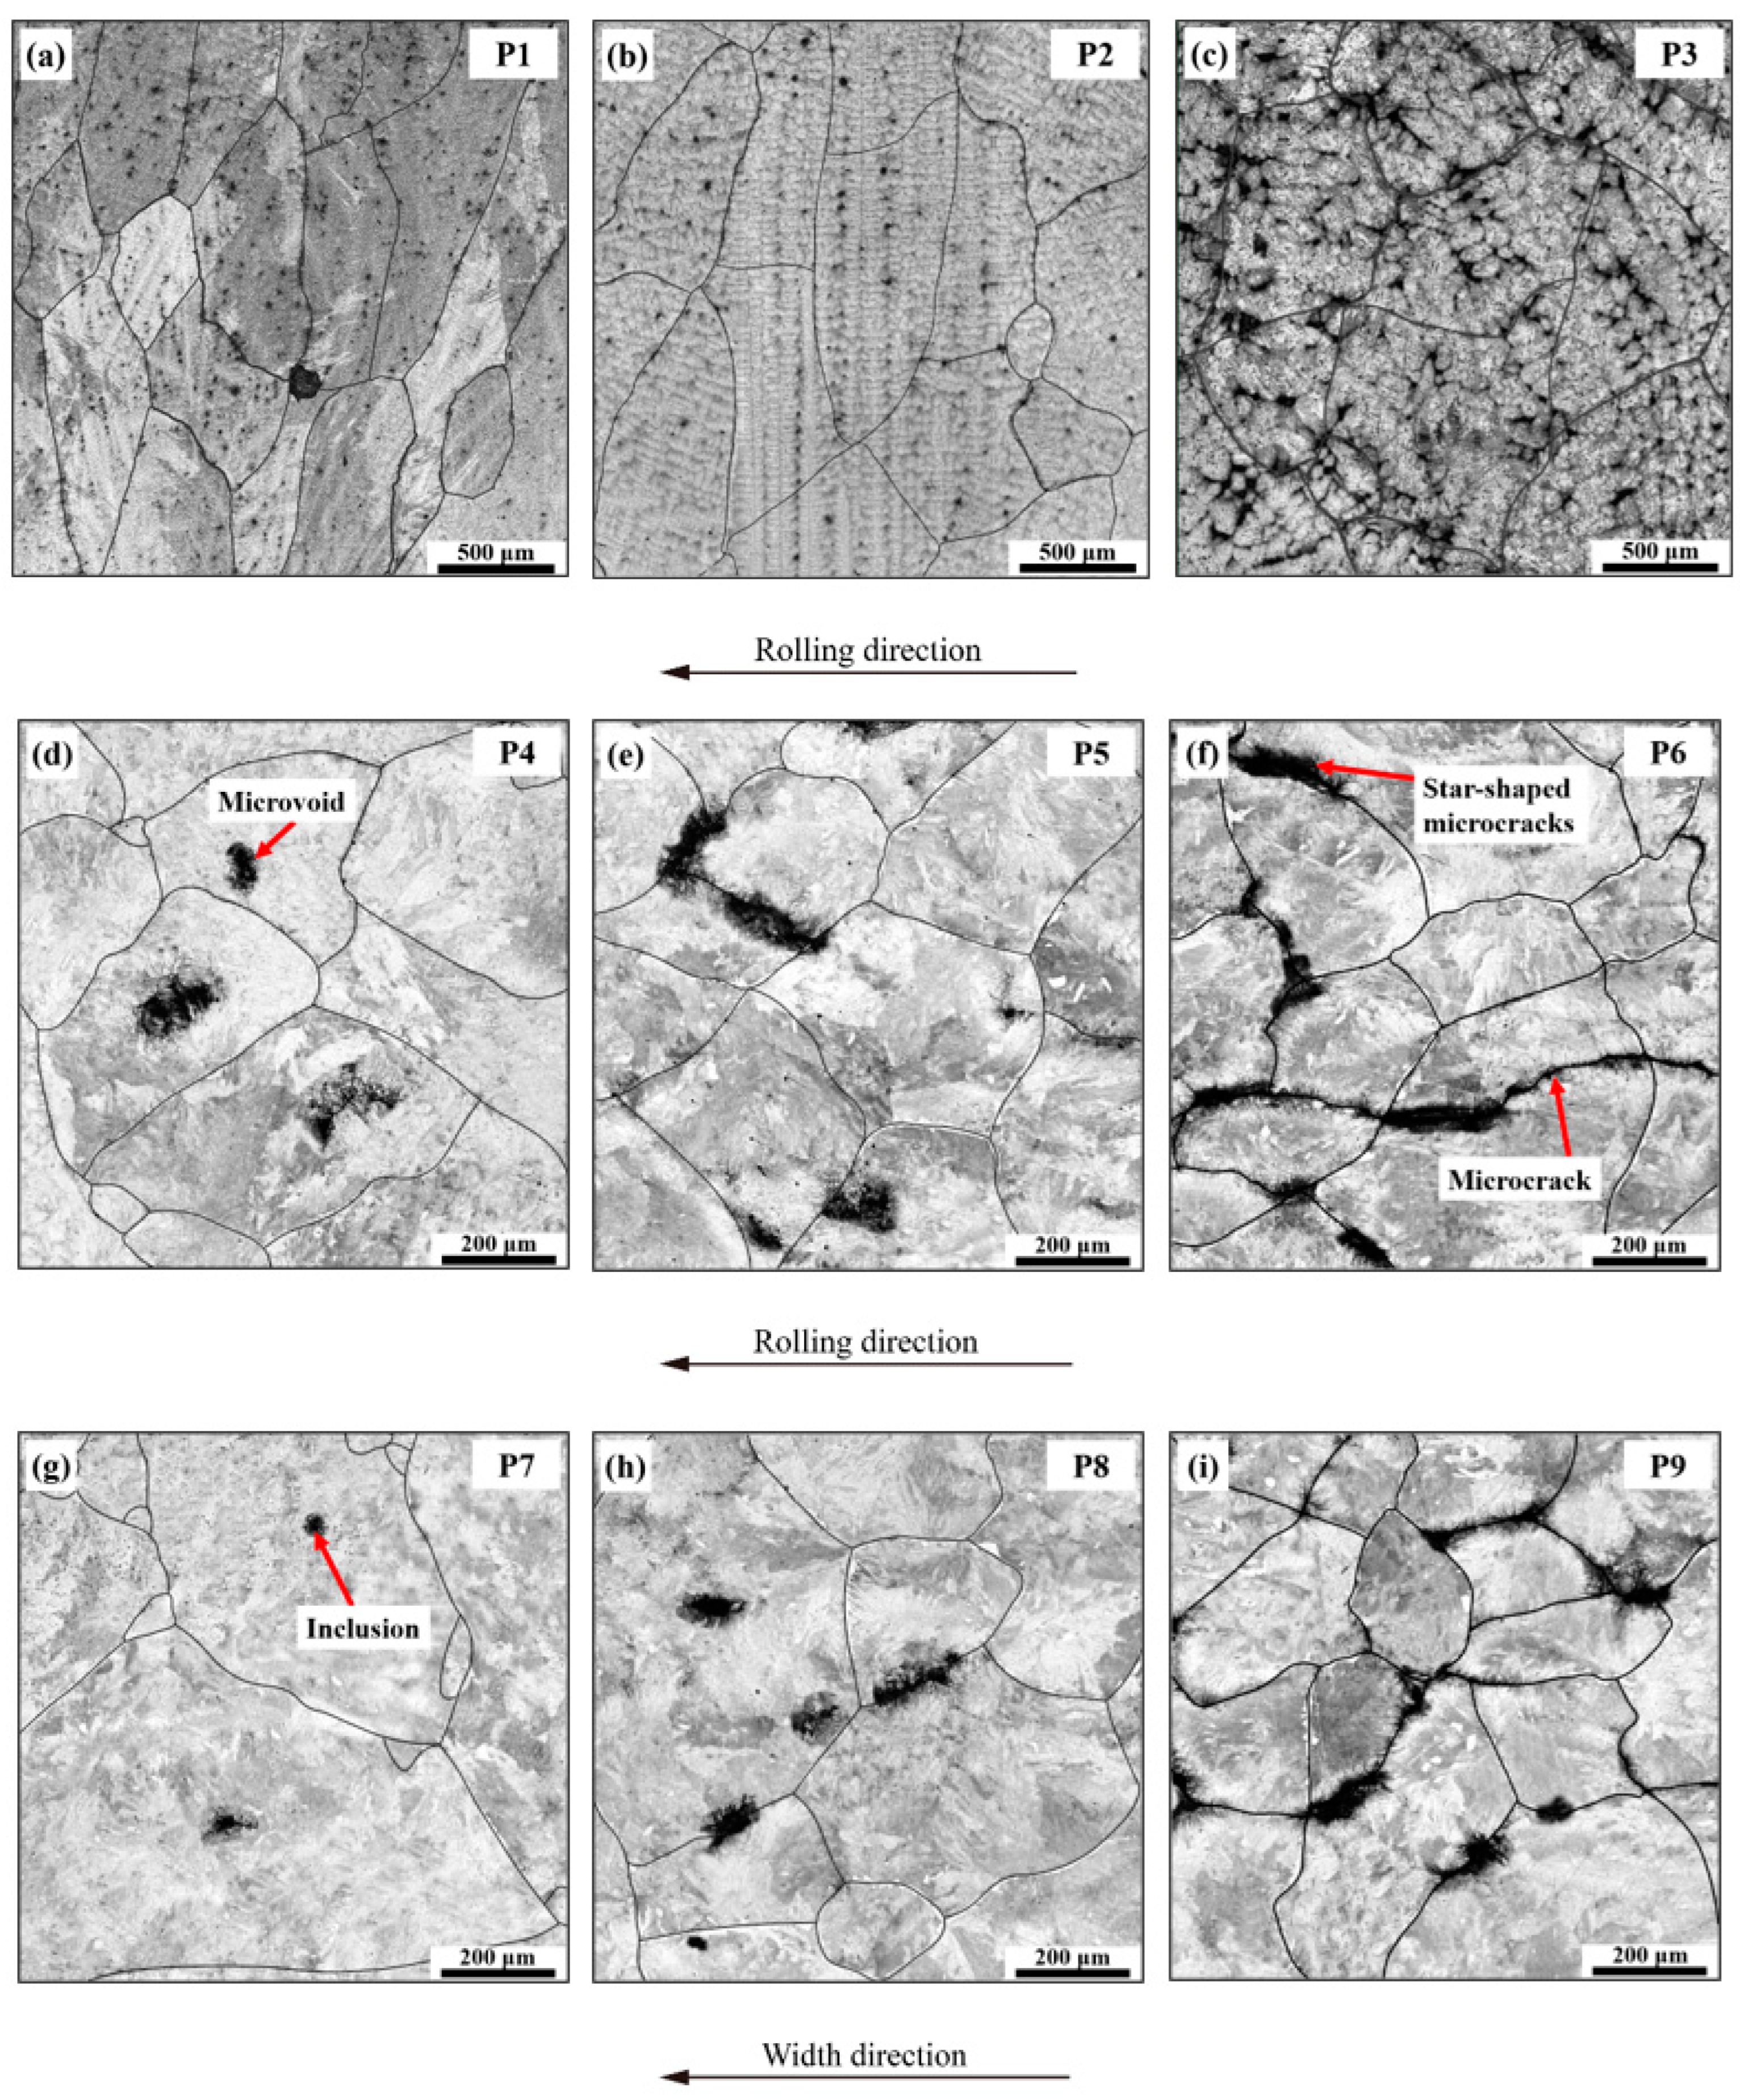
3.1. Microstructures and Damage Distribution in Reduction Pretreatment

Based on our previous study [18], we observed an obvious temperature difference between the surface and center of the billet during the reduction pretreatment process. Specimens P1–P9, cut from the surface to the center of the experimental billets, are shown in Figure 4. In order to visualize the distribution characteristic of the microstructure, the real grain boundaries are highlighted using black lines (Figure 4).
The microstructure of Billet 1 with no reduction is an as-cast structure. The columnar grains appear near the surface of Billet 1 (Figure 4a). At the quarter, the coarse columnar grains are formed as the cooling rate decreases (Figure 4b). The coarser equiaxed grains are formed at the center due to low cooling rate and high temperature (Figure 4c). The average grain sizes from the surface to the center are 612, 700 and 804 μm, respectively. As a control group, the specimens in Billet 1 have no obvious microvoid and microcrack defects, which indicates that the plastic damage in Billet 2 with reduction pretreatment is mainly due to heat deformation.
The distribution characteristics of microstructure and plastic damage in Billet 2 with reduction are different from those in Billet 1. In the thickness direction, the recrystallized grains are nucleated at the surface of Billet 2 and austenite grains are refined. The damage near the surface of the plastic is microvoids damage, while microcracks are distributed around the microvoids (Figure 4d). Due to the large deformation, the austenite grain size is refined to 263 μm at the quarter of Billet 2. Both grain boundary damage and microvoids damage are present at the quarter, and the grain boundary damage is greater than the microvoids damage (Figure 4e). The average austenite grain size is smallest and evenly distributed at the center of Billet 2. The plastic damage at the center is mainly grain boundary damage, which spreads into cracks along the rolling direction. The black areas around the cracks are star-shaped microcracks (Figure 4f).
Along the width of the Billet 2, the recrystallized grains are nucleated at the columnar grain boundaries. Due to small deformation, only a small quantity of microvoid damage appears near the surface (Figure 4g). The coarse columnar grains are transformed into equiaxed grains, and both grain boundary damage and microvoids damage occur at the quarter (Figure 4h). The recrystallization is most significant at the center and the fine equiaxed grain size is about 240 μm. The plastic damage at the center is mainly grain boundary damage, which spreads into cracks along the width (Figure 4i).

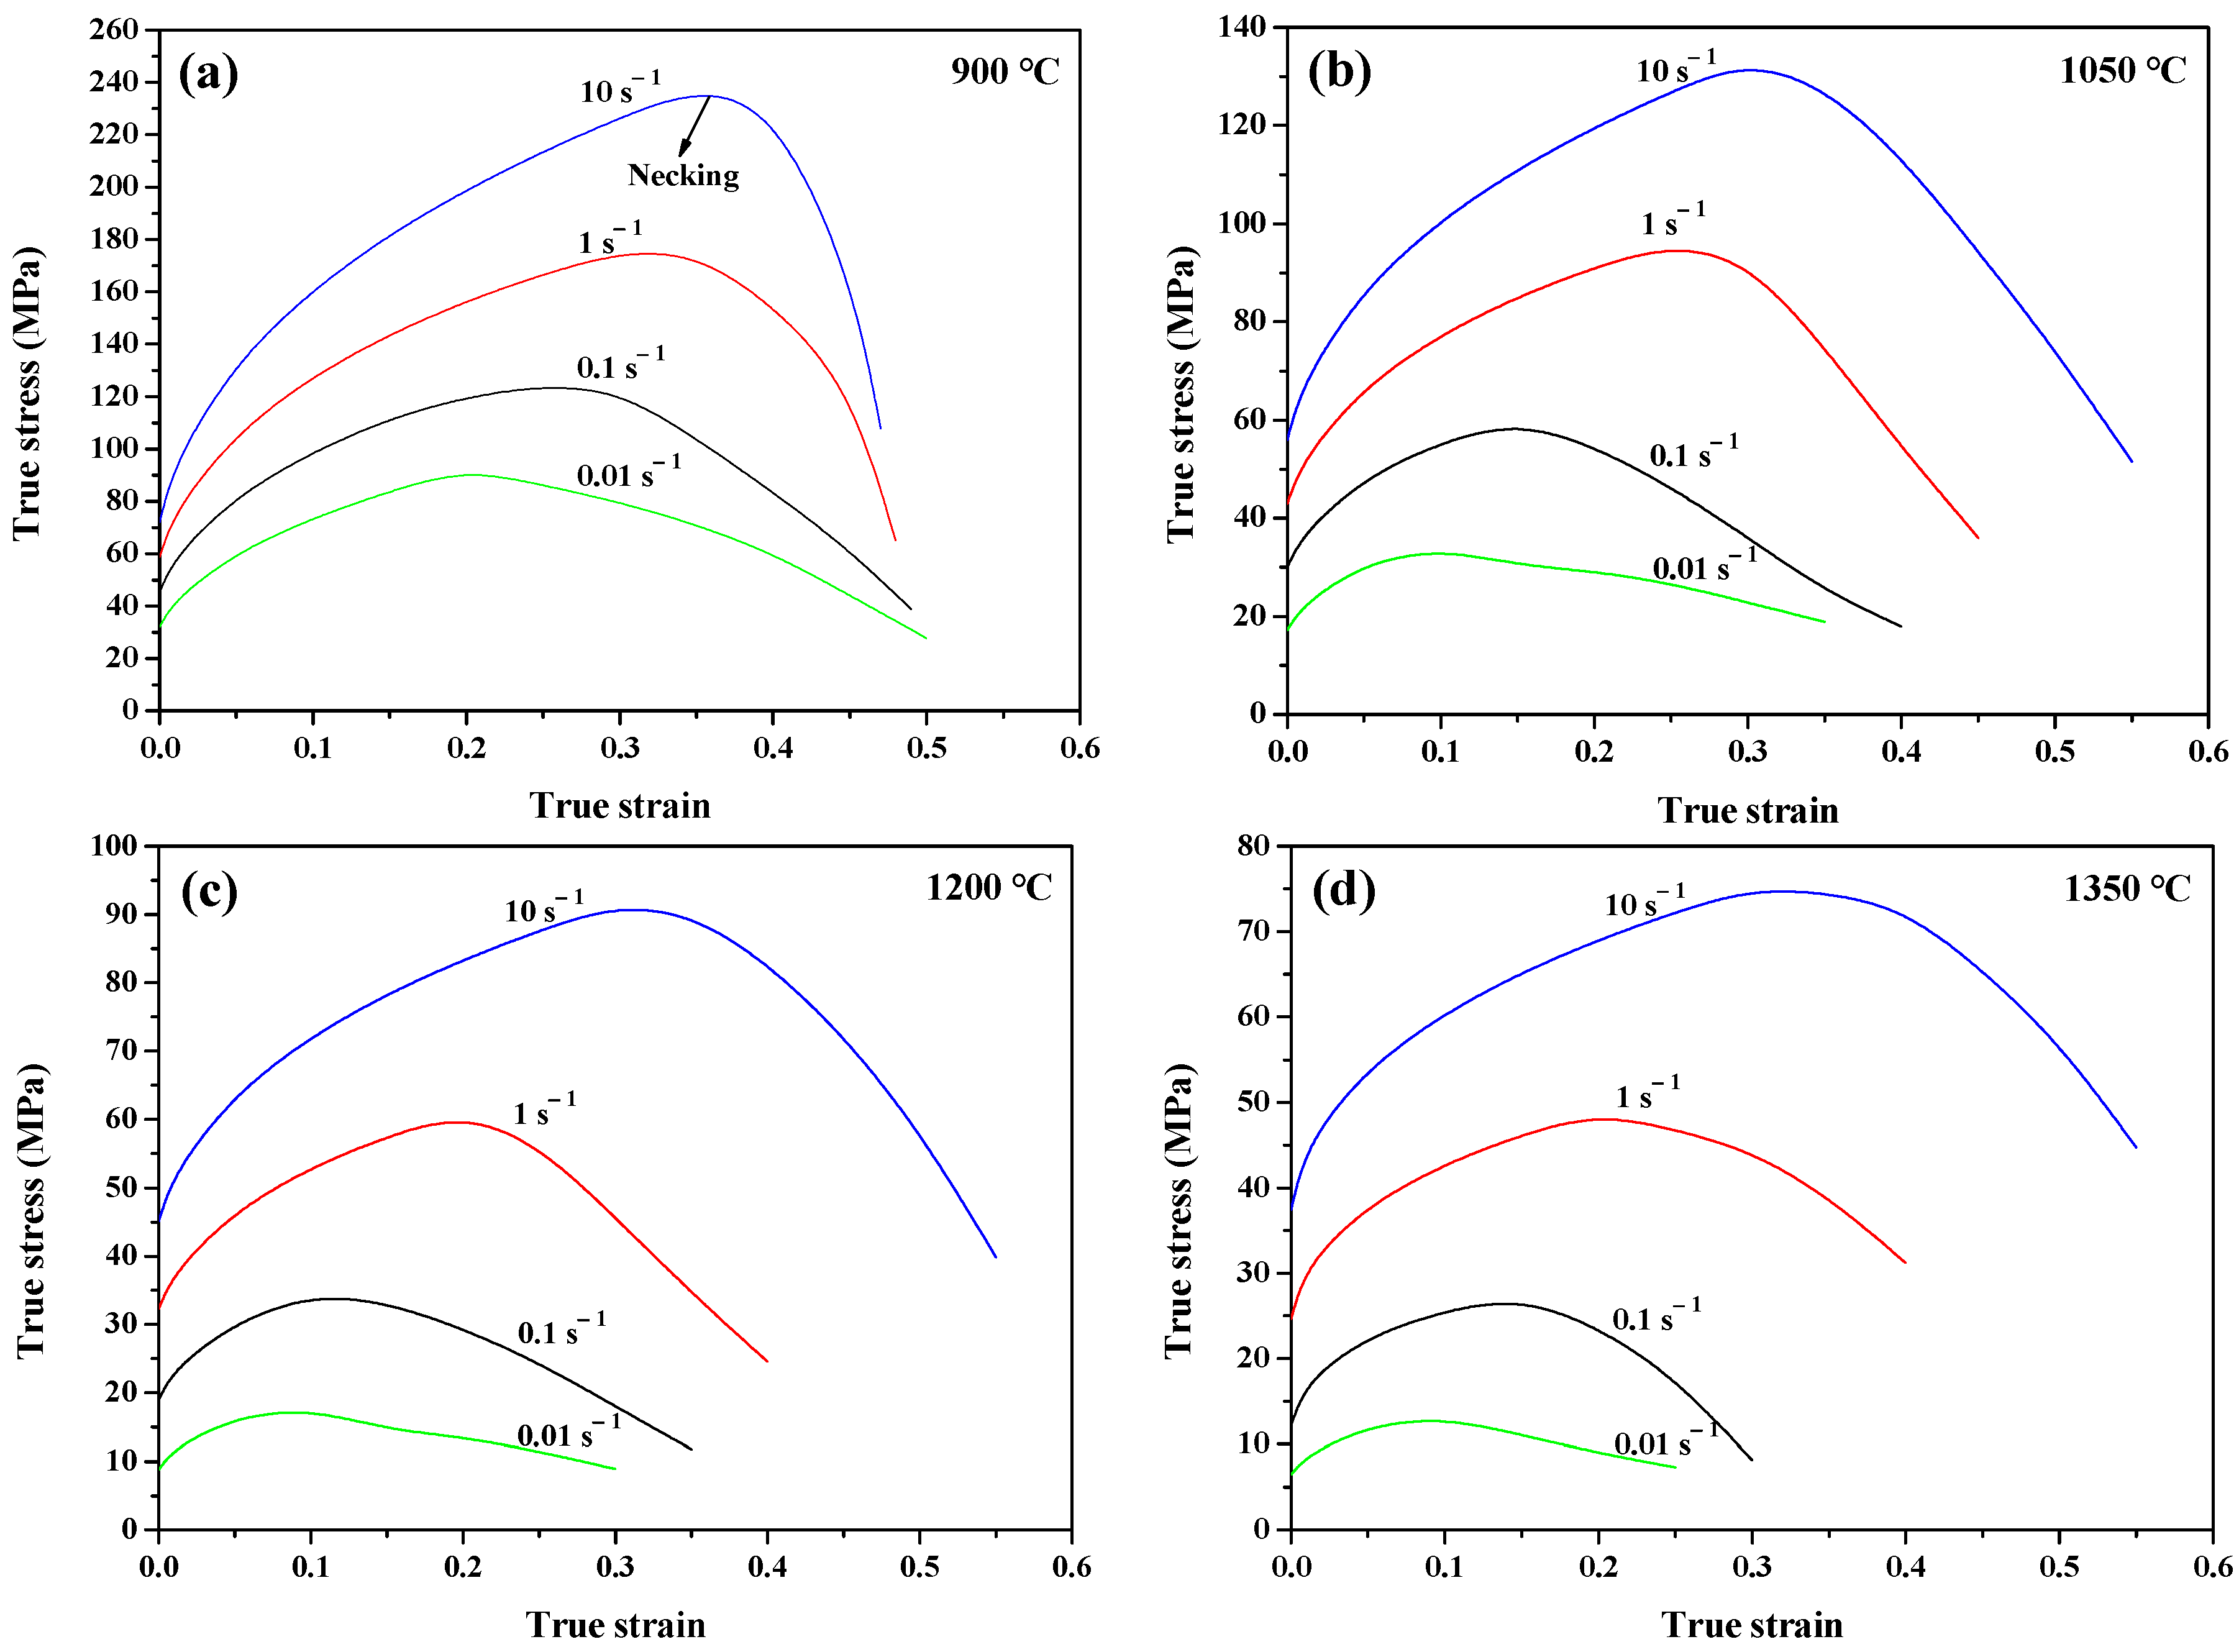
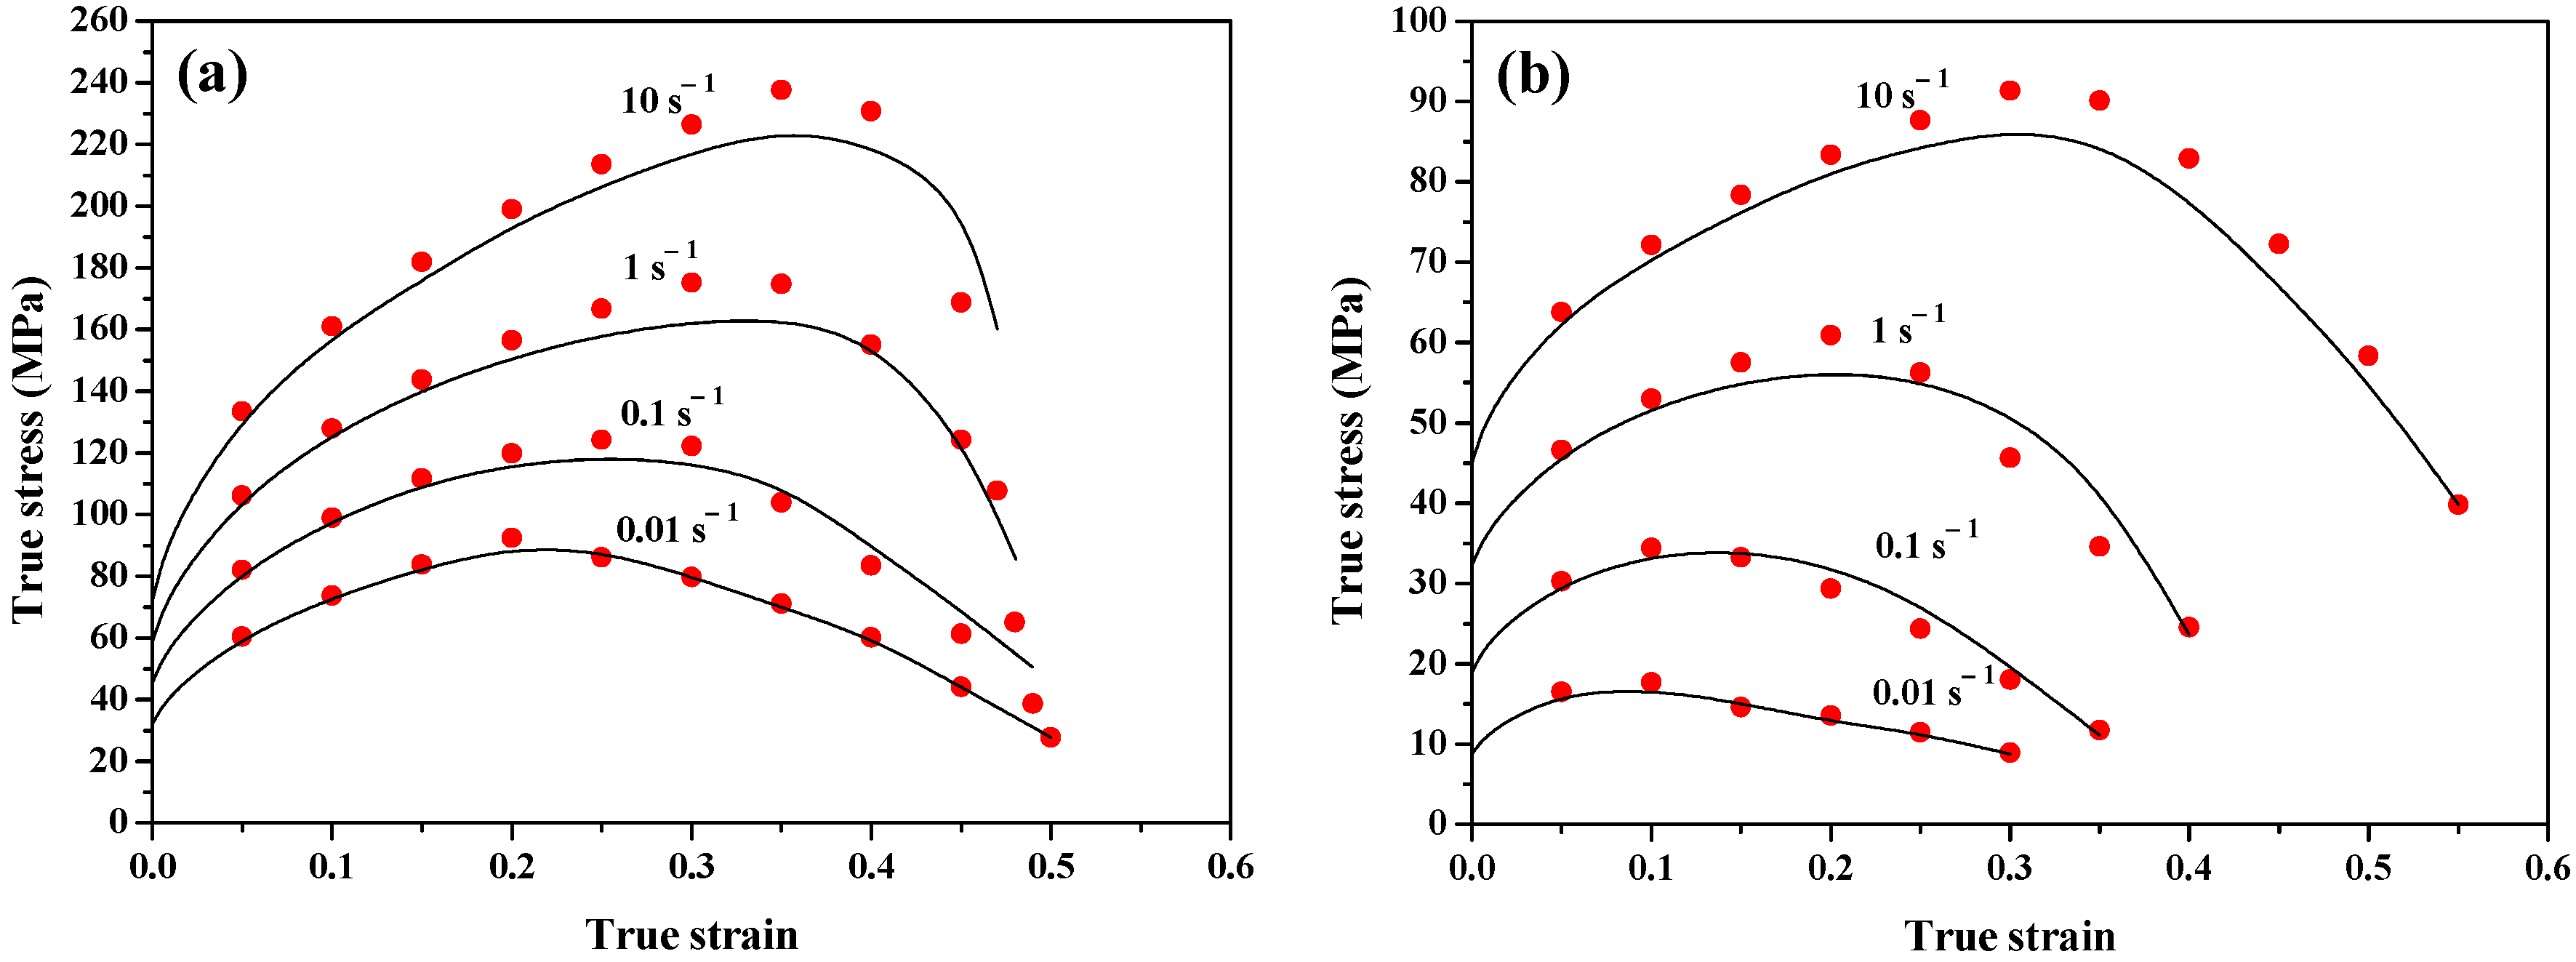
3.2. Results of Isothermal Tension Tests

The true flow stress curves of the tension under different deformation conditions are shown in Figure 5. When the deformation temperature is constant, the tensile strength and the strain at necking increase with increasing strain rate. Meanwhile, when the strain rate is constant, the tensile strength and the strain at necking decrease with increasing temperature.
The average grain sizes of the tension specimens at different strain rates and deformation temperatures are shown in Figure 6. In general, the average grain size increases with the increase in deformation temperature. When the deformation temperature reaches 900 °C, the average grain size decreases with increasing strain rate, as shown in Figure 6a; however, when the deformation temperature reaches 1200 °C and the strain rate reaches 0.01 s−1, the average austenite grain size decreases and then slightly increases with increasing strain, as shown in Figure 6b. This phenomenon will be discussed in conjunction with the microstructure observations.
The microstructures of the tension specimens for different strains when the deformation temperature is 1200 °C and the strain rate is 0.01 s−1 are shown in Figure 7. To visualize the distribution characteristic of microstructure, the real grain boundaries in Figure 7 are highlighted using black lines. The initial coarse austenite grain size is approximately 770 μm, as shown in Figure 7a. When the strain is 0.3ɛ, the recrystallized grains begin to nucleate at the austenite grain boundaries and the austenite grains are refined as shown in Figure 7b. When the strain increases to 0.7ɛ, the average austenite grain size is further refined to 265 μm, as shown in Figure 7c. As the strain continues to increase, deformation bands form in the tension direction. Necking occurs prior to fracturing in the tension specimens, accelerating the increase in plastic damage. Grain boundary slip between large grains is more likely to produce plastic damage and form grain boundary cracks, as shown in Figure 7d. At this time, the austenite grains are less affected by the level of deformation and the average grain size increases to 276 μm due to high temperature.

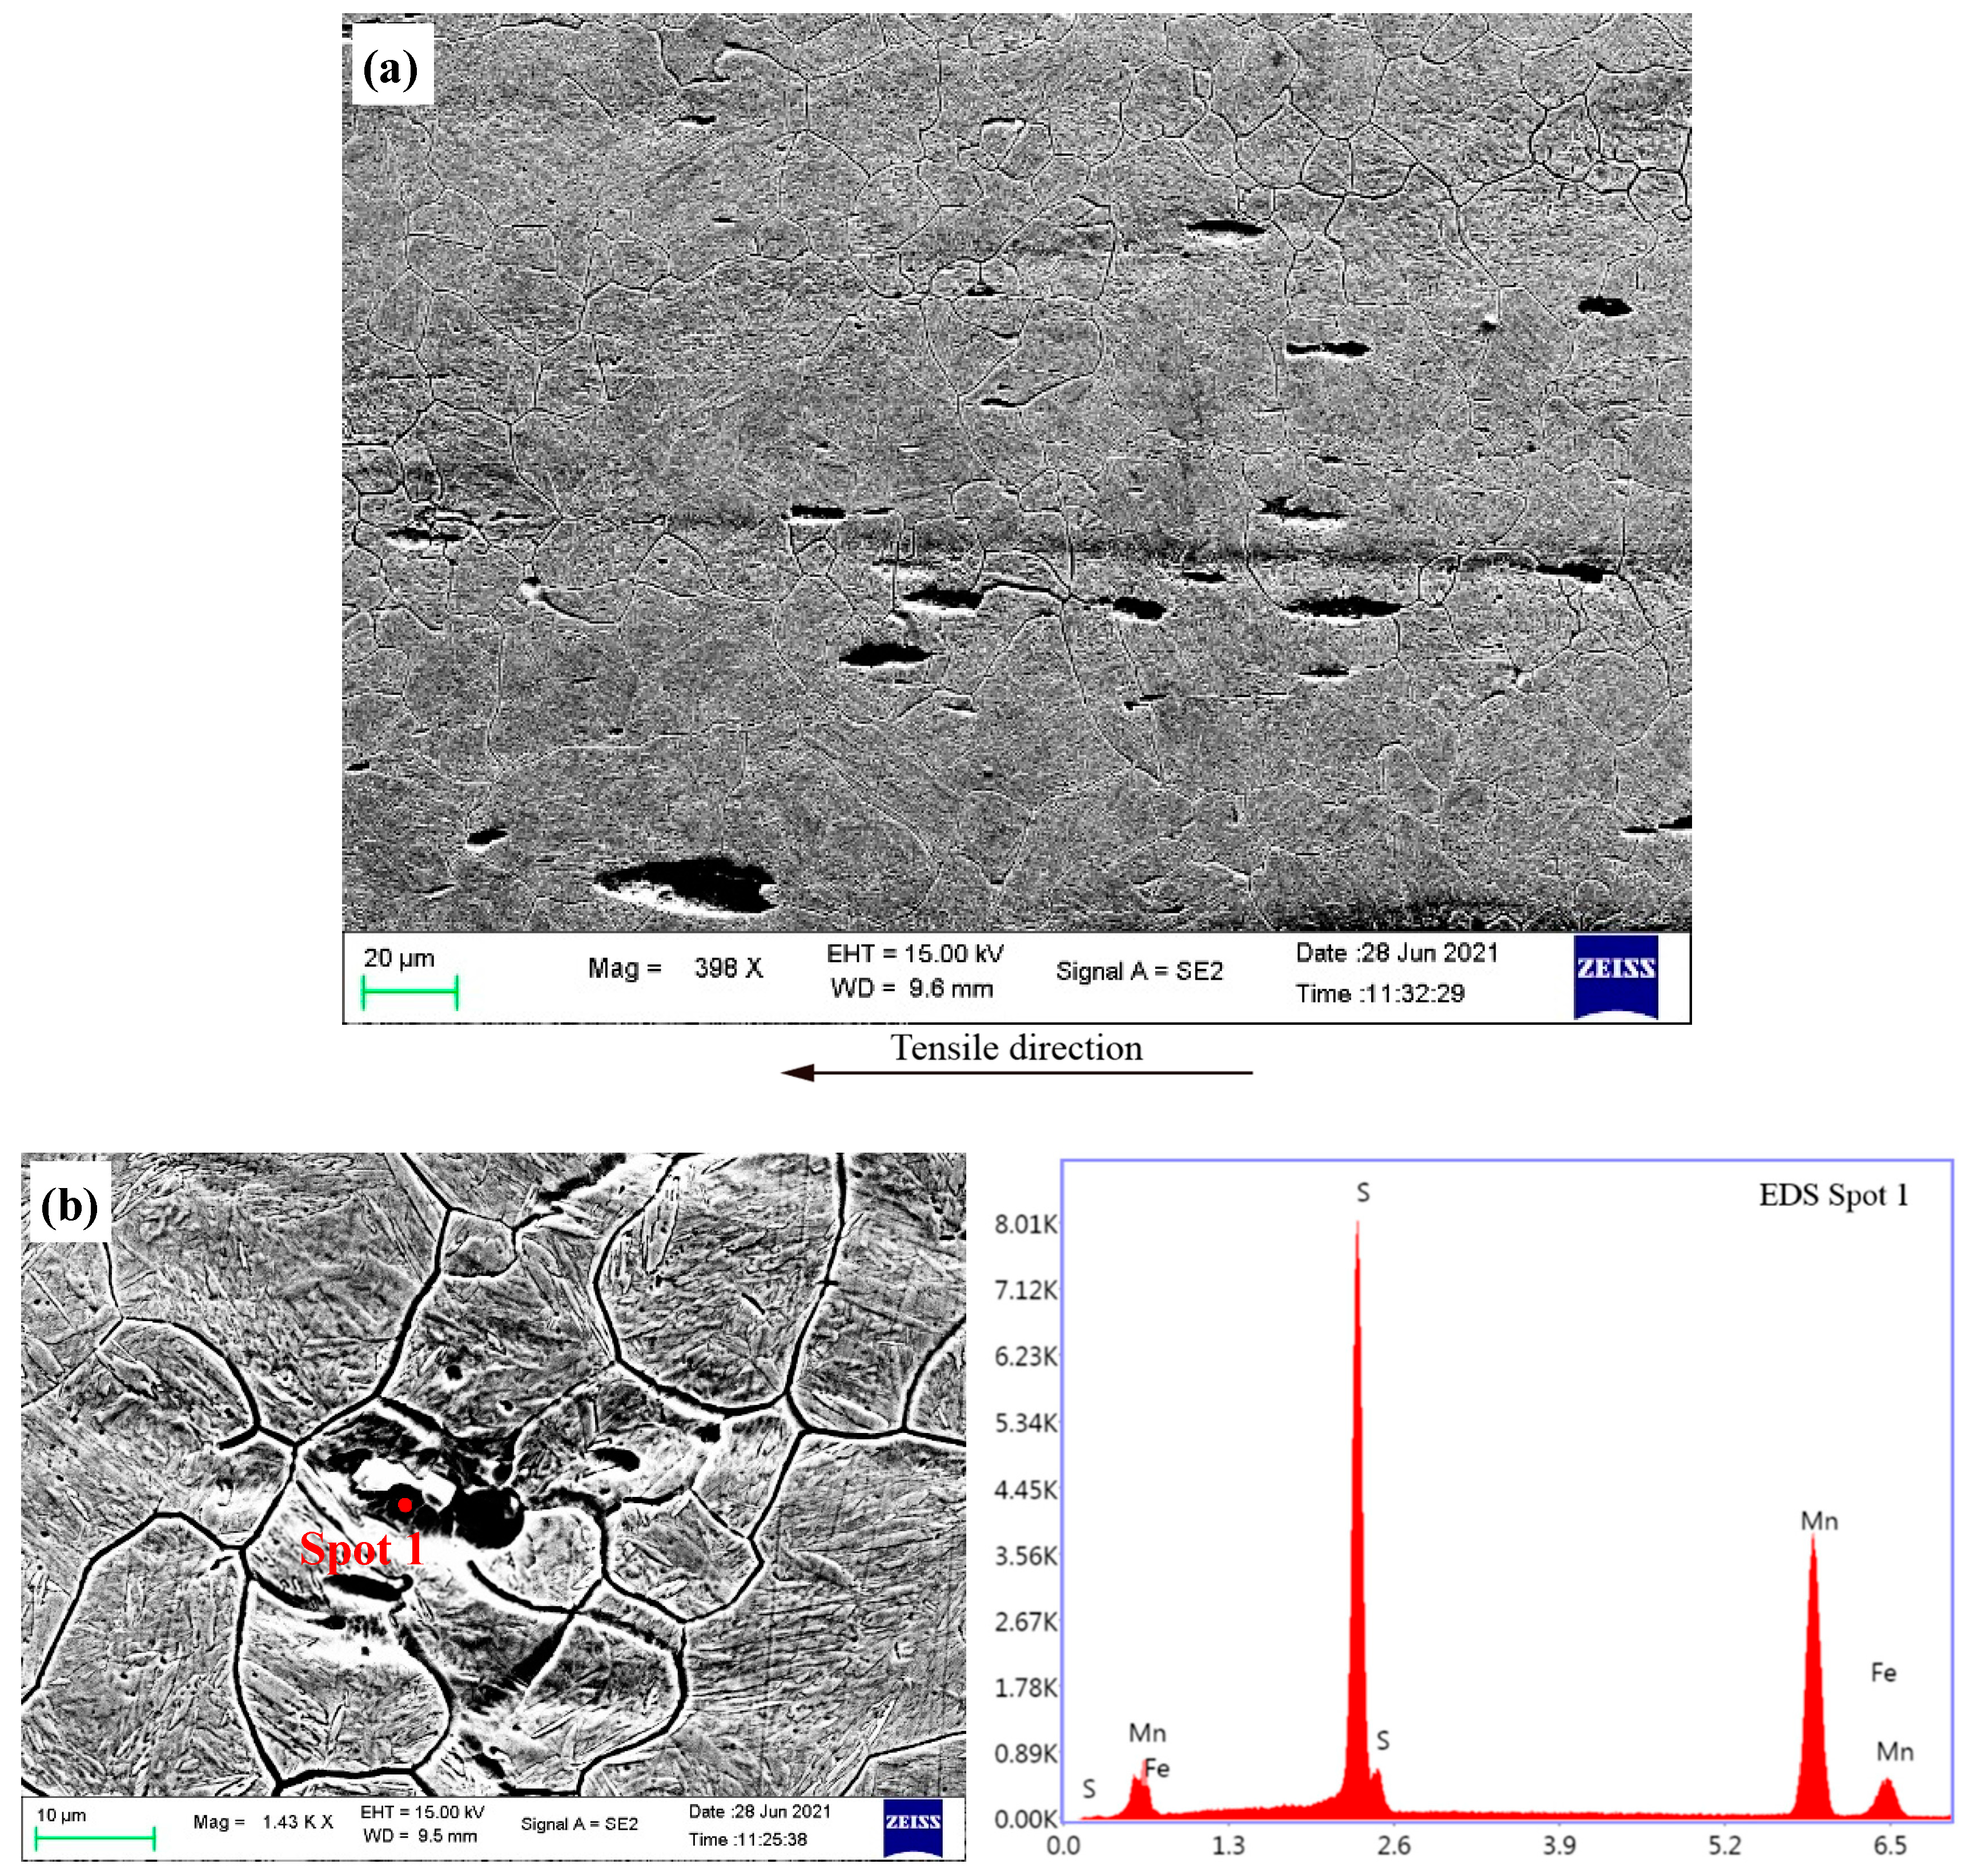
3.3. Formation Mechanism of Plastic Damage

Reduction of area is an important index for evaluating high temperature plasticity. Figure 8 shows reduction of area for the tension specimens at different strain rates and deformation temperatures. When the deformation temperature is 900 °C, all the reduction of area under different strain rates are greater than 60%. As the strain rate increases, the reduction of area of the specimen decreases. When the deformation temperature is above 1050 °C, the reduction of area of the specimen increases with increasing strain rate. The different trends in the reduction of area at 900 °C and other deformation temperatures are determined based on the damage mechanism, which will be discussed later in conjunction with the observation of fracture morphology and microstructure.
Figure 9 shows fracture morphologies of the tension specimens at deformation temperatures of 900 and 1200 °C and strain rates of 0.01 and 10 s−1. As shown in Figure 9a,b, the fracture morphologies of tension specimens at 900 °C are mainly characterized by ductile fracture. As the strain rate increases, the dimples become smaller and shallower and the plasticity decreases. As shown in Figure 9c, when the deformation temperature is 1200 °C and the strain rate is 0.01 s−1, a molten liquid film forms on the fracture due to local overheating. The microscopic morphology of the fracture is rock sugar-like, and the grain morphology clearly shows multiple bright faces, which is a typical intergranular boundary fracture. When the strain rate increases to 10 s−1, the fracture morphology is gradually transformed from brittle fracture to ductile fracture. Dimples become larger and deeper and the plasticity of the tension specimen increases, as shown in Figure 9d.
Figure 10 shows microstructures of the tension specimen at a temperature of 900 °C and a strain rate of 0.1 s−1. The plastic damage on the fracture is the inclusion damage that increases along the deformation bands. Deformation is mainly controlled by dislocation movement when the temperature is 900 °C. Once dislocation reaches a critical value, the inclusions or the second phase particles peel off the metal matrix to form microvoids and the damage begins to nucleate. As the deformation level increases, the adjacent microvoids penetrate through to form long strip cavities and the damage continues to grow and converge into fractures. Residual MnS inclusion is found at the detection point of Spot 1 in a microvoid as shown in Figure 10b.
Figure 11 shows microstructures of the tension specimen at a temperature of 1200 °C and a strain rate of 0.1 s−1. The plastic damage on the fracture is mainly grain boundary damage and is perpendicular to the deformation bands; inclusion damage occurs at the same time. The atomic diffusion ability is enhanced at 1200 °C, while the grain boundary strength is lower than the intragranular strength. Grain boundary movements such as grain boundary slip controlled by diffusion gradually replaces the dislocation movement. When the stress exceeds a critical value, cavities are formed through vacancy aggregation at the grain boundary perpendicular to the tensile stress. Once the cavity core is formed, the vacancies continue to diffuse from grain boundary to the cavity under tensile stress; subsequently, the cavities grow and connect with each other until cracks form.
In summary, when the temperature is 900 °C, deformation is mainly controlled by dislocation movement. The plastic damage on the fracture is the inclusion damage that spreads along the deformation bands. Dislocations accumulate rapidly as strain rate increases, leading to nucleation and growth of plastic damage. The dimples become smaller and shallower and plasticity decreases. Both grain boundary damage and inclusion damage exist on the fracture of the tension specimen when the temperature is above 1050 °C. Dislocation accumulation is slow when the strain rate is 0.01 s−1, grain boundary damage is dominant, and the fracture presents as brittle fracture. When the strain rate increases to 10 s−1, dislocations accumulate rapidly and the influence of dislocation movement on deformation gradually increases. At this time, inclusion damage is dominant and the fracture presents as ductile fracture.

4. Plastic Damage Model Based on Isothermal Tension Test

4.1. Development of Plastic Damage Model

Based on the theory of continuous damage mechanics, damage formation occurs in three stages: nucleation, growth and convergence. The convergence and growth mechanisms of plastic damage are similar. For simplification, damage convergence can be considered a form of damage growth. The nucleation rate of plastic damage [19] D N ˙ is associated with variation in the rate of normalized dislocation density ρ ˙ ,
D N ˙ = π 1 ( 1 D T ) ρ ˙
where π 1 is the temperature-dependent variable. The growth rate of plastic damage D G ˙ is a function of the effective plastic strain rate ε p ˙ , average grain size d and total plastic damage D T . Total plastic damage rate D T ˙ is the sum of plastic damage nucleation rate and growth rate [19].
D G ˙ = π 2 D T 1 D T n 1 ( d d 0 ) n 2 ε p ˙ n 3
D T ˙ = D N ˙ + D G ˙
where π 2 is the temperature-dependent variable; n 1 , n 2 , n 3 and d 0 are the material constants. D T ranges between 0 and 1, with 0 representing no damage and 1 representing complete breakdown of the material. Multiple experiments show that the material is out of control when the effective stress decreases by 70% [20]. In this study, once D T increases to 0.7, the material element is considered to have failed due to damage. The hyperbolic sine law [21], which introduced the damage factor D T was adopted to describe the flow behavior of material. The effective plastic strain rate ε ˙ p can be expressed as
ε ˙ p = A 1 s i n h [ A 2 ( σ 1 D T H k ) ] ( d / d 0 ) γ 1
where k is the yield stress; σ is the stress; A 1 is a temperature-dependent variable; d is the average grain size; and A 2 , γ 1 , and d 0 are the material constants. The isotropic hardening stress H is associated with the dislocation density ρ . The hardening rate H ˙ and the dislocation density rate ρ ˙ can be expressed as [22]
H ˙ = 0.5 B 1 ρ 0.5 ρ ˙
ρ ˙ = A 4 ( d / d 0 ) δ 1 ( 1 ρ ) ε ˙ p δ 2 C r ρ δ 3 [ ( A 3 ρ ) / ( 1 S ) δ 4 ] S ˙
where B 1 and C r are the temperature-dependent variables; A 3 , A 4 , δ 1 , δ 2 , δ 3 and δ 4 are the material constants; S is the volume fraction of recrystallization. The first term in Equation (6) represents the comprehensive effect of work hardening and dynamic recovery on dislocation density. The second and third terms represent annihilation of dislocation density due to static recovery and recrystallization.
The incubation fraction x and the volume fraction of recrystallization S are used to describe incubation time for dynamic recrystallization (DRX) and recrystallization degree. Two rate equations for x and S can be expressed as [23]
x ˙ = H 1 ( 1 x ) ρ
S ˙ = Q 0 [ x ρ ρ c 1 S ] 1 S λ 1
where ρ c is the critical dislocation density; H 1 is the temperature-dependent variable; Q 0 and λ 1 are the material constants. A rate equation for the average grain size is given as [22]
d ˙ = G 1 d 1 / d ψ 1 G 2 S ˙ d / d 0 ψ 2
where G 1 is the temperature-dependent variable and d 1 , ψ 1 , G 2 and ψ 2 are the material constants. The stress–strain relationship of the material at the elastic deformation stage is described by Hooke’s law.
σ = E ε T ε p
where ε T and ε p are total strain and plastic strain, respectively, and E is the elastic modulus. All the temperature-dependent variables are defined using Arrhenius relations and their expressions are listed in Table 2.

4.2. Determination of Material Constants

The material constants within the plastic damage model were determined using genetic algorithm-based optimization techniques [24,25]. The material constants in the grain growth equation were determined using the static grain growth tests [25]. The experimental data are shown in Table 3. After that, based on the hot tension test results, the remaining material constants were obtained by minimizing the residuals between the calculated and experimental average grain size and flow stress. The values of the material constants are listed in Table 4.

4.3. Validation and Discussion

The plastic damage model with the determined material constants was applied to predict flow stress and average grain size at different strain rates and deformation temperatures. Figure 12 shows the computed and experimental flow stress curves at different strain rates and deformation temperatures. The calculated flow stress curves can characterize the effects of work hardening and softening caused by dynamic recovery, dynamic recrystallization and plastic damage on the material’s flow behavior.
The experimental and computed average grain sizes at different strain rates and deformation temperatures are shown in Figure 13. The computed results show that when the deformation temperature is constant, the grain size evolution curves intersect at different strain rates. As observed, the computed and experimental values are in good agreement.
The plastic damage evolution was predict using model calculations. Figure 14a shows plastic damage evolution curves at different strain rates. Damage curves at different strain rates and 1200 °C intersect. During initial deformation, the dislocation density at a strain rate of 10 s−1 is greater than that at a strain rate of 0.01 s−1. Meanwhile, based on the plastic damage growth rate Equation (2), the growth rate of plastic damage is associated with plastic strain rate. Therefore, the damage nucleation and growth are more obvious at a strain rate of 10 s−1.
As deformation increases, grain boundary movements such as grain boundary slip controlled by diffusion gradually replaces the dislocation movement at a strain rate of 0.01 s−1. It is easy for grain boundary slip to produce grain boundary damage and the growth rate of grain boundary damage is greater than that of inclusion damage, which promotes the increase in plastic damage. Therefore, plastic damage at a strain rate of 0.01 s−1 rapidly exceeds that at a strain rate of 10 s−1, which leads to intersection of the damage curves.
Figure 14b shows plastic damage evolution curves at different deformation temperatures. At a strain rate of 0.1 s−1, plastic damage increases rapidly as deformation temperature increases. Based on the plastic damage growth rate Equation (2), the growth rate of plastic damage increases with the increase in grain size. In addition, grain boundary damage occurs at high temperature and low strain rate, further accelerating the growth of plastic damage.
As shown in Figure 15, the correlation coefficient R of calculated and experimental flow stress is 0.992 and the average absolute relative error (AARE) is 5.8%. This shows that the calculated results of the model are reliable.

5. Application of Plastic Damage Model to Analysis of Reduction Pretreatment

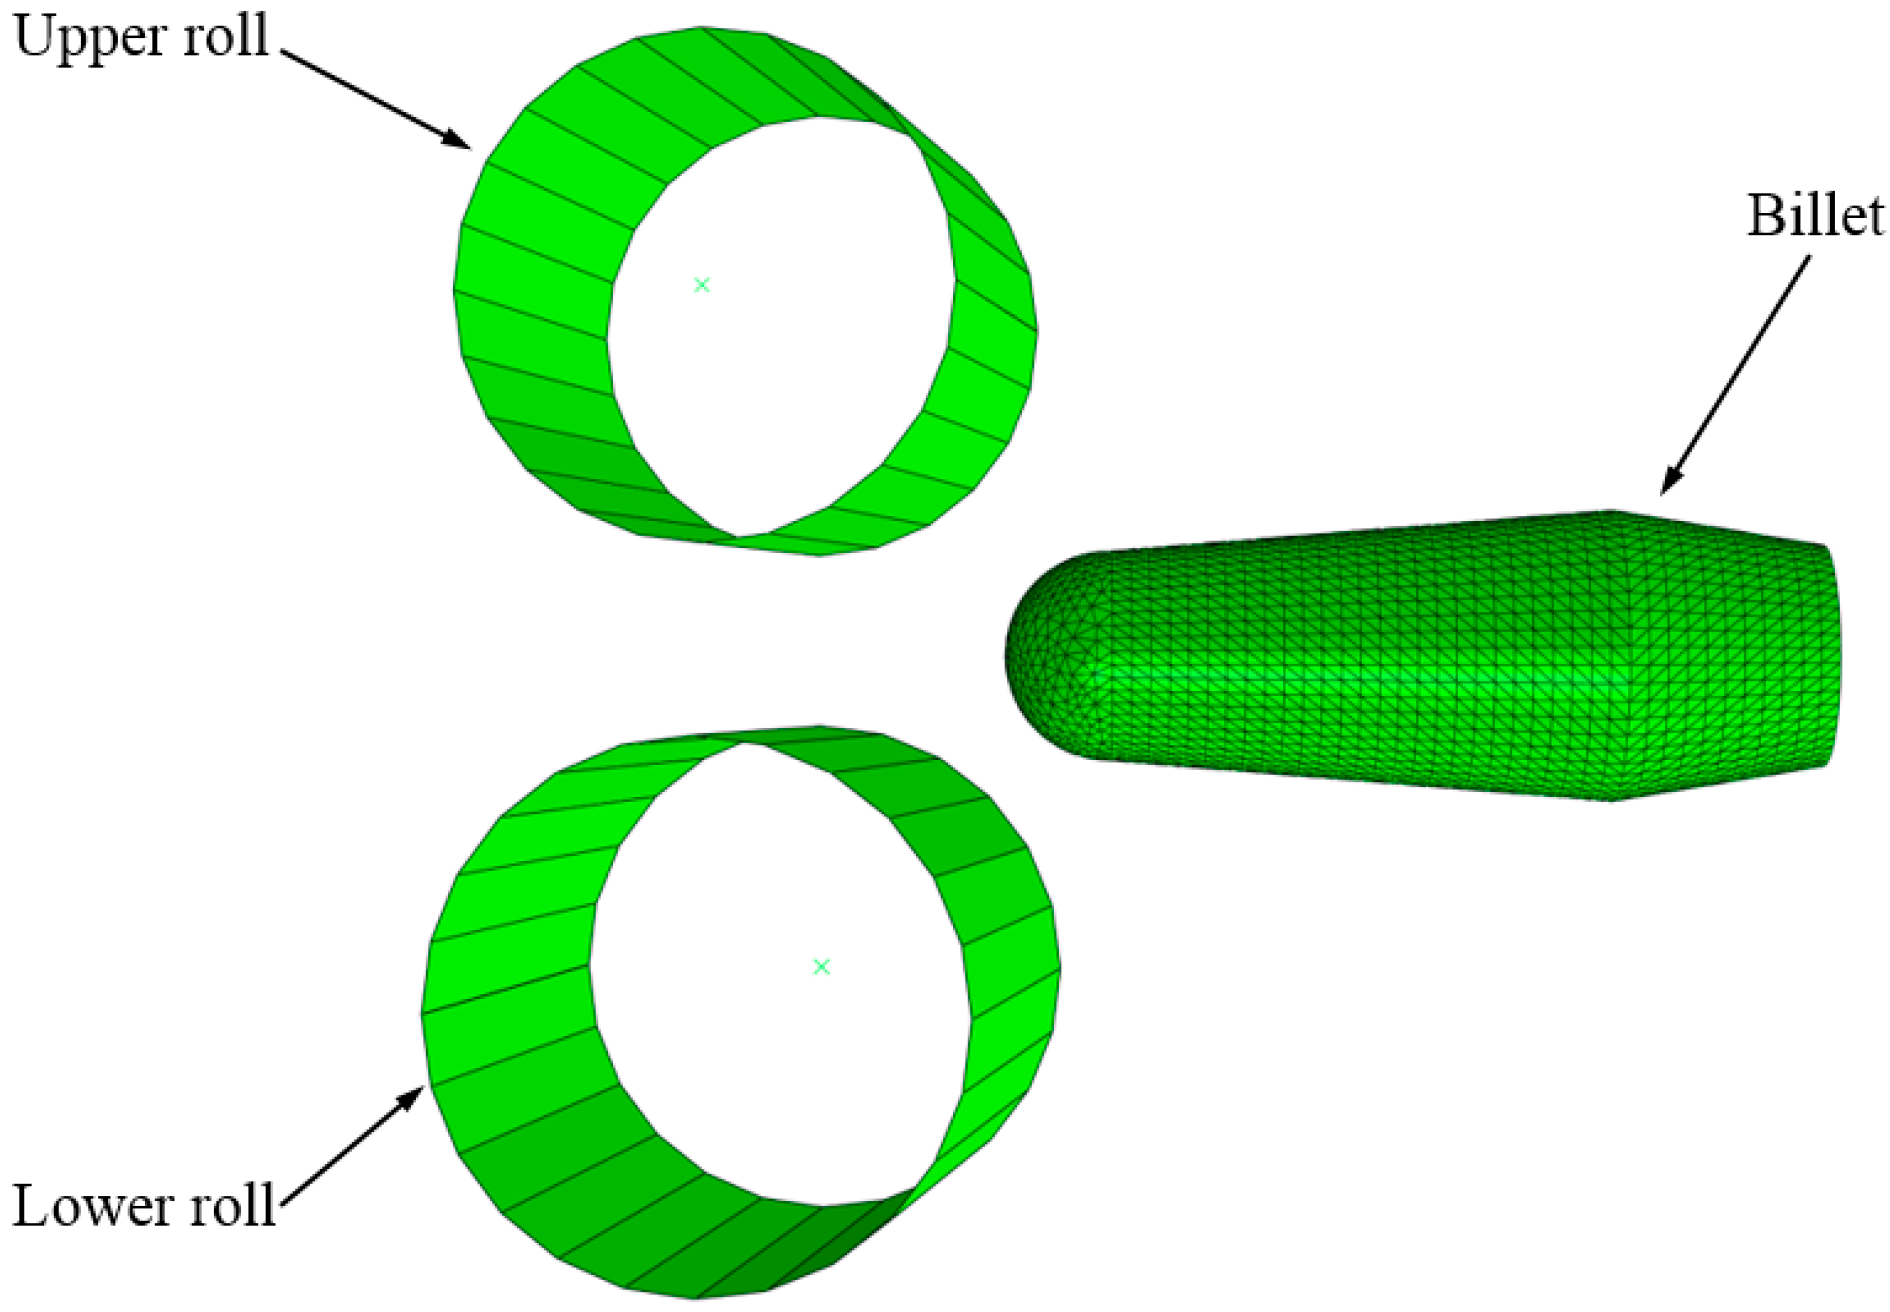
5.1. Numerical Simulation of Damage Evolution

A finite element method (FEM) model for reduction pretreatment was established to further study plastic damage evolution, as shown in Figure 16. The billet was divided into twenty thousand tetrahedron elements. The plastic damage model, with determined material constants, was coded in Fortran and inserted into the FEM model of reduction pretreatment via the user-defined subroutine VUMAT in the ABAQUS software.
The call of plastic damage model is determined by the stress state of the element, as shown in Figure 17. The stress triaxiality of the element was first calculated at each calculation step. The stress triaxiality was defined as the ratio of hydrostatic pressure to equivalent stress [26]. Stress triaxiality greater than −1/3 indicated that the element was under tensile stress. The plastic damage model would then be called, meaning that the plastic damage level D T was greater than 0. The material constants in the plastic damage model are listed in Table 4. Correspondingly, stress triaxiality less than −1/3 indicated that the element was under compression stress. In this case, a damage-free model would be called, meaning that the level of plastic damage, D T , was 0. The material constants in the damage-free model were obtained using isothermal compression tests [25] and are listed in Table 5.
The initial temperature for the billet during reduction pretreatment was maintained at 900 °C on the surface and above 1300 °C in the core [18]. The initial austenite grain size was assumed to be 750 μm based on the experimental results of reduction pretreatment. The coulomb friction was adopted between the billet and the roller, and the friction coefficient was assumed to be 0.3. The rolling schedule in the simulation was set to be the same as that in the reduction pretreatment experiment. Thermal and mechanical properties of the billets are given in Table 6.

5.2. Analysis of Damage Evolution during Reduction Pretreatment

After reduction pretreatment, the reduction level of each cross section was determined using point tracking [18]. Figure 18 shows the area with reduction from 10% to 27% in the rolling direction. The cross section with a 26% reduction was selected for analysis of the distribution characteristics of state variables such as temperature, strain, average grain size and plastic damage during the reduction pretreatment process.
The temperature distribution in the rolling direction during reduction pretreatment is shown in Figure 19a. The abscissa and ordinate represent the length and thickness of the billet on the longitudinal section, respectively. In the thickness direction, the temperature at the center of the billet is obviously higher than on the surface. Therefore, the center deformation resistance is low. Figure 19b shows the temperature distribution on the cross section with 26% reduction. In the width direction, the temperature at the center is about 1315 °C and the temperature on the surface is 900–950 °C.
Figure 20a shows strain distribution in the rolling direction during reduction pretreatment. The strain gradually decreases from the surface to the center in the thickness direction when the reduction level is 10%. As the reduction level increases, more pressure penetrates into the center, causing center strain to increase. As the reduction level continues to increase to 20%, the center strain becomes larger than the surface strain, which shows an obvious reduction pretreatment effect. Figure 20b shows strain distribution on the cross section with 26% reduction. The center strain is largest in the width direction, and the strain value can reach 0.6. The strain is smallest near the surface.
Figure 21a shows the distribution of average grain size in the rolling direction during reduction pretreatment. Comparing the distribution characteristics of the strain shows that strain has a great influence on grain refinement during reduction pretreatment. The average grain size gradually increases from the surface to the center in the thickness direction when the reduction level is 10%. When the reduction level increases to 18%, the average grain size is refined to 260 μm and uniformly distributed at the center. As the reduction level increases beyond 20%, the average grain size at the center becomes smaller than the average grain size near the surface. Figure 21b shows the distribution of average grain size on the cross section with 26% reduction. The average grain size at the center is smallest in the width direction, while the average grain size is largest near the surface. The distribution characteristics of average grain size in the simulation and the experiments were consistent.
Figure 22a shows the distribution of plastic damage in the rolling direction after reduction pretreatment. In the thickness direction, the damage increases gradually from the surface to the center. As reduction increases, both the damage value and the damage area increase. Comparing the distribution of the strain and temperature showed that plastic damage is more likely to occur under great strain and high temperature. Dynamic recrystallization at the center can refine grains and slow down dislocation movement, but grain boundary slip at the center gradually replaces the dislocation movement. The growth rate of grain boundary damage caused by grain boundary slip is greater than that of inclusion damage controlled by dislocation movement. As reduction increases beyond 20%, plastic damage accumulates rapidly. As the reduction increases to 26%, the damage at the center reaches 0.7 and microcracks appear. Figure 22b shows the distribution of plastic damage on the cross section with 26% reduction. In the width direction, the damage at the center reaches 0.7 and microcracks appear. Deformation is smallest near the surface, with almost no plastic damage. The distribution characteristics of plastic damage in the simulations and experiments were consistent.

6. Conclusions

In the present study, formation mechanism and evolution of damage during reduction pretreatment were investigated using experiments and simulations. The main conclusions reached are as follows:
(1)
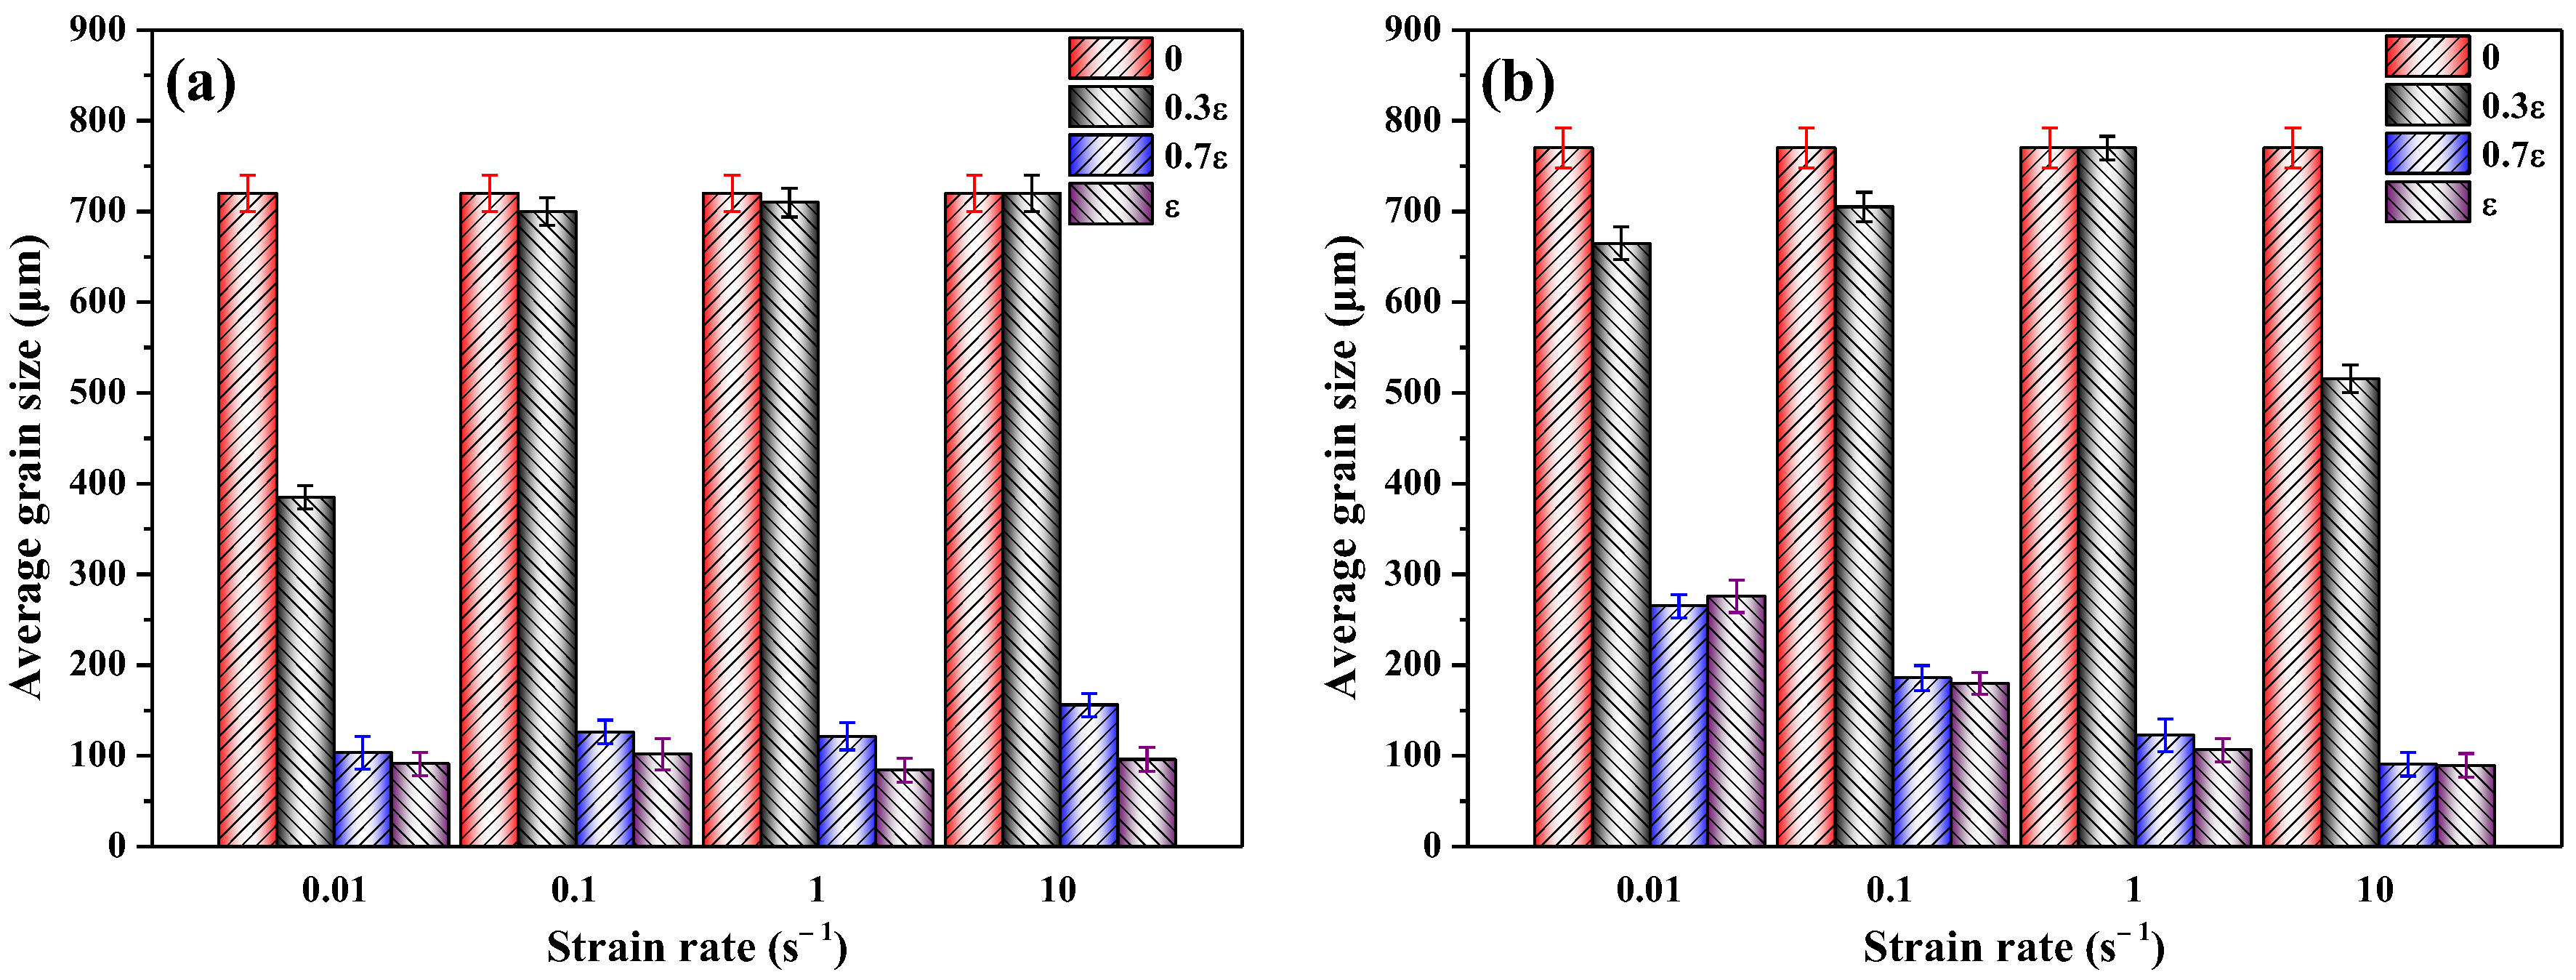
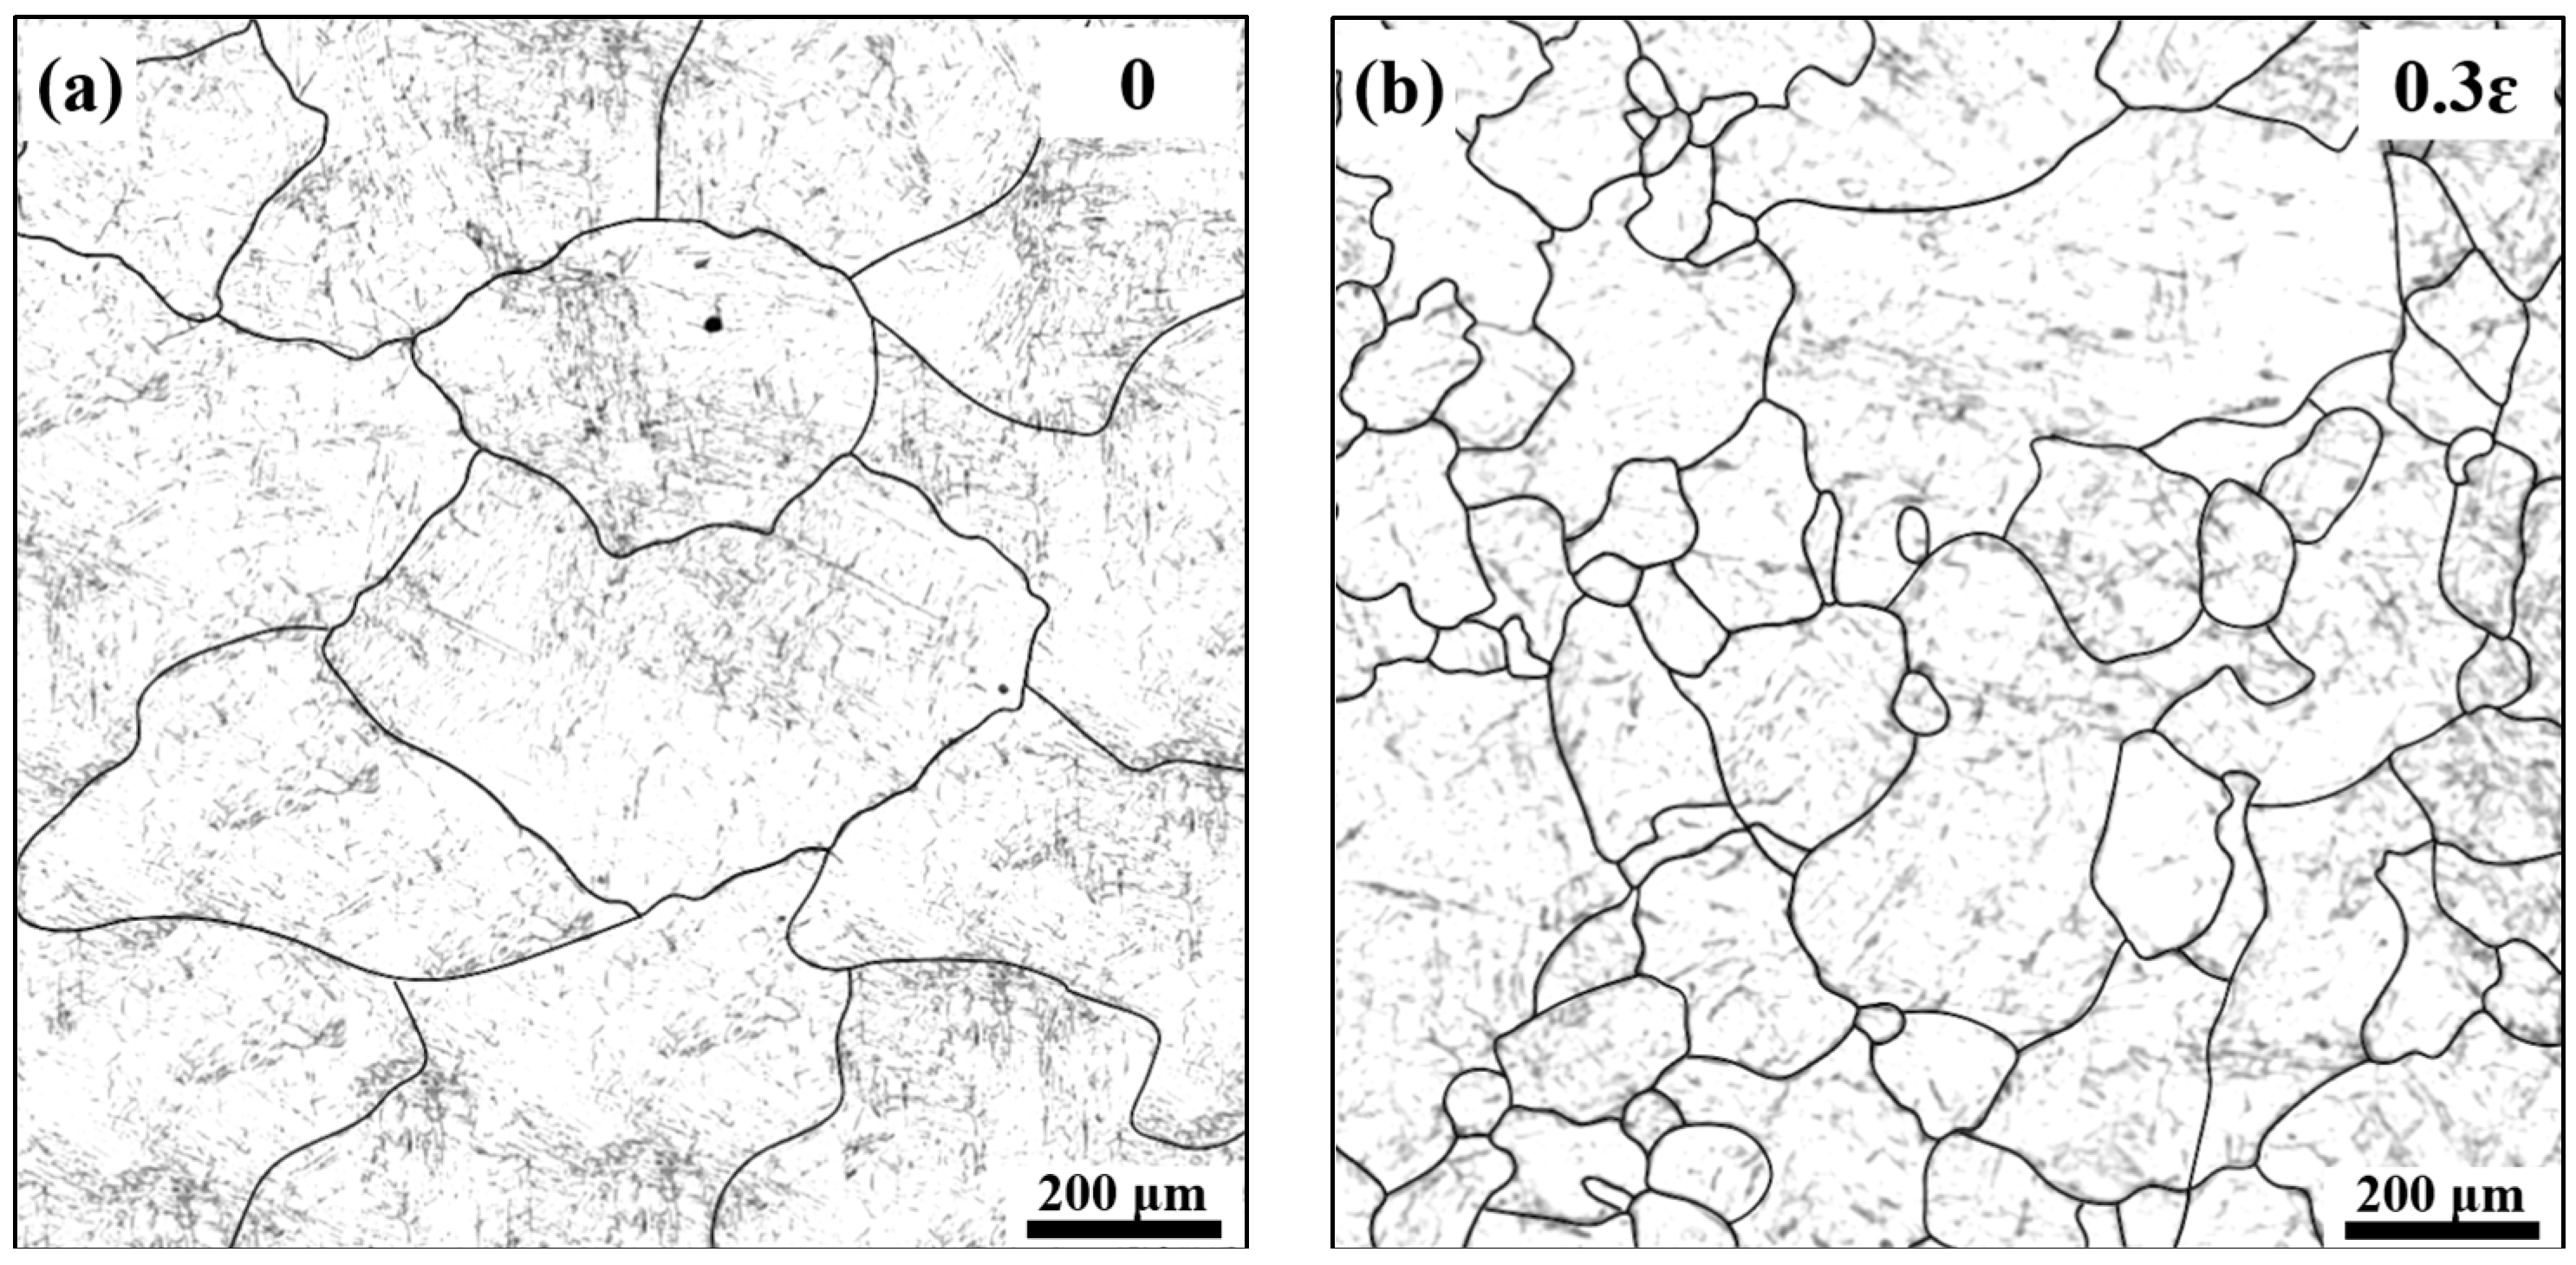
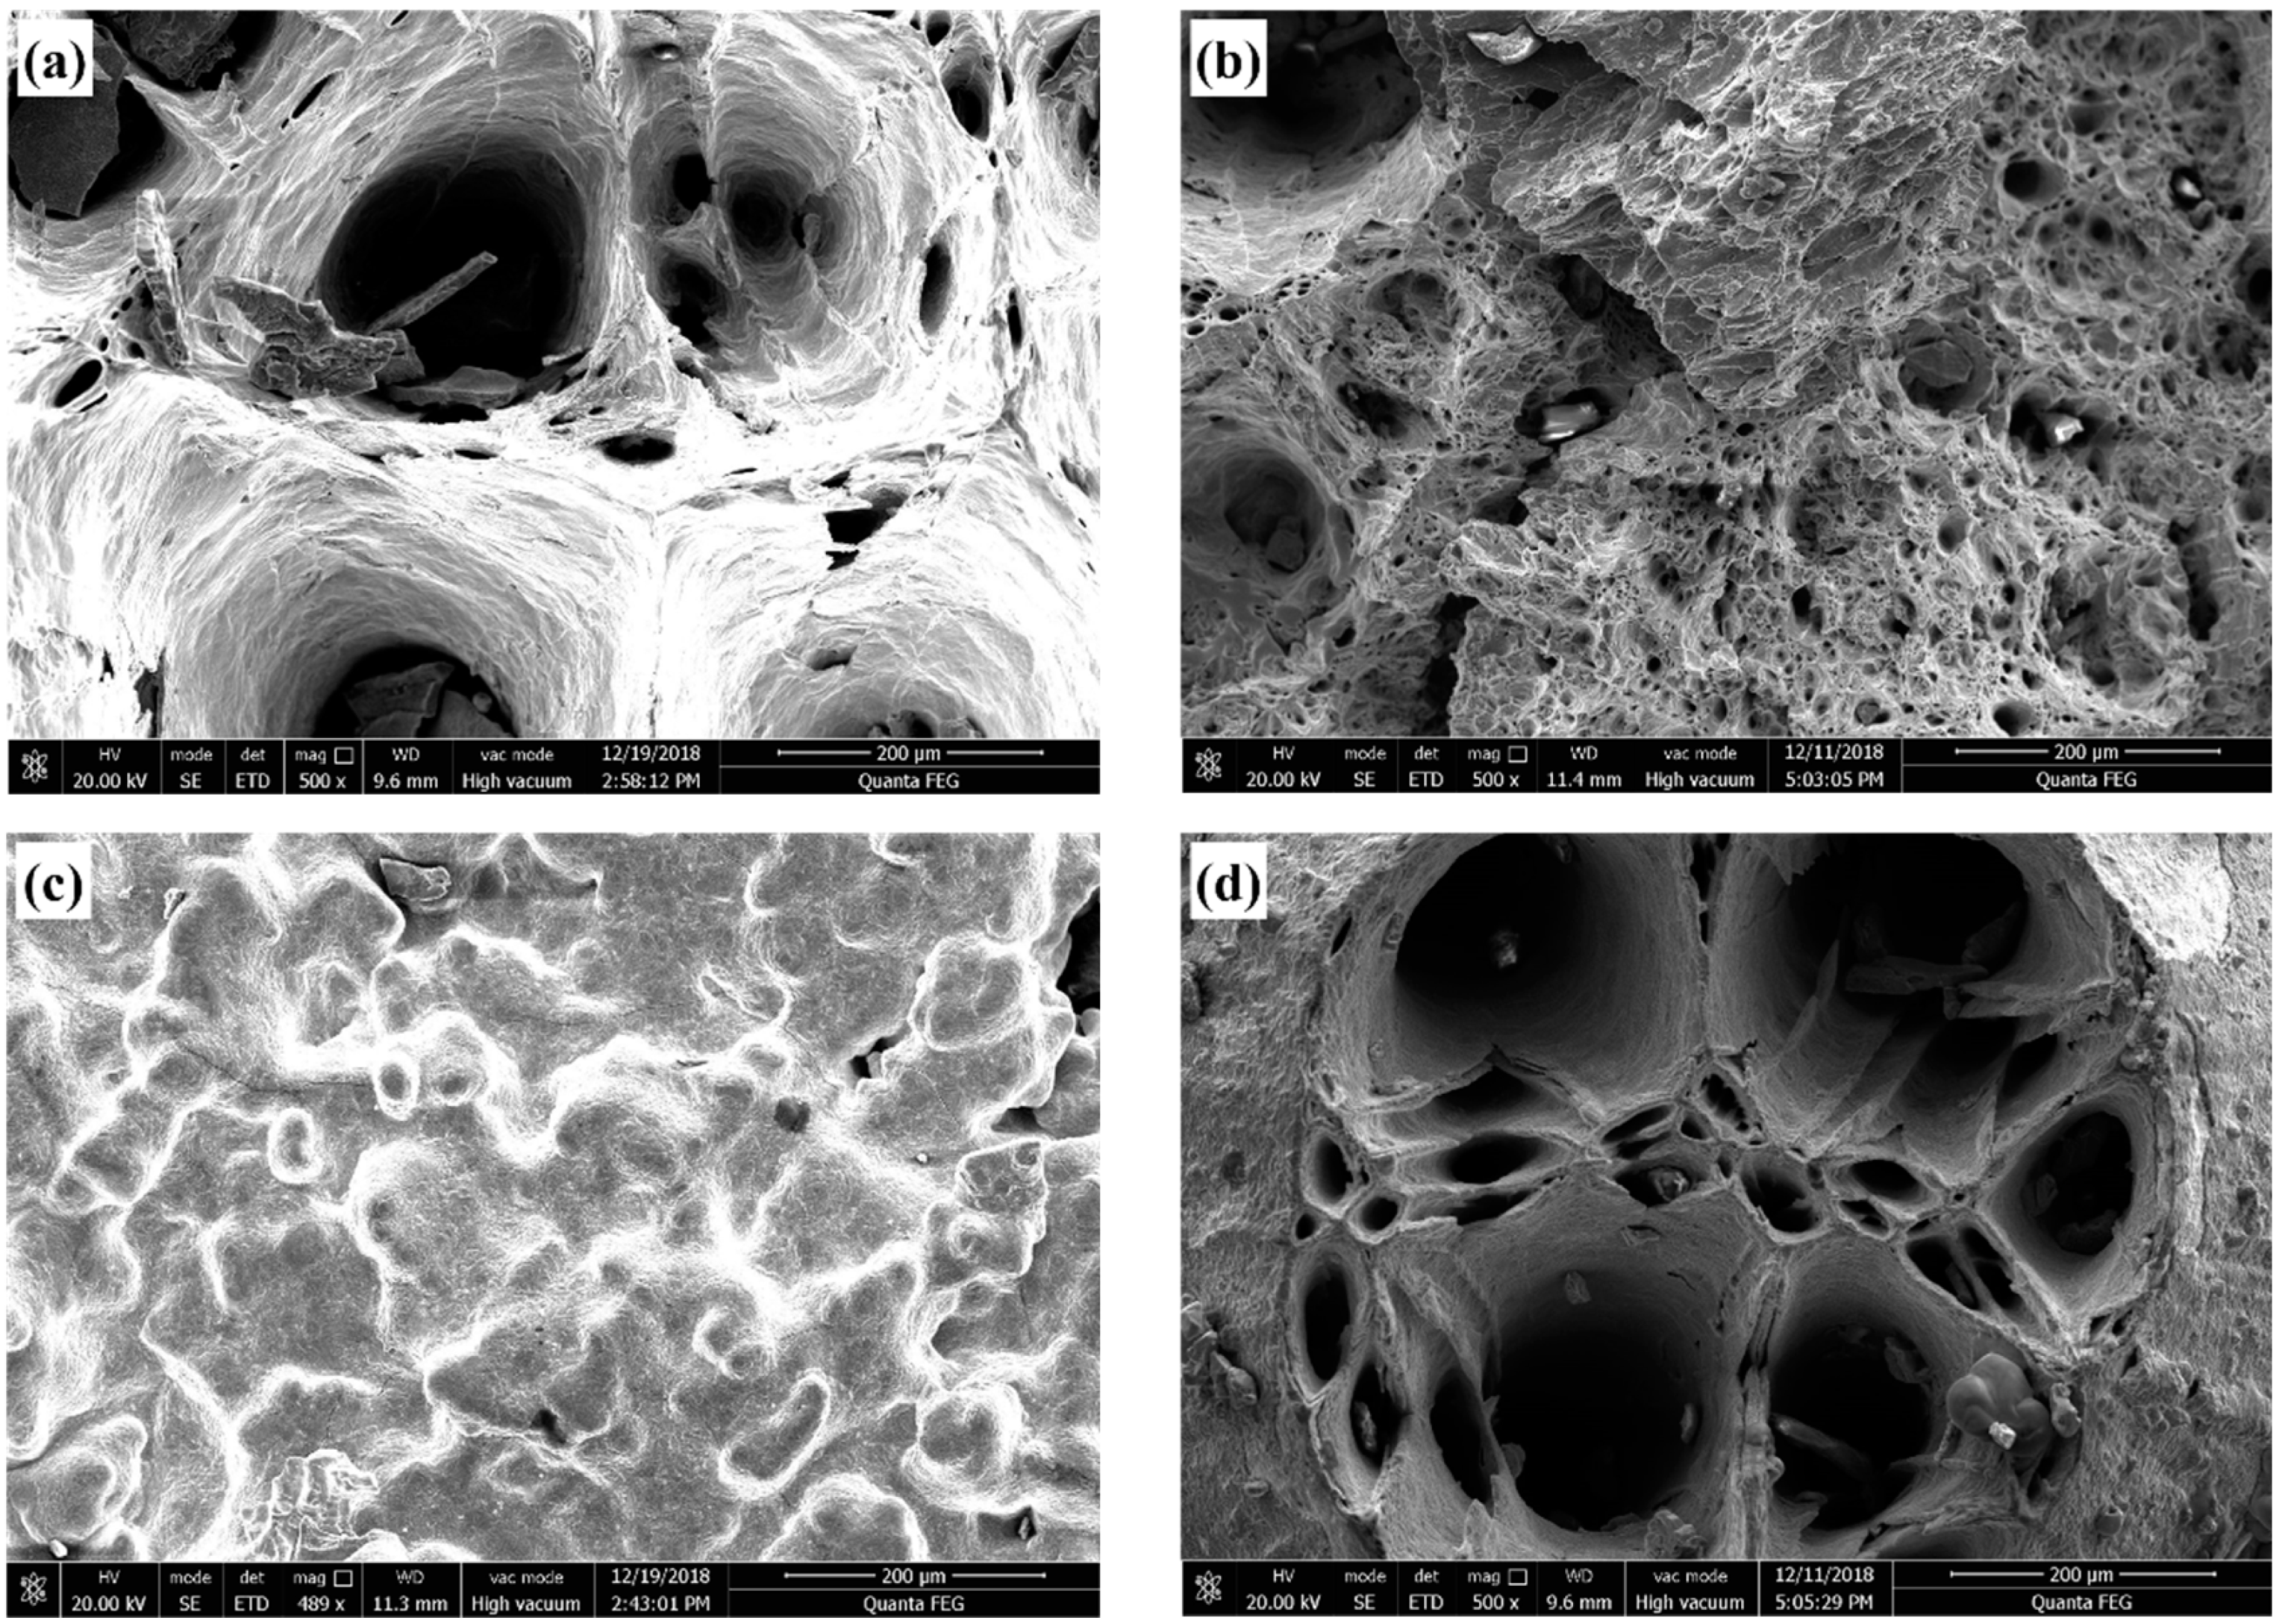
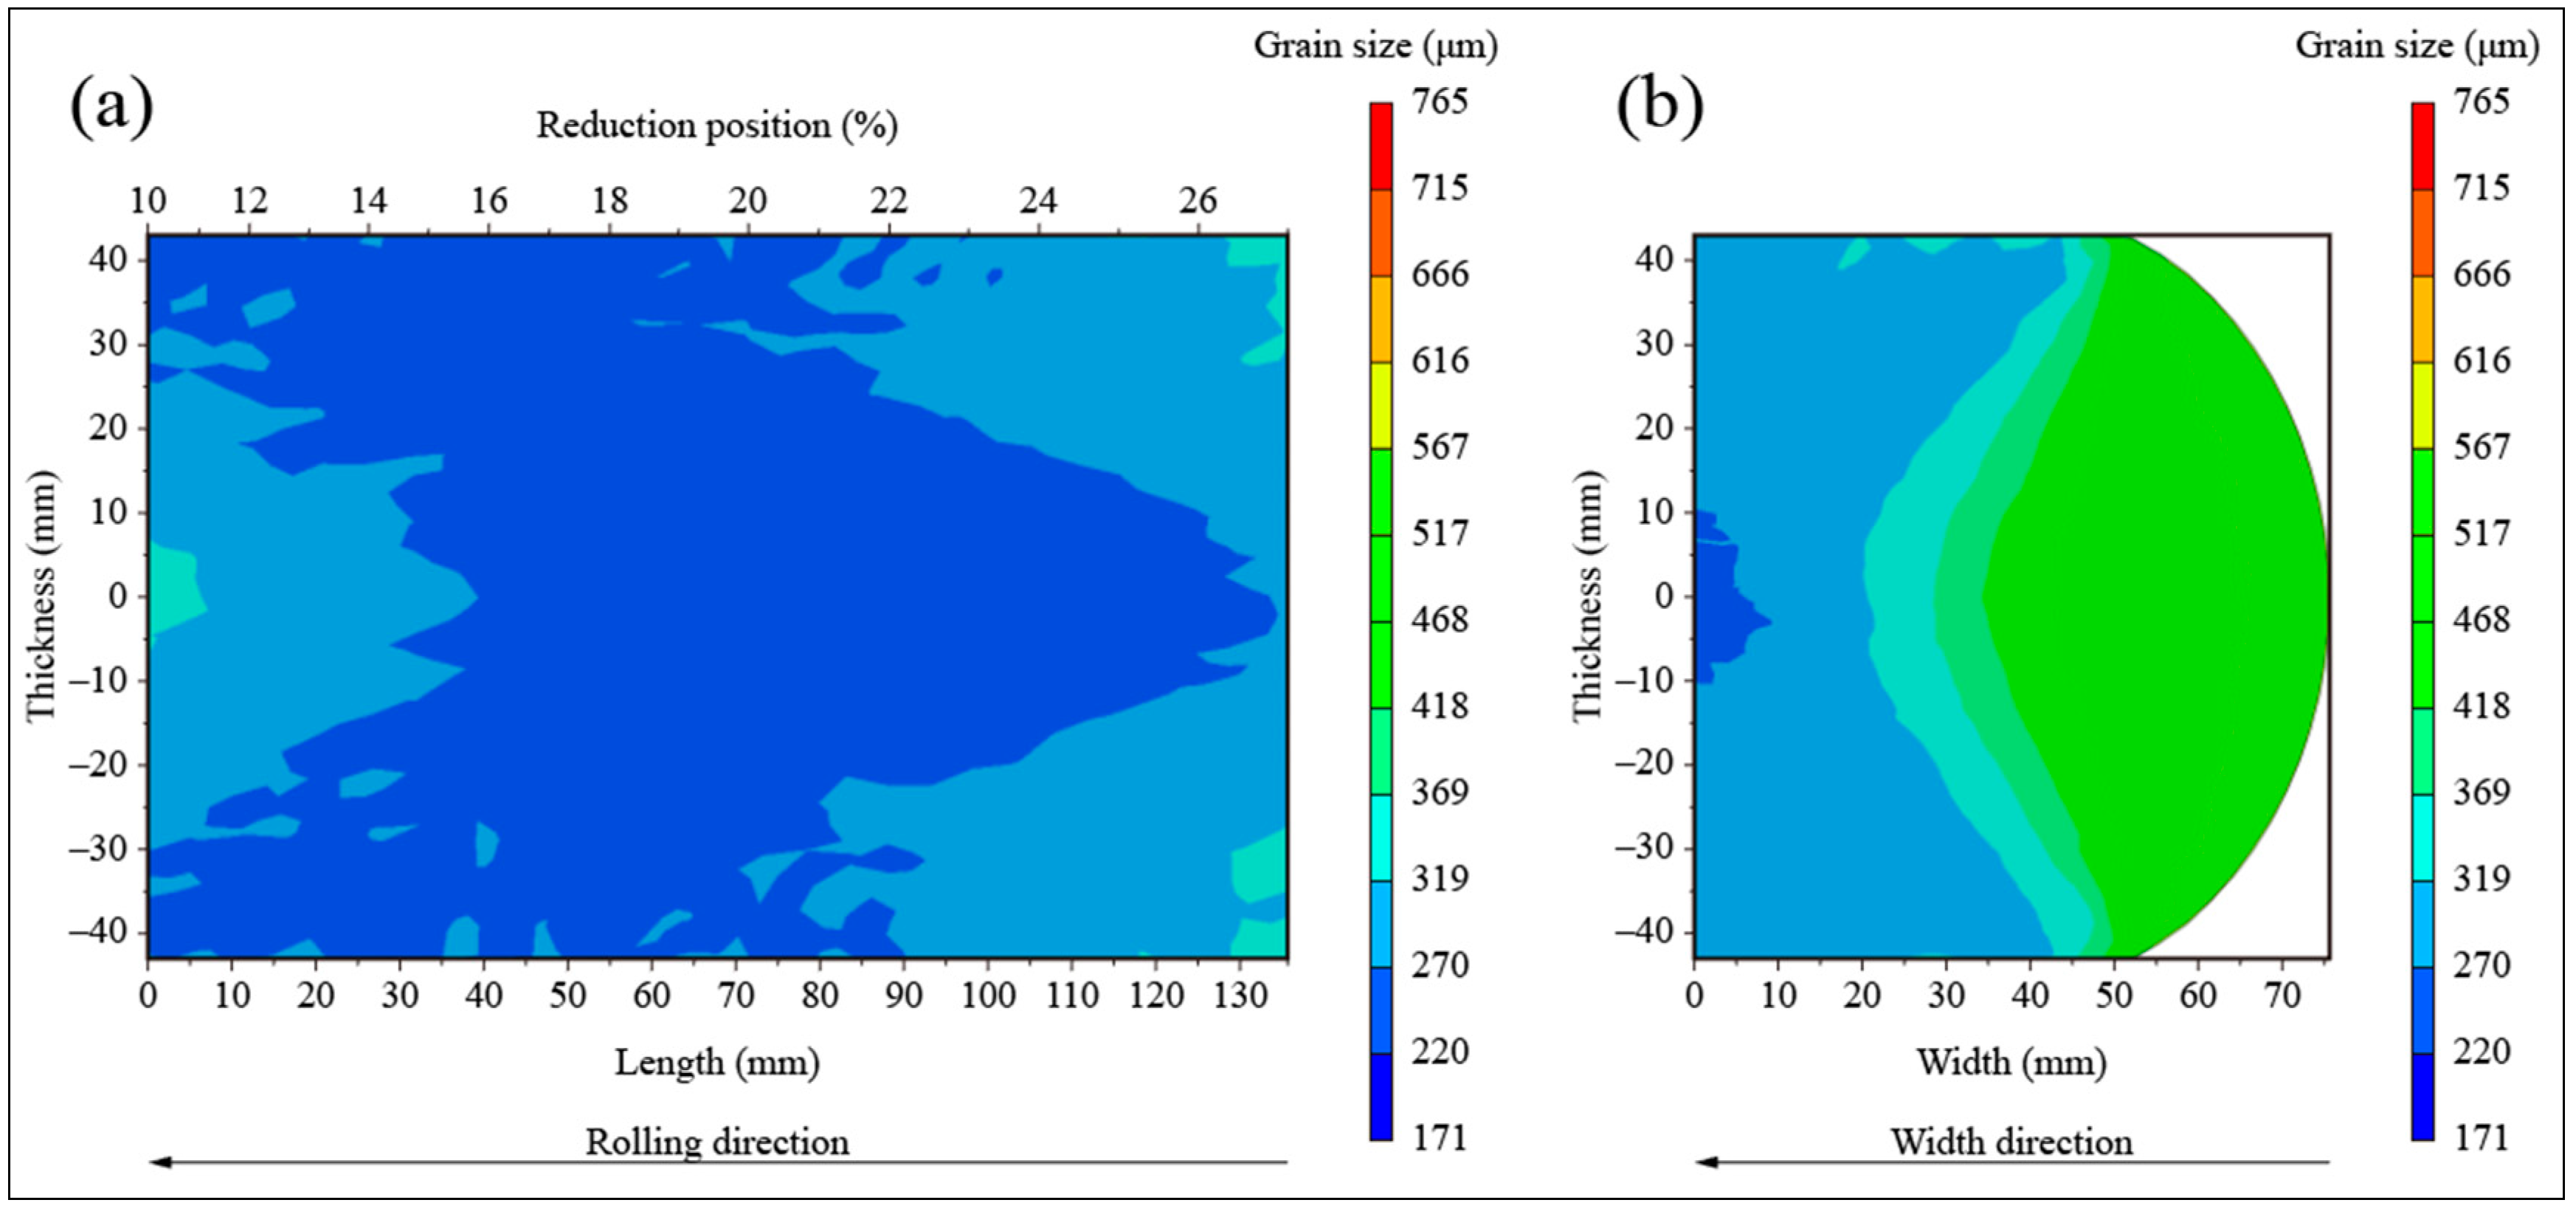
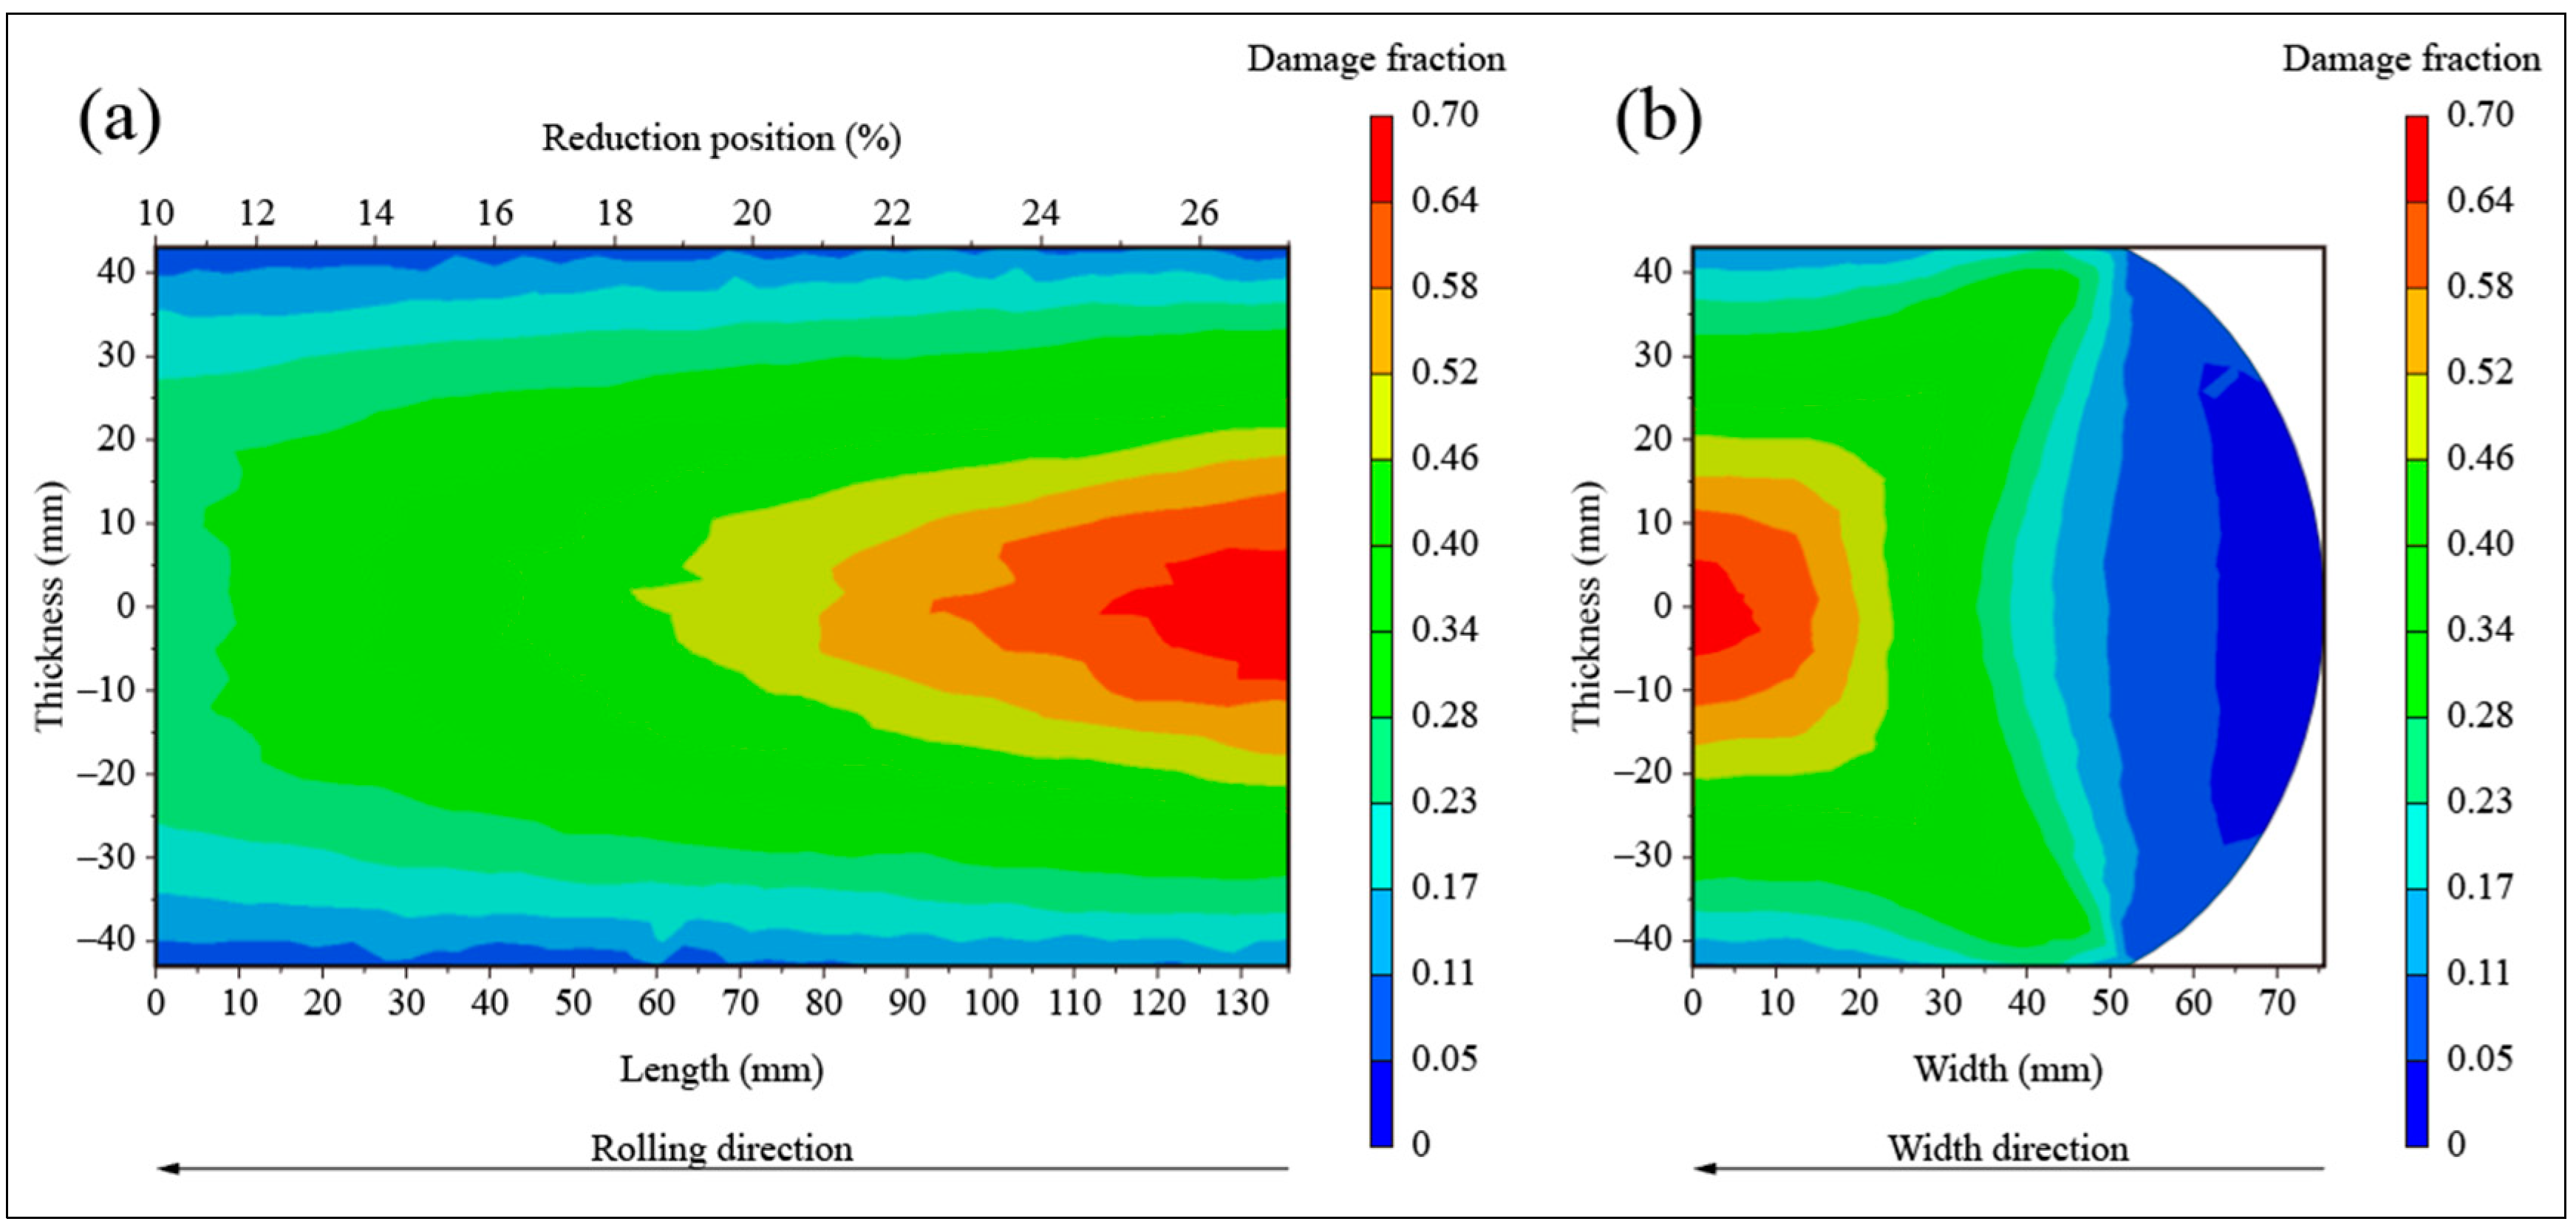
Austenite grain refinement at the center of the billet is obvious following reduction pretreatment. Microvoid damage occurs near the surface of the billet. Both microvoid and grain boundary damage are found at the quarter. The plastic damage at the center is mainly grain boundary damage and many star-shaped microcracks are produced along the grain boundary.
(2)
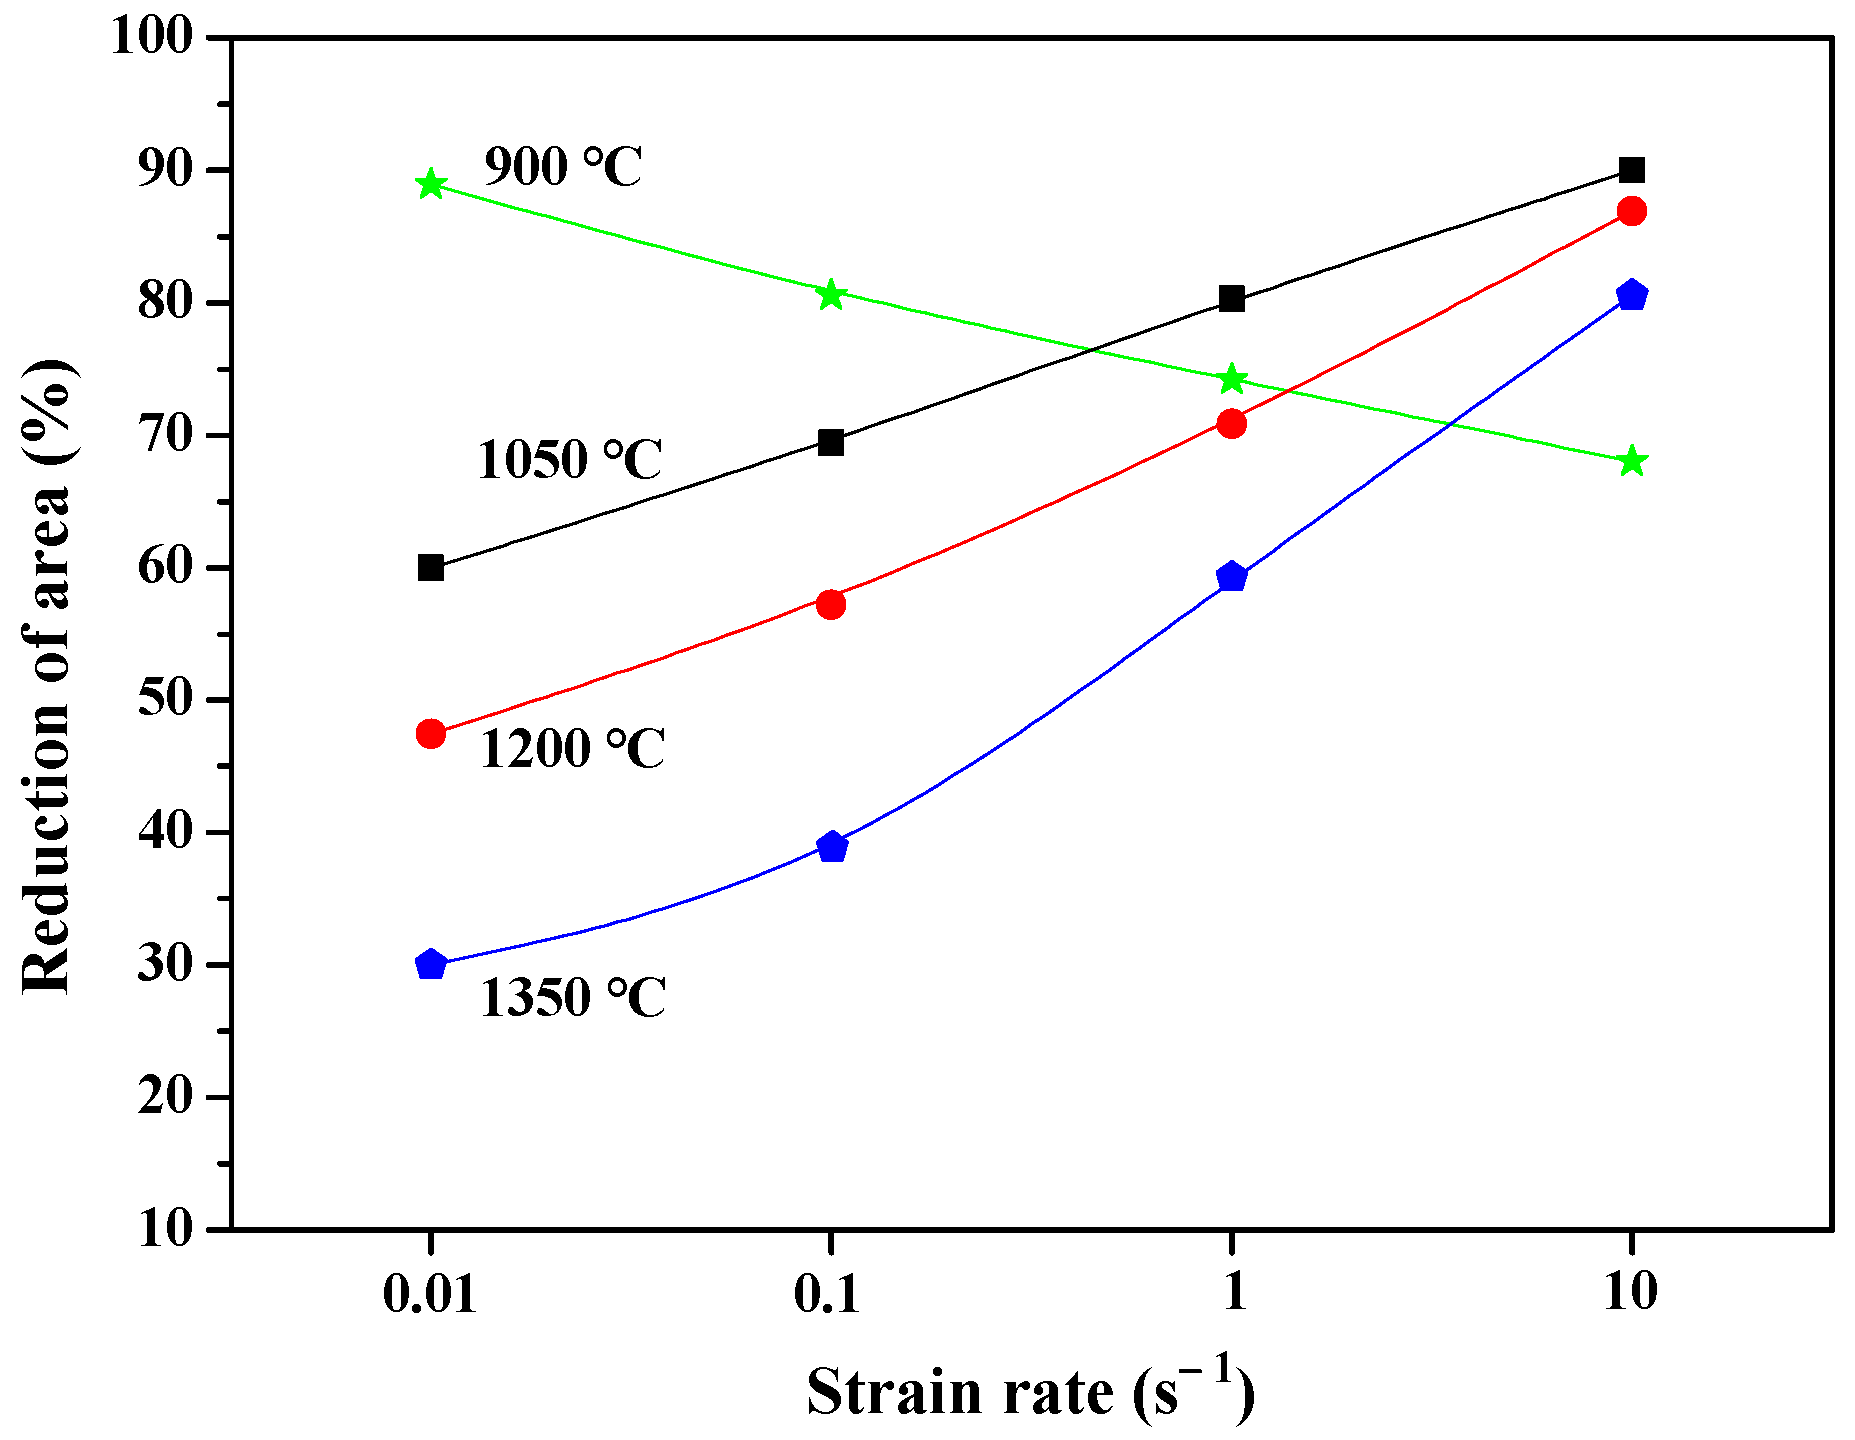
The plastic damage occurring at 900 °C is inclusion damage caused by dislocation movement. Dislocations accumulate rapidly as strain rate increases, leading to nucleation and increased damage. When the temperature reaches above 1050 °C, the plastic damage is transformed from grain boundary damage caused by grain boundary slip to inclusion damage as strain rate increases.
(3)
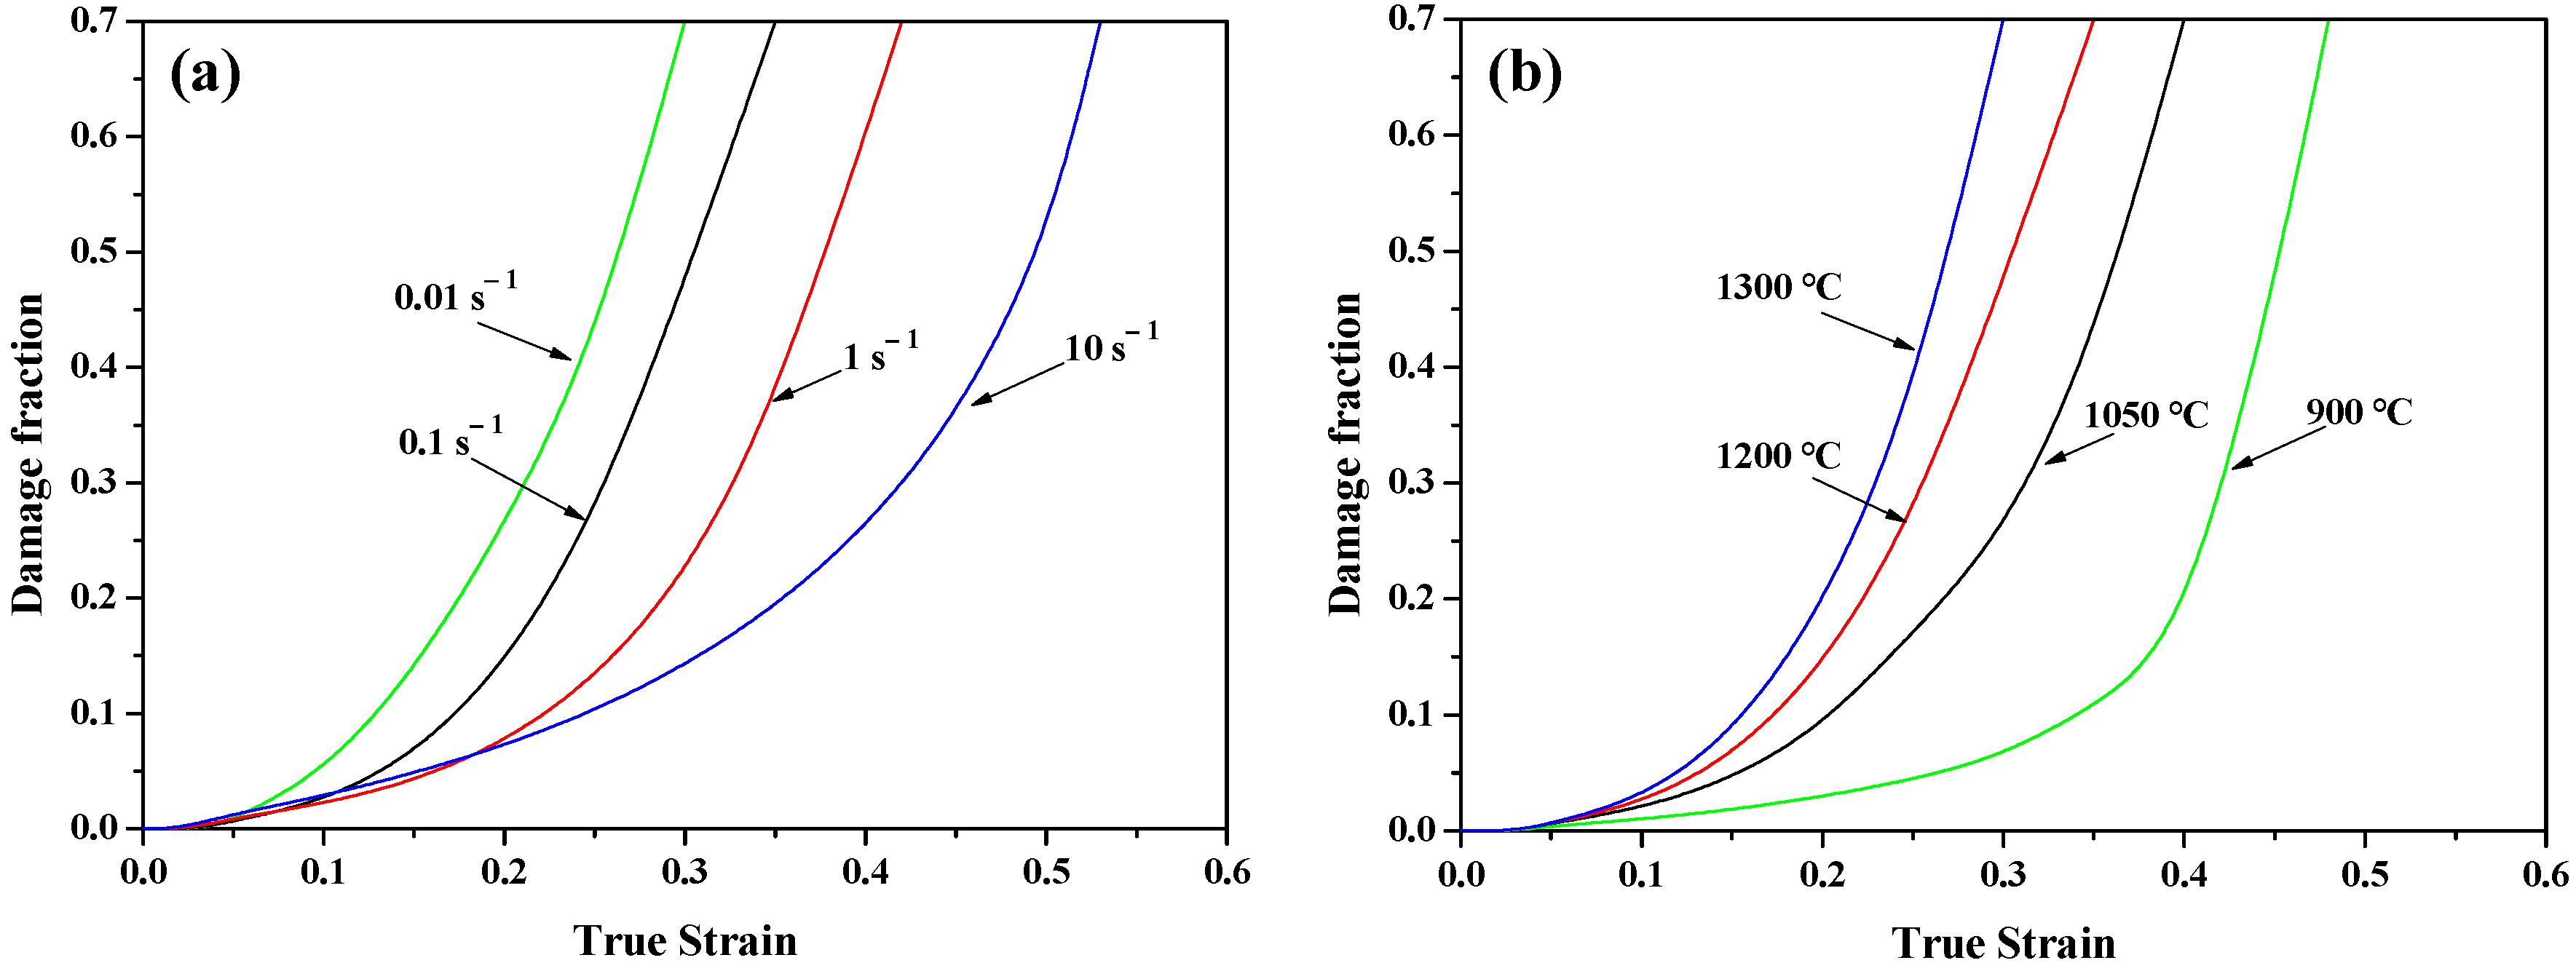
The established plastic damage model, which takes into account the interaction between different physical variables, can be used to perfectly describe damage evolution under different deformation temperatures and strain rates. The growth rate of plastic damage differs at different deformation stages. Therefore, plastic damage curves with different strain rates have intersection points.
(4)
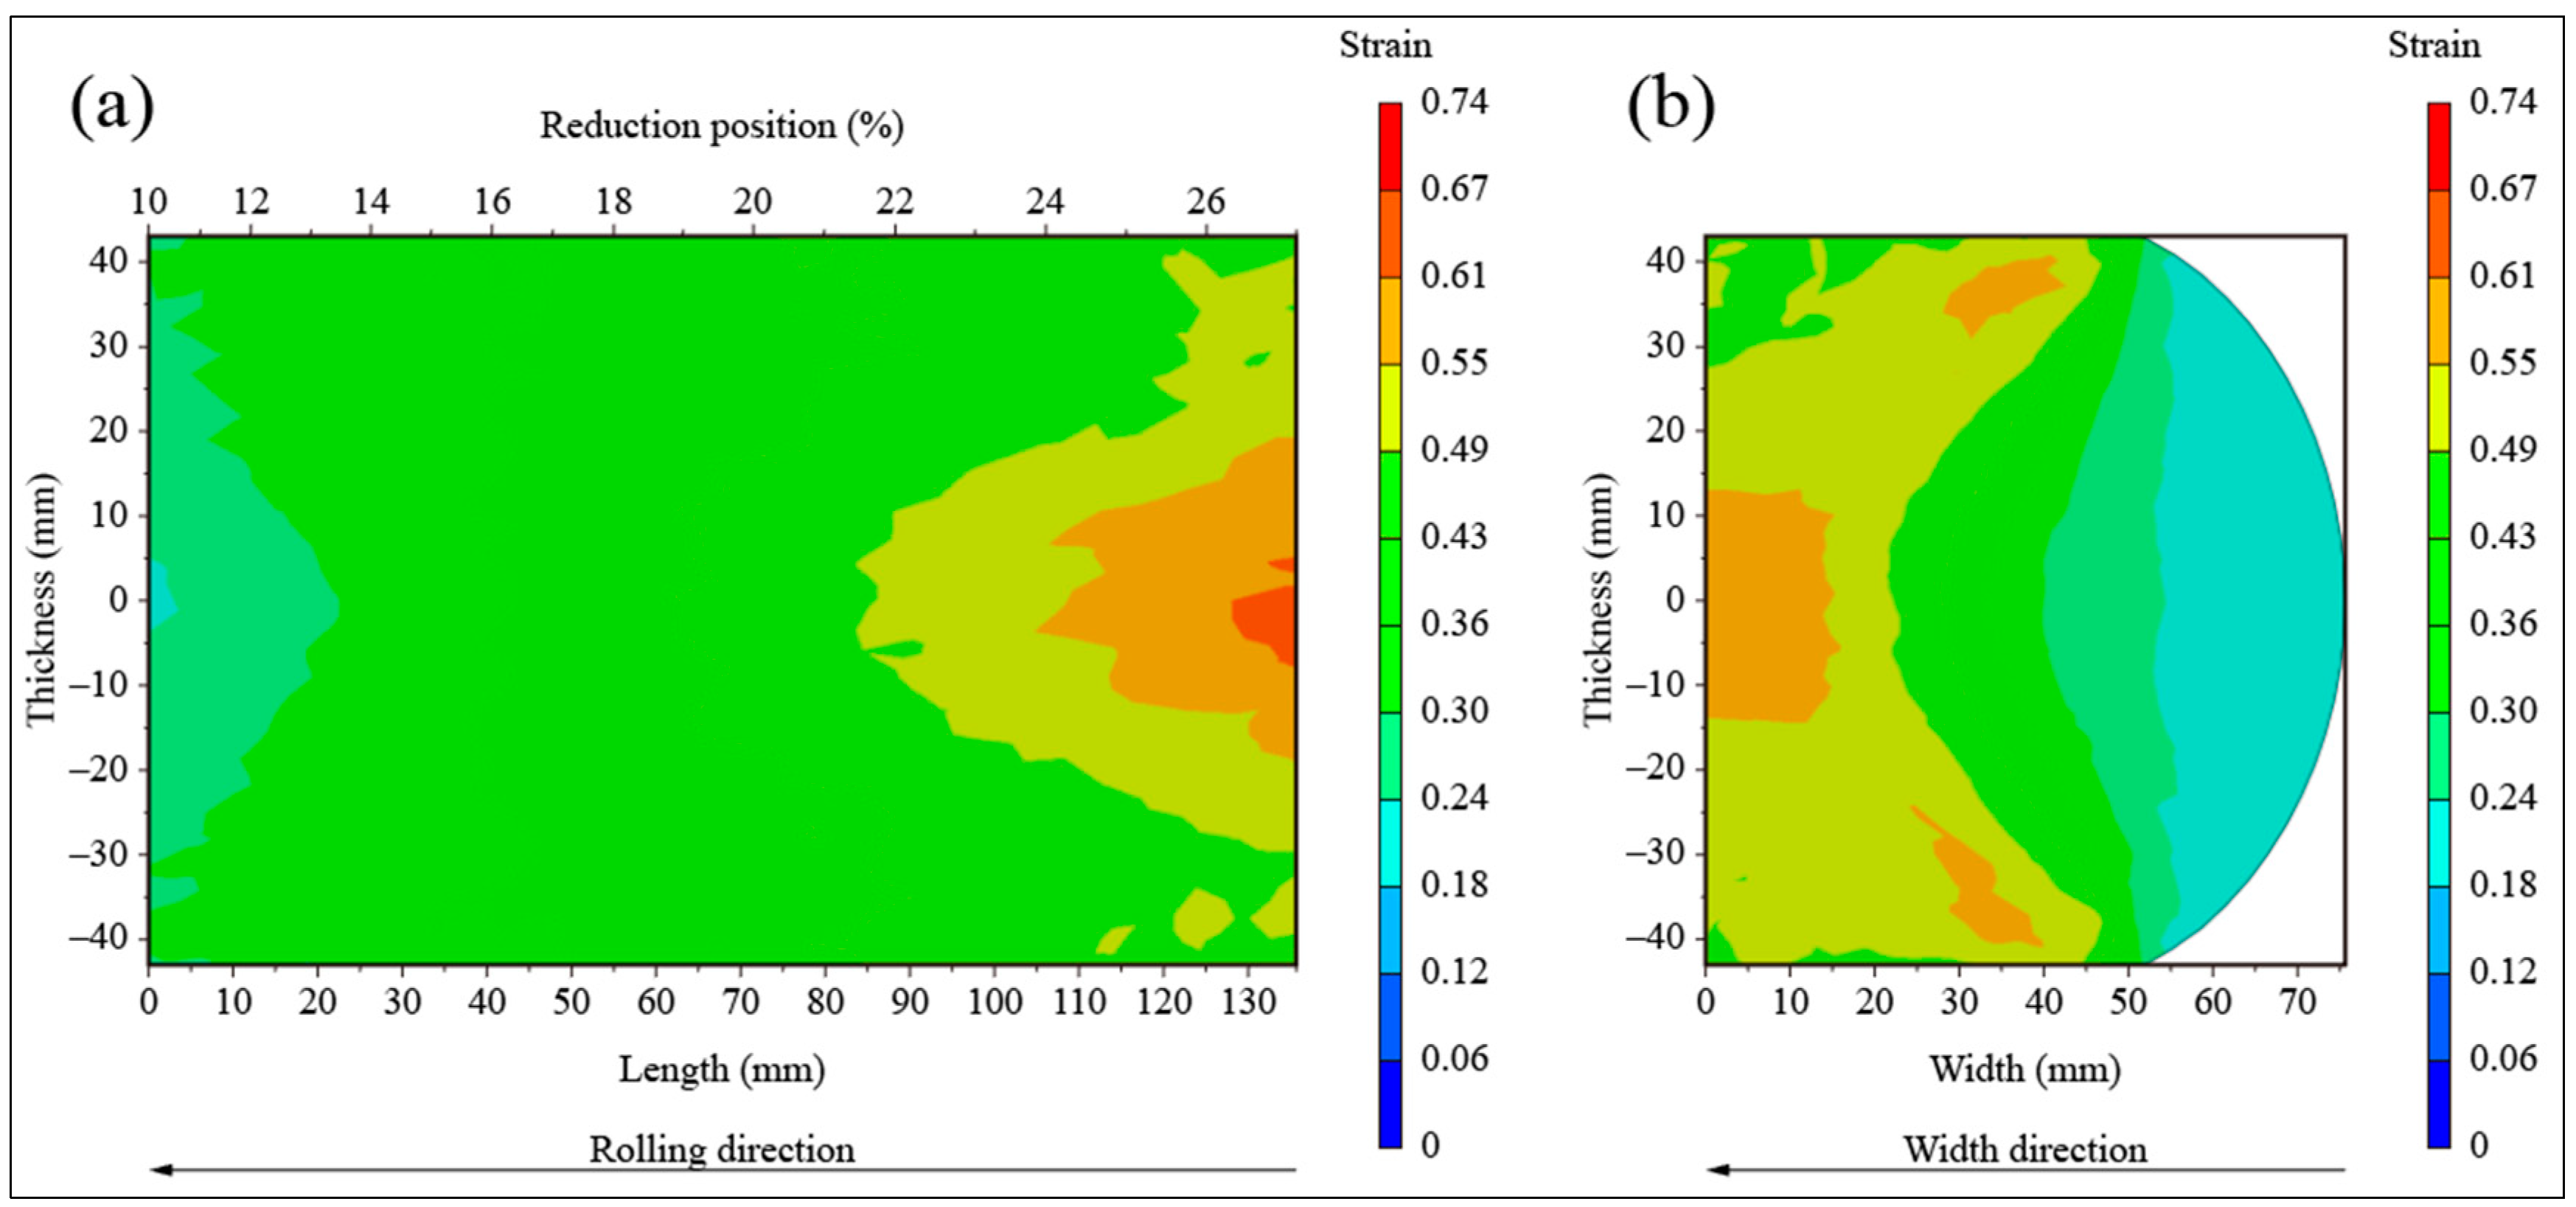
The results of the simulations show that the established plastic damage model is reliable and can be used to describe plastic damage evolution during reduction pretreatment. As reduction exceeds 20%, the strain at the center becomes greater than the strain near the surface. Although DRX at the center can refine grains and slow down the dislocation movement, grain boundary damage caused by grain boundary slip accumulates rapidly. As reduction increases to 26%, the damage at the center reaches 0.7 and microcracks appear.

Author Contributions

Conceptualization, Y.L. and J.L.; methodology, Y.L. and J.L.; software, Y.L.; validation, Y.L., J.L. and Y.H.; formal analysis, Y.L.; investigation, Y.L. and Y.H.; resources, Y.L., J.L. and Y.H.; data curation, Y.L., J.L. and Y.H.; writing original draft preparation, Y.L.; writing review and editing, Y.L.; visualization, Y.L.; supervision, J.L. and Y.H.; project administration, J.L. and Y.H.; funding acquisition, J.L. and Y.H. All authors have read and agreed to the published version of the manuscript.

Funding

This work was funded by the National Key Research and Development Program of China (2021YFE0113200) and the Fundamental Research Funds for the Central Universities (FRF-TP-20-104A1).

Institutional Review Board Statement

Not applicable.

Informed Consent Statement

Not applicable.

Data Availability Statement

Not applicable.

Acknowledgments

The authors would like to thank the National Engineering Research Center for Advanced Rolling and Intelligent Manufacturing, University of Science and Technology, Beijing, for providing technical support.

Conflicts of Interest

The authors declare no conflict of interest.

References

  1. Dezecot, S.; Maurel, V.; Buffiere, J.Y.; Szmytka, F.; Koster, A. 3D characterization and modeling of low cycle fatigue damage mechanisms at high temperature in a cast aluminum alloy. Acta Mater. 2017, 123, 24–34. [Google Scholar] [CrossRef]
  2. Bao, J.; Wu, S.; Withers, P.J.; Wu, Z.; Li, F.; Fu, Y.; Sun, W. Defect evolution during high temperature tension-tension fatigue of SLM AISi10Mg alloy by synchrotron tomography. Mater. Sci. Eng. A 2020, 792, 139809. [Google Scholar] [CrossRef]
  3. Li, H.; Gong, M.; Li, T.; Wang, Z.; Wang, G. Effects of hot-core heavy reduction rolling during continuous casting on microstructures and mechanical properties of hot-rolled plates. J. Mater. Process. Technol. 2020, 283, 116708. [Google Scholar] [CrossRef]
  4. Liu, H.; Cheng, Z.; Yu, W.; Cai, Q. Recrystallization and diffusion mechanisms of segregation improvement in cast billets by high temperature reduction pretreatment. Mater. Res. Express 2021, 8, 046539. [Google Scholar] [CrossRef]
  5. Ning, Z.; Yu, W.; Liu, H.; Cai, Q. Effect of reduction pretreatment process on evolution of micro-porosity in 42CrMo billet. J. Iron Steel Res. Int. 2021, 28, 413–423. [Google Scholar] [CrossRef]
  6. Liu, H.; Cheng, Z.; Yu, W.; Zhou, Z.; Cheng, L.; Cai, Q. Effect of high-temperature reduction pretreatment on internal quality of 42CrMo casting billet. J. Iron Steel Res. Int. 2021, 28, 693–702. [Google Scholar] [CrossRef]
  7. Ning, Z.; Li, X.; Liu, H.; Cai, Q.; Yu, W. Experimental and Simulation Study on the Effect of Reduction Pretreatment on the Void Healing of Heavy Plate. Metals 2022, 12, 400. [Google Scholar] [CrossRef]
  8. Liu, H.; Cheng, Z.; Yu, W.; Wang, G.; Zhou, J.; Cai, Q. Deformation behavior and constitutive equation of 42crmo steel at high temperature. Metals 2021, 11, 1614. [Google Scholar] [CrossRef]
  9. Kadkhodapour, J.; Butz, A.; Ziaei Rad, S. Mechanisms of void formation during tensile testing in a commercial, dual-phase steel. Acta Mater. 2011, 59, 2575–2588. [Google Scholar] [CrossRef]
  10. Lin, J.; Liu, Y.; Dean, T.A. A review on damage mechanisms, models and calibration methods under various deformation conditions. Int. J. Damage Mech. 2005, 14, 299–319. [Google Scholar] [CrossRef]
  11. Sabih, A.; Nemes, J.A. Internal ductile failure mechanisms in steel cold heading process. J. Mater. Process. Technol. 2009, 209, 4292–4311. [Google Scholar] [CrossRef]
  12. Teng, X.; Wierzbicki, T.; Hiermaier, S.; Rohr, I. Numerical prediction of fracture in the taylor test. Int. J. Solids Struct. 2005, 42, 2929–2948. [Google Scholar] [CrossRef]
  13. Malcher, L.; Andrade Pires, F.M.; César De Sá, J.M.A. An extended GTN model for ductile fracture under high and low stress triaxiality. Int. J. Plast. 2014, 54, 193–228. [Google Scholar] [CrossRef]
  14. Cao, T.S.; Mazière, M.; Danas, K.; Besson, J. A model for ductile damage prediction at low stress triaxialities incorporating void shape change and void rotation. Int. J. Solids Struct. 2015, 63, 240–263. [Google Scholar] [CrossRef]
  15. Ambroziak, A. Identification and validation of damage parameters for elasto-viscoplastic chaboche model. Eng. Trans. 2007, 55, 3–28. [Google Scholar] [CrossRef]
  16. Cao, T.S.; Gachet, J.M.; Montmitonnet, P.; Bouchard, P.O. A lode-dependent enhanced lemaitre model for ductile fracture prediction at low stress triaxiality. Eng. Fract. Mech. 2014, 124–125, 80–96. [Google Scholar] [CrossRef]
  17. Lin, J.; Mohamed, M.; Balint, D.; Dean, T.A. The development of continuum damage mechanics-based theories for predicting forming limit diagrams for hot stamping applications. Int. J. Damage Mech. 2014, 23, 684–701. [Google Scholar] [CrossRef]
  18. Liu, Y.; Liu, J.; He, Y. Evolution behavior and closure mechanism of porosity in large billet during the reduction pretreatment. Metals 2022, 12, 599. [Google Scholar] [CrossRef]
  19. Huo, Y.; Lin, J.; Bai, Q.; Wang, B.; Tang, X.; Ji, H. Prediction of microstructure and ductile damage of a high-speed railway axle steel during cross wedge rolling. J. Mater. Process. Technol. 2017, 239, 359–369. [Google Scholar] [CrossRef]
  20. Mohamed, M.S.; Foster, A.D.; Lin, J.; Balint, D.S.; Dean, T.A. Investigation of deformation and failure features in hot stamping of AA6082: Experimentation and modelling. Int. J. Mach. Tools Manuf. 2012, 53, 27–38. [Google Scholar] [CrossRef]
  21. Lin, J.; Dean, T.A. Modelling of microstructure evolution in hot forming using unified constitutive equations. J. Mater. Process. Technol. 2005, 167, 354–362. [Google Scholar] [CrossRef]
  22. Lin, J.; Liu, Y.; Farrugia, D.C.J.; Zhou, M. Development of dislocation-based unified material model for simulating microstructure evolution in multipass hot rolling. Philos. Mag. 2005, 85, 1967–1987. [Google Scholar] [CrossRef]
  23. Lin, J.; Liu, Y. A set of unified constitutive equations for modelling microstructure evolution in hot deformation. J. Mater. Process. Technol. 2003, 143–144, 281–285. [Google Scholar] [CrossRef]
  24. Lin, J.; Yang, J. GA-based multiple objective optimization for determining viscoplastic constitutive equations for superplastic alloys. Int. J. Plast. 1999, 15, 1181–1196. [Google Scholar] [CrossRef]
  25. Liu, Y.; Liu, J.; He, Y. Microstructure evolution in large billet during reduction pretreatment based on laboratory experiments. J. Iron Steel Res. Int. 2022, 3, 1–14. [Google Scholar] [CrossRef]
  26. Bao, Y.; Wierzbicki, T. On the cut-off value of negative triaxiality for fracture. Eng. Fract. Mech. 2005, 72, 1049–1069. [Google Scholar] [CrossRef]
Figure 1. Schematic of the casting setup.
Metals 13 00747 g001
Figure 2. Schematic diagrams of the sampling process: (a) P1, P2 and P3 in Billet 1; (b) P4, P5 and P6 in Billet 2; (c) P7, P8 and P9 in Billet 2.
Metals 13 00747 g002
Figure 3. Experimental procedure for hot tension tests.
Metals 13 00747 g003
Figure 4. Distribution characteristics of the microstructure and plastic damage in experimental billets with and without reduction: (a) P1, (b) P2, (c) P3, (d) P4, (e) P5, (f) P6, (g) P7, (h) P8, (i) P9.
Metals 13 00747 g004
Figure 5. True flow stress curves of tension specimens under different strain rates and deformation temperatures: (a) 900 °C, (b) 1050 °C, (c) 1200 °C, (d) 1350 °C.
Metals 13 00747 g005
Figure 6. Average grain sizes of the tension specimens at different strain rates and deformation temperatures: (a) 900 °C, (b) 1200 °C.
Metals 13 00747 g006
Figure 7. Microstructures of tension specimens with different strains at a temperature of 1200 °C and a strain rate of 0.01 s−1: (a) 0, (b) 0.3ɛ, (c) 0.7ɛ, (d) ɛ.
Metals 13 00747 g007aMetals 13 00747 g007b
Figure 8. Reduction of area of tension specimens at different temperatures and strain rates.
Metals 13 00747 g008
Figure 9. Fracture morphologies of the specimens at 900 °C (a) 0.01 s−1, (b) 10 s−1; and at 1200 °C (c) 0.01 s−1, (d) 10 s−1.
Metals 13 00747 g009
Figure 10. Microstructure of tension specimen at a temperature of 900 °C and a strain rate of 0.1 s−1: (a) inclusion damage; (b) MnS inclusions and EDS.
Metals 13 00747 g010
Figure 11. Microstructure of tension specimen at a temperature of 1200 °C and a strain rate of 0.1 s−1: (a) grain boundary damage; (b) detailed view of the damage.
Metals 13 00747 g011
Figure 12. Comparison of experimental (symbols) and computed (solid curves) flow stress values measured at deformation temperatures of (a) 900 °C and (b) 1200 °C.
Metals 13 00747 g012
Figure 13. Comparison of experimental (symbols) and computed (solid curves) values of average grain sizes measured at deformation temperatures of (a) 900 °C and (b) 1200 °C.
Metals 13 00747 g013
Figure 14. Plastic damage evolution curves under different deformation conditions: (a) 1200 °C; (b) 0.1 s−1.
Metals 13 00747 g014
Figure 15. Correlation between experimental and calculated flow stress.
Metals 13 00747 g015
Figure 16. FEM model of reduction pretreatment.
Metals 13 00747 g016
Figure 17. Element stress state during reduction pretreatment.
Metals 13 00747 g017
Figure 18. Analysis area during reduction pretreatment (a) in the rolling direction and (b) the cross section with a 26% reduction.
Metals 13 00747 g018
Figure 19. Distribution characteristics of temperature (a) in the rolling direction and (b) the cross section with 26% reduction.
Metals 13 00747 g019
Figure 20. Distribution characteristics of the strain (a) in the rolling direction and (b) the cross section with 26% reduction.
Metals 13 00747 g020
Figure 21. Distribution characteristics of average grain size (a) in the rolling direction and (b) the cross section with 26% reduction.
Metals 13 00747 g021
Figure 22. Distribution characteristics of plastic damage (a) in the rolling direction and (b) the cross section with 26% reduction.
Metals 13 00747 g022
Table 1. Chemical compositions of experimental billets (mass %).
CMnSiSPFe
Billet 10.401.480.500.00640.0055BAL
Billet 20.401.500.490.00600.0050BAL
Table 2. Temperature-dependent parameters.
π 1 = π 10 e x p ( Q π 1 / ( R g T ) ) π 2 = π 20 e x p ( Q π 2 / ( R g T ) )
k = k 10 e x p ( Q k / ( R g T ) ) A 1 = A 10 e x p ( Q a / ( R g T ) )
ρ c = ρ c 0 e x p ( Q c 0 / ( R g T ) ) H 1 = H 10 e x p ( Q h / ( R g T ) )
B 1 = B 10 e x p ( Q b / ( R g T ) ) C r = C r 0 e x p ( Q c / ( R g T ) )
E = E 0 e x p ( Q e / ( R g T ) ) G 1 = G 10 e x p ( Q g / ( R g T ) )
where T and R g are the absolute temperature and ideal gas constant, respectively; π 10 , k 10 , ρ c 0 , B 10 , A 10 , E 0 , π 20 , H 10 , C r 0 , G 10 , Q π 1 , Q k , Q c 0 , Q e , Q π 2 , Q a , Q b , Q h , Q g and Q c are all the material constants.
Table 3. Average austenite grain sizes at different temperatures and holding times (μm).
Temperature (°C)Holding Time (min)
0102030
90065.2076.6883.9693.44
105072.23117.5137.7160.2
120085.15164.1205.0223.5
135090.04207.2256.0280.8
Table 4. Material constants in the plastic damage model.
A 10 /s−15.80 × 104 ρ c 0 0.02 C r 0 /s−15.21 Q g /J mol−12.90 × 10⁵
Q a /J mol−11.76 × 10⁵ Q c 0 /J mol−11.34 × 10⁵ Q c /J mol−11.62 × 10⁶ d 1 /μm4.46 × 103
A 2 /MPa−12.03 λ 1 3 δ 3 1.52 ψ 1 1.84
k 10 /MPa0.51 H 10 /s−13.70 × 108 A 3 13.51 G 2 /s−190.2
Q k /J mol−14.10 × 10⁴ Q h /J mol−11.25 × 10⁵ δ 4 5.69 ψ 2 6.53
d 0 /μm160 A 4 0.30 B 10 /MPa−10.96 E 0 /GPa2.32 × 104
γ 1 0.81 δ 1 0.74 Q b /J mol−14.52 × 10⁴ Q e /J mol−11.60 × 10⁴
Q 0 /s−13.21 δ 2 2.21 G 10 /μm8.47 × 107 π 10 0.6
π 20 6.6 Q π 1 /J mol−17.45 × 10⁵ Q π 2 /J mol−12.04 × 10⁶ n 1 0.05
n 2 0.06 n 3 0.799
Table 5. Material parameters in the damage-free model.
A 10 /s−16.29 × 104 ρ c 0 0.01 C r 0 /s−16.09 Q g /J mol−12.90 × 10⁵
Q a /J mol−11.81 × 10⁵ Q c 0 /J mol−11.57 × 10⁵ Q c /J mol−11.50 × 10⁵ d 1 /μm4.46 × 103
A 2 /MPa−10.18 λ 1 2 δ 3 1.71 ψ 1 1.84
k 10 /MPa0.35 H 10 /s−13.85 × 109 A 3 13.68 G 2 /s−189.75
Q k /J mol−13.16 × 10⁴ Q h /J mol−11.39 × 10⁵ δ 4 5.47 ψ 2 7.91
d 0 /μm158.65 A 4 0.25 B 10 /MPa−10.7 E 0 /GPa2.32 × 104
γ 1 0.79 δ 1 0.68 Q b /J mol−16.39 × 10⁴ Q e /J mol−11.60 × 10⁴
Q 0 /s−12.31 δ 2 1.22 G 10 /μm8.47 × 107
Table 6. Thermal and mechanical properties of the billets.
Temperature/°C90012001400142614911500
Poisson ratio0.250.250.250.250.250.25
Density/kg m−3780077007600740070007000
Specific heat/J kg−1 K−1610670700720820840
Thermal conductivity/W m−1 K−120253033160160
Coefficient of linear thermal expansion/K−12 × 10−52 × 10−52 × 10−52 × 10−52 × 10−52 × 10−5
Disclaimer/Publisher’s Note: The statements, opinions and data contained in all publications are solely those of the individual author(s) and contributor(s) and not of MDPI and/or the editor(s). MDPI and/or the editor(s) disclaim responsibility for any injury to people or property resulting from any ideas, methods, instructions or products referred to in the content.

