Abstract
This paper presents a new experimental methodology for determining the formability limits by wrinkling in sheet metal forming using Yoshida buckling tests (YBTs). The YBT has been the most used formability test by the scientific community to determine the occurrence of wrinkling, on the one hand, due to its simple clamping configuration directly related to the kinematics of tensile tests. On the other hand, the formability test replicates the occurrence of wrinkling in deformation regions under tension, similar to the side wall wrinkling of a deep drawn part. The new physically-based methodology is built upon the direct analysis of the in-plane minor strain and its strain rate for a point located at the center of the YBT specimen. Application of the methodology in AA1050–O aluminium alloy sheets enabled the experimental determination of the onset of wrinkling. Results also showed that in contrast to conventional techniques, where the wrinkling prediction is based in a specified percentage of the initial thickness of the blank (5–10%), considering a physical wrinkle-triggering factor enables one to identify the precise moment at which wrinkling occurs. The proposed physically-based methodology provides a new level of understanding of the YBT behavior and the onset of wrinkling determination for sheet metal forming with a higher degree of accuracy.
1. Introduction
The global need to reduce energy consumption is leading manufacturing industry to transform, and one of the strategies considered by the automotive, aerospace, and aeronautical industries is the use of lightweight construction [1]. A solution to obtaining lightweight constructions is to use thinner sheet metals, which makes the material more prone to failure by tearing or wrinkling.
Thus, the identification of the failure limits by necking, fracture, and wrinkling is of major importance when designing the sheet metal forming process [2]. The determination of the onset of necking and fracture in sheet metal forming has been addressed by the scientific community leading to the definition of general failure limits [3]. However, wrinkling has been addressed by the scientific community in a case-to-case approach, and there is no generalized wrinkling limit that can be used independently of the sheet metal forming process [4].
The occurrence of wrinkling is of major relevance in the sheet forming process tools design due to its direct relation with the final geometry of the manufactured part, the processing parameters, and the active tool elements’ damage/wear [5].
The experimental determination of the onset of wrinkling has been addressed through two specimens classification:
- Typical sheet forming parts;
- Simple geometries indirectly generate a stress state that induces wrinkling.
Examples of the first class of tests include the deep drawing of cylindrical [6] or conical cups [7,8], the annular cup test [9], the spinning of a circular sheet blank [10], and in-plane roll-bending of a strip [11].
The second class of experimental wrinkling tests is directly related to the state of stress locally applied on the sheet that induces wrinkling [12]. There are two major stress states that originate wrinkling, compression, and tension. The compression state of stress, Figure 1a, is directly related to the wrinkling flange area, and a non-uniform tensile state of stress, Figure 1b, to the side wall wrinkling of a deep drawn part. Additionally, in sheet metal forming of a complex geometry shear state of stress can also originate wrinkling, Figure 1c.
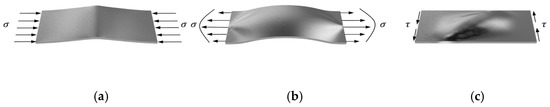
Figure 1.
States of stress that induce wrinkling in a metal sheet: (a) Compressive stress; (b) Non-uniform tensile stress; (c) Shear stress.
Experimental tests that allow the determination of the onset of wrinkling due to compressive states of stress are the rectangular test specimens proposed by Kasei et al. [13] and Magrinho et al. [14]. The determination of the wrinkling initiation owing to a tensile stress state can be performed by the Yoshida Buckling Test (YBT) originally proposed by Yoshida et al. [15]. The YBT has been the most used experimental test by the scientific community to determine the onset of wrinkling; Tang et al. [16] summarize the most common variants of the YBT proposed over the years.
In a previous work [14] the authors proposed a methodology to identify the onset of wrinkling from a rectangular specimen in compression. In the present work, the authors considered the original YBT (with an additional clamping area) and propose a new experimental methodology to determine the onset of wrinkling based on the in-plane minor true strain. The commonly used experimental methodology [17], which considers that wrinkling occurs when the wrinkle height reaches a predefined percentage of the initial thickness of the blank, is revisited and compared with the new proposed methodology. The new experimental methodology approach was shown as appropriate to determine the wrinkling limit curve (WLC) for a specific material.
2. Experimentation
2.1. Mechanical Characterization
The work was carried out on aluminium AA1050 sheets with 1.5 mm thickness annealed at 345 °C for 3 h before testing to obtain the O condition. The mechanical characterization of the material was performed by tensile testing conducted according to the standard ASTM E8/E8M–16a [18], where a series of tensile test specimens (standard specimen–sheet type) were cut from the aluminium sheet at an angle of 0, 45, and 90 degrees with respect to the rolling direction. The tensile testing of such specimens allowed the attainment of the mechanical properties present in Table 1, such as the modulus of elasticity, , the yield stress, , the ultimate tensile stress, , the elongation at break, , and lastly, the planar anisotropy coefficient, .

Table 1.
Summary of the mechanical properties of aluminum AA1050–O sheet with 1.5 mm thickness.
The average stress–strain response obtained from the tensile tests can be approximated by the following Ludwik-Hollomon’s equation,
The anisotropy coefficient obtained from the tensile tests for sheets aligned at 45° with the rolling direction is considerably higher than those at 0°, and 90°, this phenomenon was identified previously by Sharma et al. [19] in sheets produced by accumulative roll bonding.
2.2. Experimental Plan
Table 2 presents a summary of the YBT specimens that were used in the characterization of the WLC of the aluminium sheet and at least ten repetitions were made for each dimension of the three dimensions. The YBTs were performed at room temperature and in quasi-static operating conditions, i.e., with a tensile load monotonously applied with a velocity of 5 mm/min. The specimens were cut out from the supplied sheets considering the rolling direction longitudinally in the specimens.
Table 2.
Summary of the experimental work plan for the Yoshida buckling tests.
The YBTs were performed on a universal testing machine, Instron 4507 (INSTRON, Norwood, MA, EUA), due to the clamping configuration with the kinematics of the tensile tests (Figure 2b), the YBT specimen geometry induces a non-uniform tensile state of stress (Figure 1b) that causes compressive stress in the transversal direction (X direction) on the central area of the specimen. This compressive stress triggers the plastic instability in the Z direction of the specimen.
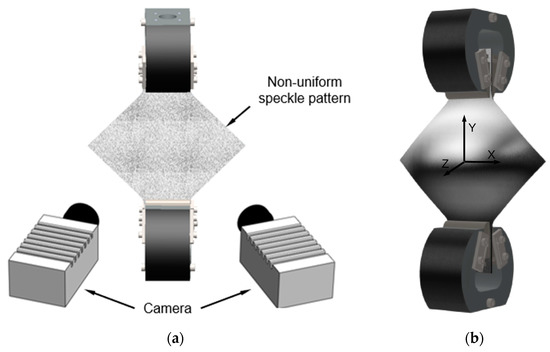
Figure 2.
Schematic representation of the setup utilized by the DIC system for measuring 3D displacement and strains of the YBT (a) before and (b) after deformation.
2.3. Displacement and Strain Measurements
Three-dimensional displacement and strain measurement on the sheet surface of the YBT specimens that were needed to determine the onset of instability of the sheet material was performed by a DIC system, the Dantec Dynamics Model Q-400 3D (Figure 2a).
The surface of the specimens was sprayed with a stochastic black speckle pattern on a uniform background previously painted in matte white and the YBT specimens were illuminated with one spotlight. The DIC system is equipped with two cameras with 6 megapixels of resolution and 50.2 mm of focal length with an aperture of f/11 to increase the depth of focus. The frequency of image acquisition was set to 10 frames per second and the correlation algorithm was performed with the INSTRA 4D software (version 4.6, Dantec Dynamics, Skovlunde, Denmark). A facet size of 17 pixels with a spacing grid of 13 pixels was considered.
3. Methodology
This paper proposes two physically-based methodologies to detect the onset of instability/wrinkling and to determine the formability limits by wrinkling in sheet metal forming through experimental YBTs.
3.1. Methodology A
Methodology A is based on a direct analysis of Z displacement (perpendicular direction to the sheet surface, Figure 2b) along the YBT specimen diagonal (section AA), as schematically represented in Figure 3a. The Z displacement analysis along section AA allows obtaining the amplitude of the plastic instability wave that corresponds to the maximum Z displacement of section AA, Figure 3b. The evolution of the plastic instability wave over time along the YBT test is schematically presented in Figure 3c and a critical amplitude plastic instability wave can be defined, as 10% of the sheet thickness (Du et al. [17]).
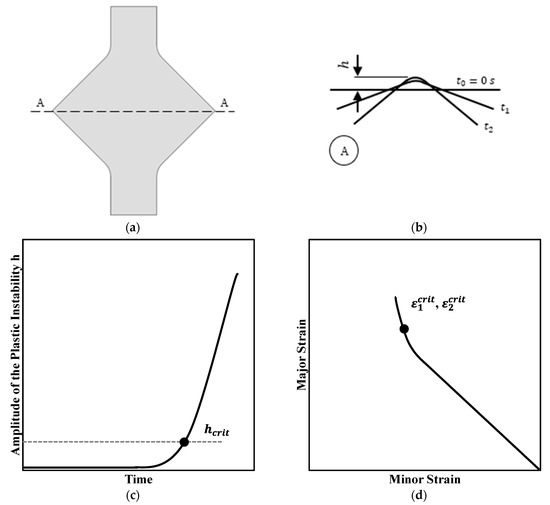
Figure 3.
Summary of methodology A to characterize the onset of instability: (a) schematic representation of YBT; (b) identification of wrinkling amplitude h; (c) evolution of the wrinkling amplitude h over time; (d) representation of the strain loading paths and identification of the critical strains in principal strain space.
The instant of time when the amplitude of plastic instability wave is equal to the critical amplitude of plastic instability wave corresponds to the instant of time that allows for determining the critical strain pairs (, ) from the strain loading path of a point localized in the central zone of section AA, as schematically represented in Figure 3d. The critical strain pairs for the YBT specimens with different dimensions are then used to create the WLC in the principal strain space.
3.2. Methodology B
Methodology B is based on the direct analysis of in-plane minor strain () in the central zone of the YBT specimen, as schematically represented in Figure 4a as the measuring area. The central zone of the YBT specimen, where the strains are measured by the DIC system, corresponds to the zone with maximum Z displacement of section AA, considering the wrinkling behavior presented schematically in Figure 4b. Preceding the onset of instability, the evolution of the in-plane minor strain () in the central zone of the YBT specimen depends on the specimen geometry. However, after plastic instability occurs, the evolution of the in-plane minor strain () changes direction. The evolution of the strain rate (first-time derivate of the in-plane minor strain) allows for to detect of this phenomenon and the minimum point corresponds to the instant of time when buckling is triggered (critical time ), as schematically represented in Figure 4c.
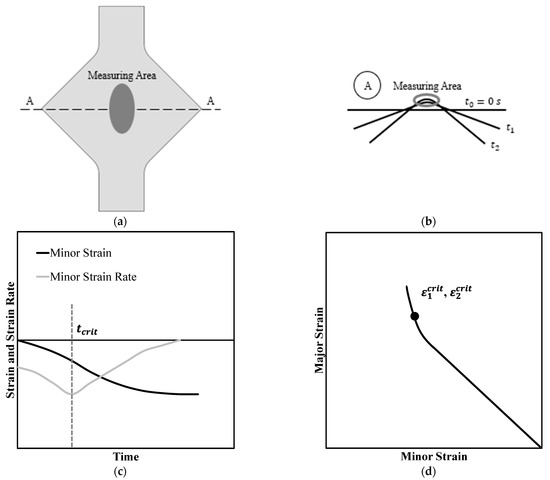
Figure 4.
Summary of methodology B to characterize the onset of instability: (a) schematic representation of YBT; (b) identification of the displacement and strain measurement area; (c) evolution of the in-plane minor strain and strain rate; (d) representation of the strain loading paths and identification of the critical strains in principal strain space.
The critical time corresponds to the instant of time that allows for determining the critical strain pairs (, ) from the strain loading path of a point localized in the central zone of section AA, as represented in Figure 4d. The critical strain pairs for the YBT specimens with different geometries are then used to create the WLC in the principal strain space.
Methodology A is position–dependent because it relies on the analysis of displacements, while methodology B is time–dependent because it is based on the analysis of in-plane minor strain rates. Although the above-mentioned methodologies have different grounds, both are physically-based methodologies to detect the onset of plastic instability and determine the WLC of sheet metal forming processes.
4. Results and Discussion
4.1. Methodology A
Figure 5a presents the force vs. displacement curves for specimens of the three dimensions considered experimentally, = 90, 100, and 110 mm, identified as Y90, Y100, and Y110, respectively. Regardless of the dimension of the specimen, the force evolutions display the same tendency. For this reason, and clarity reasons, only one specimen for each dimension was included, however, all specimens registered similar results. Additionally, it should be highlighted that there is no change in the evolution of the force at the moment in which instability occurs.
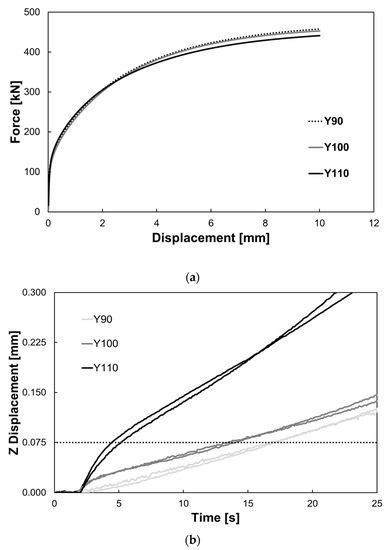
Figure 5.
YBT specimens with a side length of 90, 100, and 110 mm: (a) force–displacement curves; (b) the z displacement of the center.
The DIC system was used to obtain the Z displacement, for methodology A, and in some cases, it was challenging to obtain results for the entire section AA of the YBT specimens. For this reason, it was needed to adapt the initial methodology presented before and used by Du et al. [17]. Instead of considering all the section AA, only the center of each YBT specimen was considered, and the onset of wrinkling occurs when this particular point reaches a Z displacement equal to 5% of the thickness of the blank. Thus, ensuring the evolution obtained is independent of the quality of the captured images by the DIC system in all YBT specimens. To sum up, it is an adaptation of the methodology used by Du et al. [17].
The evolution of the displacement in the Z direction (thickness direction) over time is presented in Figure 5b for two specimens of each set of specimen dimensions for clarity reasons, and since all the experimental tests for each specimen dimension revealed similar results. Contrary to the force–displacement curves, the increasing rate of the Z displacement, or the wrinkle height, is dependent on the specimen dimension, and, as expected, the z displacement increase is faster for the specimens with higher L [17,20]. Thus, considering methodology A previously presented, the time instant for which the Z displacement in the central zone of the specimen, wrinkle height, reaches 5% of the initial thickness occurs is inversely proportional to the specimen dimension, i.e., the onset of wrinkling occurs earlier for the specimens with larger dimensions.
Figure 6 presents the principal strain space obtained by the DIC system at the center of the specimen for the three dimensions considered experimentally, and for clarity reasons only one specimen for each dimension was included. Despite the different dimensions, the strain path for all the specimens is approximately the same, corresponding to pure shear, . Even though the strain path remains with a slope of approximately −1 throughout the test, at the end of the test all specimens register a slight shift of the slope, as indicated in the work of Du et al. [21]. In addition, the shift in the slope is higher for specimens with a bigger side length.
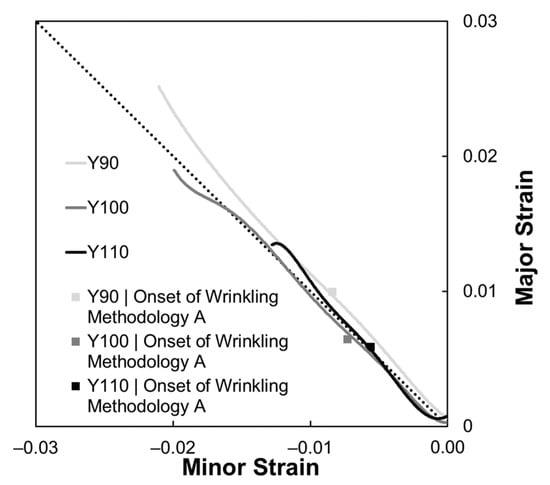
Figure 6.
Strain loading path for the YBT specimens with a side length of 90, 100, and 110 mm with the critical strain pair for the onset of instability according to methodology A highlighted.
Table 3 presents, for each test specimen dimension, the average time instant for which the onset of instability occurs and the corresponding average principal strains obtained from the experimental work for all the specimens tested. It can be noted that the higher the L of the specimen, the earlier the time instant for which wrinkling occurs and the lower the corresponding principal strains.
Table 3.
Average time instant at the onset of wrinkling for the three specimen dimensions determined by Methodology A.
4.2. Methodology B
Figure 7 presents the evolutions of the minor principal strain, obtained from the DIC and the corresponding strain rate over time, for the three YBT specimen dimensions: Y90, Y100, and Y110. The minor strain evolutions for all the specimens’ geometry show a global decrease throughout the test, displaying no evident behavior that would allow identifying the onset of wrinkling. According to methodology B, the onset of wrinkling corresponds to a change in the direction of the strain rate evolution, or when the strain rate no longer decreases and starts to increase. At the instant where the strain rate evolution reaches a minimum, the principal strains are the ones corresponding to the onset of instability.
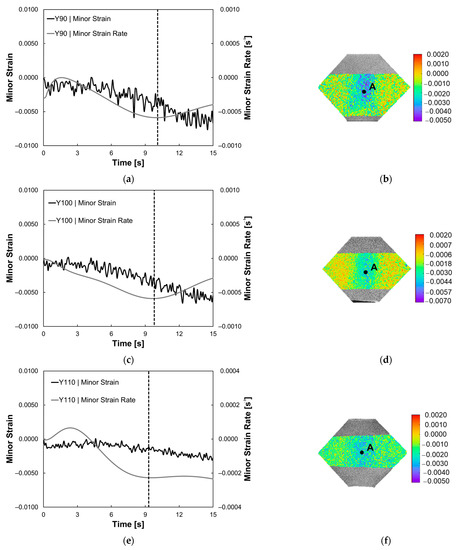
Figure 7.
Minor strain and minor strain rate evolution over time for specimens: (a) Y90; (c) Y100; (e) Y110. Minor strain distribution at the onset of wrinkling obtained from the DIC according to methodology B for specimens: (b) Y90; (d) Y100; (f) Y110.
Figure 7b,d,f show the minor strain distribution at the onset of wrinkling along the YBT specimens with a side length of 90, 100, and 110 mm, these results are representative of the results for the repetitions for each condition. It is possible to state that the YBT specimens with the smaller side lengths registered lower compressive values of minor strain in the center of the specimen at the instability instant. Considering all of the above-mentioned figures have the same color scale, Figure 7b has deeper tones of blue and purple at the center when compared to the other two geometries, thus demonstrating a more advanced state of compression at the instability instant than the other two geometries.
Similarly to Figure 6, Figure 8 presents the principal strain space obtained by the DIC system for a point located at the center of the specimen for the three specimens’ dimensions considered experimentally, and, once again, for clarity reasons only one specimen for each dimension was included. The strain path for all the specimens is approximately the same, corresponding to pure shear stress state, = = −1.
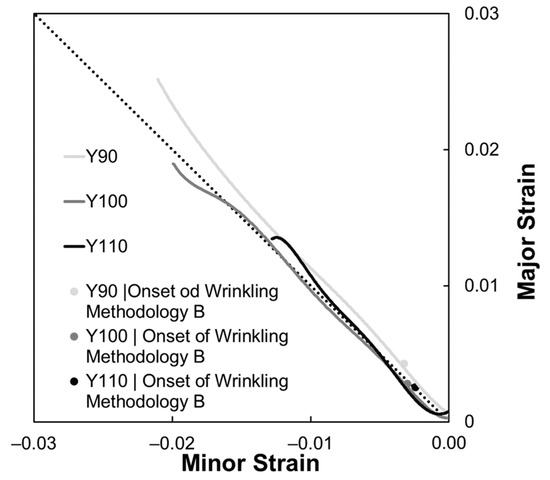
Figure 8.
Representative strain loading path for the modified Yoshida specimens with a side length of 90, 100, and 110 mm, with the onset of wrinkling according to methodology B highlighted.
Table 4 presents for each YBT specimen geometry the time instant for which the onset of wrinkling occurs, and the corresponding average principal strains obtained from the experimental work. It can be noted that the higher the L of the specimen, the earlier the time instant for which wrinkling occurs and the lower the corresponding principal strains. The minor strain and minor strain rate behavior are independent of the side to which the wrinkle occurs.
Table 4.
Average time instant at the onset of wrinkling for the three specimen dimensions determined by Methodology B.
4.3. Methodologies Comparison
This section presents a comparison between the results obtained using methodologies A and B to determine the onset of instability for Y100 specimens. In general, for all the specimens analyzed, the instability instant corresponding to the onset of wrinkling obtained from methodology B always occurs before the instability instant obtained from methodology A.
Figure 9 presents the Z displacement along the X position of section AA from Figure 3a, where each curve represents the section Z displacement evolution taken every 4 s from the beginning of the test up to a fully developed wrinkle. The solid black line corresponds to section AA for the instability instant obtained from methodology A and the black dotted line corresponds to section AA for the instability instant obtained from methodology B.
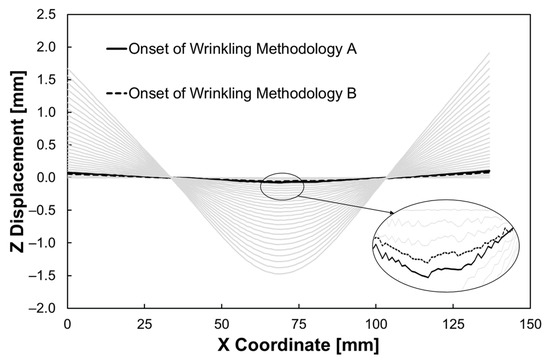
Figure 9.
Z displacement of section AA of a Y100 specimen before wrinkling, at the onset of wrinkling according to methodologies A and B, and for a fully developed wrinkle.
The difference between the critical instant at the onset of wrinkling determined by methodologies A and B is not expressive. To compare both methodologies, the conversion of the Z displacement of the center of the specimen at the critical instant determined by methodology B to a percentage of the sheet metal thickness was performed to allow a direct comparison between the two methodologies. Results for Y90, Y100, and Y110 show a Z displacement of 2.70%, 2.67%, and 2.07%, respectively. These results allow a conclusion that by reducing the dimension of the YBT specimen the difference between the critical instant at the onset of wrinkling determined by methodologies A and B is smaller.
Figure 10 shows the evolution of the Z displacement over time at a point in the center of specimen Y100, and the critical instants determined as the onset of wrinkling obtained by methodologies A and B. Once again, the instability instant corresponding to the onset of wrinkling obtained from methodology B occurs before the instability instant obtained from methodology A.
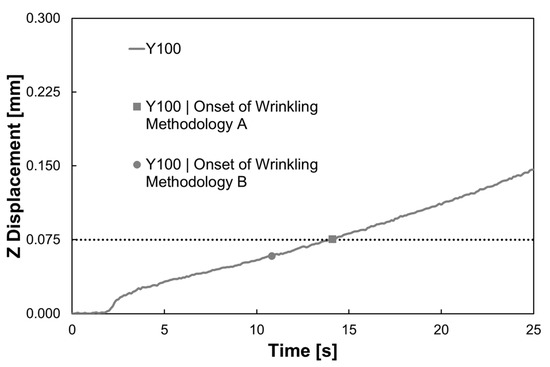
Figure 10.
Wrinkle height for a YBT specimen with a side length of 100 mm when the onset of wrinkling occurs for methodologies A and B.
The methodologies A and B described in Section 3.1 and Section 3.2 allowed the determination of the critical strain pairs (, ) at the onset of plastic instability for the YBT specimens listed in Table 2. The experimental plan considered the use of three different initial side lengths, , of the YBT allowing obtaining the WLC for the AA1050-O aluminium sheet with 1.5 mm thickness. Figure 11 shows the critical strain pairs plotted in the principal strain space, as well as the WLC obtained with the two considered methodologies.
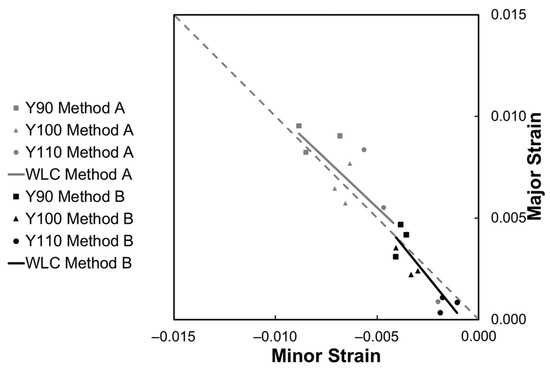
Figure 11.
Formability limits by wrinkling (WLC) according to methodologies A and B of the AA1050–O aluminum with 1.5 mm thickness.
The WLC obtained by methodology A was built from the linear regression of the grey markers corresponding to the critical strain pairs obtained, and parallel the WLC obtained from methodology B was built from the linear regression of the black markers corresponding to the critical strain pairs obtained.
Both WLCs present a slope near ‘−1’ similar to that of pure shear. As observed in Figure 9 and Figure 10 the onset of wrinkling defined from methodology B occurs earlier than the one registered from methodology A. This fact is visible in the WLCs because the formability limit built from critical strain pairs obtained with methodology A presents larger strain values.
YBT specimens with larger dimensions () present an instability instant earlier and respective strain values lower than specimens with smaller dimensions. Therefore, the YBT must be performed with different geometries (different ) in order to obtain a formability limit by wrinkling across a wider range of sheet-forming conditions.
Methodology B, originally proposed by the authors, revealed that considering a physical wrinkling trigger allows determining the exact onset of wrinkling, contrary to the conventional methodologies (e.g., Methodology A) for which the onset of wrinkling prediction considers a predefined percentage of the initial thickness of the blank.
5. Conclusions
The YBT has been the most used formability test by the scientific community to determine the formability limits by the wrinkling of sheet material. Its popularity is due to the simple clamping configuration with the kinematics of tensile tests.
A new experimental methodology to determine the onset of wrinkling based on the in-plane minor true strain is validated by comparison with the commonly used experimental methodology, which considers that wrinkling occurs when the wrinkle height reaches a predefined percentage of the initial thickness of the blank.
The new experimental methodology revealed an appropriate and more accurate way to determine the WLC for sheet material than the conventional methodology. This is because methodology B is a physically-based methodology built upon the direct analysis of the in-plane minor strain and its strain rate and is not defined by a constant value that may not be the best solution depending on the material and its thickness. Special emphasis must be given to the fact that the minor strain and the minor strain rate behavior are independent of the side to which the wrinkle occurs.
The YBT specimens with larger dimensions have an earlier critical time instant for which wrinkling occurs, and consequently, lower corresponding principal strains. To conclude, to obtain a formability limit by wrinkling valid across a wide range of sheet forming conditions several specimen dimensions should be considered.
Author Contributions
Conceptualization, J.P.G.M. and M.B.S.; Data curation, J.P.G.M.; Formal analysis, M.B.S.; Investigation, J.A.O.S., J.P.G.M. and M.B.S.; Methodology, J.A.O.S. and J.P.G.M.; Resources, M.B.S.; Supervision, M.B.S.; Validation, J.A.O.S.; Writing—original draft, J.A.O.S., J.P.G.M. and M.B.S.; Writing—review & editing, J.A.O.S., J.P.G.M. and M.B.S. All authors have read and agreed to the published version of the manuscript.
Funding
This research was funded by Fundação para a Ciência e a Tecnologia of Portugal and IDMEC under LAETA-UID/EMS/50022/2020.
Data Availability Statement
The datasets generated during and/or analysed during the current study are available from the corresponding author on reasonable request.
Acknowledgments
The authors would like to acknowledge the support provided by Fundação para a Ciência e a Tecnologia of Portugal and IDMEC under LAETA-UID/EMS/50022/2020.
Conflicts of Interest
The authors declare no conflict of interest.
References
- Kleiner, M.; Geiger, M.; Klaus, A. Manufacturing of Lightweight Components by Metal Forming. CIRP Ann. 2003, 52, 521–542. [Google Scholar] [CrossRef]
- Martins, P.A.F.; Bay, N.; Tekkaya, A.E. Atkins AG. Characterization of fracture loci in metal forming. Int. J. Mech. Sci. 2014, 83, 112–123. [Google Scholar] [CrossRef]
- Magrinho, J.P.; Silva, M.B.; Reis, L.; Martins, P.A.F. Formability Limits, Fractography, and Fracture Toughness in Sheet Metal Forming. Materials 2019, 12, 1493. [Google Scholar] [CrossRef] [PubMed]
- Kim, J.B.; Yoon, J.W.; Yang, D.Y. Wrinkling initiation and growth in modified Yoshida buckling test: Finite element analysis and experimental comparison. Int. J. Mech. Sci. 2000, 42, 1683–1714. [Google Scholar] [CrossRef]
- Cao, J. Prediction of Plastic Wrinkling Using the Energy Method. J. Appl. Mech. 1999, 66, 646–652. [Google Scholar] [CrossRef]
- Chen, K.; Carter, A.J.; Korkolis, Y.P. Flange Wrinkling in Deep-Drawing: Experiments, Simulations and a Reduced-order Model. J. Manuf. Mater. Process. 2022, 6, 76. [Google Scholar] [CrossRef]
- Abe, H.; Nakagawa, K.; Sato, S. Proposal of conical cup buckling test. In Proceedings of the Congress of the International Deep Drawing Research Group, Kyoto, Japan, 14–15 May 1981; pp. 1–19. [Google Scholar]
- Narayanasamy, R.; Sowerby, R. Wrinkling of sheet metals when drawing through a conical die. J. Mater. Process. Technol. 1994, 41, 275–290. [Google Scholar] [CrossRef]
- Triantafyllidis, N.; Needleman, A. An Analysis of Wrinkling in the Swift Cup Test. J. Eng. Mater. Technol. 1980, 102, 241–248. [Google Scholar] [CrossRef]
- Huang, J.; Jin, J.; Deng, L.; Wang, X.; Gong, P.; Zhang, M.; Gao, C. Theoretical prediction of flange wrinkling in the first-pass conventional spinning of dual-metal sheets. J. Manuf. Process. 2021, 62, 368–377. [Google Scholar] [CrossRef]
- Liu, N.; Yang, H.; Li, H.; Li, Z.J. A hybrid method for accurate prediction of multiple instability modes in in-plane roll-bending of strip. J. Mater. Process. Technol. 2014, 214, 1173–1189. [Google Scholar] [CrossRef]
- Hutchinson, J.W.; Neale, K.W. Wrinkling of curved thin sheet metal. In Proceedings of the Considere Memorial Symposium—Plastic instability, Paris, France, 9–13 September 1985; pp. 71–78. [Google Scholar]
- Kasaei, M.M.; Moslemi Naeini, H.; Liaghat, G.H.; Silva, C.M.A.; Silva, M.B.; Martins, P.A.F. Revisiting the wrinkling limits in flexible roll forming. J. Strain Anal. 2015, 50, 528–541. [Google Scholar] [CrossRef]
- Magrinho, J.P.G.; Silva, C.M.A.; Silva, M.B.; Martins, P.A.F. Formability limits by wrinkling in sheet metal forming. Proc. Inst. Mech. Eng. Part L J. Mater. Des. Appl. 2016, 232, 681–692. [Google Scholar] [CrossRef]
- Yoshida, K.; Hayashi, H.; Miauchi, K.; Hirata, M.; Hira, T.; Ujihara, S. Yoshida buckling test. In Proceedings of the International Symposium on New Aspects of Sheet Metal Forming, Tokyo, Japan, 14–15 May 1981; pp. 125–148. [Google Scholar]
- Tang, H.; Wen, T.; Zhou, Y.; You, J.; Ma, D. Study of the wrinkling behavior of perforated metallic plates using uniaxial tensile tests. Thin-Walled Struct. 2021, 167, 108132. [Google Scholar] [CrossRef]
- Du, B.; Xie, J.; Li, H.; Zhao, C.; Zhang, X.; Yuan, X. Determining factors affecting sheet metal plastic wrinkling in response to nonuniform tension using wrinkling limit diagrams. Thin-Walled Struct. 2020, 147, 106535. [Google Scholar] [CrossRef]
- ASTM Standard E8/E8M; Standard Test Methods for Tension Testing of Metallic Materials. ASTM International: West Conshohocken, PA, USA, 2016. [CrossRef]
- Sharma, S.; Singh, R.; Kumar, S. Mechanical Anisotropy of Aluminium AA1050 and Aluminium Alloy AA6016 produced by Accumulative Roll Bonding. Int. J. Innov. Eng. Technol. 2016, 7, 350–356. [Google Scholar] [CrossRef]
- Han, F.; Liewald, M. A new method to enhance the accuracy of the buckling test using modified Yoshida sample. Adv. Mater. Res. 2018, 1018, 199–206. [Google Scholar] [CrossRef]
- Du, B.; Wang, X.; Wang, J.; Yang, H.; Cehn, X.; Yang, Z. The establishment of critical wrinkling judgment line for shear wrinkling instability of thin plate and its influencing factors. Thin-Walled Struct. 2022, 175, 109226. [Google Scholar] [CrossRef]


Disclaimer/Publisher’s Note: The statements, opinions and data contained in all publications are solely those of the individual author(s) and contributor(s) and not of MDPI and/or the editor(s). MDPI and/or the editor(s) disclaim responsibility for any injury to people or property resulting from any ideas, methods, instructions or products referred to in the content. |
© 2023 by the authors. Licensee MDPI, Basel, Switzerland. This article is an open access article distributed under the terms and conditions of the Creative Commons Attribution (CC BY) license (https://creativecommons.org/licenses/by/4.0/).