Abstract
Laminated metal composites have attracted more attention due to their ultra-high strength, fracture toughness and elongation, full considerations of each component, and coordinated deformation effect between interfaces. Herein, Zn and Al were selected as the component materials to prepare Al/Zn laminated composite plates using hot rolling and low temperature annealing, and studied the influence of the thickness of the diffusion layer at the interface to understand the reason for the strengthening and toughening mechanism. The results show that, with an increase in annealing temperature and time, the grain will recover and recrystallize to grow. A diffusion layer with a certain thickness formed at the interface due to the mutual diffusion of Al and Zn atoms at the interface. As annealing time and temperature increase, the yield and tensile strengths first increased and then decreased. The tensile fracture morphology showeds many deep dimples. In the rolling state, the micro-hardness value at the interface was between Al and Zn.
1. Introduction
Strength and toughness are important mechanical property parameters of metal materials. However, for a single metal, it is always difficult to obtain these two excellent properties simultaneously via traditional strengthening methods [1,2]. Thus, more attention has been paid to laminated metal composites (LMCs) of alternating material layers by adjusting the morphology and distribution of the microstructure, introducing interface constraints and other effective ways. These can combine with the advantages of the composition layer and interface to produce ideal properties, such as good stiffness, hardness, elastic modulus and wear resistance, high strength, and excellent ductility [3,4,5,6,7,8].
Currently, many processes have been developed to prepare macro-scale LMCs, including rolling [9], extrusion [10], deposition [11], spraying [12], wire arc additive manufacturing (WAAM) [13], etc. Compared to other preparation processes, rolling can obtain the required plate size more easily [14,15], and a large number of LMCs with excellent properties, such as Ti/Al [16], Cu/Al [17], Mg/Al [18], and Cu/Cu [19,20], have been successfully prepared. However, at present, research on LMCs is mainly focused on the combination of face-centered cubic (FCC) metals or FCC and body-centered cubic (BCC) metals, while there is relatively less research on composites containing hexagonal close-packed (HCP) metals as component materials. Moreover, in HCP LMCs, two oxide films break independently of each other rather than coherently with cubic metals for HCP metals, and thus, the bonding on the larger expansion interface is suppressed, resulting in poor bonding performance [21].
For LMCs, their excellent strength and toughness are not only from the metal components, but also from the synergistic reinforcement of the interface. The stress can be transferred from one metal component to another through the interface because of the existence of the interface, so as to enhance the strength and toughness of the composite at the same time. Nevertheless, chemical reactions can occur at the interface to produce intermetallic compounds (IMCs) for most research systems, but most of the them are brittle. When the interface impact zone grows to a certain thickness, the stress concentration will occur under the action of external stress, resulting in local plastic deformation, which will comprehensively affect the mechanical properties of the composite. For example, CuAl2, Cu9Al4 and other IMCs are generated between Cu/Al interface [22], FeAl3 and Fe2Al5 at the Fe/Al interface [23,24], and TiAl3 and Ti2Al5 at the Ti/Al interface [25].
Al is a relatively light metal with good corrosion resistance and ductility, which is widely used in the industrial field, automotive and aerospace applications, however, its wide popularity is still limited by low modulus and low strength [26,27]. In contrast, Zn has a relatively high strength and low ductility, what is more important to Al/Zn interface is the absence of IMC formation. Up to now, there are few reports on Al/Zn composite plate. Only Dehsorkhi et al. reported that Al/Zn composite plate was prepared through continuous annealing, and roll bonding and accumulative roll bonding (ARB) process [28,29], and however, they focused on the effect of repeated rolling cycles on the performance, rather than the interpretation from the interlayer interface. Therefore, in our work, Zn (HCP) and Al (FCC) were selected as candidate materials to produce Al/Zn laminated composite plates by hot rolling and low temperature annealing, and the effect of interface and composition on the overall mechanical properties of the composite plate were investigated to develop an interface diffusion model for an HCP-FCC solid solution system.
2. Materials and Methods
2.1. Materials
In this work, the candidate materials were 1060 pure Al plate and 99.995% industrial Zn ingot. The Al plate size was 200 mm × 55 mm × 2 mm. The Zn ingot was cut into rectangular parallelepiped pieces with weight of 2 kg, which can be placed in the crucible during subsequent casting. The chemical compositions of the candidate materials were shown in Table 1.

Table 1.
Chemical compositions of 1060 Al plate and pure Zn ingot (wt.%).
2.2. Preparation of Al/Zn Laminated Composite Plate
The whole manufacturing process of Al/Zn composite plate included the treatment of candidate materials and the subsequent composite casting process. The Al plate was fully annealed at 580 °C for 2.5 h, and then the surface was polished using a wire brush. The polished Al plate was put into a muffle furnace (model: SX2-4-10N, Taist Instrument Co., Ltd., Tianjin, China) and preheated at 350 °C for 0.5 h. The Zn pieces were into the crucible of the medium frequency induction furnace (model: DDZP3510725, Dongda Industrial Co., Ltd., Shenzhen, China) for heating, and the heating temperature was then set to 600 °C. The preheated Al plates were placed in the middle of the mold cavity of the device, and the molten Zn solution was slowly poured into the mold and removed after cooling to prepare, a 6mm thick Al/Zn composite sheet. and then is preheated at 350 °C for half an hour to reach the recrystallization temperature or above, select the hot rolling method and determine that the final reduction rate is 73%, ranging from 6 mm–3 mm–2 mm–1.6 mm.
Finally, the laminated composite sheet with a thickness of 1.6mm was obtained by the hot-rolling process. The rolling mill equipment model here was Φ170 mm × 300 mm two high rolling mill. A schematic diagram of the preparation process of Al/Zn composite plate was shown in Figure 1. Determine the size of 10 mm × 12 mm, along the thickness direction for the selection of metallographic samples. The inlay used was a cold inlay containing acrylic powder and curing agent, and then polished and bolised its surface, after there are no obvious scratches on the surface of the sample, choose Keller’s reagent [28] and 2.5 g Cr2O3 + 1.0 g Cu2SO4 + 40 mL H2O as etchants to etch Al and Zn respectively. The dog-bone-shaped samples were cut by wire EDM (model: SMDK-320T, Taizhou, China) according to GB/T228.1-2010. The sample size was shown in Figure 2.
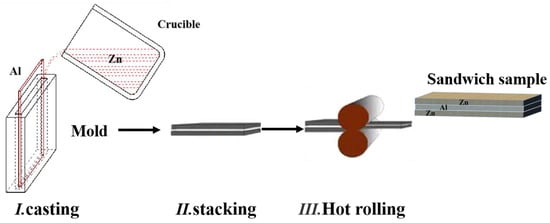
Figure 1.
Process flow diagram of Al/Zn laminated composite plate.
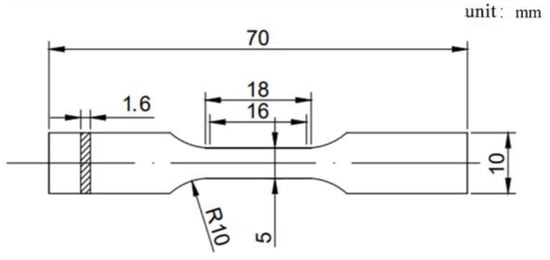
Figure 2.
Schematic of the tensile test specimen.
2.3. Material Characterization
The prepared Al/Zn laminated composite plate was taken as metallographic sample to observe the grain and interface morphology by optical microscopy (OM, NIKON-L200N, Shanghai, China). The interface and tensile fracture morphologies of the composite plate were studied by scanning electron microscopy (SEM, HITACHI S-3400N, Tokyo, Japan) equipped with energy dispersive spectroscopy (EDS). The mechanical properties of the composite plate were tested using a universal tensile testing machine (WDW-10) under the constant strain rate of 1 × 10⁻³ s−1 at room temperature, and at least three specimens were tested for each material. Hardness was measured by micro-hardness tester (Auto Vicky ZHV-1000F, Shanghai, China), the load is 99.93 gf and dwell time of 15 s, tested 7 points at each position to take the average value. Electron backscatter diffraction (EBSD) was used to observe the changes of grain structure of Al and Zn after rolling and annealing, the distribution of dislocation density in the composite, the substructure in the matrix, the deformation structure, and the recrystallization.
3. Results and Discussion
3.1. Observation of Interface Morphology
The interfacial and metallographic morphologies were shown in Figure 3. It can be seen from Figure 3a that the interface in rolling state has obvious zigzag shape. Annealing is an important means to adjust the interface, as shown in Figure 3b–e. With the increase of temperature, the grains grow and the interfaces become flat, and a certain thickness of interfacial transition layer is generated.
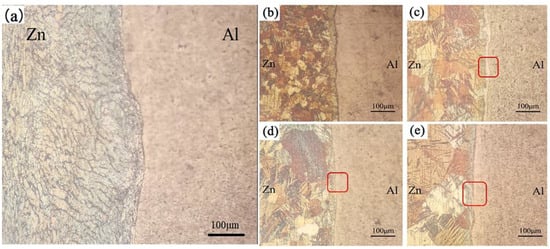
Figure 3.
OM images of the samples under different annealing conditions, (a) rolled state; (b) 200 °C × 1.5 h; (c) 240 °C × 1.5 h; (d) 280 °C × 1.5 h; (e) 320 °C × 1.5 h. The red mark represents the interface zone.
Figure 4 shows the SEM morphology images at different temperatures. All Al/Zn interfaces show obvious waveform morphology, which is attributed to the different flow characteristics of Al and Zn components, which lead to deformation incompatibility in the rolling process, resulting in shear deformation at the interface. At 200 °C, there is no obvious diffusion effect. However, as the temperature increases, interfacial atoms gain energy and are prone to diffusion, resulting in the formation of a layer of solid solution with inhomogeneous thicknesses at the interface, as indicated by the red arrow in the figure, which is mainly because the thermal expansion coefficients of the two components were different, local generation of micro-pores and cracks at the interface leads to changes in the path of atomic diffusion. After the annealing and subsequent cooling processes, different degrees of atomic diffusion are observed. When the temperature increases to 320 °C, the transition layer become wider, and it is almost located in the Al matrix. Figure 5 show the point EDS analysis and line scanning result at different annealing temperatures, respectively. The concentration curve across the interface assumes an “X” shape, indicating that atoms at the interface diffuse with each other. With the increase of temperature, the “X” type span becomes larger, means the transition layer becomes thicker, and the thickness of the diffusion layer is 55 μm at 320 °C for 2 h. Point analysis at Figure 5e shows that the diffusion direction of atoms at the interface is mainly Zn diffusion into Al.
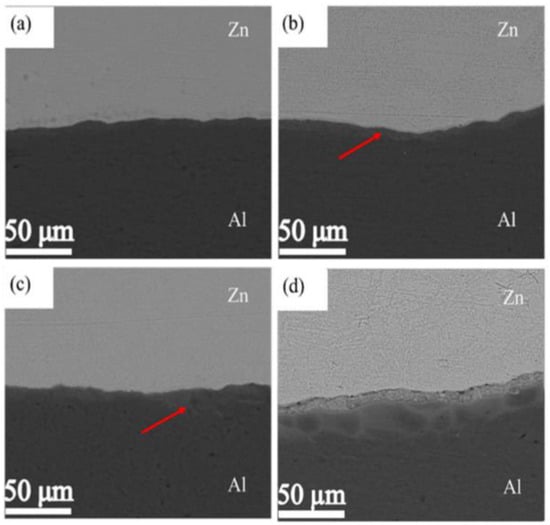
Figure 4.
SEM morphology images of interface at different annealing temperatures for 1.5 h. (a) 200 °C; (b) 240 °C; (c) 280 °C; (d) 320 °C.
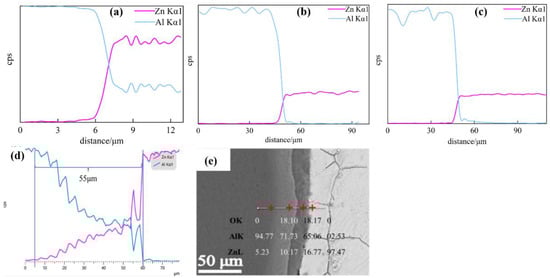
Figure 5.
Energy spectrum analysis under different annealing conditions, (a–d) shows line scanning, (a) rolled state; (b) 240 °C for 1.5 h; (c) 280 °C for 1.5 h; (d) 320 °C for 2 h, and Panel (e) shows point scanning at 320 °C for 2 h.
3.2. Microstructure of Al/Zn Composite Plate
Figure 6 shows the interface geometrically necessary dislocations (GND) distribution maps and inverse pole figure (IPF) maps of as-rolled (Figure 6a,b) and annealing (at 280 °C for 2 h) (Figure 6c,d) samples. Here, the upper half of the figure shows the grain of Zn, while the lower part shows the grain of Al. From Figure 6, it can be seen that the Al grains are obviously finer than Zn grains for as-rolled (Figure 6b) and (Figure 6d) annealing sample, respectively. Due to the interaction of rolling pressure and interfacial friction, the Al undergoes severe plastic deformation through dislocation slip. Meanwhile, the grain boundaries become serrated and have a high distortion energy to be released. For Zn side, the grains are uniformly equiaxed and the GNDs density (Figure 6a,c) is significantly lower than that the Al side. It is obvious that Zn under the rolling state has undergone recovery and recrystallization, resulting in grain growth. In general, the non-uniformity of the microstructure is attributed to the friction effect between the roll and the plate surface in addition to the properties of the material itself [30]. In particular, the dislocations of Zn basically disappear after annealing, except for a small amount at the interface grain boundary in Figure 6a,c. This is due to the recrystallization temperature of Zn is relatively low. However, for Al side, grains are still elongated and broken, and begin to grow by recovery and recrystallization with the progress of annealing [31,32]. Figure 7 shows the local misorientation extracted from Figure 5, which can directly reflect the GND, the larger the misorientation is, the larger the dislocation density is, it is obvious that Al is much larger than Zn, and the density of each component decreases after annealing.
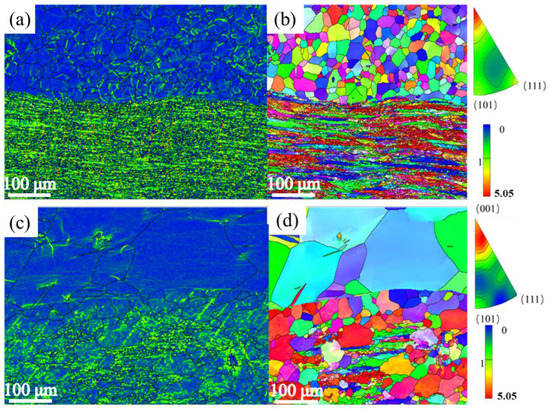
Figure 6.
EBSD maps of as-rolled (a,b) and (c,d) annealing (at 280 °C for 2 h) sample, (a,c) are geometrically necessary dislocations (GND) distribution maps, (b,d) are inverse pole figure (IPF) maps.
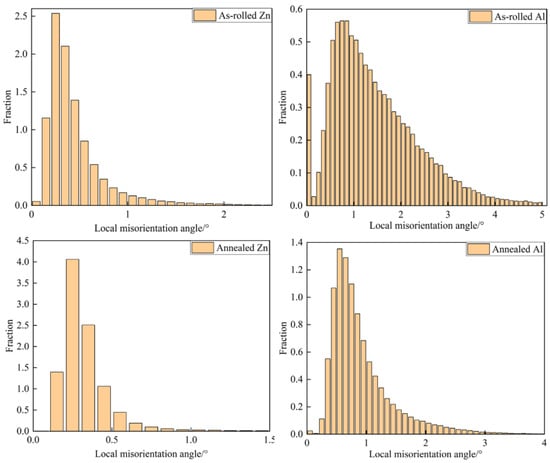
Figure 7.
EBSD local misorientation map.
In addition, it can be seen that the texture orientation on Al before and after annealing is [001]||RD. Figure 8 shows the recrystallized grain distribution of the composite plate after rolling and annealing. Here, 500× and 1000× of grain distribution images are selected for as annealed and rolled, respectively. Since the grain size of Zn after annealing is very large and the number is relatively small, that of 500× is clear. In the figure, blue, yellow and red represents recrystallized grain, substructure, and deformed structure, respectively. In the rolling state, only a few grains of Zn are still in deformation, while Al contains a large number of deformed grains. The deformed structure and substructure of Zn side and Al side are recrystallized to produce a large number of recrystallized grains with the annealing process. The recrystallized grain fraction increases from 45%, 20.4% to 54% and 32%, respectively, in contrast, the growth rate of Al is higher than that of Zn. According to the Figure 6a,c, Al as-rolled has a higher dislocation density, and the higher the deformation energy storage, the more conducive to the dynamic recrystallization after annealing. However, for Al, although a large number of recrystallized grains have been formed, it also contains a large amount of deformation texture due to insufficient temperature and time in Figure 6b,d. Figure 9 shows the grain distribution size of Al side and Zn side under different annealing conditions.
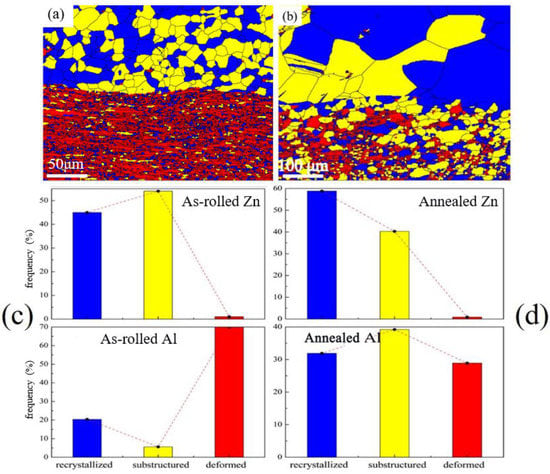
Figure 8.
Recrystallization change at the interface of Al/Zn laminated composite plate at 1000× for rolling state (a) and 500× for 280 °C × 2 h (b); Proportion of recrystallization, substructure and deformation texture at the interface of Al/Zn laminated composite plate under 1000× for rolled condition (c) and 500× for 280 °C × 2 h (d).
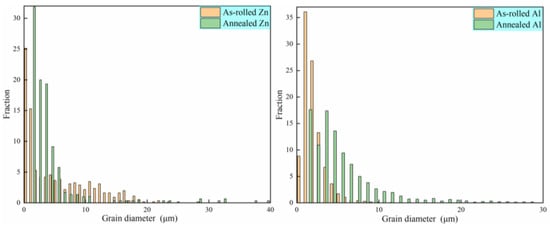
Figure 9.
Grain distribution diagram of Al side and Zn side for rolling state and 280 °C × 2 h.
3.3. Growth Dynamics Analysis of Interfacial Diffusion Layer
The thickness of the diffusion layer under different annealing condition is shown in Table 2 and Figure 10. In a short time and at a low temperature, there is a very low diffusion layer thickness and a slow growth rate, while with the increase of annealing temperature and time, the thickness of the diffusion layer increases gradually. The possible reason is that a large number of activated vacancies are generated at high temperature, which is conducive to the diffusion of interfacial atoms [33,34].
Table 2.
Thickness of the interfacial diffusion layer of the Al/Zn laminate composite plate at different temperatures (T) and times (t).
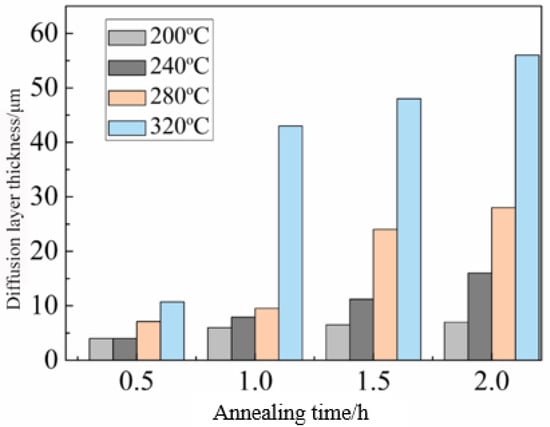
Figure 10.
Diffusion layer thickness with annealing time and temperature.
Generally, the square of the thickness of the diffusion layer and the annealing time conform to the parabolic law of growth dynamics:
y2 = kt
Here, y is diffusion layer thickness, (the unit is μm); t is the annealing time, (the unit is min); and k is growth rate, (the unit is m2/s). Figure 11 shows the relationship between the square of diffusion layer and annealing time of the Al/Zn laminate composite plate. From Figure 11, the thickness of diffusion layer at the interface of Al/Zn composite plate is proportional to the annealing time, fitting the curves at different temperatures, and the slopes of the curves are the growth rate k. The growth rates of diffusion layer calculated by the slope of the straight lines are shown in Table 3. Obviously, diffusion layer growth is controlled by atomic diffusion during the annealing process of the Al/Zn composite plate.
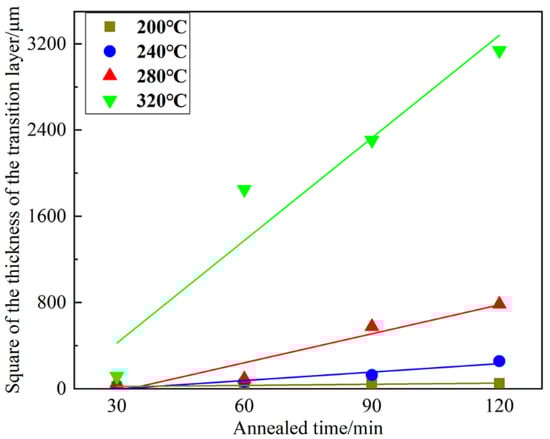
Figure 11.
Relationship between the square of the diffusion layer and annealing time of the Al/Zn laminate composite plate.
Table 3.
Growth rates of the diffusion layer at different annealing temperatures.
The growth activation energy and growth constant of the diffusion layer are calculated according to Arrhenius formula [35,36]:
where k0, Q, R, and T represent the growth constant, diffusion activation energy, mole gas constant and annealing temperature, respectively. Figure 12 shows the relationship between interfacial diffusion layer of Al/Zn laminates and annealing temperature. As shown in Figure 12, the logarithm of the growth rate of the composite plate has a linear relationship with the reciprocal of the absolute temperature. There was a linear fitting of the curve with a slope of −Q/R and a longitudinal intercept from the coordinate axis of lnk0, The diffusion activation energy Q of the diffusion layer is 97.59 kJ/mol and the growth constant k0 is 2.48 × 10⁻⁴ m2/s.
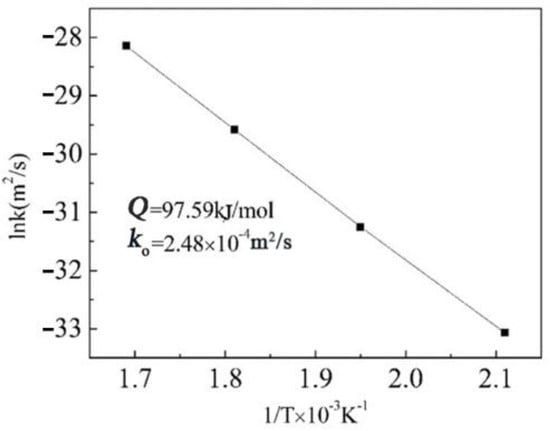
Figure 12.
Relationship between interfacial diffusion layer of Al/Zn laminates and annealing temperature.
3.4. Mechanical Properties
Figure 13 shows the true strain-stress curve of Al/Zn laminated composite plate under different annealing conditions. The strength and uniform elongation are listed in Table 4. With the increase of annealing temperature and time, the tensile strength increases first and then decrease. Compared with the rolled state, at 200 °C, the yield strength does not change much, but the tensile strength is greatly improved, which is mainly related to the diffusion layer. This is due to that diffusion can help to optimize the interface structure and improve performance [37,38]. The diffusion layer with a certain thickness plays a higher metallurgical bonding role and coordinates the difference in stress of component metals, moreover, according to the Hall-Petch strengthening [39], the grain size at low temperature is relatively small, so the strength is improved. When the annealing temperature is 240 °C or above, the strength decreases continuously with the extension of time. Combined with the previous metallographic morphologies and EBSD microscopic analysis, it is because of the grain growth and the decrease of dislocation density. Although the diffusion layer produced by these temperatures is thick, it is not enough to counteract the effect of grain growth. The uniform elongation increases first and then decrease. The increase is mainly due to the effect of recovery and recrystallization, moreover, the diffusion layer also provides a certain work hardening ability. And the decrease is due to the increase of time and the grain size to a certain extent. When the annealing condition goes up 320 °C × 2 h, the uniform elongation is 4.73%, reaching the brittle fracture level.
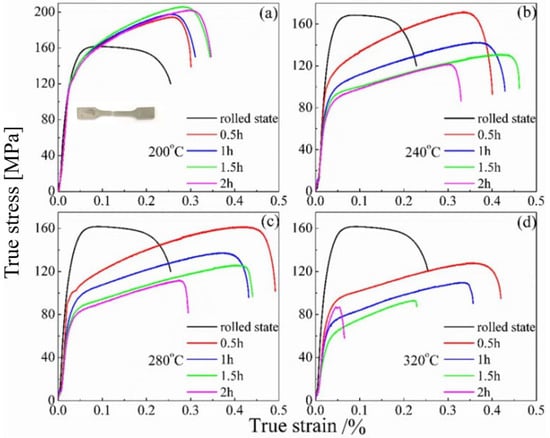
Figure 13.
Ture stress-strain curves of Al/Zn composite plate, the illustration shows the macroscopic fracture morphology at 200 °C for 0.5 h.
Table 4.
Yield strength (σs), tensile strength (σb) and uniform elongation (δ) of Al/Zn laminate under different annealing conditions, Δσb represents the difference in tensile strength between annealed and non-annealed.
As can be seen from Table 4, the Al/Zn composite plate has a better strength and toughness fit at 200 °C for 0.5 h. Therefore, tensile fracture morphology under these condition can be observed, as shown in Figure 14. It can be intuitively seen that the fracture cross-section of the Al/Zn layered composite plate is an obvious sandwich structure, with Zn at both ends wrapping around the middle layer of Al. The cross-section fracture of Al is very narrow, and only a line in the middle can be seen, indicating that the plastic toughness of Al is very good at this time.
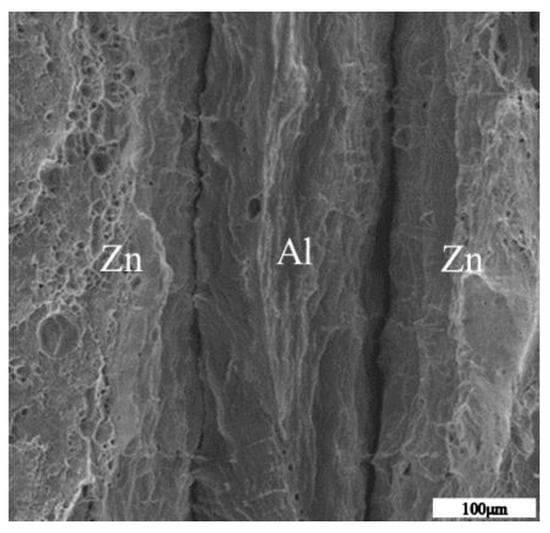
Figure 14.
Macroscale images of the fractures.
Figure 15 shows the tensile fracture morphology of the composite laminates under different annealing conditions. When the annealing condition is 200 °C × 0.5 h, the fracture after necking occurs obviously in aluminum, but the necking is not obvious in Zn, although there are many small dimples and tear edges. With an increase in temperature, necking phenomenon also appeared on the fracture surface of Al, and the tearing edge was more obvious. Furthermore, more dimples appeared on the fracture surface of Zn compared to low temperature. This can explain the better shaping of 240 °C × 0.5 h. As shown in Figure 15d,h, at higher temperatures and longer annealing times, the dimples are not seen in the morphology, and the surfaces are separated. This is why elongation at 320 °C × 2 h is the lowest and even brittle fracture occurs.
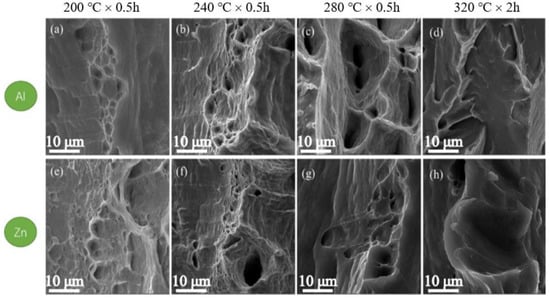
Figure 15.
Interface tensile fracture morphology of Al/Zn laminated composite laminates. The upper part of the figure is Al, and the lower part is Zn.
The strength of composites can be predicted by the rule of mixtures (ROM), and the formula is as follows [40]:
σs = σ1 × V1 + σ2 × V2
Here, σs, σ1, and σ2 represent the yield strength of the Al/Zn laminated composite plate and, the components of pure Al and pure Zn, respectively. V1 and V2 represent the volume fraction of pure Al and Zn, respectively, in the composite plate.
Table 5 lists the yield strengths calculated by ROM. Obviously, under annealing conditions at low temperature and time, the theoretical value is lower than the experimental value. In combination with the transition layer and microstructure, Zn atoms and Al atoms enter the matrix near the interface through mutual diffusion to form Al/Zn solid solution and cause lattice distortion, which makes it more difficult for a large number of dislocations to move and migrate, resulting in material strengthening. Meanwhile, the diffusion layer transfers the stress from Al to Zn, which enhances the strength and toughness of the composite plate. When the temperature rises and the time is prolonged, the grains of Al and Zn grow rapidly. At this time, the diffusion layer at the interface, as a strong interface, easily to causes stress concentration, plastic deformation, and failure fracture of the material, so that the calculated yield strength value is higher than the experimental value.
Table 5.
Yield strengths of Al/Zn LMCs, pure Al and pure Zn and the calculated yield strengths of Al/Zn LMCs, σsAl/Zn, σsAl, σsZn and σs′Al/Zn.
Figure 16 shows the micro-hardness values of the as-rolled and annealed interfaces at 280 °C × 2 h. The test point spacing is 30 μm. The micro-hardness values of pure Al and pure Zn in the rolling state are 45 HV and 63 HV, respectively. There is no obvious transition layer at the interface in Figure 16a. The micro-hardness value here is between the values of Al and Zn (51 HV). After annealing, the micro-hardness values of Al and Zn decrease to 31 HV and 42 HV, respectively, and there is an obvious diffusion layer at the interface. The micro-hardness value of interface is equivalent to that of Zn (43 HV) due to the enhancement of the diffusion layer. Combined with EBSD image analysis, grain coarsening and dislocation density reduction cause a decrease in the mechanical properties of the Al/Zn laminated composite plate. With an increase in annealing temperature, the movement ability of dislocations accumulated near the interface increases, resulting in a decrease in micro-hardness at the interface. At the same time, the hardness is equivalent to that of pure Zn. This is due to the different coordination between phases, during the annealing and subsequent cooling process, thermal misfit dislocations are introduced, which makes the micro-hardness of the interface relatively high.
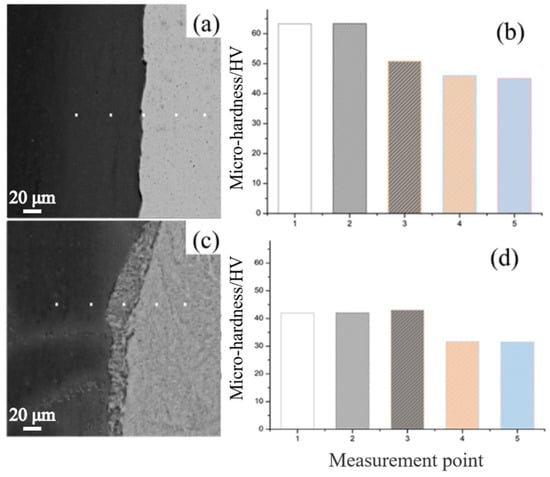
Figure 16.
Micro-hardness of the interface test points in the rolled state (a,b) and that of the interface test points at 280 °C × 2 h (c,d).
4. Conclusions
In summary, Al/Zn composite plates were prepared by combining solid-liquid composite and hot rolling, and the effect of the annealing treatment on the mechanical properties and microstructure of the composite plates was studied in detail. The main conclusions are as follows:
The grain growth rate of Zn is obviously associated with the annealing time. At the rolling state and lower temperature, the interface appears serrated. When the temperature rises, the interface becomes smooth, and a diffusion layer appears on Al side.
The mutual diffusion mechanism of Al and Zn is mainly the diffusion of Zn atoms into Al matrix, while only a small amount of Al atoms diffuses into Zn matrix. The growth rate of diffusion layer of Al/Zn composite plate is accelerated with the annealing temperature, and the growth law is in line with a parabola. The diffusion activation energy of the diffusion layer is 97.59 kJ/mol, and the growth constant k0 is 2.48 × 10⁻⁴ m2/s.
The strength and uniform elongation of the composite plate increase at low temperature and shorter time, and decrease with an increase in time and temperature. When the annealing temperature is between 200 and 280 °C, and the annealing time is 0.5 h, the strength and uniform elongation are the best combination. The tensile strength of the Al/Zn laminated composite plate is 161–194 MPa, and the uniform elongation is 26~42%.
The GND density in the grain of the Al layer is higher than that of the Zn layer. The Zn grain in the rolled state underwent recovery and recrystallization at normal temperature, resulting in the dislocation density being greatly reduced.
The diffusion layer with a certain thickness can increase the hardness of the interface, even equivalent to Zn with higher hardness.
Author Contributions
R.W.: writing, literature search, figures, data analysis. Y.D.: manuscript modification, data analysis, study design. M.P.: study design, data analysis, data interpretation, literature search. B.S.: manuscript modification, data analysis. Y.W. and R.J.: study design, provide resource assistance. M.L., C.L. and S.Z.: research idea design, data analysis. H.Q.: study design, feasibility analysis of research schemes. All authors have read and agreed to the published version of the manuscript.
Funding
This work was supported by the National Natural Science Foundation of China (Grant no. 51861013), the Key Research & Development Program of Yunnan Province (Grant no. 202103AA080017), the Key Research & Development Program of Yunnan Province (Grant no. 202203AE140011), the Key Science and Technology Project of Yunnan Province (Grant no. 202202AB080004-2) and the Analysis and Testing Foundation of Kunming University of Science and Technology (Grant no. 2020T20130148).
Institutional Review Board Statement
Not applicable.
Informed Consent Statement
Not applicable.
Data Availability Statement
Not applicable.
Acknowledgments
All individuals included in this section have consented to the acknowledgement.
Conflicts of Interest
The authors declare that they have no known competing financial interests or personal relationships that could appear to influence the work report in this paper.
References
- Lu, K.; Lu, L.; Suresh, S. Strengthening Materials by Engineering Coherent Internal Boundaries at the Nanoscale. Science 2009, 324, 349–352. [Google Scholar] [CrossRef] [PubMed]
- Kou, H.; Lu, J.; Li, Y. High-Strength and High-Ductility Nanostructured and Amorphous Metallic Materials. Adv. Mater. 2014, 26, 5518–5524. [Google Scholar] [CrossRef] [PubMed]
- Mara, N.; Bhattacharyya, D.; Hoagland, R.; Misra, A. Tensile behavior of 40 nm Cu/Nb nanoscale multilayers. Scr. Mater. 2008, 58, 874–877. [Google Scholar] [CrossRef]
- Bhattacharyya, D.; Mara, N.A.; Dickerson, P.; Hoagland, R.G.; Misra, A. Compressive flow behavior of Al-TiN multilayers at nanometer scale layer thickness. Acta. Mater. 2011, 59, 3804–3816. [Google Scholar] [CrossRef]
- Mara, N.A.; Bhattacharyya, D.; Dickerson, P.; Hoagland, R.G.; Misra, A. Deformability of ultrahigh strength 5nm Cu∕Nb nanolayered composites. Appl. Phys. Lett. 2008, 92, 231901. [Google Scholar] [CrossRef]
- Cui, Y.; Huang, P.; Wang, F.; Lu, T.; Xu, K. The hardness and related deformation mechanisms in nanoscale crystalline–amorphous multilayers. Thin Solid Films 2015, 584, 270–276. [Google Scholar] [CrossRef]
- Tayyebi, M.; Eghbali, B. Study on the microstructure and mechanical properties of multilayer Cu/Ni composite processed by accumulative roll bonding. Mater. Sci. Eng. A 2013, 559, 759–764. [Google Scholar] [CrossRef]
- Izadi, S.; Mraied, H.; Cai, W. Tribological and mechanical behavior of nanostructured Al/Ti multilayers. Surf. Coat. Technol. 2015, 275, 374–383. [Google Scholar] [CrossRef]
- Wei, A.-L.; Liu, X.-H.; Dong, L.; Liang, W. Binding property of Al/Mg/Al thin plates fabricated by one-pass hot rolling with different reduction ratios, temperatures and annealing treatments. Rare Met. 2015, 37, 136–142. [Google Scholar] [CrossRef]
- Feng, B.; Sun, Z.; Wu, Y.; Feng, X.; Wang, J.; Zheng, K. Microstructure and mechanical behavior of Mg ZK60/Al 1100 composite plates fabricated by co-extrusion. J. Alloys. Compd. 2020, 842, 155676. [Google Scholar] [CrossRef]
- Yu, S.J.; Chen, Z.F.; Wang, Y.; Luo, R.Y.; Xu, T.Z.; Pan, Y.; Liao, J.H. Fabrication of SiC/diamond composite coatings by electrophoretic deposition and chemical vapor deposition. Int. J. Appl. Ceram. Tec. 2017, 14, 644–651. [Google Scholar] [CrossRef]
- Xie, Y.C.; Chen, C.Y.; Planche, M.; Deng, S.H.; Liao, H.L. Effect of spray angle on Ni particle deposition be-haviour in cold spray, Surf. Eng. 2018, 34, 352–360. [Google Scholar]
- Spalek, N.; Brunow, J.; Braun, M.; Rutner, M. WAAM-Fabricated Laminated Metal Composites. Metals 2021, 11, 1948. [Google Scholar] [CrossRef]
- Wang, J.; Zhang, X.J.; Lu, X.; Yang, Y.S.; Wang, Z.H. Microstructure, texture and mechanical properties of hot-rolled Mg–4Al–2Sn–0.5Y–0.4Nd alloy. J. Magnes. Alloy. 2016, 4, 207–213. [Google Scholar] [CrossRef]
- Kodetová, V.; Vlach, M.; Kudrnová, H.; Leibner, M.; Málek, J.; Cieslar, M.; Bajtošová, L.; Harcuba, P.; Neubert, V. Annealing effects in commercial aluminium hot-rolled 7075(–Sc–Zr) alloys. J. Therm. Anal. Calorim. 2020, 142, 1613–1623. [Google Scholar] [CrossRef]
- Du, Y.; Fan, G.; Yu, T.; Hansen, N.; Geng, L.; Huang, X. Laminated Ti-Al composites: Processing, structure and strength. Mater. Sci. Eng. A 2016, 673, 572–580. [Google Scholar] [CrossRef]
- Kulagin, R.; Beygelzimer, Y.; Ivanisenko, Y.; Mazilkin, A.; Straumal, B.; Hahn, H. Instabilities of interfaces between dissimilar metals induced by high pressure torsion. Mater. Lett. 2018, 222, 172–175. [Google Scholar] [CrossRef]
- Ren, Y.; Tariq, N.U.H.; Liu, H.; Cui, X.; Shen, Y.; Wang, J.; Xiong, T. An innovative and flexible approach to fabricate Mg/Al composite plates: Cold spraying and hot rolling post-treatment. Mater. Sci. Eng. A 2022, 849, 143515. [Google Scholar] [CrossRef]
- Liu, H.; Zhang, B.; Zhang, G. Enhanced toughness and fatigue strength of cold roll bonded Cu/Cu laminated composites with mechanical contrast. Scr. Mater. 2011, 65, 891–894. [Google Scholar] [CrossRef]
- Liu, H.; Zhang, B.; Zhang, G. Delaying premature local necking of high-strength Cu: A potential way to enhance plasticity. Scr. Mater. 2011, 64, 13–16. [Google Scholar] [CrossRef]
- Li, L.; Nagai, K.; Yin, F. Progress in cold roll bonding of metals. Sci. Technol. Adv. Mater. 2008, 9, 023001. [Google Scholar] [CrossRef] [PubMed]
- Pintore, M.; Wölck, J.; Mittler, T.; Greß, T.; Tonn, B.; Volk, W. Composite Casting and Characterization of Cu–Al Bilayer Compounds. Int. J. Met. 2019, 14, 155–166. [Google Scholar] [CrossRef]
- Li, X.; Scherf, A.; Heilmaier, M.; Stein, F. The Al-Rich Part of the Fe-Al Phase Diagram. J. Phase Equilibria Diffus. 2016, 37, 162. [Google Scholar] [CrossRef]
- Li, L.L.; Su, Y.Q.; Beyerlein, I.J.; Han, W.Z. Achieving room-temperature brittle-to-ductile transition in ultrafine layered Fe-Al alloys. Sci. Adv. 2020, 6, eabb6658. [Google Scholar] [CrossRef]
- Guo, X.Z.; Fan, M.Y.; Liu, Z.L. Explosive Cladding and Hot Pressing of Ti/Al/Ti Laminates. Rare. Metal. Mat. Eng. 2017, 46, 1192–1196. [Google Scholar]
- Hallal, A.; Shaito, A.; Elmarakbi, A. Advanced Composite Materials for Automotive Applications: Structural Integrity and Crashworthiness; Wiley: Hoboken, NJ, USA, 2013. [Google Scholar]
- Bhoi, N.K.; Singh, H.; Pratap, S. Developments in the aluminum metal matrix composites reinforced by micro/nano particles–a review. J. Compos. Mater. 2020, 54, 813–833. [Google Scholar] [CrossRef]
- Qods, R.N.D.F.; Tajally, M. Investigation on microstructure and mechanical properties of Al–Zn composite during accumulative roll bonding (ARB) process. Mat. Sci. Eng. A 2011, 530, 63–72. [Google Scholar]
- Dehsorkhi, R.N.; Qods, F.; Tajally, M. Application of continual annealing and roll bonding (CAR) process for manufacturing Al–Zn multilayered composites. Mater. Sci. Eng. A 2012, 549, 206–212. [Google Scholar] [CrossRef]
- Zhang, C.Q.; Liu, W. Abnormal effect of temperature on intermetallic compound layer growth at aluminum-titanium interface. Mater. Lett. 2019, 254, 1–4. [Google Scholar] [CrossRef]
- Zhao, Z.; Tang, J.; Tariq, N.U.H.; Liu, H.; Liu, H.; Ren, Y.; Tong, M.; Yin, L.; Du, H.; Wang, J.; et al. Effect of rolling temperature on microstructure and mechanical properties of Ti/steel clad plates fabricated by cold spraying and hot-rolling. Mater. Sci. Eng. A 2020, 795, 139982. [Google Scholar] [CrossRef]
- Qiu, X.; Qi, L.; Tang, J.-R.; Tariq, N.U.H.; Wang, J.-Q.; Xiong, T.-Y. A viable approach to repair neutron shielding B4C/6061 Al composite sheets through cold spray and hot rolling co-treatment. J. Mater. Sci. Technol. 2021, 106, 173–182. [Google Scholar] [CrossRef]
- Sauvage, X.; Dinda, G.P.; Wilde, G. Non-equilibrium intermixing and phase transformation in severely de-formed Al/Ni multilayers. Scripta. Mater. 2007, 56, 181–184. [Google Scholar] [CrossRef]
- Yu, H.; Lu, C.; Tieu, A.K.; Li, H.; Godbole, A.; Kong, C. Annealing effect on microstructure and mechanical properties of Al/Ti/Al laminate sheets. Mater. Sci. Eng. A 2016, 660, 195–204. [Google Scholar] [CrossRef]
- Chen, Z.; Wang, D.; Cao, X.; Yang, W.; Wang, W. Influence of multi-pass rolling and subsequent annealing on the interface microstructure and mechanical properties of the explosive welding Mg/Al composite plates. Mater. Sci. Eng. A 2018, 723, 97–108. [Google Scholar] [CrossRef]
- Macwan, A.; Jiang, X.Q.; Li, C.; Chen, D.L. Effect of annealing on interface microstructures and tensile properties of rolled Al/Mg/Al tri-layer clad sheets. Mater. Sci. Eng. A. 2013, 587, 344–351. [Google Scholar] [CrossRef]
- Zhang, C.; Wang, S.; Qiao, H.; Chen, Z.; Mo, T.; Liu, Q. Enhancing the Mechanical Properties of Hot Roll Bonded Al/Ti Laminated Metal Composites (LMCs) by Pre-Rolling Diffusion Process. Metals 2019, 9, 795. [Google Scholar] [CrossRef]
- Jamaati, R.; Toroghinejad, M.R. Investigation of the parameters of the cold roll bonding (CRB) process. Mater. Sci. Eng. A 2010, 527, 2320–2326. [Google Scholar] [CrossRef]
- Qiu, X.; Tariq, N.U.; Qi, L.; Zan, Y.N.; Wang, Y.J.; Wang, J.Q.; Du, H.; Xiong, T.Y. In-situ Si-p/A380 alloy nano micro composite formation through cold spray additive manufacturing and subsequent hot rolling treatment: Microstructure and mechanical properties. J. Alloys Compd. 2019, 780, 597–606. [Google Scholar] [CrossRef]
- Feng, B.; Xin, Y.; Sun, Z.; Yu, H.; Wang, J.; Liu, Q. On the rule of mixtures for bimetal composites. Mater. Sci. Eng. A 2017, 704, 173–180. [Google Scholar] [CrossRef]


Disclaimer/Publisher’s Note: The statements, opinions and data contained in all publications are solely those of the individual author(s) and contributor(s) and not of MDPI and/or the editor(s). MDPI and/or the editor(s) disclaim responsibility for any injury to people or property resulting from any ideas, methods, instructions or products referred to in the content. |
© 2023 by the authors. Licensee MDPI, Basel, Switzerland. This article is an open access article distributed under the terms and conditions of the Creative Commons Attribution (CC BY) license (https://creativecommons.org/licenses/by/4.0/).