Abstract
Femoral nails are used to provide fixation for fractured long bones. These constructs simultaneously provide stability and union in nearly 10% of cases of premature failure. The goal of this investigation was to develop and test different models of the femur using cephalomedullary nail fixation. These models represent three different types of hip fractures (intracapsular, intertrochanteric, and subtrochanteric fractures). By testing the different fracture types, one can determine the fracture tolerance of the constructs from the resulting forces that occur due to the activities of daily living. Understanding the effects that the loads will have on the integrity of the nail-bone construct may help reduce the risks that could arise through its use. The computational simulations performed indicate that an undamaged femur can withstand the forces of 4.4× the body weight of the average adult male. A subtrochanteric femur fracture, however, can only withstand over 2.3× the same weight, nearly 50% lower than the normal femur. Regarding this lower amount, it is not impossible that an overloading scenario could occur. The data from the gait cycle show that, with a subtrochanteric fracture, the nail experiences stress that is just within the fatigue limit of the material. Given the collected data, subtrochanteric fractures are the most likely candidates for causing failures when comparing fracture types. In general, understanding the effects that different loads have on the integrity of the nail-bone construct may help reduce the risks that could arise through its use.
1. Introduction
Every year in the US, about 300,000 senior citizens aged sixty-five and older are admitted to the hospital due to hip fractures [,,]. A total of 95% of these fractures are caused by a falling [] and generally fall into three categories: intracapsular, intertrochanteric, and subtrochanteric []. Intracapsular fractures occur below the head or neck of the femur [,], intertrochanteric fractures occur between the greater and lesser trochanter [], and subtrochanteric fractures are located below the lesser trochanter []. In order to help patients recover, various treatments exist, such as the use of internal fixation devices [,]. An internal fixation device is classified as a medical device that can be implanted into the body for the purpose of bone fracture stabilization and permitting the bone to heal [].
The healing process can be interrupted if the medical device used fails. For femoral cephalomedullary nail fixation devices, the failure rate can reach 10% when used for subtrochanteric fractures [,,]. In such cases, steps must be taken to prevent future failures, including investigating the causes of the failure.
All medical devices have a risk of failure. Medical devices can fail for a variety of reasons [,], including mechanical failure, electrical failure, software failure, and material failure. When a device fails, it may no longer perform its intended function, which can lead to catastrophic consequences for the patient. It is a possibility that a medical device can become dysfunctional by physically breaking and can no longer fulfil its purpose [,,]. An instance of the former situation could be when a bone fracture does not heal properly after a few months of the implanting of an intramedullary nail. Another instance of the latter scenario could be the intramedullary nail breaking into two pieces due to overloading. A failure analysis of the medical devices and finite element computational simulations can provide valuable insight into the cause of the failure, which can help in improving the device’s design and reducing the risk of future failures [].
In order to understand how medical devices fail, there is a need for extensive efforts to be made to collect evidence. These efforts include physical examinations, testing for material and chemical properties, and numerical and computational simulations.
The main motivation of this research is to perform a computational simulation of a femoral nail fracture and investigate the failure of the intramedullary nail. In an accompanying paper, we have reported the failure analysis of the femoral cephalomedullary nail, including visual examination, observation under optical and scanning electron microscopes (SEM), chemical composition, and microstructure analysis []. In the current study, different models for the femoral bone will be developed and tested. These models will represent three different types of hip fractures. By testing different fracture types, it can be determined how these fracture types affect the forces that the nail undergoes during loading. Understanding the effect that the fractures have on the intramedullary nail can help reduce the risks that could arise through its use.
2. Materials and Methods
2.1. Design of the Failed Device
Three-dimensional representations of the femoral intramedullary nail and the screws were generated using SolidWorks 2019 software. The models for the intramedullary nail and helical screw were generated using the measurements from Hamandi et al. []. The information obtained provided important specifications for the recreation of the cephalomedullary (CM) nail, including the length of the nail and screws, curvatures, and orientation of the screws in relation to the femoral nail. Measurements were taken from the intramedullary nail to gather the missing information needed to create the 3D models (Figure 1 and Figure 2).
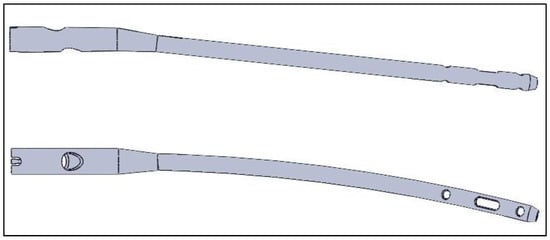
Figure 1.
Generated model for the femoral nail. Reprinted from Ref. [].
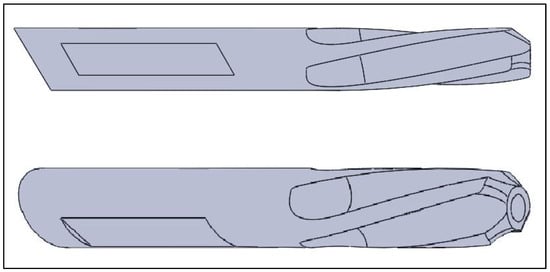
Figure 2.
Generated model for the helical screw. Reprinted from Ref. [].
2.2. Design the Femoral Bone
For the experiment, adult femur models were created using Mimics Research 19.0 and 3-matic Research 13.0. The models included a normal femur and ones that simulated various hip fractures (intracapsular, intertrochanteric, and subtrochanteric). The models were combined with the intramedullary nail, helical screw, and two-cortical-screw models for finite element analysis. The process began with a computer tomography (CT) scan of an adult right femur and the use of Mimics 19.0 software to generate masks and three-dimensional models of the bone. The models were then imported into 3-matric 13.0 for mesh generation and editing to simulate fractures. After the meshes were generated, they were imported back into Mimics to assign material properties based on the bone’s Hounsfield units (HU).
The femur model, created by compiling masks in Mimics software, was then transferred into 3-matric software for mesh generation and special condition editing (as shown in Figure 3). Three femoral bone models were produced, from which the femurs that simulated different types of common hip fractures were made. These fractures included intracapsular, intertrochanteric, and subtrochanteric (as shown in Figure 4). This was achieved by first mapping the fracture paths on the surface mesh and then making a sweeping cut around the femur’s features by removing 1 millimetre of the bone at three different levels. The mesh was then regenerated to produce the three models of fractured bones.
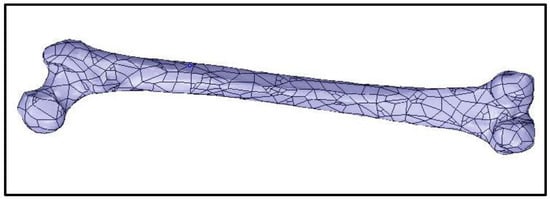
Figure 3.
Generated model of an adult right femur. Reprinted from Ref. [].
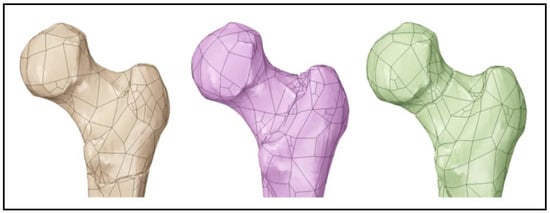
Figure 4.
Femur model with a subtrochanteric fracture (left), intertrochanteric fracture (middle), and intracapsular fracture (right). Reprinted from Ref. [].
After the meshes were created, the models were brought back into Mimics to assign realistic material behaviour to the femurs. Human bones have anisotropic properties, unlike the intramedullary nail, which means their properties vary depending on the area under load due to differences in bone density. Equations for the modulus of elasticity and Poisson’s ratio were assigned to the femur and distributed based on the corresponding HU values of the bone [].
2.3. Finite Element Analysis
The models of the intramedullary nail, helical screw, cortical screws, and femoral bones were imported into ANSYS Workbench 2022 R1 for simulation. Before the simulation, the material properties were assigned to the intramedullary nail and the screws, and boundary conditions were assigned to all models. The material properties of the device parts were assigned as those of the titanium alloys Ti-15Mo for the CM nail and Ti-6Al-7Nb for the screws, as per ASTM F2066-18 and ASTM F1295-05 standards [,,]. For the simplified femur models, the cortical and cancellous parts were assigned a modulus of elasticity of 12.7 GPa and 0.9 GPa and a Poisson’s ratio of 0.3 and 0.2, respectively [,,,].
The intramedullary nail, the helical screw, and the two cortical screws were positioned within the femur model, with the helical screw aligned along the femoral neck and its tip near the centre of the femoral head (Figure 5). The axis of the helical screw model was configured to match the axis of the cylindrical shaft in the CM nail, and the long body of the nail was positioned as close to the centre of the long part of the femur as possible without affecting the other boundary relationships. The intracapsular and intertrochanteric fractures in the femur were divided along their fracture surfaces to allow for the addition of friction coefficients between the fractured parts of the bone. With the geometry established, the numerical simulation of the finite element analysis could proceed.
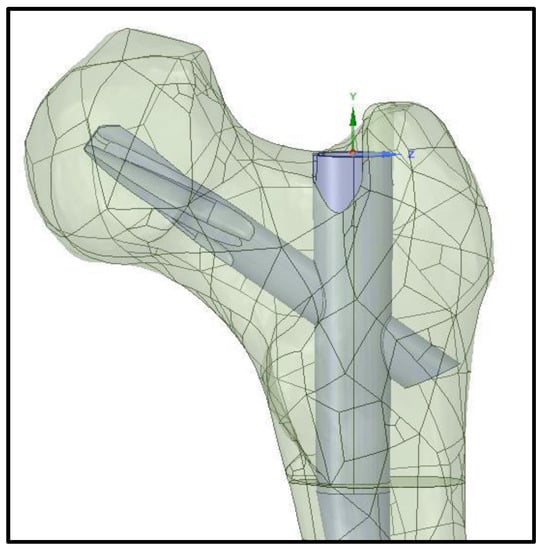
Figure 5.
Femoral nail positioned within the femur model.
The four femur models were subjected to three different loading scenarios as part of the finite element analysis. These scenarios were (1) axial compression load, (2) axial compression load with torsion, and (3) gait cycle. The goal of the two compression tests was to determine the amount of force needed to cause the nail to fail in order to assess the likelihood of this happening under normal use. The gait cycle scenario was performed to understand the stress and forces involved during the cycle and whether these forces are sufficient for mechanical fatigue to occur. Before the simulations could be carried out, all the boundaries had to be defined, and the meshes had to be generated for the models. The number of nodes and elements created during the meshing process is listed in Table 1.

Table 1.
Number of nodes and elements per femur model.
For the finite element analysis, the friction coefficients were defined between the different objects. The coefficient of friction between the nail and the screw, as well as between the device and the bone, was set to 0.35 and 0.4, respectively []. For the femoral bone models with fractures, a coefficient of 0.4 was given between the fractured surfaces [,]. The cortical and cancellous parts of the femur that were divided for assigning different material properties were considered bonded. In the simulations of the combined compression and torsion to failure, the boundary conditions for the models were almost identical, with both the fixed support and compressive forces applied as before. Additionally, a bending moment was applied to the nail body, with the rotational force ranging from 5 Nm to 45 Nm, increasing by 5 Nm per step. With these conditions, the simulations were run to collect the same data as the compression-only tests.
The final tests evaluated the impact of the gait cycle on the intramedullary nail. These tests involved different types of forces than the previous tests, as the gait forces are three-dimensional and have different magnitudes in the x, y, and z directions for each step taken.
2.4. Comparison with Experimental Work
The experiments conducted at the biomechanics laboratory located at Miami Valley Hospital in Dayton, Ohio, USA, included 28 pairs of cadaveric femurs with fixation devices (Figure 6) [], which were compared with the current study models. Although, only the models with long titanium nails (7 pairs) were included in the evaluation. To validate the computational simulation, the comparison focused on comparing the impact on the femoral bone and the CM nail, with a particular emphasis on exploring the differences between the simulation and experimental results in terms of bone stiffness, taking into account the material used in the device.
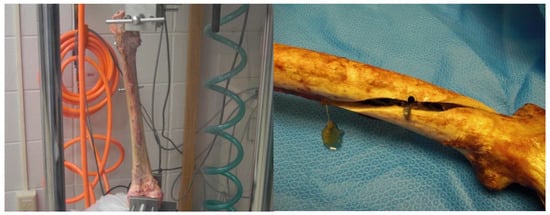
Figure 6.
The femoral bone with the nail testing setup in the EnduraTEC BOSE machine (left). Model failure due to torsion (right). Reprinted from Ref. [].
3. Results and Discussion
The data were gathered from the four different models under three different conditions of loading.
A physical examination of the models was beneficial in identifying areas with high levels of stress. The visual representation was a helpful tool in assessing the validity of the results. Figure 7, Figure 8, Figure 9, Figure 10, Figure 11 and Figure 12 represent the von Mises stress, total deformation, and shear stress distribution on the femoral model and on the nail and the helical screw in the intracapsular fracture under axial compression and torsion scenario.
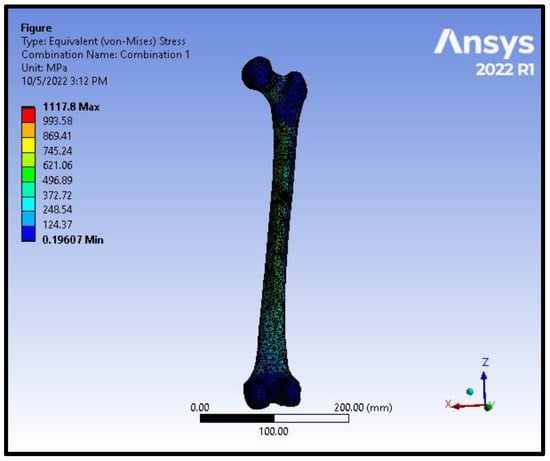
Figure 7.
von Mises stress distribution on the femoral model in an intracapsular fracture under axial compression and torsion scenario.
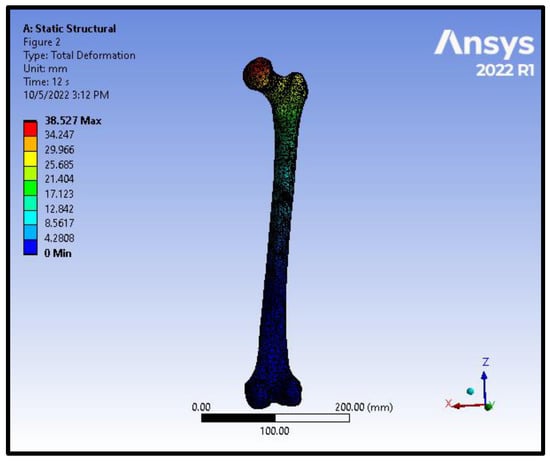
Figure 8.
Total deformation distribution on the femoral model in an intracapsular fracture under axial compression and torsion scenario.
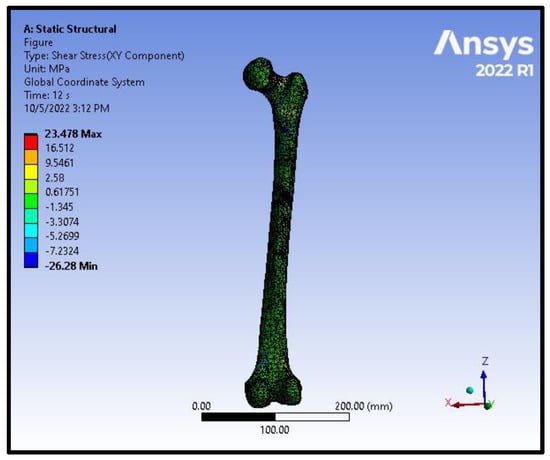
Figure 9.
Shear stress distribution on the femoral model in an intracapsular fracture under axial compression and torsion scenario.
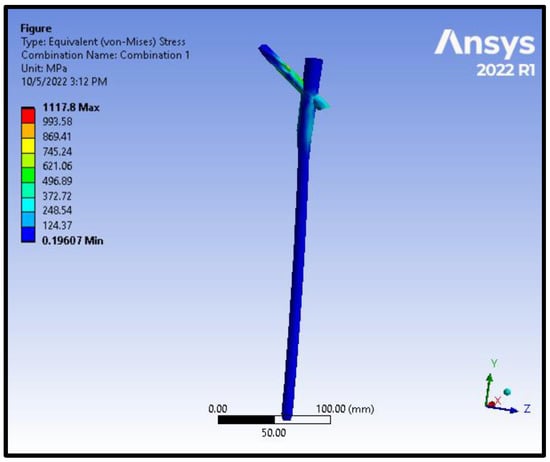
Figure 10.
von Mises stress distribution on the nail and the helical screw from the model of an Intracapsular fracture under axial compression and torsion scenario.
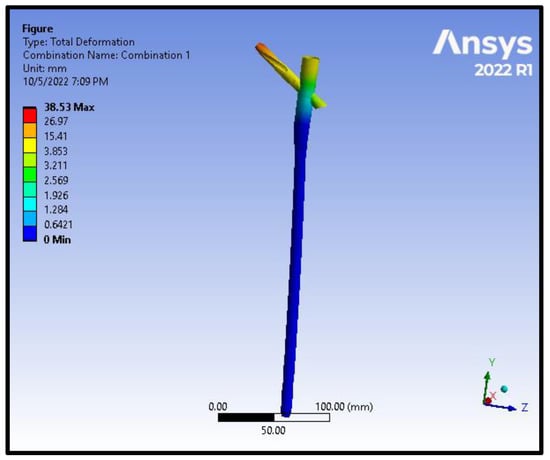
Figure 11.
Total deformation distribution on the nail and the helical screw from the model of an intracapsular fracture under axial compression and torsion scenario.
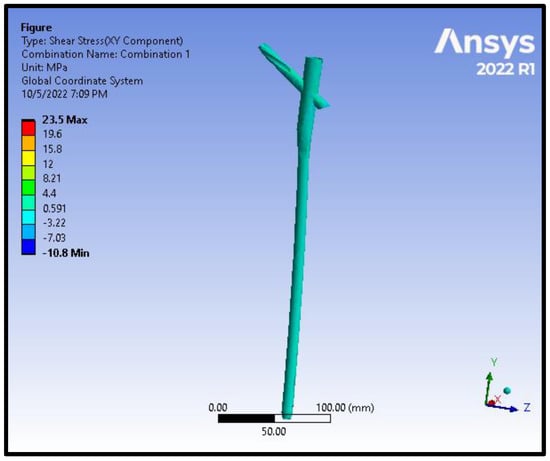
Figure 12.
Shear stress distribution on the nail and the helical screw from the model of an intracapsular fracture under axial compression and torsion scenario.
In order to analyse the stress, total deformation, equivalent elastic strain, and shear stress, data were gathered. In order to determine the highest values for these data sets, we needed to calculate the loads at the area of femoral CM nail failure. The collected data were input into JMP Pro 13 software for analysis. The software plotted the data in Newtons and Newton metres on the x-axis and the stresses on the y-axis. After plotting the data, the program determined a linear fit equation for the data set.
Equations for stress in axial compression loading to failure are presented in Table 2.
Table 2.
Equations for stress in axial compression loading to failure.
Equations for stress in axial compression loading and torsion to failure are presented in Table 3.
Table 3.
Equations for stress in axial compression loading and torsion to failure.
Equations were also generated for total deformation, equivalent elastic strain, and shear stress by using the same methods.
Equations for total deformation in axial compression loading to failure are presented in Table 4.
Table 4.
Equations for total deformation in axial compression loading to failure.
Equations for elastic strain in axial compression loading to failure are presented in Table 5.
Table 5.
Equations for elastic strain in axial compression loading to failure.
Equations for shear stress in axial compression loading to failure are shown in Table 6.
Table 6.
Equations for shear stress in axial compression loading to failure.
Equations for total deformation in axial compression loading with torsion to failure are presented in Table 7.
Table 7.
Equations for total deformation in axial compression loading with torsion to failure.
Equations for elastic strain in axial compression loading with torsion to failure are presented in Table 8.
Table 8.
Equations for elastic strain in axial compression loading with torsion to failure.
Equations for shear stress in axial compression loading with torsion to failure are presented in Table 9.
Table 9.
Equations for shear stress in axial compression loading with torsion to failure.
Using the above equations, we can calculate the force needed to cause failure and the time of failure, as shown in Figure 13 and Table 10. The results for the force at the time of failure can be used in the equations to find the maximum values of total deformation, equivalent elastic strain, and shear stress at the time of failure (Table 11 and Table 12). The maximum values during the gait cycle simulations are presented in Table 13.
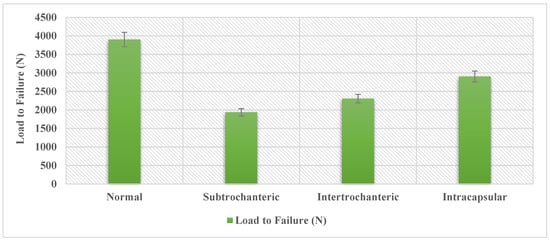
Figure 13.
Load to failure in axial compression scenario.
Table 10.
Max stress from the loading simulations, where BW is the body weight.
Table 11.
Max deformation, strain, and shear in axial compression load to failure scenario.
Table 12.
Max deformation, strain, and shear in axial compression load with torsion to failure scenario.
Table 13.
Max deformation, strain, and shear in gait cycle scenario.
The data produced from the finite element analysis can provide a comparison of how fracture type influences the internal forces in the nail. Using the weight of the average adult male, 800 N [], and the average torsion experienced during walking, 13 Nm [], the data can be expressed as a ratio of average body weight and average torsion. A femur with a complete subtrochanteric fracture fairs the worst, only being able to withstand 1935.88 N, just 2.42 times the average weight of an adult male. When factoring in the torsion that would be present in a realistic loading scenario, the loading needed to fail was reduced to 3510.78 N, a 10% decrease. The subtrochanteric fracture again shows the largest change, decreasing to 1838.02 N. That is a 5% reduction with only being able to withstand 2.3 times the body weight of an adult male. The information generated also gives some insight into how different fractures influence the stress produced within the intramedullary nail. When comparing the fracture types to the normal femur model, the subtrochanteric, intertrochanteric, and intracapsular have a 50%, 41%, and 26% decrease in max load-to-failure, respectively. The data also show that when adding torsion, the intracapsular fracture demonstrated almost no change in the load to failure. The added torsion did, however, have a significant effect on decreasing the load to failure in the other fracture types. When considering the effect of the gait cycle on the nail, the data show that all the femur models were experiencing loads of up to 420–580 MPa, depending on the fracture type. The fatigue limit of the titanium alloy Ti-6Al-7Nb is 580 per 106 cycles []. When considering that there is only one fracture type that produces stress in this range, it is possible that the subtrochanteric fracture loads the nail beyond the fatigue limit of the material. When loading is at the threshold, it will take 10 million loading cycles before the material fails. This would take more time than what is needed for the nail to heal the fracture, as these types of internal fixation devices are not designed to be used indefinitely. It is important to note that these tests consider that the nail is without any damage. While the device is not likely to fail from the cyclic loading from walking on its own, this could change if the device is damaged.
Fatigue analysis was carried out, and stiffness was modelled with respect to the number of cycles for all the models under the torsion scenario during cyclic loading. Figure 14 illustrates that stiffness follows a two-stage behaviour where most of the stiffness reduction occurred during the first 103 cycles, following a plateau after that.
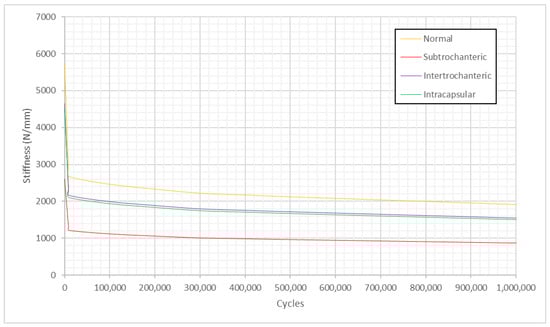
Figure 14.
Stiffness versus fatigue cycles under the torsion scenario during cyclic loading.
Damage accumulation was analysed using the relationship between it and axial stiffness, as used previously by Hamandi et al. []. Figure 15 shows that damage versus the number of cycles follows a two-stage mechanism and is modelled by a nonlinear regressive Michaelis-Menten equation, as discussed in our previous work [], where we performed an experimental investigation on 28 pairs of cephalomedullary nails with damage accumulation and found that damage follows stage I and stage II behaviour and is modelled by Michaelis-Menten equation.
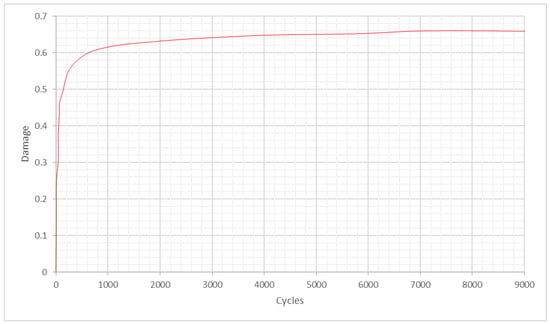
Figure 15.
Damage versus fatigue cycles under the torsion scenario during cyclic loading.
A comparison with previous experimental work was performed, and stiffness and displacement were measured for all the models under the torsion scenario. The experimental work, which was performed at a biomechanics laboratory, included 28 pairs of cadaveric femurs with fixation devices. Although, only the models with long titanium nails (7 pairs) were included in the evaluation. This comparison focuses on comparing the effect on the bone and nail, as it was essential to explore the computational simulation variations in bone stiffness with the experimental results to validate the simulation when taking the material of the device into consideration. In order to measure the stiffness of the femoral bone model with intertrochanteric fracture, data were generated from 29,053 elements and were then analysed. The same procedure was performed on all the other models. It appears that the mean stiffness of the normal femoral bone model was 5735.503 N/mm; for the femoral bone model with subtrochanteric fracture, it was 2605 N/mm; for the femoral bone model with intertrochanteric fracture, it was 4654.359 N/mm, and for the femoral bone model with intracapsular fracture, it was 4518.769 N/mm. On the other hand, if we look into the stiffness of the undamaged bone, it would be 4864 N/mm [], which is in good agreement with the current computational simulation results. The results illustrate that the load to failure was 37% higher in the experimental work than in the normal model computational simulation and 48% higher than in the intracapsular model simulation. Additionally, the results demonstrate that the stiffness was 30% higher in the experimental work than in the subtrochanteric model simulation and 22% lower than in the intracapsular model computational simulation. The difference in stiffness could be a consequence of the deformation between the grips in the experimental work and the point-to-point in the finite element simulations. Despite this, the results can be considered satisfactory with a degree of confidence, and the finite element simulations were in good agreement with the previous experimental work, as shown in Figure 16 and Figure 17. Furthermore, Figure 16 demonstrates that the highest stiffness in the normal model computational simulation and the decrease in stiffness as the fracture moves away from the head of the femur are the lowest in the subtrochanteric model.
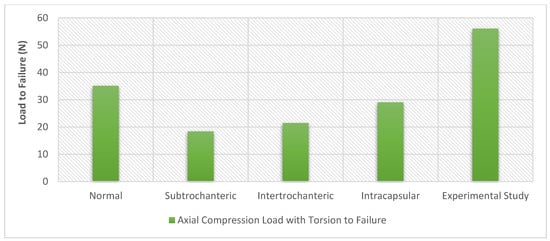
Figure 16.
Load to failure for the experimental work performed by Hamandi et al [] versus the computational finite element simulations results under the torsion scenario.
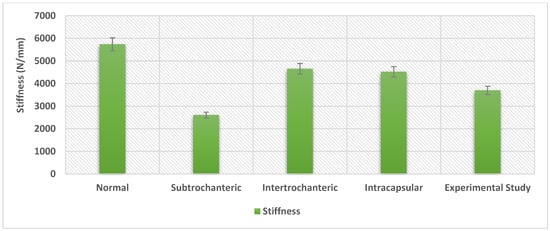
Figure 17.
The stiffness for the experimental work performed by Hamandi et al [] versus the computational finite element simulations results under the torsion scenario.
4. Conclusions
This study tested different femur models to represent three different types of hip fractures (intracapsular, intertrochanteric, and subtrochanteric). By evaluating the different fracture types, the tolerance of the constructs to the forces of daily activities could be determined. The computational simulations demonstrate that an undamaged femur can withstand forces equivalent to 4.4 times the body weight of the average adult male. However, a subtrochanteric femur fracture can only withstand over 2.3 times that weight, which is nearly 50% lower than a normal femur, making an overloading scenario possible. The gait cycle data show that the nail experiences stress close to the fatigue limit of the material with a subtrochanteric fracture. Based on the data, subtrochanteric fractures are the most likely cause of failures among the various fracture types. In general, understanding the effects that different loads have on the integrity of the nail-bone construct may help reduce the risks that could arise through its use.
Author Contributions
Conceptualization, F.H. and T.G.; methodology, S.W. and F.H.; software, S.W. and F.H.; validation, S.W., F.H. and T.G.; investigation, S.W. and F.H; resources, I.V.; data curation, I.V.; writing—original draft preparation, S.W. and F.H.; writing—review and editing, T.G.; visualization, F.H.; project administration, T.G. and I.V. All authors have read and agreed to the published version of the manuscript.
Funding
This research received no external funding.
Institutional Review Board Statement
Not applicable.
Informed Consent Statement
Not applicable.
Data Availability Statement
Data are contained within the article.
Conflicts of Interest
The authors declare no conflict of interest.
References
- Cooper, C.; Campion, G.; Melton, L.J., 3rd. Hip fractures in the elderly: A world-wide projection. Osteoporos. Int. 1992, 2, 285–289. [Google Scholar] [CrossRef] [PubMed]
- Gullberg, B.; Johnell, O.; Kanis, J.A. World-wide Projections for Hip Fracture. Osteoporos. Int. 1997, 7, 407–413. [Google Scholar] [CrossRef] [PubMed]
- Centers for Disease Control and Prevention. Hip Fractures among Older Adults. 20 September 2016. Available online: https://www.cdc.gov/falls/hip-fractures.html (accessed on 8 April 2019).
- Hip Fracture. Available online: https://www.physio-pedia.com/Hip_Fracture#cite_note-7 (accessed on 15 April 2019).
- Asnis, S.E.; Wanek-Sgaglione, L. Intracapsular fractures of the femoral neck. Results of cannulated screw fixation. J. Bone Jt. Surg. 1994, 76, 1793–1803. [Google Scholar] [CrossRef] [PubMed]
- von Rüden, C.; Hungerer, S.; Augat, P.; Trapp, O.; Bühren, V.; Hierholzer, C. Breakage of cephalomedullary nailing in operative treatment of trochanteric and subtrochanteric femoral fractures. Arch. Orthop. Trauma Surg. 2015, 135, 179–185. [Google Scholar] [CrossRef]
- Lawrence, T.M.; White, C.T.; Wenn, R.; Moran, C.G. The current hospital costs of treating hip fractures. Injury 2005, 36, 88–91. [Google Scholar] [CrossRef]
- Black, D.M.; Kelly, M.P.; Genant, H.K.; Palermo, L.; Eastell, R.; Bucci-Rechtweg, C.; Cauley, J.; Leung, P.C.; Boonen, S.; Santora, A.; et al. Bisphosphonates and Fractures of the Subtrochanteric or Diaphyseal Femur. N. Engl. J. Med. 2010, 362, 1761–1771. [Google Scholar] [CrossRef]
- Lotz, J.C.; Cheal, E.J.; Hayes, W.C. Fracture Prediction for the Proximal Femur Using Finite Element Models: Part I—Linear Analysis. J. Biomech. Eng. 1991, 113, 353–360. [Google Scholar] [CrossRef]
- Johner, R.; Wruhs, O. Classification of tibial shaft fractures and correlation with results after rigid internal fixation. Clin. Orthop. Relat. Res. 1983, 178, 7–25. [Google Scholar] [CrossRef]
- Cook, S.D.; Renz, E.A.; Barrack, R.L.; Thomas, K.A.; Harding, A.F.; Haddad, R.J.; Milicic, M. Clinical and metallurgical analysis of retrieved internal fixation devices. Clin. Orthop. Relat. Res. 1985, 194, 236–247. [Google Scholar] [CrossRef]
- Johnson, N.; Uzoigwe, C.; Venkatesan, M.; Burgula, V.; Kulkarni, A.; Davison, J.; Ashford, R. Risk factors for intramedullary nail breakage in proximal femoral fractures: A 10-year retrospective review. Ann. R. Coll. Surg. Engl. 2017, 99, 145–150. [Google Scholar] [CrossRef]
- Shemshaki, H.R.; Mousavi, H.; Salehi, G.; Eshaghi, M.A. Titanium elastic nailing versus hip spica cast in treatment of femoral-shaft fractures in children. J. Orthop. Traumatol. 2011, 12, 45–48. [Google Scholar] [CrossRef]
- Weiss, I.; Semiatin, S. Thermomechanical processing of beta titanium alloys—An overview. Mater. Sci. Eng. A 1998, 243, 46–65. [Google Scholar] [CrossRef]
- Harding, J.L.; Reynolds, M.M. Combating medical device fouling. Trends Biotechnol. 2014, 32, 140–146. [Google Scholar] [CrossRef] [PubMed]
- Palanisamy, A.M.; Doshi, H.; Selvaraj, D.; Chan, W.; Naidu, G.; Ramason, R. Fixation versus replacement in geriatric hip fractures: Does functional outcome and independence in self-care differ? Geriatr. Orthop. Surg. Rehabil. 2015, 6, 258–262. [Google Scholar] [CrossRef] [PubMed]
- Burghardt, R.D.; Specht, S.C.; Herzenberg, J.E. Mechanical failures of eight-plateguided growth system for temporary hemiepiphysiodesis. J. Pediatr. Orthop. 2010, 30, 594–597. [Google Scholar] [CrossRef] [PubMed]
- Muminagic, S.N. History of Bone Fracture: Treatment and Immobilization. Mater. Socio Medica 2011, 23, 111–116. [Google Scholar] [CrossRef]
- Goswami, T.; Gundapaneni, D.; Slocum, M.; Paul, P.; Christof, S. Failure investigation of a tibiotalocalcaneal arthrodesis system. Eng. Fail. Anal. 2016, 59, 588–604. [Google Scholar] [CrossRef]
- Hamandi, F.; Whatley, S.; Simon, G.; Venkat, I.; Goswami, T. Failure Analysis of a Femoral Cephalomedullary Nail. Metals 2023, 13, 506. [Google Scholar]
- Whatley, S.C. Computational Simulation of a Femoral Nail Fracture. Master’s Thesis, Wright State University, Dayton, OH, USA, 2019. [Google Scholar]
- Hodgskinson, R.; Currey, J.D. Young’s modulus, density and material properties in cancellous bone over a large density range. J. Mater. Sci. Mater. Med. 1992, 3, 377–381. [Google Scholar] [CrossRef]
- ASTM F2066-18; Standard Specification for Wrought Titanium-15 Molybdenum Alloy for Surgical Implant Applications (UNS R58150). ASTM International: West Conshohocken, PA, USA, 2018. Available online: https://www.astm.org/f2066-18.html (accessed on 20 May 2019).
- ASTM F1295-05; Standard Specification for Wrought Titanium-6 Aluminum-7 Niobium Alloy for Surgical Implant Applications (UNS R56700). ASTM International: West Conshohocken, PA, USA, 2005. Available online: https://www.astm.org/f1295-05.html (accessed on 20 May 2019).
- ASTM F620-00; Standard Specification for Alpha Plus Beta Titanium Alloy Forgings for Surgical Implants. ASTM International: West Conshohocken, PA, USA, 2000. Available online: https://www.astm.org/f0620-20.html (accessed on 20 May 2019).
- Hamandi, F.; Laughlin, R.; Goswami, T. Failure analysis of PHILOS plate construct used for pantalar arthrodesis Paper II—Screws and FEM simulations. Metals 2018, 8, 279. [Google Scholar] [CrossRef]
- Hamandi, F.; Goswami, T. Macrodamage Accumulation Model for a Human Femur. Appl. Bionics Biomech. 2017, 2017, 4539178. [Google Scholar] [CrossRef] [PubMed]
- Ina, J.; Vallentyne, M.; Hamandi, F.; Shugart, K.; Boin, M.; Laughlin, R.; Goswami, T. Failure Analysis of PHILOS Plate Construct Used for Pantalar Arthrodesis Paper I—Analysis of the Plate. Metals 2018, 8, 180. [Google Scholar] [CrossRef]
- Zannoni, C.; Mantovani, R.; Viceconti, M. Material properties assignment to finite element models of bone structures: A new method. Med. Eng. Phys. 1999, 20, 735–740. [Google Scholar] [CrossRef] [PubMed]
- Lotz, J.C.; Cheal, E.J.; Hayes, W.C. Fracture Prediction for the Proximal Femur Using Finite Element Models: Part II—Nonlinear Analysis. J. Biomech. Eng. 1991, 113, 361–365. [Google Scholar] [CrossRef] [PubMed]
- Hamandi, F.; Whitney, A.; Stouffer, M.H.; Prayson, M.J.; Rittweger, J.; Goswami, T. Cyclic Damage Accumulation in the Femoral Constructs Made with Cephalomedullary Nails. Front. Bioeng. Biotechnol. 2021, 8, 593609. [Google Scholar] [CrossRef] [PubMed]
- Ogden, C.L.; Fryar, C.D.; Carroll, M.D.; Flegal, K.M. Mean Body Weight, Height, and Body Mass Index, United States 1960–2002; Department of Health and Human Services, Centers for Disease Control and Prevention, National Center for Health Statistics: Hyattsville, MA, USA, 2004. [Google Scholar]
- Farhoudi, H.; Oskouei, R.H.; Pasha Zanoosi, A.A.; Jones, C.F.; Taylor, M. An Analytical Calculation of Frictional and Bending Moments at the Head-Neck Interface of Hip Joint Implants during Different Physiological Activities. Materials 2016, 9, 982. [Google Scholar] [CrossRef]
- Niinomi, M. Fatigue characteristics of metallic biomaterials. Int. J. Fatigue 2007, 29, 992–1000. [Google Scholar] [CrossRef]
Disclaimer/Publisher’s Note: The statements, opinions and data contained in all publications are solely those of the individual author(s) and contributor(s) and not of MDPI and/or the editor(s). MDPI and/or the editor(s) disclaim responsibility for any injury to people or property resulting from any ideas, methods, instructions or products referred to in the content. |
© 2023 by the authors. Licensee MDPI, Basel, Switzerland. This article is an open access article distributed under the terms and conditions of the Creative Commons Attribution (CC BY) license (https://creativecommons.org/licenses/by/4.0/).