Article

The Microstructure Characteristics Evolution of Bulk High-Purity Silver for High Relief Application

School of Mechanical Engineering, University of Science and Technology Beijing, Beijing 100083, China
*
Author to whom correspondence should be addressed.
Metals 2023, 13(3), 463; https://doi.org/10.3390/met13030463
Submission received: 6 December 2022 / Revised: 16 February 2023 / Accepted: 19 February 2023 / Published: 23 February 2023

Abstract

:
Silver products with high relief have become popular in the silver decoration industry. However, it is difficult to obtain these products through conventional processing at ambient temperature. The aim of this work is to solve this problem by increasing the deformation temperature. Detailed studies were conducted on the evolution of microstructure characteristics in bulk high-purity silver by electron backscatter diffraction (EBSD) to achieve high-relief applications at elevated temperatures. The high temperature sample is mainly composed of recrystallized and substructured grains, exhibiting a more stable state than the ambient temperature sample. More than 70% annealing twins are observed in the hot-working sample. They are characterized by the amount of Σ3n-type triple grain boundary junctions within large grain clusters formed by multiple twinning. These particular boundaries improve the intergranular corrosion resistance and degradation, which is significantly essential for high-purity silver jewelry exposed to sweat and air. The closed multi-coining processes at different temperatures were conducted subsequently. The performance of workpieces demonstrates that increasing the deformation temperature is a viable alternative for producing durable high-relief silver products.

1. Introduction

Due to the relatively low price, ornamental value, and good reflectivity after polishing, silver (Ag) plays an irreplaceable role in the jewelry, silverware, commemorative coin, and decoration industries. The manufacturing process for Ag products is usually carried out at ambient temperature because of the excellent ductility and relatively low yield strength. The closed multi-coining process has been the primary method for producing such bulk noble metals to minimize material loss [1]. This could be used to provide a functional and decorative surface geometry. Nevertheless, it is difficult to produce high-relief products by cold working accompanying low eligible products ratio [2], particularly when the surfaces of the three-dimensional products are surrounded by relief. Moreover, a self-annealing phenomenon usually occurs in cold-working Ag during long-term storage in air at ambient temperature [3,4,5]. This phenomenon significantly reduces the hardness and tensile strength of the material. It causes high-purity Ag to soften and become more susceptible to surface scratching, even after it has been hardened by straining. The corrosion resistance of high-purity Ag to air and human sweat is also essential for retaining the surfaces’ high brightness. The manufacturing process must be improved to meet all of these greater requirements.
As a typical extremely low stacking fault energy (SFE) face-centered cubic (FCC) polycrystal with pure Ag = 22 mJ/m2 [6], both dislocation glide and mechanical twinning will take place during the deformation process. This leads to a remarkable difference in microstructure evolution and grain boundary character distribution between Ag and those of high SFE FCC metals. As reported by Hegedűs et al. [7], the dislocation density saturation value of 4N purity Ag is exceptionally high compared with other pure FCC metals via the same processing. It resulted in more twin faults yielding at dislocation glide obstacles. In an investigation of the formation mechanisms of Brass-type shear bands, Paul et al. [8] determined that even at relatively low strain, deformation twins occur extensively. As part of grain boundary engineering, annealing twins are also used to alter grain boundary character distribution to improve bulk properties related to grain boundaries. The recrystallization of Ag is highly dependent on the manufacturing process and the purity of the metal [9,10,11]. Furthermore, the recrystallization process is considered to be accompanied by twinning right from the beginning [12]. Chen [13] found that recrystallization occurred in high-purity Ag after natural aging for 3 months and many annealing twins with the primary orientation {012} after a year. A study by Paul et al. [14] found that twins increase radically as recrystallization proceeds during the heat-treatment.
As mentioned above, research has been conducted to explore the evolution of microstructures and grain boundary distributions during cold-working and heat-treatment. However, few studies have focused on the characteristic of high-purity Ag at high temperature. The flow stress of metals and their formability are known to be affected by temperature. The calculated real contact pressure of the coining process was found to be relatively stable at 2.6–2.7 times the yield stress for various surface geometries [1]. In the event that the coining temperature is lowered, there will be a greater elastic deformation of the dies and the coining machine due to the load, compromising the desired accuracy of the products [15]. The process of deformation at high temperatures improves the blank formability and requires less energy than that at ambient temperature. Considering the actual industrial production, increasing the deformation temperature of the coining process, which replaces the conventional cold working process, could be an excellent alternative to manufacture high-relief Ag products without sacrificing quality. However, over-heating can result in die life being reduced to one-third of what is generally expected [15], as well as a variety of defects, including the appearance and quality of products [16]. Thus, the processing temperature range plays an important role in the coining process.
The present work experimentally evaluates the feasibility of high-relief applications for the purity Ag at elevated temperatures and preliminary discuss the optimal temperature range for the high temperature coining process. Knowledge of the material’s characteristics is very helpful in planning the precision coining process. Based on the characterization techniques of electron backscattered diffraction (EBSD), a comprehensive analysis has been conducted on the evolution of microstructure characteristics in the bulk high-purity silver sample obtained by hot-working and compared to the sample obtained at ambient temperatures. Particular focus is directed on grain boundary character distribution and the role of twins. The experiments of closed multi-coining processes for high-relief silver coins at different temperatures were conducted following the verification and analysis of material properties. The present study aims to evaluate the workability of high-purity Ag at different temperatures for the coining process. The analysis provides a deeper understanding of the microstructure characteristics of the low SFE material-high-purity Ag. Based on the theoretical guidance, it is helpful in further planning the process procedures and industrial production for the innovative hot-working coining process.

2. Material and Experiments

The 99.99wt% high-purity Ag was supplied by China GOLD Coin Incorporation. As shown in Figure 1a, samples were compressed with a reduction of 85% and a strain rate of 0.1 s−1 at two different temperatures. After that, they naturally aged for more than one year. One was processed by hot-working at 600 °C and air cooling and was named HS-600. The other was obtained at the ambient temperature of 25 °C and was called RS-25. Both samples were not annealed since the mechanical properties are insignificant for the Ag products used as decorative items. EBSD technology was used to study the microstructure characteristics in bulk high-purity Ag under various deformation temperatures. A macroscopic coordinate system for the deformed specimens consists of an axial direction (AD) and two radial directions (RD1 and RD2). The RD1 and RD2 are mutually perpendicular and were chosen arbitrarily. The specimens were cut along the compression axis, and the observed areas were longitudinal sections. Afterward, they were polished with argon ions. With an accelerating voltage of 15 kV, EBSD data was obtained with a step size of 0.25~2.5 μm, depending on the grain size. For RS-25, the measuring area was 223.5 × 167.5 μm2. For HS-600, it was 2235 × 1675 μm2. The average percentage of indexed points within an individual scan was over 99%. Post-analysis of the microstructure characteristics of the samples was performed using HKL Channel 5 and AztecCrystal analysis software.
Based on an analysis of material microstructure, closed multi-coining processes at different temperatures were conducted to evaluate the feasibility of the proposed method. Experimental samples were taken from the cold-rolled silver plate. The unmachined cylindrical workpieces for the coining process were obtained by blanking process. The original blanks measure 38.8 mm in diameter and 5 mm in height. As depicted in Figure 1b, the image of Einstein was 5 mm in relief height and 40 mm in diameter. It was used as a top die, and the surface of the bottom die was smooth. Both dies were made of hot work die steel to minimize the effects of temperature. The target temperatures were achieved using a box-type resistance furnace, and the target patterns were obtained by the YB350-1 embossing machine.

3. The Evolution of Microstructure Characteristics

3.1. The Flow Behaviour

Figure 2 illustrates the true stress-strain curves of high-purity Ag at various temperatures. In accordance with other metals, the flow stress of high-purity Ag decreases with increasing deformation temperatures at a constant strain rate. However, significant differences in the shapes of flow curves are observed with changes in temperature. The stress-strain curves exhibit the characteristic of work hardening at 25 °C and dynamic recrystallization at 600 °C. The difference in the flow behaviour of the high-purity Ag at different temperatures can be attributed to the internal deformation mechanism. Detailed discussion of these phenomena will be provided in the following sections from a microstructural perspective.

3.2. Microstructure Characterization

According to Figure 3 of the band contrast (BC) maps, both samples are composed of polyhedral coarse grains, slender grains, and equiaxed grains. In RS-25, there are some elongated and parallel grains throughout the matrix, whereas HS-600 has concentrated fine-grain bands marked in specific white boxes. The fine necklace type is a typical feature of recrystallized nuclei.
Between the two samples, there is a remarkable difference in grain size. As shown in Figure 4 of the statistics data, the area-weighted average grain size of HS-600 is 89.1 μm, and that of RS-25 is 9.1 μm. Comparing the maximum and minimum grainsizes of both samples, it may be considered that the grain size of the HS-600 is rather large at about 10 times the RS-25. In addition, some coarse grains can also be clearly observed in HS-600.
Based on the recrystallized fraction component of HKL Channel 5 software [17], the grains were classified into three types (Figure 5a,b): recrystallized (blue), substructured (yellow), and deformed (red). It is helpful to further clarify the microstructure characteristics of the high-purity Ag samples under severe plastic deformation. Based on the statistics data (Figure 5f), the volume fractions of recrystallized and substructured grains for the HS-600 sample are 45.6% and 53.2%, respectively. The dominant microstructure of the RS-25 sample is substructured (74.3%) and deformed (22.5%). The results can be correlated to the dynamic deformation process and the subsequent static (cooling, storage) process.
The driving force for microstructure evolution is the stored energy resulting from deformation, primarily in the form of dislocations [18,19]. Suppose the internal stresses and/or the concentration of deformation-induced vacancies reach a critical value [3]; in that case, recovery takes place first during the plastic deformation along with the formation of the elongated subgrains. Grain boundaries constantly absorb dislocations during this process. When the dislocation density exceeds the absorption capacity of grain boundaries, the dislocations will pile up and form local stress concentrations [20]. It leads to the formation of serrated grain boundaries, as illustrated by the red arrows in Figure 5e. When the dislocation density reaches a critical level, some small and essentially free-stress grains appear. This transformation is called primary recrystallization. A type of grain coarsening could develop because of severe plastic deformation or prolonged annealing in a specific condition. A small number of grains commence growing at various points by devouring the neighboring fine-grained primary structure. This is the reason for the abnormal grain growth observed in the HS-600 sample (Figure 5e), referred to as “secondary recrystallization” or “exaggerated grain growth” [21].
The kernel average misorientation (KAM) data, which directly relates to the local geometrically necessary dislocation (GND) [18,22], was analyzed statistically to determine the differences in dislocation density between the two samples quantitatively. As depicted in Figure 5c,d, the color gradient of the rainbow legend from blue to red represents the degree of dislocation density ranging from small to large with a cut-off misorientation of 5°. The average KAM value of HS-600 is 0.3, and almost all the KAM values are below 1° (Figure 5c). It indicates that the recrystallization and recovery due to the high-temperature deformation had released an amount of energy storage and made HS-600 relatively stable. The mean KAM value of the RS-25 sample is 0.6. Almost no recrystallization occurred, although there are areas with high KAM values.
Due to the temperature dependence, recrystallization occurs more readily at high temperatures. At ambient temperatures, dynamic recovery was found to be the only mechanism that is responsible for softening of high-purity Ag during plastic deformation, whereas work hardening still dominates due to the relatively low temperature [23]. Dynamic recrystallization was observed at a higher temperature (100 °C). As depicted in Figure 2, similar conclusions could be drawn from the stress-strain curves of previous compression tests we have done. Differences in recrystallization temperature can be attributed to strain rate and experimental conditions. For low SFE metals, the self-annealing phenomenon should not be ignored, which takes place during storage at ambient temperature and without heating or loading. It is usually in the form of static recovery, static recrystallization, and grain growth to lower the inner energy of materials [3,24]. Recovery occurs firstly as a result of the lower activation energy required. During this process, the screw and edge dislocations could be annihilated by cross-slip and climb, respectively [3]. Due to the decrease in dislocation density or the rearrangement of dislocation [25], the driving force for recrystallization at ambient temperature is diminished. The remaining dislocation density in RS-25 samples may not meet the requirements for recrystallization at ambient temperatures. In the RS-25 sample, dynamic recovery may play a significant role in the formation of substructured grains. The recrystallization of the HS-600 sample was primarily caused by dynamic recrystallization during high-temperature deformation and static recrystallization that occurred during the subsequent cooling process.

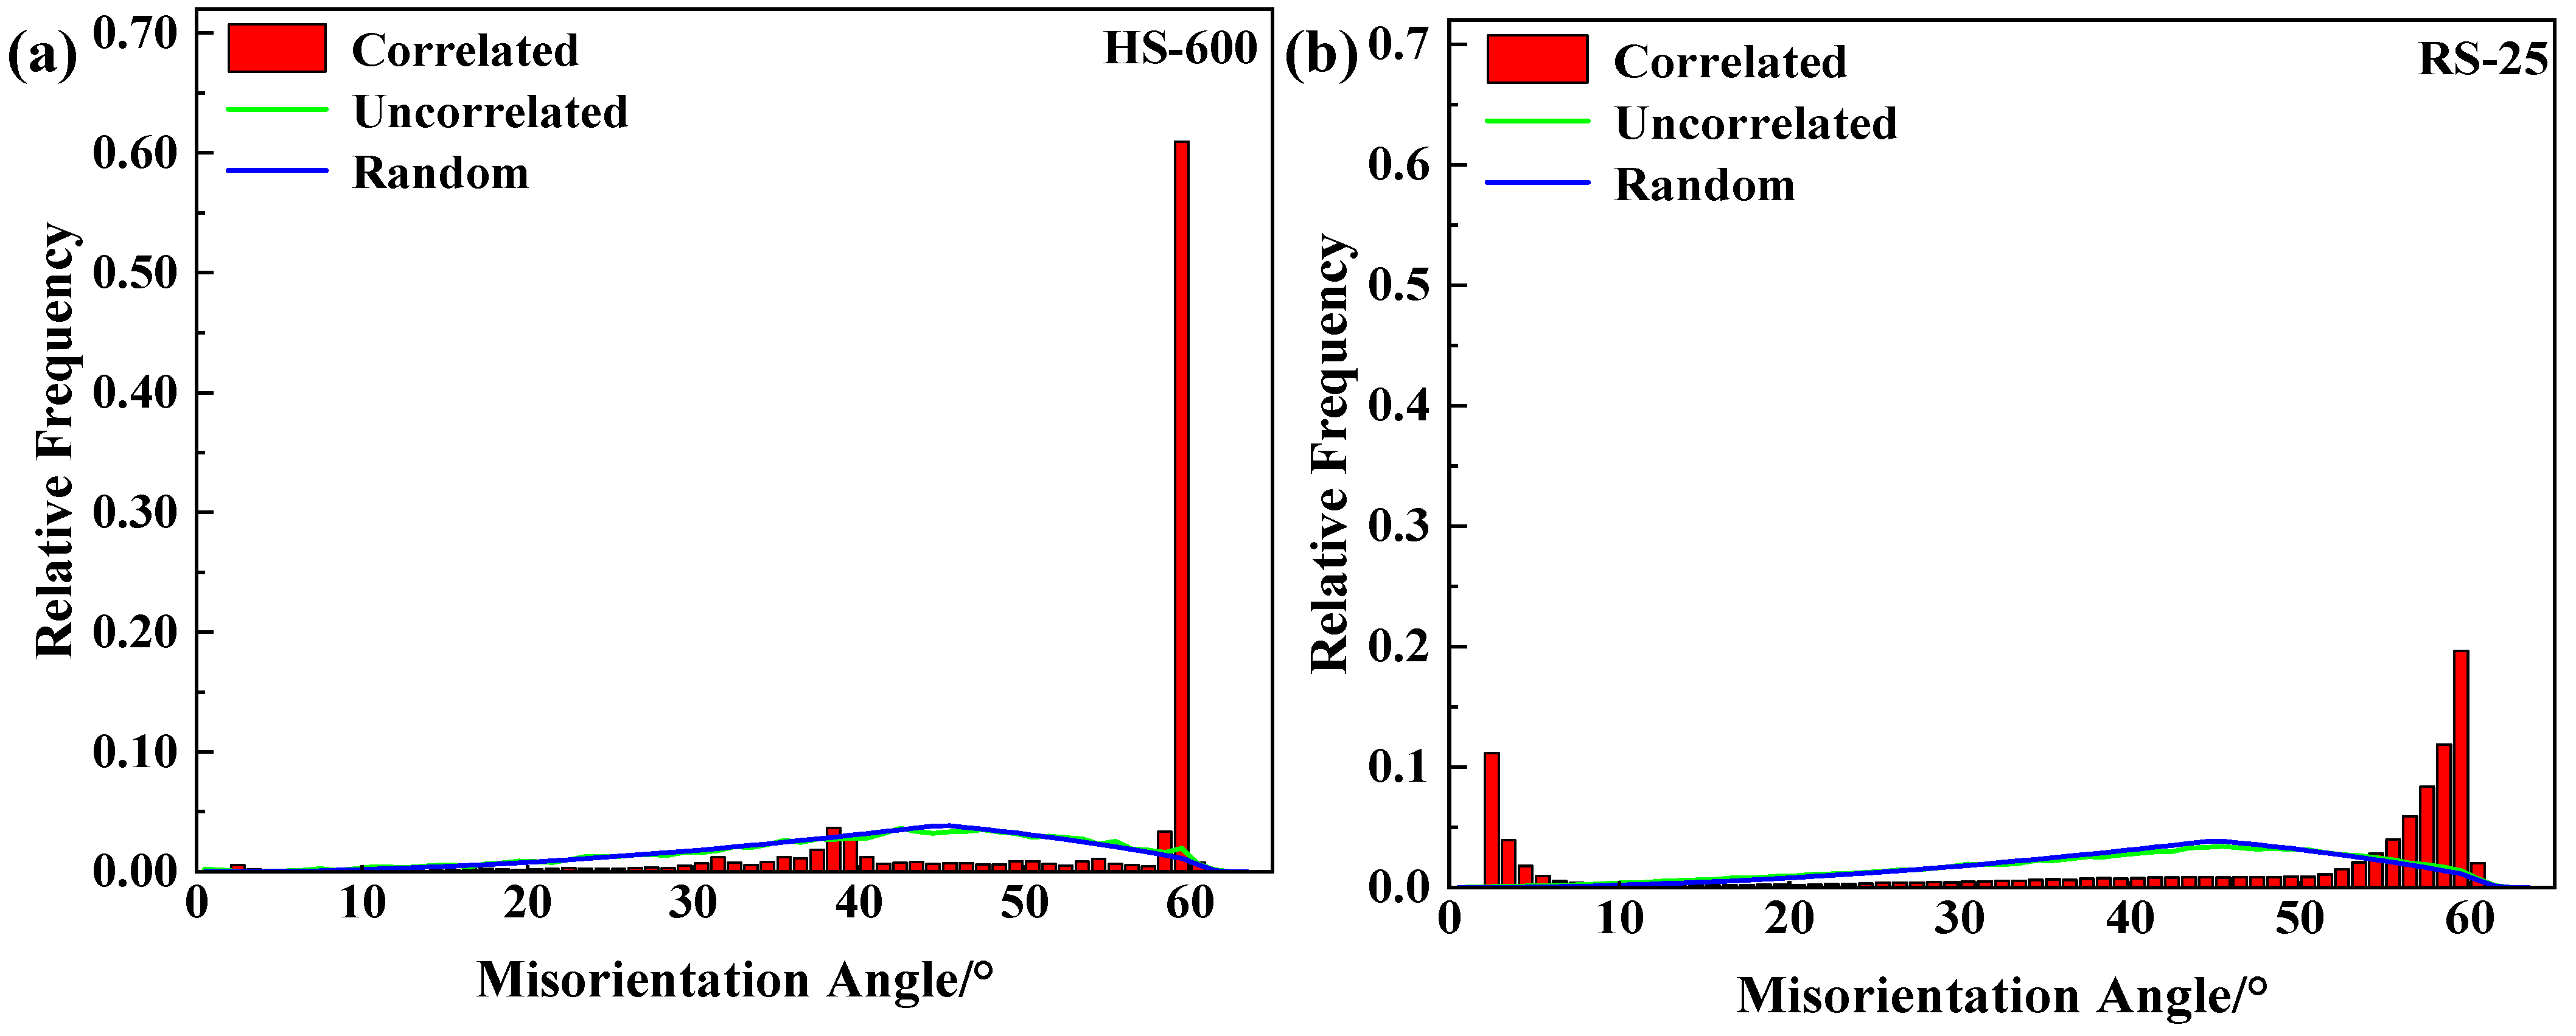
3.3. Grain Boundary Character Distribution

Figure 6 illustrates misorientation angle distribution θ with in-grain misorientation axes (IGMA) to identify the twin type. Here, 2° ≤ θ < 15° are defined as low-angle grain boundaries (LAGBs), whereas θ ≥ 15° denotes high-angle grain boundaries (HAGBs). Almost all the grain boundaries in HS-600 are HAGBs (98%), whereas in RS-25, it is about 81%. The results demonstrate that LAGBs are related to the deformed grains, and recrystallization occurs more frequently in regions where HAGBs are present. The peaks of the “Corrected” are around 40° and 60°, which can be characterized by the special grain boundaries called Σ3n (n = 1,2,3…) coincidence site lattices (CSLs) model. According to Brandon’s criterion [26], Σ3 boundaries are defined by the 60° <111> axis-angle relationship with a tolerance of 8.661°, Σ9 is 38.94° <110> with 5°, and Σ27a is 31.59° <110> with 2.887°.
Figure 7a,b shows the grain boundary map (GBs) for RS-25 and HS-600. The HAGBs and LAGBs are represented by black and gray lines, respectively. The CSLs are superimposed, in which Σ3, Σ9, and Σ27a boundaries are represented by red lines, green lines, and blue lines, respectively. Two main types of twins are generated during deformation, including annealing twins and deformation twins. Annealing twins, mainly related to the recrystallization process, are usually formed by heat treatment, but they can also be obtained by directly hot-working [27]. The formation of those twins is a consequence of local strain adjustment and energy minimization required during recrystallization and grain growth. Deformation twins are produced by mechanical deformation. A considerable density of deformation twins will form during cold-working for Ag with a very low twin boundary energy (∼8 mJ/m2 [28]).
Figure 7a shows that the microstructure of the HS-600 sample exhibits annealing twins with zigzagged boundaries. Figure 7c illustrates the four prominent morphologies schematic diagrams of annealing twins [29]. Their actual existence can be observed in the enlarged image of the encircled area I (Figure 7d). In conjunction with two figures, a corner twin is labeled A(Aʹ) and the coherent twin boundary produces a trace. The twin B(Bʹ) is thin and spans opposite sides of the grain, whereas the twin C(C’) terminates within the grain. The twin D(D’) lies entirely within the grain.
Deformation twinning is the dominant deformation mode relative to slip at room temperature [30,31]. Parallel deformation twins with straight boundaries are the most common type of twin in RS-25 samples (Figure 7b). The deformation twins transform a homogeneously deformed FCC metal into a fine and alternate twin (T-M) layer [8,32]. As one of the two fundamental modes of plastic deformation in FCC metals with low SFE, slip is the primary deformation mode during the initial stages of the process. However, it is suppressed due to further deformation, so that the cross slip of Shockley partials may lead to intrinsic stacking faults on parallel {111} planes [33]. Twinning is the primary deformation mode during the later stages, forming deformation twins. It was considered that deformation twins are formed by the motion of partial dislocation during plastic deformation, whereas annealing twins are formed by growth accidents on a migrating grain boundary during recrystallization [34].
As described in Figure 7e, the total length proportion of Σ3n CSL boundaries of the HS-600 sample is over 70%, consisting of approximately 67.4% Σ3 boundaries and about 8% the summation of Σ9 and Σ27a boundaries. For the RS-25 sample, it is 52.9%, 1.5%, and 0.23%, respectively. The proportion of Σ3 is the highest in both samples. This could be explained by the Σ3 regeneration model [35], i.e., Σ3n + Σ3n+1 → Σ3. The large grain clusters in the HS-600 sample are responsible for the difference in the twin fraction, as discussed in more detail in the following section.

3.4. Formation Mechanism of Twin

The main discussion first focuses on the role of annealing twinning in the HS-600 sample (Figure 8). The nucleation of recrystallization usually locates on the twins and grows predominantly along twin boundaries in FCC metals [32]. Combining the inverse pole figure (IPF) map (Figure 8a) with the recrystallization map (Figure 8b), it was discovered that the adjacent substructured grains (M1, M2) are separated by Σ9 CSLs (TB1), whereas the recrystallized grains T1 and T2 are separated from matrix M1 by ∑3 twin boundaries. Twins accelerate the bulging and separation of bulged parts from the original grains [36,37]. Figure 8d illustrates that twins T1, T2, and T3 not only have the same orientation, but also have a 〈111〉 type misorientation with respect to the matrix M1. It is well known that nuclei are misoriented to the deformed matrix by a rotation around a common〈111〉 axis [37,38], which is the Σ3 CSLs. Nevertheless, we found that the recrystallized grains T4 and T5 are separated from the matrix M4 and M3 by twin boundaries ∑3 and ∑9, respectively. It is possible to conclude that the new grains formed are separated from the parent grains by various types of twin boundaries, not only by the Σ3 CSLs. An interesting thing is that there is a similar orientation relationship between the grain T4 and adjacent grains on both sides, but it cannot be determined which one is the matrix of twin T4 (Figure 8e).
As depicted in Figure 8c, the point-to-origin misorientations near the original grain boundaries along L1 demonstrate the following twin boundaries type: Σ3 → Σ3 → Σ9 → Σ27a → Σ3. Every TB had the ideal misorientation with a deviation within 1°. As illustrated in the enlarged area of Figure 8c, the point-to-point misorientation within the grains is less than 2°. The point-to-origin misorientation emerges “step” style with distance. The result indicates that the misorientation accumulates only at grain boundaries, and the orientation gradient within grains is close to zero. This misorientation trend is a distinguishing feature of recrystallized grains.
One of the typical microstructure features of the HS-600 sample is the large grain clusters. They are shown in detail in Figure 8a, namely CG1, CG2, and CG3. Whether the grains in those clusters are adjacent, they all have Σ3n mutual misorientation. It is formed by multiple twinning starting from a single nucleus during recrystallization [39,40,41]. These large grain-clusters constitute the grain boundary network. Due to this, there are more Σ3n-type triple grain boundary junctions in the HS-600 sample, including one twin and two normal grain boundaries (TJ1, TJ2), two twin and one normal grain boundary (TJ3), and three twin grain boundaries (TJ4). Those types of triple junctions far outnumber normal triple junctions (TJ5) and are more stable due to their low interfacial energy [19,42]. Intergranular corrosion resistance has also been reported to be improved by the large size grain-clusters associated with the high proportion of the ∑3n boundaries and the interconnected ∑3n-type triple junctions [43,44]. Intergranular degradation will be effectively arrested at triple junctions [45]. It is essential for high-purity Ag jewelry exposed to sweat and air. However, the larger average grain size caused by the high temperature will be detrimental to the corrosion resistance of materials [46]. In order to achieve optimal performance for high purity Ag, it is necessary to consider comprehensively the effects of grain size and grain boundary characteristics on corrosion resistance.
Deformation twin can be conceptualized as a sequential process that involves three steps (Figure 9a) [47]. The twin nuclei are first formed at the grain boundaries (T7). Then, the stable twin nucleus is transformed into a lenticular twin propagating towards the other side of the grain (T8). The propagation can be interrupted when the twin front encounters a grain boundary or an obstacle within the parent crystal, such as another twin (T9). In the end, twin thickness increases upon further strain, as in the “regular twin group” labeled T6. It is composed of various thickness deformation twins, where both ends of the twins are attached to the grain boundary of M6, having approximately parallel straight boundary traces. As shown by the grain boundaries of M5 in Figure 9a, when mobile Σ3n CSLs (TB3, TB4) impinge on one another, they tend to form Σ3 CSLs (TB2). As depicted in Figure 9a,b, the fine recrystallized grains (N1-N4) in deformation twins were observed. It is consistent with the conclusion that the nuclei of recrystallized grains form primarily at deformation twins in low-stacking fault energy metals [7,48]. As illustrated in the enlarged area of Figure 9c, the point-to-origin misorientations within the grains exceed 2° but are below 10°. It can be confirmed that there is still a lower orientation gradient in RS-25 samples and a lower amount of stored energy [20].
The orientation relationships of some certain grains are shown in the {111} pole figure (Figure 9d,e). The twins T7 and T8 were formed in a grain and both have a 〈111〉 type misorientation to the matrix M7. There is also a near twin relationship between T6 and M6. Focused on the twin boundaries, a substructured grain T11 and a deformed grain T10 are separated by the Σ3 CSL (TB5). Similar orientation relationships were also found between T10 and both T11 and T12.

4. The Closed Multi-Coining Process

The coining process is well known as a method of giving a functional or decorative surface geometry. Only the surface topography of a blank is modified during the processing without bulk metal flow on a large scale [1]. Because of the excellent ductility and low-yield strength of noble metals, along with the need for a good surface quality of finished ornaments, the multi-coining process is usually conducted at room temperature by adjusting the imprinting force and number of times. The limitation of the metal filling capability usually results in defects such as insufficient imprinting, flash lines, collapsed molds and so on, even after increasing the coining force. The deformation temperature affects the required coining force and the workability of the workpiece, which makes it possible to achieve the same or satisfactory quality of the final product with significant energy savings if this coining process is optimized from a temperature perspective.
An attempt was made to explore the effects of deformation temperature on the surface quality of products. Table 1 lists the specific parameters of the contrast experiments. The conventional coining method at room temperature was used as a control group with a force of 2000 kN and repeated six times. Unfortunately, defects occurred, including cracks and insufficient filling, as shown in Figure 10a. With a deformation temperature of 300 °C and a heat preservation period of 30 min, the set value of the coining force was reduced to 1000 kN. It took only two coining processes to exhibit the extraordinary detail and dramatic relief heights of the coin (Figure 10b). However, there were a few areas with insufficient filling. When the deformation temperature reaches 600 °C, the high temperature may cause the Cr layer to fall off, which affects the product’s performance (Figure 10c). In addition, the defect of insufficient filling remains. As depicted in Figure 10d, it was possible to obtain the delicate relief coin with great detail through one more coining process. However, the surface oxidation was significant, weakening the effect of the mirror.
Experimental results indicate that appropriate deformation temperatures can reduce the coining force and the repeating times. On the one hand, the closed multi-coining processes at elevated temperatures minimize energy consumption and improve efficiency. On the other hand, it still maintains outstanding products with finer details for a given weight. Based on the results of the comparison, increasing the temperature for the coining process is a viable alternative method for producing silver products with high relief, as opposed to the conventional coining process that is performed at room temperature. To avoid damage to the die and the product’s surface, it is recommended that the deformation temperature should not be very high. The recommended temperature is between 300 and 600 °C, and two or three times are needed for the coining process. In the future, further research will focus on solving the problem of surface oxidation. More experiments and simulations regarding the effect of process parameters will be carried out to determine the specific process schedule.

5. Conclusions

The evolution of microstructure characterization in bulk high-purity silver has been studied for high-relief applications with elevated temperatures. The results can be summarized as follows:
(1)
The sample HS-600 with a lower stored energy consists mainly of recrystallized and substructured grains. It exhibits a more stable state than the ambient temperature sample. Both samples are composed of polyhedral coarse grains, slender, and equiaxed grains. The area-weighted average grain size of the hot-working sample is approximately 10 times larger than that of the ambient temperature sample. Almost no recrystallization occurred in the ambient temperature sample, although there were areas with a high dislocation density.
(2)
Twins have been found to be the primary site for recrystallization nucleation. The new grains formed were separated from the parent grains by various type of twin boundaries. The total length proportion of Σ3n CSLs boundaries in the hot-working sample was more than 70% with a large number of annealing twins. The principal twin type in the ambient temperature sample was the parallel deformation twins with straight boundaries, and the proportion Σ3n CSLs boundaries was less than 55%.
(3)
The large grain clusters containing a large number of Σ3n-type triple grain boundary junctions were observed in the hot-working sample, which is the result of multiple twinning. They are of great importance for improving the corrosion resistance of high-purity Ag jewelry that is exposed to sweat and air. However, it is necessary to consider comprehensively the effects of grain size and grain boundary characteristics on corrosion resistance to determine the optimum process parameters in further studies.
(4)
Experiments with the closed multi-coining processes at different temperatures further demonstrated that increasing the temperature for the coining process is a viable alternative to producing durable, high-relief silver products with finer details. It not only reduces the coining force required, but also the number of times the coining processes are repeated. It is recommended that the temperature of hot-working be between 300 °C and 600 °C, and the coining process should be completed in two or three steps.

Author Contributions

Conceptualization, P.L. and J.Z.; Formal analysis, P.L. and J.Z.; Investigation, H.L. and H.Z.; Methodology, P.L. and N.K.; Project administration, N.K. and H.L.; Software, P.L. and H.Z.; Supervision, J.Z. and N.K.; Writing—original draft, P.L.; Writing—review & editing, N.K. and H.L. All authors have read and agreed to the published version of the manuscript.

Funding

This research received no external funding.

Institutional Review Board Statement

Not applicable.

Informed Consent Statement

Not applicable.

Data Availability Statement

The raw/processed data required to reproduce these findings cannot be shared at this time as the data also forms part of an ongoing study.

Conflicts of Interest

The authors declare no conflict of interest.

References

  1. Ike, H.; Plancak, M. Coining process as a means of controlling surface microgeometry. J. Mater. Process. Technol. 1998, 80, 101–107. [Google Scholar] [CrossRef]
  2. Xu, J.P.; Liu, Y.Q.; Li, S.Q.; Wu, S.C. Fast analysis system for embossing process simulation of commemorative coin-Coin Form. Comp. Model. Eng. 2008, 38, 201–215. [Google Scholar]
  3. Gubicza, J.; Chinh, N.Q.; Labar, J.L.; Hegedűs, Z.; Langdon, T.G. Principles of self-annealing in silver processed by equal-channel angular pressing: The significance of a very low stacking fault energy. Mater. Sci. Eng. A 2010, 527, 752–760. [Google Scholar] [CrossRef]
  4. Hegedűs, Z.; Gubicza, J.; Kawasaki, M.; Chinh, N.Q.; Fogarassy, Z.; Langdon, T.G. The effect of impurity level on ultrafine-grained microstructures and their stability in low stacking fault energy silver. Mater. Sci. Eng. A 2011, 528, 8694–8699. [Google Scholar] [CrossRef]
  5. Matsunaga, H.; Horita, Z. Softening and microstructural coarsening without twin formation in fcc metals with low stacking fault energy after processing by high-pressure torsion. Mater. Trans. 2009, 50, 1633–1637. [Google Scholar] [CrossRef] [Green Version]
  6. Murr, L.E. Interfacial Phenomena in Metals and Alloys; Addison Wesley: New York, NY, USA, 1975; 376p. [Google Scholar]
  7. Hegedűs, Z.; Gubicza, J.; Kawasaki, M.; Chinh, N.Q.; Fogarassy, Z.; Langdon, T.G. Microstructure of low stacking fault energy silver processed by different routes of severe plastic deformation. J. Alloys Compd. 2012, 536S, S190–S193. [Google Scholar] [CrossRef]
  8. Paul, H.; Driver, J.H.; Maurice, C.; Jasieński, Z. Shear band microtexture formation in twinned face centred cubic single crystals. Mater. Sci. Eng. A 2003, 359, 178–191. [Google Scholar] [CrossRef]
  9. Hu, H.; Cline, R.S. Temperature dependence of rolling textures in high-purity silver. J. Appl. Phys. 1961, 32, 760–763. [Google Scholar] [CrossRef]
  10. Hu, H.; Cline, R.S.; Goodman, S.R. Texture transition in high-purity silver and its correlation with stacking fault frequency. J. Appl. Phys. 1961, 32, 1392–1399. [Google Scholar] [CrossRef]
  11. Ollivier, M.; Harker, R.M.; Chater, R.J.; Gourlay, C.M. Thermal etching of silver: Influence of rolling defects. Mater. Charact. 2016, 118, 112–121. [Google Scholar] [CrossRef]
  12. Kneynsberg, H.P.; Slakhorst, J.; Verbraak, C.A. Nucleation during the recrystallization of high purity silver. Acta. Mater. 1979, 27, 101–110. [Google Scholar] [CrossRef]
  13. Chen, L.W.; Xie, H.C.; Yang, A.H.; Xie, M.; Shi, Q.N. Research on natural aging behavior of high purity ag sheets after severe plastic deformation. Trans. Indian Inst. Met. 2012, 65, 191–196. [Google Scholar] [CrossRef]
  14. Paul, H.; Driver, J.H.; Maurice, C.; Piątkowski, A. The formation of new orientations during recrystallization of silver single crystals with {112} initial orientation. Mater. Sci. Forum. 2004, 467–470, 177–182. [Google Scholar] [CrossRef]
  15. Douglas, R.; Kuhlmann, D. Guidelines for precision hot forging with applications. J. Mater. Process. Technol. 2000, 98, 182–188. [Google Scholar] [CrossRef]
  16. Chandrasekaran, M.; John, Y.M.S. Effect of materials and temperature on the forward extrusion of magnesium alloys. Mater. Sci. Eng. A 2004, 381, 308–319. [Google Scholar] [CrossRef]
  17. Tiamiyu, A.A.; Eskandari, M.; Sanayei, M.; Odeshi, A.G.; Szpunar, J.A. Mechanical behavior and high-resolution EBSD investigation of the microstructural evolution in AISI 321 stainless steel under dynamic loading condition. Mater. Sci. Eng. A 2016, 673, 400–416. [Google Scholar] [CrossRef]
  18. McCabe, R.J.; Richards, A.W.; Coughlin, D.R.; Clarke, K.D.; Beyerlein, I.J.; Knezevi, M. Microstructure effects on the recrystallization of low-symmetry alpha-uranium. J. Nucl. Mater. 2015, 465, 189–195. [Google Scholar] [CrossRef] [Green Version]
  19. Chen, C.H.; Lai, Y.C.; Chuang, T.H. Grain growth and twin formation in a Ag-4Pd alloy ribbon after annealing treatments. J. Alloys Compd. 2021, 863, 158619. [Google Scholar] [CrossRef]
  20. Zhang, H.B.; Zhang, K.F.; Zhou, H.P.; Lua, Z.; Zhao, C.H.; Yang, X.L. Effect of strain rate on microstructure evolution of a nickel-based superalloy during hot deformation. Mater. Des. 2015, 80, 51–62. [Google Scholar] [CrossRef]
  21. Rosi, F.D.; Alexander, B.H.; Dube, C.A. Kinetics and orientation relationships of secondary recrystallization in silver. JOM 1952, 4, 189–196. [Google Scholar] [CrossRef]
  22. Steinera, M.A.; McCabeb, R.J.; Garleac, E.; Agnewa, S.R. Monte Carlo modeling of recrystallization processes in α-uranium. J. Nucl. Mater. 2017, 492, 74–87. [Google Scholar] [CrossRef]
  23. Kassner, M.E. The rate dependence and microstructure of high-purity silver deformed to large strains between 0.16 and 0.30 Tm. Metall. Mater. Trans. A 1989, 20, 2001–2010. [Google Scholar] [CrossRef]
  24. Wang, G.; Wu, S.D.; Zuo, L.; Esling, C.; Wang, Z.G.; Li, G.Y. Microstructure, texture, grain boundaries in recrystallization regions in pure Cu ECAE samples. Mater. Sci. Eng. A 2003, 346, 83–90. [Google Scholar] [CrossRef]
  25. Stüwe, H.P.; Padilha, A.F.; Siciliano, F. Competition between recovery and recrystallization. Mater. Sci. Eng. A 2002, 333, 361–367. [Google Scholar] [CrossRef]
  26. Brandon, D. The structure of high-angle grain boundaries. Acta Metall. 1966, 14, 1479–1484. [Google Scholar] [CrossRef]
  27. Pistofidis, N.; Vourliasa, G.; Dilo, T.; Civici, N.; Gjongecaj, S.; Skolianos, S.; Polychroniadis, E.K. An estimate of the minting method of three silver coins of the 3rd century B.C. through their microstructural study. Phys. B 2010, 405, 2166–2170. [Google Scholar] [CrossRef]
  28. Hirth, J.P.; Lothe, J. Theory of Dislocations; Cambridge University Press: New York, NY, USA, 1982. [Google Scholar]
  29. Mahajan, S.; Pande, C.S.; Imam, M.A.; Rath, B.B. Formation of annealing twins in f.c.c. crystals. Acta Mater. 1997, 45, 2633–2638. [Google Scholar] [CrossRef]
  30. Tadmor, E.B.; Bernstein, N. A first-principles measure for the twin ability of FCC metals. J. Mech. Phys. Solids 2004, 52, 2507–2519. [Google Scholar] [CrossRef]
  31. Liu, L.; Wang, J.; Gong, S.K.; Mao, S.X. High resolution transmission electron microscope observation of zero-strain deformation twinning mechanisms in Ag. Phys. Rev. Lett. 2011, 106, 175504. [Google Scholar] [CrossRef] [Green Version]
  32. Paul, H.; Driver, J.H.; Maurice, C.; Piatkowski, A. Recrystallization mechanisms of low stacking fault energy metals as characterized on model silver single crystals. Acta Mater. 2007, 55, 833–847. [Google Scholar] [CrossRef]
  33. Cohen, J.B.; Weertman, J. A dislocation model for twinning in f.c.c. metals. Acta Metall. 1963, 11, 1368–1369. [Google Scholar] [CrossRef]
  34. Mahajan, S. Critique of mechanisms of formation of deformation, annealing and growth twins: Face-centered cubic metals and alloys. Scr. Mater. 2013, 68, 95–99. [Google Scholar] [CrossRef]
  35. Randle, V. Mechanism of twinning-induced grain boundary engineering in low stacking-fault energy materials. Acta Mater. 1999, 47, 4187–4196. [Google Scholar] [CrossRef]
  36. Wang, Y.; Shao, W.; Zhen, L.; Yang, L.; Zhang, X. Flow behavior and microstructures of superalloy 718 during high temperature deformation. Mater. Sci. Eng. A 2008, 497, 479–486. [Google Scholar] [CrossRef]
  37. Gottstein, G. Annealing texture development by multiple twinning in fcc crystals. Acta Metall. 1984, 32, 1117–1138. [Google Scholar] [CrossRef]
  38. Wu, G.L.; Jensen, D.J. Orientations of recrystallization nuclei developed in columnar-grained Ni at triple junctions and a high-angle grain boundary. Acta Mater. 2007, 55, 4955–4964. [Google Scholar] [CrossRef]
  39. Xia, S.; Zhou, B.X.; Chen, W.J. Grain cluster microstructure and grain boundary character distribution in alloy 690. Metall. Mater. Trans. A 2009, 40, 3016–3030. [Google Scholar] [CrossRef]
  40. Xia, S.; Zhou, B.X.; Chen, W.J.; Wang, W.G. Effects of strain and annealing processes on the distribution of Σ3 boundaries in a Ni-based superalloy. Scr. Mater. 2006, 54, 2019–2022. [Google Scholar] [CrossRef]
  41. Xia, S.; Zhou, B.X.; Chen, W.J. Effect of single-step strain and annealing on grain boundary character distribution and intergranular corrosion in Alloy 690. J. Mater. Sci. 2008, 43, 2990–3000. [Google Scholar] [CrossRef]
  42. Jin, Y.; Lin, B.; Bernacki, M.; Rohrer, G.S.; Rollett, A.D.; Bozzolo, N. Annealing twin development during recrystallization and grain growth in pure nickel. Mater. Sci. Eng. A 2014, 597, 295–303. [Google Scholar] [CrossRef] [Green Version]
  43. Barr, C.M.; Vetterick, G.A.; Unocic, K.A.; Hattar, K.; Bai, X.M.; Taheri, M.L. Anisotropic radiation-induced segregation in 316L austenitic stainless steel with grain boundary character. Acta Mater. 2014, 67, 145–155. [Google Scholar] [CrossRef]
  44. Hua, C.L.; Xia, S.; Li, H.; Liu, T.G.; Zhou, B.X.; Chen, W.J.; Wang, N. Improving the intergranular corrosion resistance of 304 stainless steel by grain boundary network control. Corros. Sci. 2011, 53, 1880–1886. [Google Scholar] [CrossRef]
  45. Randle, V. Twinning-related grain boundary engineering. Acta Mater. 2004, 52, 4067–4081. [Google Scholar] [CrossRef]
  46. Ralston, K.D.; Birbilis, N.; Davies, C.H.J. Revealing the relationship between grain size and corrosion rate of metals. Scr. Mater. 2010, 63, 1201–1204. [Google Scholar] [CrossRef]
  47. Kumar, M.A.; Kanjarla, A.K.; Niezgoda, S.R.; Lebensohn, R.A.; Tomé, C.N. Numerical study of the stress state of a deformation twin in magnesium. Acta Mater. 2015, 84, 349–358. [Google Scholar] [CrossRef]
  48. Paul, H.; Driver, J.H.; Maurice, C.; Piatkowski, A. The role of shear banding on deformation texture in low stacking fault energy metals as characterized on model Ag crystals. Acta Mater. 2007, 55, 575–588. [Google Scholar] [CrossRef]
Figure 1. Schematic of experiments for (a) isothermal compression tests and (b) the closed multi-coining process.
Metals 13 00463 g001
Figure 2. Stress-strain curves of high-purity Ag under different temperatures at 0.1 s−1.
Metals 13 00463 g002
Figure 3. Superimposing with BC and GBs map for (a) HS-600 and (b) RS-25, respectively.
Metals 13 00463 g003
Figure 4. The statistics data of grain size: for (a) HS-600 and (b) RS-25, respectively.
Metals 13 00463 g004
Figure 5. Recrystallization maps and the KAM statistics data for (a,c) HS-600 and (b,d) RS-25, respectively; (e) an enlarged image of the encircled area I in Figure 5a; and (f) the statistics data of recrystallization maps.
Metals 13 00463 g005
Figure 6. Misorientation angle distributions for (a) HS-600 and (b) RS-25, respectively.
Metals 13 00463 g006
Figure 7. GBs map for (a) HS-600 and (b) RS-25, respectively; (c) schematic diagram of annealing twin prominent morphologies; (d) an enlarged image of the encircled area I in Figure 7a; and (e) the statistics data of twins.
Metals 13 00463 g007
Figure 8. The partial enlarged detail of II in Figure 7a: (a) IPF map; (b) recrystallization map; (c) misorientation analysis along line L1 in Figure 8a; and (d) and (e) {111} pole figure of specific grains.
Metals 13 00463 g008
Figure 9. The specific macrozones III in Figure 7a: (a) IPF map; (b) recrystallization map; (c) misorientation analysis along line L2 in Figure 9a; (d) and (e) {111} pole figure of specific grains.
Metals 13 00463 g009
Figure 10. Comparison of experimental results: (a) 25 °C; (b) 300 °C; (c) 600 °C with 1th; and (d) 600 °C with 2th.
Metals 13 00463 g010
Table 1. The process parameters of the closed multi-coining process.
NumberForce in Conining/kNConditionsTimes of Multi-Coining
12000Room temperature/25 °C6
21000300 °C and keep 30 min2
3700600 °C and keep 30 min1, 2
Disclaimer/Publisher’s Note: The statements, opinions and data contained in all publications are solely those of the individual author(s) and contributor(s) and not of MDPI and/or the editor(s). MDPI and/or the editor(s) disclaim responsibility for any injury to people or property resulting from any ideas, methods, instructions or products referred to in the content.

