Abstract
Austenitic stainless steels that exhibit good corrosion resistance have recently found increasing applications in industry and transportation. This article addresses the influence of cold rolling and deformation on the pitting corrosion resistance of AISI 301LN and 316L stainless steels. The results indicate that the content of martensite increases as the cold rolling reduction also increases. The current work combined different techniques such as optical microscopy and scanning electron microscopy (SEM) with energy dispersive X-ray spectroscopy (EDS) analyses. Corrosion tests were carried out, in accordance with the ASTM standards. The results confirm that the 316L steel performed better than the 301LN, regarding pitting corrosion, even when deformed. This is due to the high molybdenum (Mo) content, which guarantees greater corrosion resistance. The conducted corrosion tests showed that the increase of cold deformation reduces the resistance to pitting and overall corrosion in both steels. It was found that the 301LN stainless steel has higher susceptibility to deformation-induced martensite and, despite the addition of nitrogen, it still has a lower performance relative to the 316L steel. The current work focused on evaluating the formation of pits and the dynamics of the microstructures of the AISI 301LN and 316L steels with their mechanical properties and corrosion resistance in a saline environment including chlorides.
1. Introduction
The corrosion of metals occurs through redox reactions between the metal and an electrolyte containing corrosion agents. The contact between a metal and either air, moisture, or a chemical reaction (such as an acid), is essential for the occurrence of corrosion. In this process, the anode/electrolyte and cathode/electrolyte interfaces are, therefore, involved.
Resistance to corrosion, mechanical resistance, and good formability are common characteristics of stainless steels [1]. The American Iron and Steel Institute (AISI) 301 stainless steel, for example, has a good mechanical resistance compared to other members of the AISI 3xx steel family; however, it has a low resistance to corrosion when compared to the other family members. On the other hand, the AISI 316 stainless steel has good resistance to corrosion, in addition to satisfactory levels of mechanical strength [2].
Chao, Lin, and Macdonald [3,4,5] developed a point defect model for anodic passive films, where the film of the steel is known to have defects such as cations, anions, electrons, and void gaps, under a quasi-equilibrium regime. In this way, the anion vacancies appear at the film/solution interface and disappear at the film/metal interface. The film then grows into the metal due to the movement of the anions.
The knowledge of the composition and structure of the passive film of Austenitic Stainless Steels (ASSs) is fundamental to understanding the pitting corrosion process in 301LN and 316L stainless steels [6]. These steels have chromium contents above 10.5% in solid solution, which undergo a controlled oxidation, forming a passive film of chromium oxide. Based on surface analysis, a three-layer model has been suggested for passive films formed on austenitic stainless steels in acidic solutions: the outer part of the film consists of a hydroxide film on top of an oxide layer. The oxy-hydroxide film is formed on top of a nickel enriched layer in the metal, the origin of which is the selective oxidation of Fe and Cr during anodic polarization [6]. This inner layer of the passive film is extremely thin (at nanometer scale); however, it is stable, resistant, and acts as a means of protection for the stainless steel against corrosion in different media. The chemical composition, structure, and thickness of the oxide layers depend on the nature of the metal, the pH of the electrolyte point where the metal is passivated, and the electrochemical potential.
Pitting corrosion occurs in two stages: initiation and propagation. The initiation mechanism is not known with great certainty, but it is usually considered that the passive film breaks down in the initial stage and an anodic current appears on the metal surface. McCafferty [7] describes three initiation mechanisms: (i) penetration, (ii) film thinning, and (iii) film rupture mechanisms. Ions active in the penetration mechanism are transported to the underlying metal surface through the oxide film, where they participate in localized dissolution at the metal/oxide interface. There is evidence from X-ray photoelectron spectroscopy and X-ray absorption spectroscopy that chloride ions penetrate passive films on both stainless and aluminum steels. In the thinning mechanism, the active ions are first adsorbed on the oxide surface and form complexes, together with the oxide film, that cause local dissolution and breakdown of the passive film. From pre-existing defects in the film, ions penetrate the oxide in the film rupture mechanism. These defects can be developed by hydration/dehydration events in the oxide film and by the intrusion of chlorine (Cl)− ions. Pitting corrosion in 301LN and 316L stainless steels occurs due to the breakdown of the passive film. The region where the passive layer is broken and exposed begins to produce a new salt film and suffers a reduction, in terms of pH. Despite the possibility of repassivation, which can cause a new passive film in the corroded region, this film fails to grow thick enough for the necessary protection and there is always the possibility of new ruptures.
N and Mo are alloying elements commonly used to improve the corrosion resistance of austenitic and duplex stainless steels [8,9,10]. Mo is a ferritizing element that favors the formation of the δ ferrite and σ phases. N is austenitizing and enhances the mechanical strength of austenite by solid solution. The main goal of the current work was to compare the N-alloyed AISI 301LN stainless steel against the Mo-alloyed AISI 316L stainless steel, concerning their pitting corrosion resistance and the effect of cold deformation on their microstructure and corrosion behavior. The novelty of this study is the comparison of these steels performed in a saline environment with the presence of chlorides, which simulates many coastal environments where these steels can be applied. The obtained findings can aid engineers and researchers to select the best of these materials for specific applications [11].
2. Materials and Methods
The materials under study were two types of stainless steel: the AISI 301LN and AISI 316L stainless steels, whose samples were designated as A and B, respectively. Their initial formats were laminated steel plates with the dimensions: 50 mm × 25 mm × 1.9 mm. Table 1 shows the chemical composition of the AISI 301LN and 316L sheets. To obtain the accurate composition of the steels, the Cr, Ni, and Mo elements were measured using an energy dispersive X-ray detector (EDS—(*)) (EDAX Corporation, Mahwah, NJ, USA), and the N (nitrogen) was determined via coulometric measurement (**) (Metrohm, Herisau, Switzerland). Mass spectrometry was used for all the other elements.

Table 1.
Nominal chemical composition of the studied stainless-steel plates.
2.1. Thermomechanical Processing
The thermomechanical processing was carried out using a benchtop laminator (Rabbit Machines, São João do Rio Preto, Brazil) where the samples to be studied were cold rolled from their initial steel plates. The thickness of the samples was reduced under lubrication using ordinary lubricating oil at room temperature, with consecutive passes of approximately 3 s each, and with 0.1 mm of thickness reduction per pass. Two levels were evaluated: Level 1–1.4 mm, which represented 26% of reduction in thickness, and Level 2–1.0 mm, which represented a 47% reduction in thickness.
For both levels, the true deformation (φ) was calculated according to [12]:
where is the initial thickness of the sample and is its final thickness.
Applying Equation (1) for the deformation Levels 1 and 2, the following results of the true deformation, and , were obtained, respectively:
Table 2 presents the deformation levels and average deformation rates for each pass of the thermomechanical processing.
Table 2.
Deformation rate per pass and by level in the studied samples.
Eichelman and Hull [13] defined the starting temperature (Ms) for the formation of the martensite phase as:
The stainless steels studied by Angel [14], which were from the AISI 3xx steel family, did not present thermal instability at such low temperatures, since the supplied deformation energy caused the formation of the martensite phase at a higher temperature (Md). The author studied the temperature dependence of the formation of 50% martensite by volume, concerning the chemical composition for a 30% tractive strain, which resulted in:
Noraha [15] and Karjalainen [16] integrated the effect of grain size on the martensitic transformation as:
where GS corresponds to the grain size according to the ASTM classification.
Another factor used to assess the stability of an austenitic stainless steel is called nickel equivalent (Niequ), which is related to the austenitizing capacity of this element. This parameter was established in the work by Hirayama and Ogirima [17] as:
Schramm and Reed [18] found an equivalent relationship for the effect of the concentration of alloying elements on stacking fault energy (SFE):
The parameter that determines the pitting corrosion resistance index, called Pitting Resistance Equivalent Number (PREN), was established [19] as:
2.2. X-Ray Characterization
The specimens were cut according to the approximate dimensions of 10 mm, along the transverse direction, and 15 mm along the rolling direction, which were then sanded and polished until reaching the surface corresponding to half of the thickness that each one achieved while embedded in the corrosive solution. Then, the inlay was destroyed, and the specimens recovered. For crystallographic texture analysis, aiming to eliminate the surface deformation effect of sanding and polishing, the specimens were attacked with a solution of 5% HF and 95% H2O2. X-ray diffraction (XRD) measurements (Philips Company, Amsterdam, Netherlands) were carried out using a Philips diffractometer (model X′Pert Pro) in the stepscan mode, with a step size of 0.02° a time per step of 10 s, and CuKα (0.154056 nm) radiation at 40 kV and 40 mA. This was done in order to ensure greater precision in the measurements of the second-phase volumetric fraction and phased micro deformation. The Joint Committee on Powder Diffraction Standards (JCPDS) standards for phase identification were adopted by the International Center for Diffraction Data (ICDD) 2000 database. Murdock et al. [20] suggested that the volume fraction should be determined by comparing the averages of the ratios between the integrated areas and the theoretical proportionality factors of the peaks: (220) and (311) for austenite (γ), (200) and (211) for martensite (α’)/ferrite (δ), and (101) and (211) for epsilon (ε) martensite, considering that all phases have the same absorption coefficient.
The relationship between the intensity of a peak, considering the integrated area (I) with the volumetric fraction (VF) of a given phase, corrected through the volume of the unit cell of phase (v), and the lattice structure factors (F) of the phase, multiplicity (p), Lorentz–Polarization Factor (FPL), and Debye–Waller temperature factor (e−2M), was defined as [21,22,23]:
2.3. Optical Microscopy
For the microstructural characterization, a model BX51M Olympus optic microscope (Olympus Corporation, Tokyo, Japan) with a digital video camera attached to a computer, was used to acquire the images to be analyzed. A commercial image analysis system was used to obtain the stereological information of the samples in the received and laminated conditions. All acquired images had a resolution of 640 × 512 pixels and included the whole field of view of the optic microscope. The grain size of the sheets received was also measured by optical microscopy, according to the intercept technique [24], a magnification of ×1000 and by counting 400 intercepts. The volumetric fraction of the second phase was evaluated using optical microscopic images acquired according to a ×200 magnification and a threshold applied in the grey contrast scale. In each sample, 10 to 40 regions were examined.
2.4. Scanning Electron Microscopy
The specimens for the microstructural investigation by optical and scanning electron microscopy (Philips company, Cambridge, MA, USA) were prepared by grinding, polishing, and etching. Three etching procedures were used: immersion in Villela’s solution—1 g of picric acid, 5 mL of HCl and 100 mL of ethanol; immersion in Behara’s reagent—0.3–0.6 g of potassium metabisulfite, 20 mL of HCl, and 100 mL of distilled water; and electrolytic etching with 30% of HNO3 solution, with a current between 0.12 and 0.50 A and tension between 1.5 and 6.0 V.
A Philips scanning electron microscope, model XL-30 (Philips company, Cambridge, MA, USA), was used to detect the secondary electrons (SE) and backscattering electrons (BSE), as well as a detector of energy-dispersive X-ray spectroscopy EDS (Bruker, Billerica, MA, USA). The exposed surfaces of the samples were also analyzed by the same technique using SEM images of secondary electrons and back scattering electrons with magnifications from 2500 to 10,000. Hence, it was possible to observe the morphology of the martensite phase in greater detail. This phase had higher quantitative proportions than the austenite phase and had the shape of interconnected plates and needles, interspersed with austenite phase, and a smooth appearance.
2.5. Corrosion Test
The corrosion test procedures were performed according to ASTM G1-03 [25], for the preparation of the samples, and ASTM G48-03 [26]—method A and ASTM G46-94 [27], for the evaluation of the samples’ surface. The tests were performed by completely immersing the samples in a solution of 100 g of ferric chloride hexahydrate (FeCl3·6H2O) diluted in 900 mL of distilled water for different time periods, according to ASTM G48—method A. The methods used for the evaluation of the samples were:
- Assessment of the mass loss;
- Visual inspection;
- Quantitative evaluation of the pitting corrosion points in relation to the area under analysis;
- Evaluation and measurement of the size of the pitting corrosion points.
All samples were obtained by guillotine cutting steel sheets to approximately 25 mm × 50 mm in size. All of the surfaces of the samples were then sanded with an A 120 abrasive paper until a uniform finish was obtained and then they were cleaned using toluol p.a. and absolute ethyl alcohol. After drying with hot air, each sample was weighed.
After identifying the samples, each one was immersed in 1000 mL beakers containing ferric chloride solution, of about 6% FeCl3 by mass, keeping the containers covered for 72 h, which was the time required for the test to be carried out at a constant temperature of 23 +/− 2 °C. After each sample was immersed, they were removed from the solution and washed, dried, and reweighed on a precision scale, to assess their loss of mass in relation to the initial mass. Then, square-shaped markings measuring 20 mm × 20 mm were made from the center of each sample, in order to analyze the number of corrosion points per pit, in relation to a surface area of 400 mm2. For samples that showed few corrosion pits, the entire sample area of approximately 2500 mm2 was used to count the pits.
Finally, the number and average size of the pitting corrosion points were analyzed by optical microscopy using the ASKANIA GSZ stereomicroscope. Additionally, the corresponding SEM images were acquired and the number of pits in the samples was statistically analyzed.
Hence, the current study was based on the analysis of the stainless-steel samples submitted to 26–47% of the deformation in relation to their initial conditions, see Table 3.
Table 3.
Variables studied in this work.
3. Results and Discussion
Using the values indicated in Table 1 and Equations (1)–(8), it was possible to check the parameters of the mechanical instability and resistance to pitting corrosion for the A0 and B0 samples, as indicated in Table 4, at the starting temperatures for the formation of martensite in the stainless steels under study.
Table 4.
Comparative parameters of the mechanical stability and pitting corrosion of the A0 and B0 samples.
The values in Table 4 indicate that the temperature of transformation from austenite (γ) to martensite (α’) was less than 0 °C [28] for both A0 and B0 samples. This was because the crystalline composition of the samples was mostly formed by metastable grains at room temperature [27,28,29,30]. On the other hand, when it comes to the plastic deformation, the martensitic transformation generally occurs above room temperature [28].
The transformation of the γ phase to the α’ phase under cold deformation, by lamination as in the current study, can be used to improve the mechanical performance of stainless steels [16]. However, this can lead to anisotropy of the mechanical properties of the material [30], impairing it in terms of its resistance to corrosion [31,32,33,34] and modifying its magnetic properties [35,36,37].
3.1. X-Ray Diffraction Characterization
It was not possible to identify the ε martensite phase by means of X-ray diffraction in any of the samples. The comparison of the diffractograms obtained according to the ICDD-JCPDS standard, indicated three phases that would be candidates to constitute the microstructure of the samples, as their matrix and second phase: austenite (γ), martensite (α’), and ferrite (δ). The VF values obtained for the A samples suggested the growth of the fraction of the second phase with the increase in strain, which is expected for the formation of the α’ martensite phase in an AISI 301 steel [38].
The sample diffractograms obtained for the A0, A1, A2, B0, B1, and B2 samples are shown in Figure 1. In the case of the B samples, which have an austenitic matrix, the fraction of the second phase does not vary with the deformation. The appearance of the α’ martensite phase at room temperature is not normally observed at the strain levels used in AISI 316 steels [39]. However, it is observed that, when subjected to cyclical deformations [40,41], this observation sustains the conclusion that the only phase that meets the observations, within the experimental conditions used here, was the ferrite (δ) phase that is formed during the solidification of the ingot [42]. This was also described by Nebel and Eifler, with a AISI 321 steel dowel in a fatigue study [31]. Hence, the small variation may be attributed to heterogeneity of the original sheet.
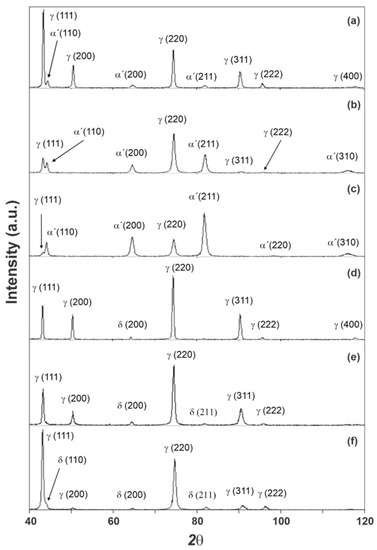
Figure 1.
Diffractograms obtained for the A0 (a), A1 (b), A2 (c), B0 (d), B1 (e), and B2 (f) samples.
Table 5 summarizes the volumetric fraction values for all detected phases as well as the microstrain (ε’) and crystalline domain size (D) values for each phase in each of the studied samples.
Table 5.
Values of volumetric fraction, microstrain, and size of the crystalline domain obtained for all samples.
In both steels, it was not possible to determine the D parameter of the phases precisely. The fact of introducing deformation in the austenitic phase contributed to hardening of the steel, which allowed the formation of dislocation cells and sub-grains [43,44]. This could be a justification for such small D values.
3.2. Microscopy
3.2.1. Optical Microscopy
Figure 2 show the appearance of the austenitic grains obtained under the studied conditions. The grain size (GS) of the initial A0 and B0 samples (Figure 2a,d) were equal to 14.75 ± 0.74 μm (ASTM No. 8.7 grain) and 24.75 ± 1.24 μm (ASTM grain n° 7.3), respectively, but the imposition of deformation caused the hardening of the grains and the change of their aspect ratios, as observed in Figure 2b,c,e,f.
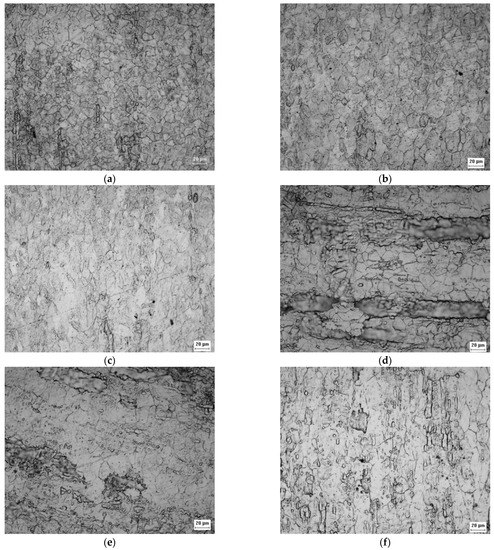
Figure 2.
Micrograph of the A0 (a), A1 (b), A2 (c), B0 (d), B1 (e), and B2 (f) samples acquired by optical microscopy with ×500 magnification showing the appearance of austenitic grains after electrolytic attack.
Figure 3 corresponds to the initial condition of the AISI 301L steel, and the γ and α’ phases can be seen; the optical microscopic analysis indicated that the distribution of the γ phase is irregular. A superior magnification confirmed that the phases are really intertwined and that the α’ phase is in the form of plaques, appearing in higher proportions than the γ phase.
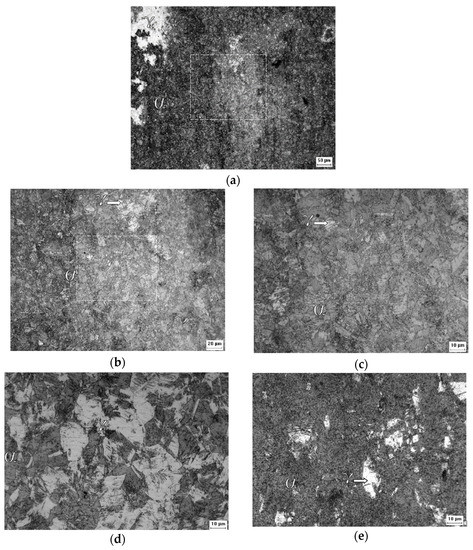
Figure 3.
Micrographs of the A0 sample at ×200 (a), ×500 (b), and ×1000 (c), and of the A1 sample at ×1000 (d) and of the A2 sample at ×1000 (e) magnification after the Behara’s reagent attack.
Figure 3 shows a higher proportion of martensite (α’) than austenite (γ) in the A0 sample, which increased with the increasing of the rolling reduction. Contrary to what was observed in XRD, the VF measurements by image analysis led to different results, proportional to the chosen microscopic magnification, see Table 6 [43]. For the 301LN steel, the imposition of deformation caused a reduction in the aggregation of the grains, causing greater distinction between the α’ and γ phases presented in the other samples. The deformation caused grain hardening in the studied steel (Figure 2f), affecting its mechanical properties by increasing its resistance, flow stress, hardness, and fragility, and by reducing its malleability, ductility, and resistance to corrosion [45].
Table 6.
Thickness, volumetric fraction, standard deviation, and crystalline domain for the studied AISI 301LN and 316L steels.
Figure 4 confirms that the 316L steel plate was in the normalized condition with recrystallized austenitic grains. It is possible to perceive the presence of a second phase, i.e., the δ ferrite phase, according to the XRD analysis.
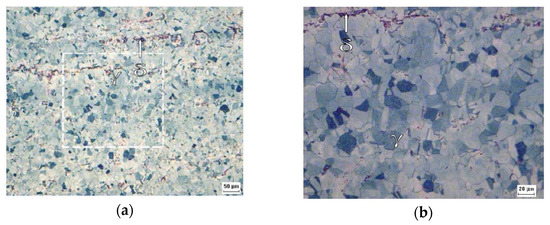
Figure 4.
Micrographs obtained by optical microscopy of the B0 sample at ×200 (a) and ×500 (b) of magnification after the Behara’s reagent attack.
Comparison between Figure 5a–c and Figure 4 suggests that the volumetric fraction of the delta ferrite phase did not change from the B0 sample to the B1 sample, as expected and indicated by the XRD analysis.
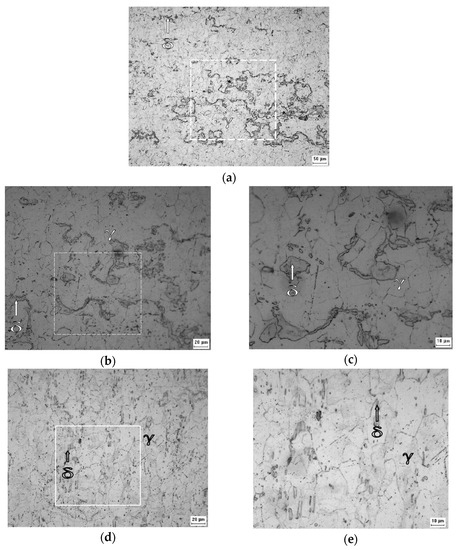
Figure 5.
Micrographs obtained by optical microscopy of the B1 sample at ×200 (a), ×500 (b), ×1000 (c), and of the B2 sample at ×500 (d) and ×1000 (e) of magnification after the Villela’s reagent attack.
3.2.2. Scanning Electron Microscopy
The morphology of the α’ phase of the A0 sample can be seen in detail in Figure 6a. This phase is in the form of interconnected plates and needles, interspersed with the γ phase, and has a smooth appearance. Above the γ phase is the α’ phase, which confirms that it is martensite. This transformation implies shearing that causes superficial alleviation [46]. Figure 6b shows fragmentation of the interconnected plate network of the A1 sample, where the γ regions are better distributed and more visible. The porous aspect of the γ phase suggests an increase in deformation that increases the concentration of dislocations and causes pitting corrosion due to a successful chemical attack. In Figure 6c, which is of the A2 sample, it is difficult to distinguish the γ phase, and only a few more fragmented α’ plates still stand out from the background full of pits. Figure 6d allows one to reiterate the statement about the initial state of the normalized structure for austenitic grains of the 316L steel. The ferrite (δ) phase has a certain dispersion and, a priori, is oriented according to the direction of the original lamination of the sheet.
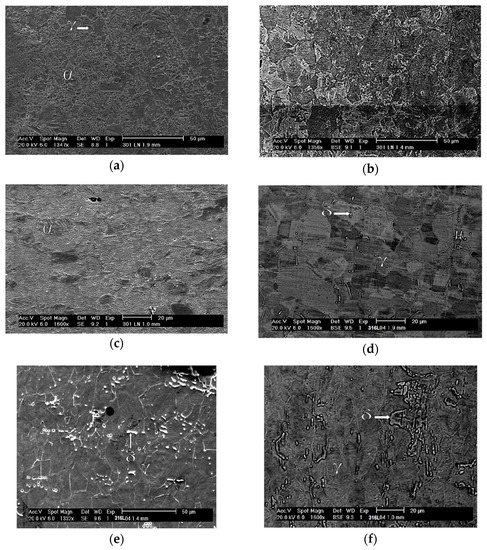
Figure 6.
SEM micrographs of the studied samples: A0 with secondary electrons at a magnification of ×1347 (a), A1 with backscattered electrons at a magnification of ×1356 (b), A2 with secondary electrons at a magnification of ×1600 (c), B0 with backscattered electrons at a magnification of ×1600 (d), B1 with secondary electrons at a magnification of ×1332, and (e) B2 with backscattered electrons at a magnification of ×1600 (f).
The imposition of 0.31 deformation of the B1 sample, shown in Figure 6e, did not change the proportion of the ferrite (δ) phase and only acted to fragment it and deform the austenite (γ) phase. Figure 6f shows that the further increase in strain to 0.64 in the B2 sample had the same effect; however, the δ phase regions are more clearly identified in the B1 sample.
3.3. Corrosion Testing
Figure 7 shows the appearance of the pits obtained by SEM after each sample under study was submitted to the corrosion test. The proportionality between the amount of pitting corrosion and the deformation suffered by both steels can be seen in this figure, and one can conclude that the greater the deformation, the greater the number of pits.
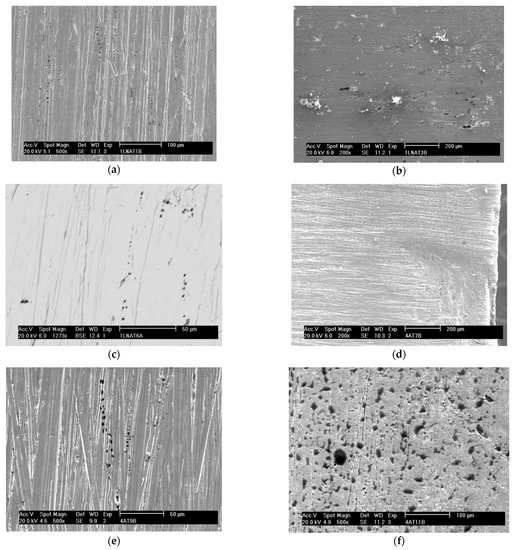
Figure 7.
Appearance of the pits obtained by SEM after the corrosion test for the samples: A0 with secondary electrons at a magnification of ×500 (a), A1 with secondary electrons at a magnification of ×200 (b), A2 with backscattered electrons at a magnification of ×1273 (c), B0 with secondary electrons at a magnification of ×200 (d), B1 with secondary electrons at a magnification of ×500 (e), and B2 with secondary electrons at a magnification of ×500 (f).
Figure 8 shows various cavity shapes after pitting corrosion, which are disc, conical, or hemispherical shapes for many steels and their alloys, according to Roberge [47].
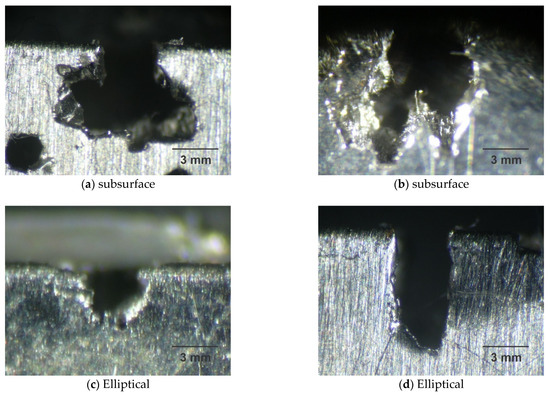
Figure 8.
Shape of pit by micrographs obtained by optical microscopy for the samples A0 (a), A1 (b), B0 (c), and B1 (d), with magnification of ×25 after corrosion test.
Steel A is more susceptible to corrosion than steel B and the pits of samples A0 and A1 are present in greater proportions, according to Table 7, presenting a subsurface format according to Figure 8a,b. The pits of samples B0 and B1 are small with an elliptical shape, as shown in Figure 8c,d, and generally have less mass loss, as shown in Table 8.
Table 7.
Mean values and standard deviations of the pit density of the samples submitted to the corrosion test.
Table 8.
Mass loss of the samples submitted to the corrosion test.
Table 7 and Table 8 present the obtained average values and standard deviations for the percentage of pits present in the studied samples, as well as the values of mass loss for the same samples after the corrosion test.
Figure 9, Figure 10 and Figure 11 show the histograms of the number of pits per observed areas for all studied samples. In these figures, N represents the number of areas evaluated per sample, σ is the standard deviation and μ is the mean. These figures show that the distribution of the number of pits per area in the A0 and A1 samples is close to a normal distribution. However, for the A2 sample, there is a trend towards uniformity. For the 301LN steel, there is an apparent presence of martensite with the occurrence of the texture due to the cold deformation and the fact that pitting corrosion depends on local conditions for its formation; these features caused this normal distribution.
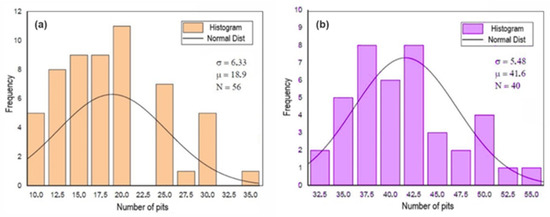
Figure 9.
Histogram of the number of pits per analyzed area after the corrosion test for the A0 (a) and B0 (b) samples.
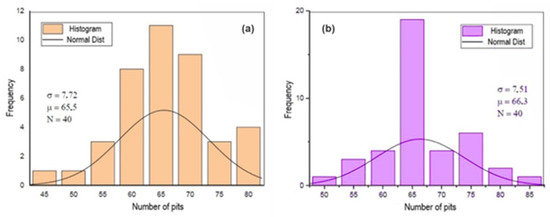
Figure 10.
Histogram of the number of pits per analyzed area after the corrosion test for the A1 (a) and B1 (b) samples.
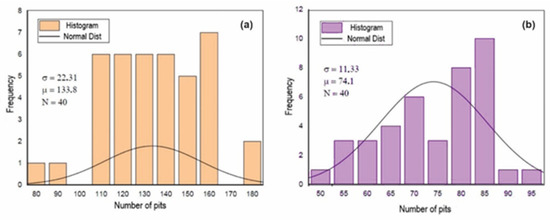
Figure 11.
Histogram of the number of pits per analyzed area after the corrosion test for the A2 (a) and B2 (b) samples.
In Figure 9, the initial B0 sample is the one that presents the best performance, in terms of pitting corrosion, due to the fact that the smallest number of defects means that the formation of pits is restricted to the statistical distribution of the pit-generating factors [48].
The increase in the level of deformation in the B0 sample changed the pitting corrosion performance and caused the occurrence of regions with a higher concentration of disagreements, disagreements stacking failure, and forests of disagreements [49,50]. There is a greater probability that the nucleation and growth of pits occurred in these regions, which shifts the statistical trend towards a non-Gaussian distribution, as shown in Figure 10 and Figure 11.
There is a similarity in the trends of the pit density and mass loss. For both steels, an increase in deformation caused the introduction of defects in the material, which are preferred regions for the occurrence of pitting [51]. The increase in the percentage of pits with the deformation corresponded to an increase in mass loss, as can been seen in Figure 12.
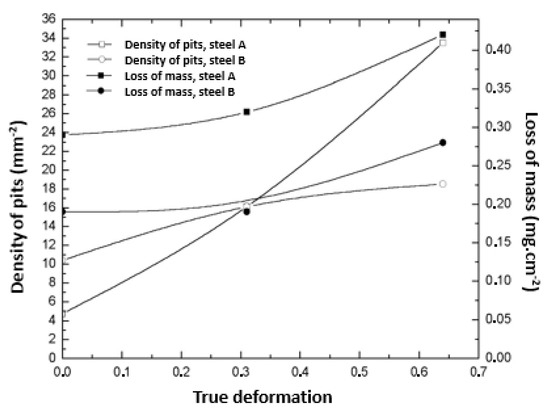
Figure 12.
Relationship between the pit density, loss of mass, and deformation for all studied samples.
Although the values of the percentage of pits for the two steels in the initial condition were close, there was a considerable difference in the levels of mass loss. This is justified by the higher proportion of the martensite phase in the 301LN steel and the fact that, even with the addition of nitrogen (N), this steel is less resistant to pitting corrosion than the 316L steel [52].
The PREN values indicated in Table 4 confirm the fact that the 301LN steel had a worse performance in pitting corrosion than the 316L steel. The most significant resistance to pitting corrosion for the 316L steel in all conditions lies in the high content of molybdenum (Mo) in its chemical composition.
In the case of the 316L steel, the pitting corrosion effect was reduced due to its chemical composition. The deformation level of 0.64 caused a considerable increase in mass loss in the B2 sample, which may be linked to the fact that the predominant mechanism in the formation of pits is the concentration of discrepancies within the austenitic grains in this type of steel. This causes an increase in hardness and, consequently, the breakdown of the passive film, leaving the original material exposed.
On the other hand, in the 301LN steel, it is the pile effect between the martensite and austenite phases that causes corrosion, and the highly irregular surface caused by the martensite can cause the degradation of the passive film [52]. Moreover, the increase in hardness is due to the hardening of the austenitic phase.
4. Conclusions
The current work was focused on evaluating the formation of pits and the dynamics of the microstructures of the AISI 301LN and 316L steels with their mechanical properties and corrosion resistance in a saline environment including chlorides. A microstructural evaluation of AISI 301LN and 316LN steels was carried out using different analytical techniques, such as optical microscopy, scanning electronic microscopy, and X-ray diffraction. Moreover, the microstructures of these steels were correlated with their mechanical properties and corrosion resistance.
The studied materials are very important for the transportation and petroleum industries (for example, in the construction of train wagons and the restoration of equipment). Therefore, reliable and detailed knowledge of these materials (achieved with this work) is fundamental for the success of their applications.
The main findings of this study can be summarized as follows:
- The plastic deformation caused the formation of the martensite phase in the 301LN steel samples and hardening of the austenitic phase in the 316L steel samples. Under the experimental conditions in this work, it was observed that the greater the reduction of thickness, the greater the amount of martensite and the greater the hardness of the austenite.
- The formation of martensite and austenitic hardening compromised the resistance to pitting corrosion of both steels. In the 301LN steel, this was due to the formation of an electrochemical pile between the two distinct phases, and, in the 316L steel, it was due to the introduction of defects. The growth was driven by the local conditions linked to the microstructure produced by deformation.
- For the AISI 316L steel, the higher the level of deformation, the more easily the deformed structure of the γ phase could be observed.
As possible future work, we suggest a study into how the cross-relationship of the microstructure of the studied steels directly impacts the morphology or location of the pitting damage.
Author Contributions
Conceptualization by P.M.O.S.; investigation, data collection, formal analysis, and writing—original draft preparation by P.M.O.S., M.C.C.F., A.J.M.S. and J.A.d.C.; writing—review and editing by A.S.B.S. and J.M.R.S.T.; supervision by J.M.R.S.T. All authors have read and agreed to the published version of the manuscript.
Funding
This research received no external funding.
Institutional Review Board Statement
Not applicable.
Informed Consent Statement
Not applicable.
Data Availability Statement
The used raw/processed data can be shared after a reasonable request is made to the authors.
Acknowledgments
The authors would like to thank the Brazilian research agencies, National Council for Scientific and Technological Development (CNPq), and Coordination for the improvement of higher education personnel (CAPES), for their financial support. A.J.M. Sales acknowledges (CNPq) for his Post-Doctoral grant (PDJ/164724/2020-6).
Conflicts of Interest
The authors declare no conflict of interest.
References
- Hu, C.; Wan, X.; Wu, K.; Xu, D.; Li, G.; Xu, G.; Misra, R. On the impacts of grain refinement and strain-induced deformation on three-body abrasive wear responses of 18Cr–8Ni austenitic stainless steel. Wear 2020, 446–447, 203181. [Google Scholar] [CrossRef]
- Sedriks, J.A. Corrosion of Stainless Steels, 2nd ed.; John Wiley & Sons: Hoboken, NJ, USA, 1996; p. 102. [Google Scholar]
- Chao, C.Y.; Lin, L.F.; Macdonald, D.D. A Point Defect Model for Anodic Passive Films: I—Film growth kinetics. J. Electrochem. Soc. 1981, 128, 1187–1194. [Google Scholar] [CrossRef]
- Chao, C.Y.; Lin, L.F.; Macdonald, D.D. A point defect model for anodic passive films: II—Chemical breakdown and pit initiation. J. Electrochem. Soc. 1981, 128, 1195. [Google Scholar] [CrossRef]
- Chao, C.Y.; Lin, L.F.; Macdonald, D.D. A point defect model for anodic passive films: III—Impedance response. J. Electrochem. Soc. 1982, 129, 1874. [Google Scholar] [CrossRef]
- Olsson, C.-O.; Landolt, D. Passive films on stainless steels—Chemistry, structure and growth. Electrochimica Acta 2003, 48, 1093–1104. [Google Scholar] [CrossRef]
- McCaffaerty, E. Introduction to Corrosion Science; Springer Science+Business Media, LLC: New York, NY, USA, 2010. [Google Scholar]
- Ren, Y.; Zhao, H.; Liu, W.; Yang, K. Effect of cold deformation on pitting corrosion of 00Cr18Mn15Mo2N0.86 stainless steel for coronary stent application. Mater. Sci. Eng. C 2016, 60, 293–297. [Google Scholar] [CrossRef]
- Wang, Q.; Zhang, B.; Ren, Y.; Yang, K. A self-healing stainless steel: Role of nitrogen in eliminating detrimental effect of cold working on pitting corrosion resistance. Corros. Sci. 2018, 145, 55–66. [Google Scholar] [CrossRef]
- Kumar, V.; Gupta, R.K.; Das, G. Influence of Deformation and Annealing on Microstructure and Corrosion Behavior of Austenitic Stainless Steel. Mater. Today Proc. 2020, 22, 3347–3352. [Google Scholar] [CrossRef]
- McGuire, M. Stainless Steels for Design Engineers; ASM International: Materials Park, OH, USA, 2008. [Google Scholar]
- Sousa, D.A. Determination of Residual Stresses in Metallic Materials through Hardness Testing. Master’s Thesis, Federal University of São João del Rei, São João del Rei, Brazil, 2012. [Google Scholar]
- Eichelmann, G.J.; Hul, F.C.L. The effect of composition on spontaneous transformation of austenite to martensite in 18-8 type stainless steel. Trans. Am. Soc. Met. 1953, 45, 77–104. [Google Scholar]
- Angel, T.J. Formation of martensite in austenitic stainless steels. J. Iron Steel Inst. 1954, 177, 165–174. [Google Scholar]
- Nohara, K.; Ono, Y.; Ohashi, N. Composition and grain size dependencies of strain-induced martensitic transformation in metastable austenitic stainless steels. J. Iron Steel Inst. Jpn. 1977, 63, 212–222. [Google Scholar] [CrossRef] [PubMed]
- Karjalainen, L.; Taulavuori, T.; Sellman, M.; Kyröläinen, A. Some Strengthening Methods for Austenitic Stainless Steels. Steel Res. Int. 2008, 79, 404–412. [Google Scholar] [CrossRef]
- Hirayama, T.; Ogirima, M. Influence of Chemical Composition on Martensitic Transformation in Fe-Cr-Ni Stainless Steel. J. Jpn. Inst. Met. Mater. 1970, 34, 507–510. [Google Scholar] [CrossRef]
- Schramm, R.E.; Reed, R.P. Stacking fault energies of seven commercial austenitic stainless steels. Met. Mater. Trans. A 1975, 6, 1345–1351. [Google Scholar] [CrossRef]
- Batista, S.R.; Kuri, S.E.; Gonçalves, R.S. Considerações Sobre PREN (Pitting Resistance Equivalent Number) E Fase Sigma Na Resistência À Corrosão De Um Aço Inoxidável Dúplex. Abraco Intercorr. 2014. 9p. Available online: https://abraco.org.br/src/uploads/intercorr/2014/INTERCORR2014_134.pdf (accessed on 25 August 2020). (In Portuguese).
- De, A.K.; Murdock, D.C.; Mataya, M.C.; Speer, J.G.; Matlock, D.K. Quantitative measurement of deformation-induced martensite in 304 stainless steel by X-ray diffraction. Scr. Mater. 2004, 50, 1445–1449. [Google Scholar] [CrossRef]
- Cullity, B.D.; Stock, S.R. Elements of X-ray Diffraction, 3rd ed.; Pearson New International Edition: Harlow, UK, 2014. [Google Scholar]
- Miranda, M.R.; Sasaki, J.M.; Tavares SS, M.; De Abreu HF, G.; Neto, J.M. The use of X-ray diffraction, microscopy and magnetic measurements for analyzing microstructural features of duplex stainless steel. Mater. Charact. 2005, 54, 387–393. [Google Scholar] [CrossRef]
- Sohrabi, M.J.; Naghizadeh, M.; Mirzadehm, H. Deformation-induced martensite in austenitic stainless steels: A review. Arch. Civ. Mech. Eng. 2020, 20, 124. [Google Scholar] [CrossRef]
- Underwood, E.E. Application of Quantitative Metallography; Addison-Wesley: New York, NY, USA, 1973. [Google Scholar]
- ASTM G1-03; Standard Practice for Preparing, Cleaning, and Evaluating Corrosion Test Specimens. ASTM International: West Conshohocken, PA, USA, 2003.
- ASTM G48-03; Standard Test Methods for Pitting and Crevice Corrosion Resistance of Stainless Steels and Related Alloys by Use of Ferric Chloride Solution. ASTM International: West Conshohocken, PA, USA, 2003.
- ASTM G46-94; Standard Guide for Examination and Evaluation of Pitting Corrosion. ASTM International: West Conshohocken, PA, USA, 1994.
- Padilha, A.F.; Plaut, R.L.; Rios, P.R. Annealing of cold-worked austenitic stainless steels. J. Iron Steel Inst. 2003, 43, 135–143. [Google Scholar] [CrossRef]
- Lo, K.H.; Shek, C.H.; Lai, J.K.L. Recent developments in stainless steels. Mater. Sci. Eng. R Rep. 2009, 65, 39–104. [Google Scholar] [CrossRef]
- Järvenpää, A.; Jaskari, M.; Kisko, A.; Karjalainen, P. Processing and properties of reversion-treated austenitic stainless steels. Metals 2020, 10, 281. [Google Scholar] [CrossRef]
- Kumar, B.R.; Singh, R.; Mahato, B.; De, P.; Bandyopadhyay, N.; Bhattacharya, D. Effect of texture on corrosion behavior of AISI 304L stainless steel. Mater. Charact. 2005, 54, 141–147. [Google Scholar] [CrossRef]
- Hamada, A.; Karjalainen, L.; Somani, M. Electrochemical corrosion behaviour of a novel submicron-grained austenitic stainless steel in an acidic NaCl solution. Mater. Sci. Eng. A 2006, 431, 211–217. [Google Scholar] [CrossRef]
- De Abreu, H.F.G.; De Carvalho, S.S.; Neto, P.D.L.; Dos Santos, R.P.; Freire, V.N.; Silva, P.M.D.O.; Tavares, S.S.M. Deformation induced martensite in an AISI 301LN stainless steel: Characterization and influence on pitting corrosion resistance. Mater. Res. 2007, 10, 359–366. [Google Scholar] [CrossRef]
- Solomon, N.; Solomon, I. Effect of deformation-induced phase transformation on AISI 316 stainless steel corrosion resistance. Eng. Fail. Anal. 2017, 79, 865–875. [Google Scholar] [CrossRef]
- Tavares, S.; da Silva, M.; Neto, J.; Miraglia, S.; Fruchart, D. Ferromagnetic properties of cold rolled AISI 304L steel. J. Magn. Magn. Mater. 2002, 242–245, 1391–1394. [Google Scholar] [CrossRef]
- Mészáros, I.; Prohászka, J. Magnetic investigation of the effect of α′-martensite on the properties of austenitic stainless steel. J. Mater. Process. Technol. 2005, 161, 162–168. [Google Scholar] [CrossRef]
- Souza Filho, I.R.; Sandim, M.; Cohen, R.; Nagamine, L.; Hoffmann, J.; Bolmaro, R.; Sandim, H. Effects of strain-induced martensite and its reversion on the magnetic properties of AISI 201 austenitic stainless steel. J. Magn. Magn. Mater. 2016, 419, 156–165. [Google Scholar] [CrossRef]
- Olson, G.B.; Cohen, M. Kinetics of strain-induced martensitic nucleation. Met. Mater. Trans. A 1975, 6, 791–795. [Google Scholar] [CrossRef]
- Llewellyn, D.T. Work hardening effects in austenitic stainless steels. Mater. Sci. Technol. 1997, 13, 389–400. [Google Scholar] [CrossRef]
- Maeng, W.-Y.; Kim, M.-H. Comparative study on the fatigue crack growth behavior of 316L and 316LN stainless steels: Effect of microstructure of cyclic plastic strain zone at crack tip. J. Nucl. Mater. 2000, 282, 32–39. [Google Scholar] [CrossRef]
- Nebel, T.; Eifler, D. Cyclic deformation behaviour of austenitic steels at ambient and elevated temperatures. Sadhana 2003, 28, 187. [Google Scholar] [CrossRef]
- Davis, J.R. ASM Specialty Handbook: Stainless Steels; ASM International: Materials Park, OH, USA, 1996. [Google Scholar]
- Silva, P.M.D.O.; de Abreu, H.F.G.; de Albuquerque, V.H.C.; Neto, P.D.L.; Tavares, J.M.R. Cold deformation effect on the microstructures and mechanical properties of AISI 301LN and 316L stainless steels. Mater. Des. 2011, 32, 605–614. [Google Scholar] [CrossRef]
- Hughes, D.A.; Hansen, N. High angle boundaries formed by grains subdivision mechanism. Acta Mater. 1997, 45, 3871–3886. [Google Scholar] [CrossRef]
- Callister, W.D., Jr.; Rethwisch, D.G. Materials Science and Engineering: An Introduction, 8th ed.; John Wiley and Sons: Hoboken, NJ, USA, 2014. [Google Scholar]
- Swallow, E.; Bhadeshia, H.K.D.H. High resolution observations of displacements caused by bainitic transformation. Mater. Sci. Technol. 1996, 12, 121–125. [Google Scholar] [CrossRef]
- Roberge, P.R. Corrosion Engineering—Principles and Practice; The McGraw-Hill Companies: New York, NY, USA, 2008. [Google Scholar]
- Burstein, G.T.; Liu, C.; Souto, R.M.; Vines, S.P. Origins of pitting corrosion. Corros. Eng. Sci. Technol. 2004, 39, 25–30. [Google Scholar] [CrossRef]
- Karaman, I.; Sehitoglu, H.; Maier, H.J.; Chumlyakov, Y.I. Competing mechanism and modeling of deformation in austenitic stainless steel single crystals with and without nitrogen. Acta Mater. 2001, 49, 3919–3933. [Google Scholar] [CrossRef]
- Byun, T.; Lee, E.; Hunn, J. Plastic deformation in 316LN stainless steel-characterization of deformation microstructures. J. Nucl. Mater. 2003, 321, 29–39. [Google Scholar] [CrossRef]
- Mudali, U.K.; Shankar, P.; Ningshen, S.; Dayal, R.; Khatak, H.; Raj, B. On the pitting corrosion resistance of nitrogen alloyed cold worked austenitic stainless steels. Corros. Sci. 2002, 44, 2183–2198. [Google Scholar] [CrossRef]
- Chunchun, X.; Gang, H. Effect of deformation-induced martensite on the pit propagation behavior of 304 stainless steel. Anti Corros. Methods Mater. 2004, 51, 381–388. [Google Scholar] [CrossRef]


Disclaimer/Publisher’s Note: The statements, opinions and data contained in all publications are solely those of the individual author(s) and contributor(s) and not of MDPI and/or the editor(s). MDPI and/or the editor(s) disclaim responsibility for any injury to people or property resulting from any ideas, methods, instructions or products referred to in the content. |
© 2023 by the authors. Licensee MDPI, Basel, Switzerland. This article is an open access article distributed under the terms and conditions of the Creative Commons Attribution (CC BY) license (https://creativecommons.org/licenses/by/4.0/).