1. Introduction
Grain-oriented silicon steel is a kind of iron silicon material with about 3% Si and strong {110}<001> Goss texture, which is divided into conventional grain-oriented silicon steel (CGO) and high permeability grain-oriented silicon steel (Hi-B), and grain-oriented silicon steel that is mainly used for medium and large transformer cores and stator cores of large generators; it is considered an important soft magnetic alloy in the power, electronics and military industries [
1]. The grain-oriented silicon steel has a strict standard for composition control, with a long and complex manufacturing process in which magnetic properties are influenced by many factors and its product quality is an important measurement standard of the national special steel manufacturing level; grain-oriented silicon steel has gained the reputation of being a “work of art” [
2].
With the implementation of the “double carbon” policy in various countries in the world, the demand for high-end products with ultra-low iron loss and ultra-high magnetic induction grain-oriented electrical steel has increased, and thinning thickness is the most effective method to reduce loss of silicon steel sheet. For CGO steel produced by the two-stage cold rolling method, the reduction in the sheet thickness means an increase in the cold rolling reduction rate, especially the secondary cold rolling reduction rate. The texture of electrical steel is a critical factor in improving the magnetic properties, and the control of texture is closely related to the reduction rate so only an appropriate reduction rate can form a sharp Goss texture during the secondary recrystallization. Therefore, the secondary cold rolling reduction rate has become a research hotspot.
He [
3] et al. confirmed that if the secondary cold rolling reduction rate was less than 50% or more than 60% the magnetic properties would be reduced, and the strong {111}<112> texture component could be obtained in the range of 50–60% secondary cold rolling reduction rate. Dong et al. [
4] found that the content of {110}<001>, which was beneficial to the magnetic properties, increased first and then decreased with the increase in secondary cold rolling reduction rate, with the content and strength of Goss texture reaching the maximum at 55% reduction rate. Pan et al. [
5] found that with the increase in secondary cold rolling reduction rate, the dislocation density of the cold rolled sheet, the energy storage, and the strength of α and γ textures increased, and the starting temperature of secondary recrystallization and grain size decreased; when the reduction rate was 70% the secondary recrystallization developed best. Sun et al. [
6] found that when the secondary cold rolling reduction rate was 55%, uniform matrix grains and an appropriate number of Goss crystal nuclei could be obtained, so as to accumulate enough {110}<001> components; if the secondary cold rolling reduction rate was less than 55%, the number of Goss grains formed is too small, or even can not be formed, resulting in decreased magnetic properties. Dang et al. [
7] found that when the increase in secondary cold rolling reduction rate was from 50% to 63%, the average grain size of the matrix decreased gradually at the initial stage of secondary recrystallization (900 °C) and the density of {112}–{111}<110> texture and γ orientation increased. Fang Feng [
8], and Liang Ruiyang [
9] found that when the reduction rate for cold rolling grain-oriented silicon steel products was small, the {111}<112> deviation angle was larger; when the reduction rate increased to 70%, the {111}<112> orientation was more accurate and the Goss texture with higher sharpness was obtained after annealing. Therefore, the suitable range of the secondary cold rolling reduction rate for CGO is 50–70% because too small reduction rate leads to insufficient Goss crystal nuclei, and too large reduction rate leads to a large deviation angle of Goss orientation, which deteriorates magnetic properties; when the optimal reduction rate range is too large, the influence mechanism of secondary cold rolling reduction rate on the secondary recrystallization process is not clear.
With the rapid development of ultrahigh-voltage direct current transmission systems and flexible alternating current transmission systems, ultra-thin grain-oriented silicon steel plays an irreplaceable role as the core material of anode saturated reactors. At the same time, with the requirement of energy saving and environmental protection ultra-thin steel has become an important development direction of oriented silicon steel. The thickness of grain-oriented silicon steel is reduced from the traditional 0.27~0.23 mm to less than 0.10 mm, which is bound to increase the secondary cold rolling reduction rate. The effect of secondary cold rolling reduction rate on secondary recrystallization is very important. However, there are few studies on the effect of more than 70% secondary cold rolling reduction rate. Therefore, it is necessary to study the effect of secondary cold rolling reduction rate on the microstructure and texture of ultra-thin grain-oriented silicon steel. In this paper, the industrial production of grain-oriented silicon steel was studied, and the influence of the secondary cold rolling reduction rate on the microstructure, texture, and secondary recrystallization behavior of the cold rolled sheet was explored, which provides theoretical support for industrial production process optimization.
2. Research Materials and Methods
The research materials are taken from the industrial production process, and the main chemical components of the hot-rolled plate are shown in
Table 1. The production process of grain-oriented silicon steel was: hot metal pretreatment → 200 tons converter refining → RH vacuum treatment → continuous casting → soaking → hot continuous rolling → acid pickling → single cold rolling → decarburization annealing → secondary cold rolling → MgO coating → high temperature annealing → insulation coating. The thickness of the slab was 220 mm, the soaking temperature was 1270–1280 °C, the thickness of the hot rolled plate was 2.75 mm, and the final rolling temperature was 930 °C. After acid pickling the hot rolled plate was cold rolled to 0.625 mm by 20-high Sendzimir mill, then was decarburization annealed at 830 °C, and then was cold rolled to 0.27–0.18 mm, with 59.2%–72.8% secondary cold rolling reduction rate. The specific reduction rates are shown in
Table 2.
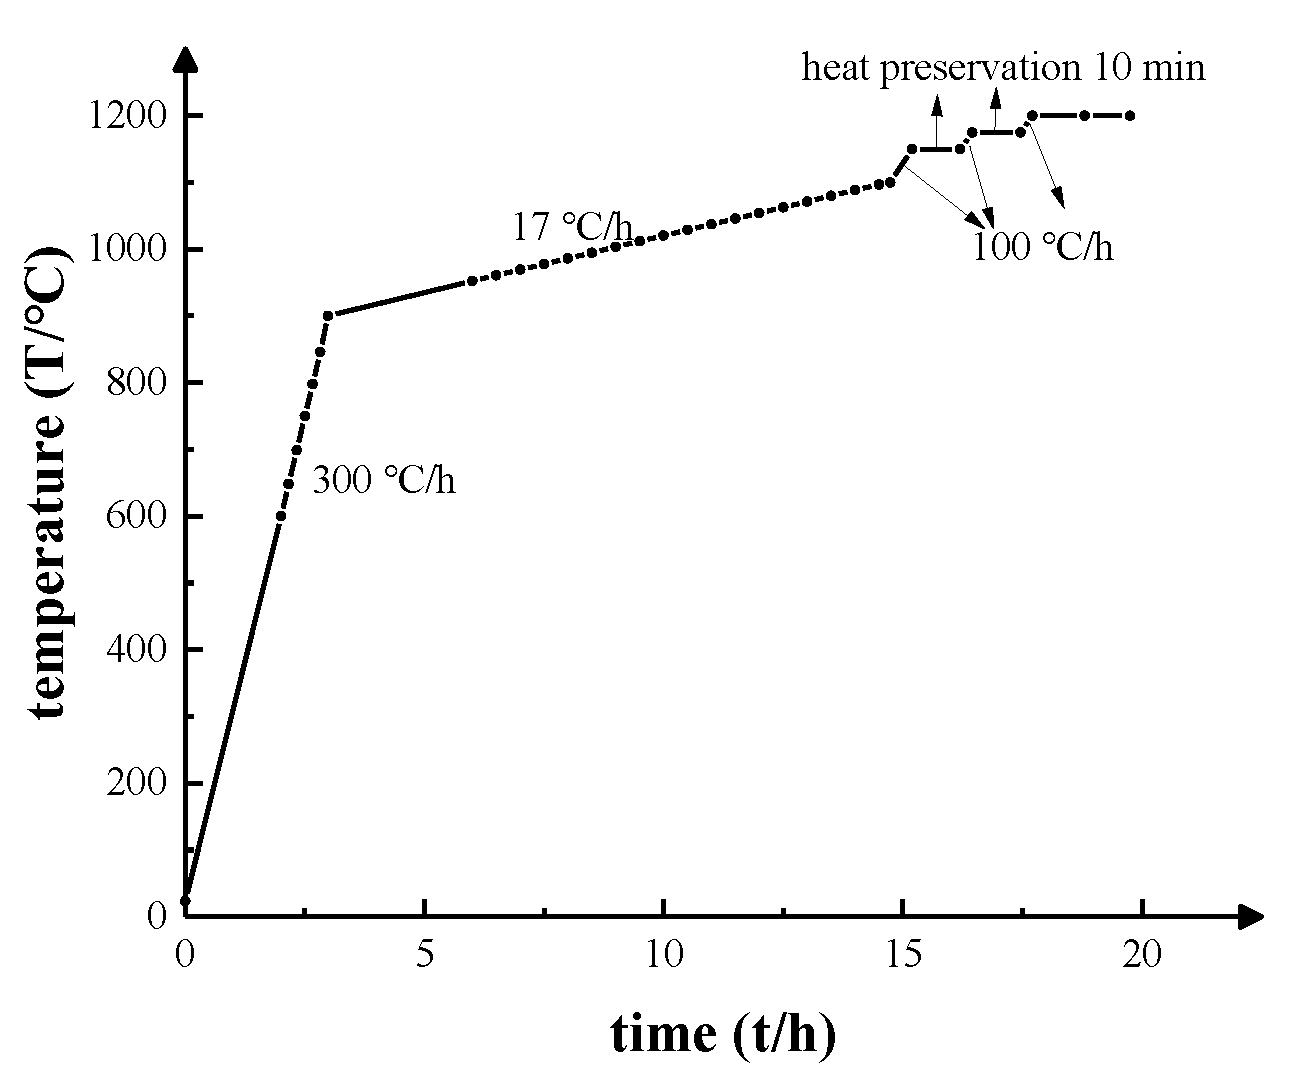
The abnormal growth behavior of Goss grains in a high temperature annealing process was studied by “interruption method” with secondary cold rolled sheet as raw material, and the high temperature annealing specific process (
Figure 1) was as follows: in the first stage, the temperature of secondary cold rolled sheet was increased from room temperature to 900 °C at a heating rate of 300 °C/h; in the second stage, the temperature was increased to 1100 °C at a slow heating rate of 17 °C/h; in the third stage, the temperature was increased to 1150 °C, 1175 °C, and 1200 °C at a heating rate of 100 °C/h in turn, and kept for 10 min. At 600 °C–950 °C it was sampled every 50 °C, at 950 °C–1100 °C was sampled every 10 °C, and finally at 1150 °C, 1175 °C, 1200 °C was sampled with 100% N
2 during annealed process.
The 15 mm × 10 mm × h metallographic samples were made by a wire cutting machine along the rolling direction (RD) and transverse direction (TD) of the decarburization annealing sheet, secondary cold rolled sheet, and high temperature annealing process samples. After the rough ground and fine ground, the samples were mechanically polished to the mirror surface until there were no scratches and black spots on the test surface; then the samples were corroded by 4% nitric acid alcohol solution for 15–20 s. The metallographic observation and image acquisition were carried out with Axio Imager A1m metallographic microscope (Carl Zeiss, Germany), and the average grain size was calculated by the intercept method. The samples of the secondary recrystallization process of grain-oriented silicon steel were made into 100 mm × 30 mm × h samples along the rolling direction (RD) and transverse direction (TD) by wire cutting machine (Taizhou Zhiheng CNC Machine Tool Co., Ltd., Taizhou, Jiangsu, China), the samples were immersed in hot hydrochloric acid aqueous solution with a concentration of 50% and a temperature of 80 °C–90 °C to corrosion out the grain boundaries, then the abnormally grown grains were photographed and counted.
The samples of each process were cut into 25 mm (RD) × 20 mm (TD) × h by wire cutting machine, and the macro-texture of the samples were detected. Sample surface with 1000# sandpaper grinding, and then used 4% nitric acid alcohol solution to wipe test the surface to eliminate stress. The macro-texture was detected by Smart-Lab X-ray diffractometer, the three incomplete pole figures of {110}, {200}, and {211} of each sample were measured, and the orientation distribution function and the main texture content were calculated. The results were expressed by φ2 = 45° sectional drawing.
The samples of each process were cut into 10 mm (RD) × 8 mm (TD) × h by wire cutting machine, and the microtexture of the samples were detected. All samples were ground with water on 240#–2000# metallographic sandpaper, then mechanically polished to the mirror surface and corroded with 4% nitric acid alcohol solution for 15–20 s. The NordlysMax2 EBSD device equipped with Quanta 650 field emission scanning electron microscope (FEI, Production in the Czech Republic, USA brands) was used for orientation data acquisition, and the obtained EBSD data were processed and analyzed by Channel 5 processing software (Oxford Instruments, Oxford, UK).
4. Analysis and Discuss
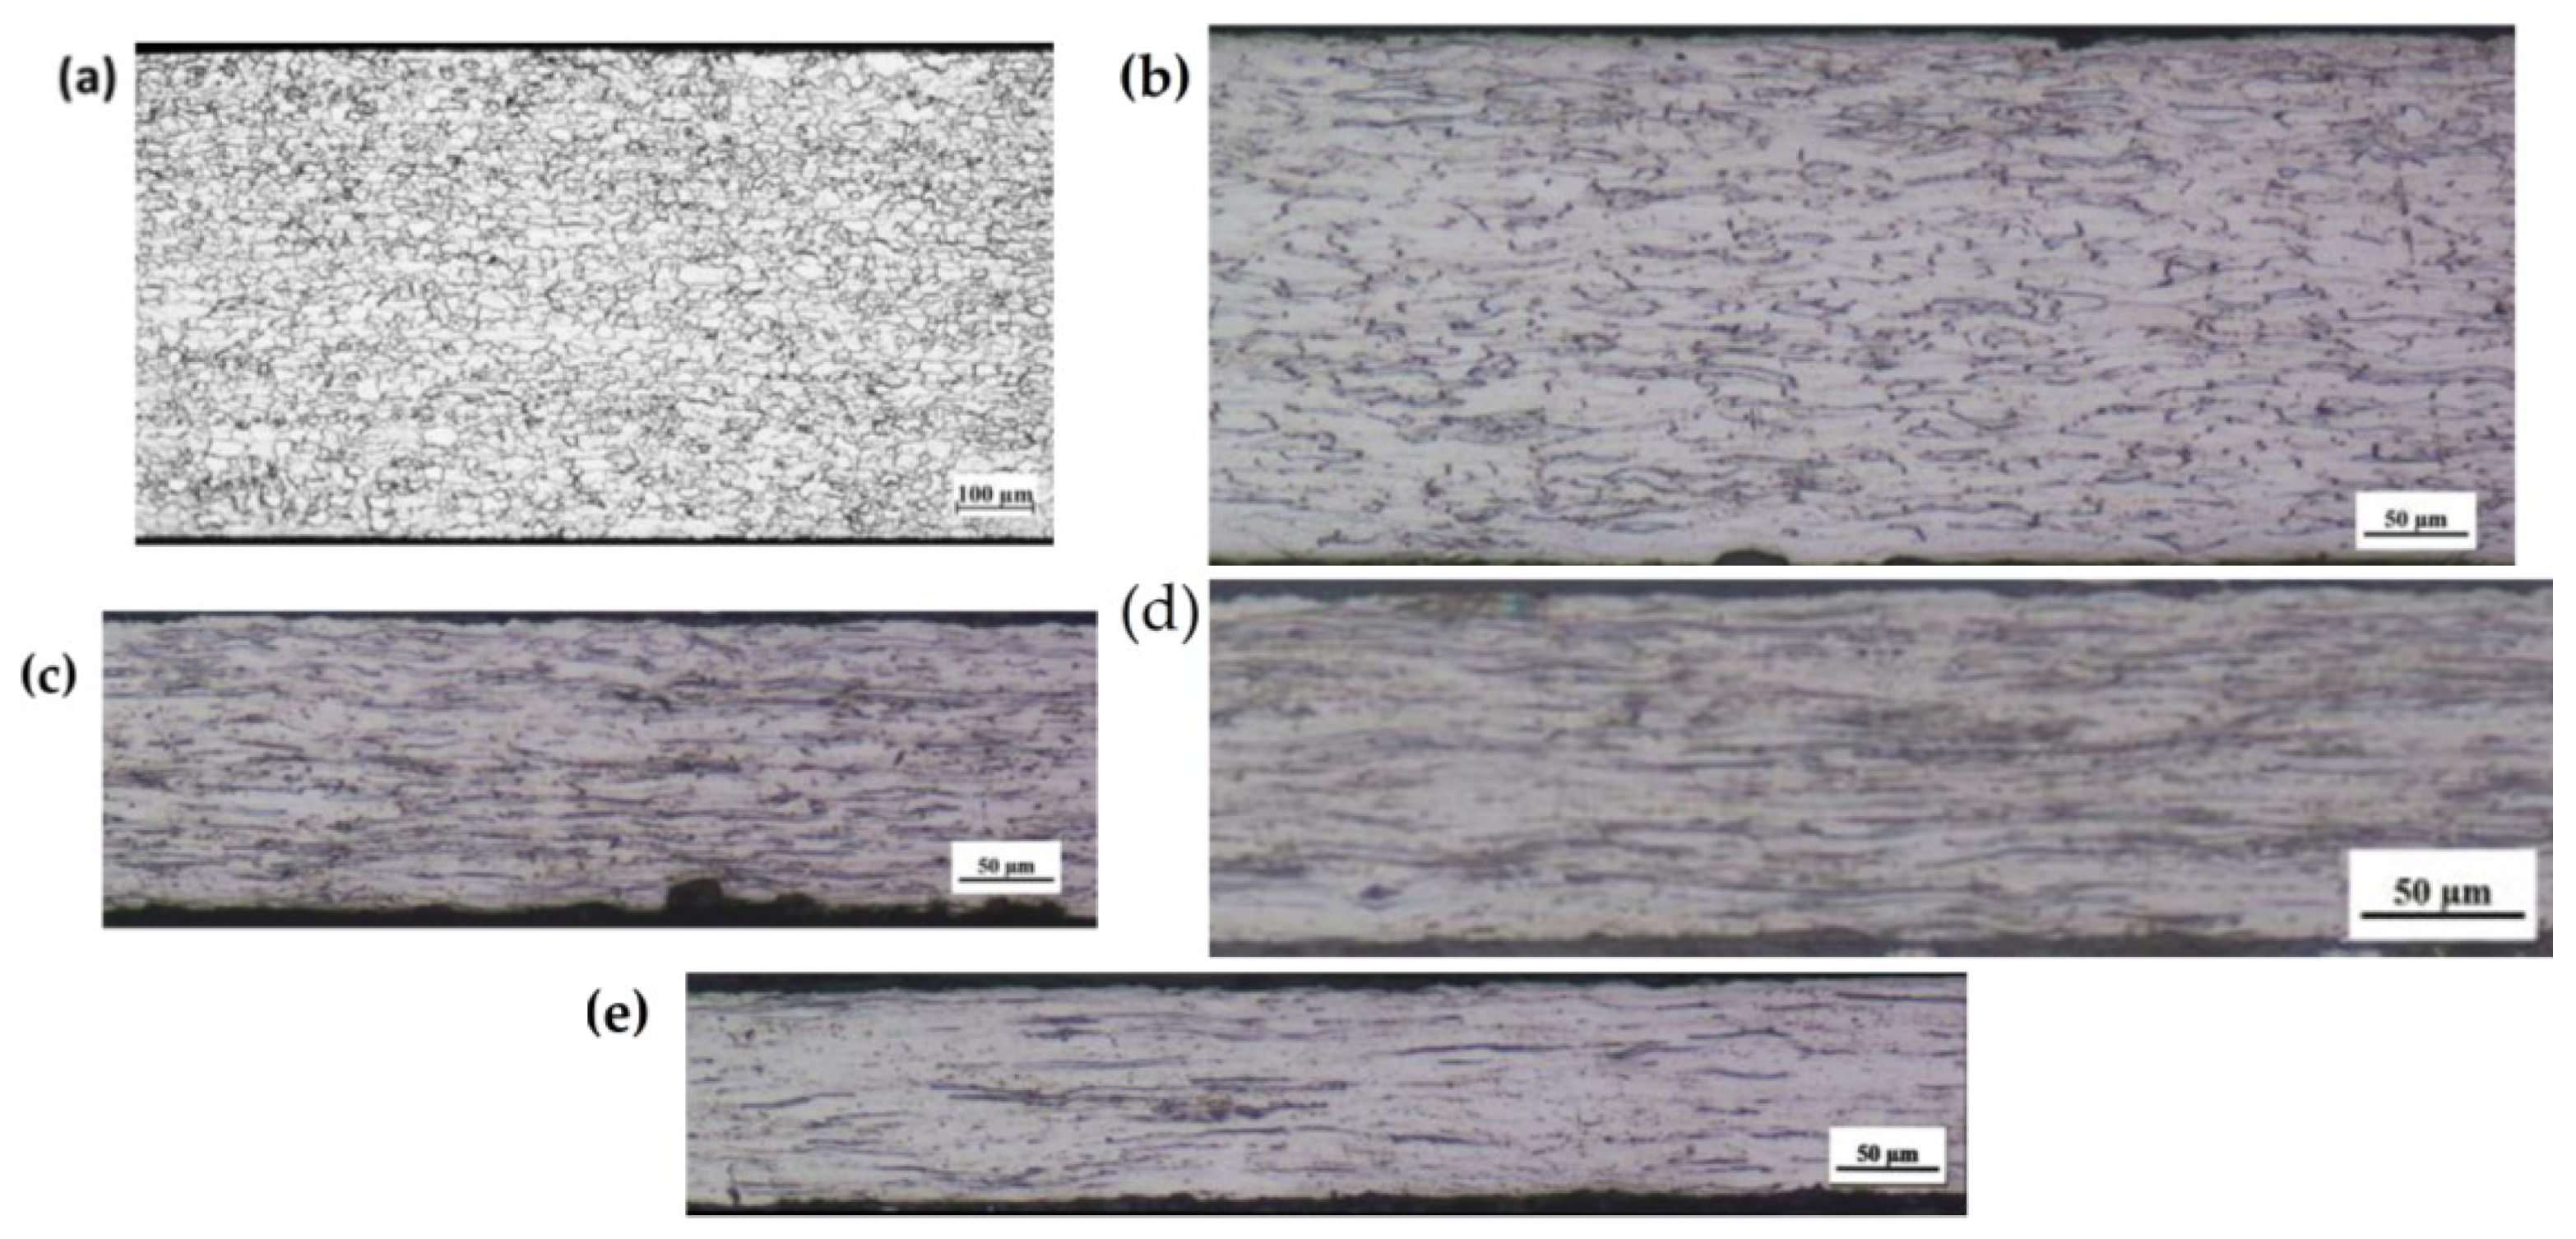
Due to the different rolling forces the microstructure of secondary cold rolled sheet with different reduction rates has obvious differences. As the reduction rate increased from 59.2% to 72.8%, the grain boundaries of the deformed grains gradually blurred and the fiber strip gradually elongated along the rolling direction (
Figure 2), which was the same results as in the literature [
16].
In this study, when the secondary cold rolling reduction rate was 59.2%, the {111}<112> texture content was the highest (
Table 3), the γ orientation density was the highest, and the α orientation density was the lowest (
Figure 5); when the secondary cold rolling reduction rate increased to 72.8%, the {111}<112> texture content decreased and the α orientation density increased. The increase in cold rolling reduction rate made the {111}<112> orientation rotate along the path {111}<112> → {223}<110> → {112}<110>. The results show that when there were shear bands in the {111}<112> deformed grains of the secondary cold rolled sheet and there were Goss crystal nuclei in these shear bands, then Goss texture with accurate orientation can be formed during the secondary recrystallization [
17]. In addition, literature 1 [
18] studies have shown that the {001}–{111}<110> type cold rolling texture will prevent the growth of {110}<001> oriented Goss grains during secondary recrystallization. Therefore, the 59.2% secondary cold rolling reduction rate ensures the formation of strong {111}<112> deformation texture, which was beneficial to the development of secondary recrystallized Goss grains.
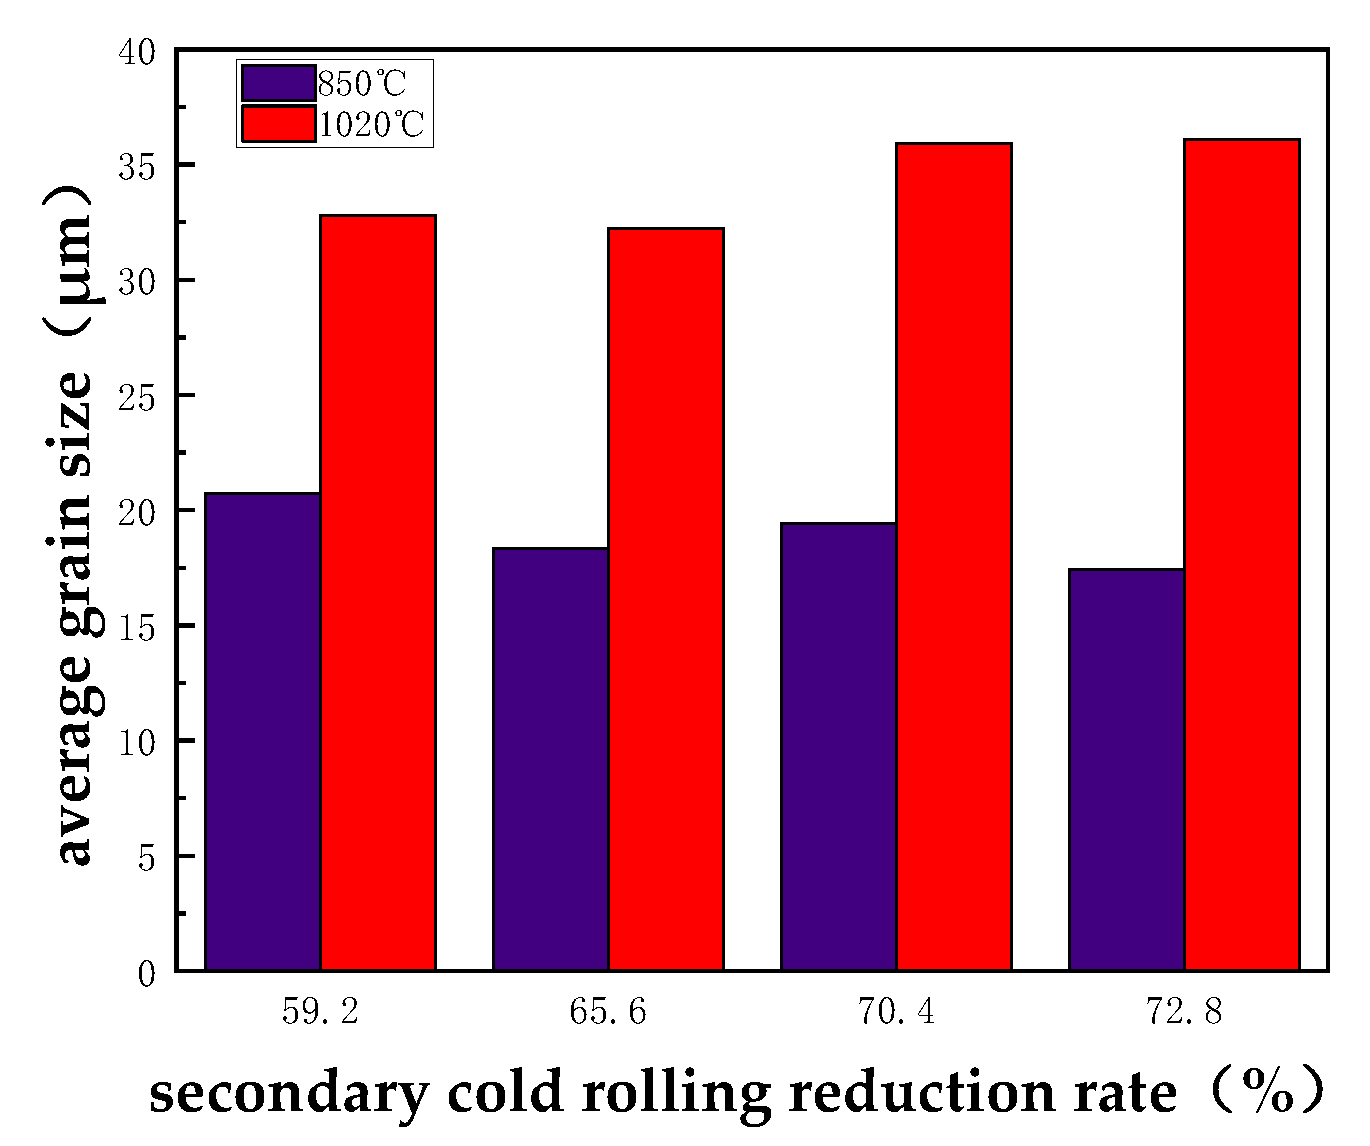
When the annealing temperature increased to 1020 °C and the secondary cold rolling reduction rate was 59.2% and 65.6%, the average grain size was smaller, 32.19 μm and 31.76 μm, respectively (
Figure 14). The process that Goss grains of grain-oriented silicon steel have abnormal growth by swallowed matrix grains during high temperature annealing was in a competitive relationship with the process of growth of matrix grains. The driving force for matrix grain growth mainly depends on deformation energy storage, and secondary recrystallization mainly depends on grain boundary energy; the smaller the matrix grain size, the larger the grain boundary area, and the larger the size difference between the secondary grain and the matrix grain, thereby improving the driving force for secondary grain growth and promoting the abnormal growth of Goss grains in the secondary recrystallization process; therefore, the smaller the matrix grain size, the more favorable. In summary, the average grain size of the matrix when the reduction rate was 59.2% and 65.6% was more beneficial to the development of secondary recrystallization.
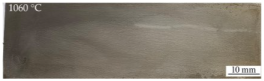
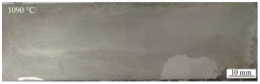
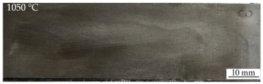
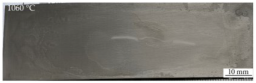
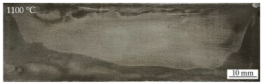
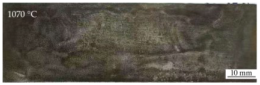
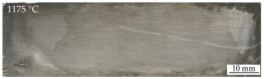
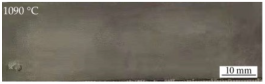
The experimental studies found that when the annealing temperature exceeded 1000 °C, the recrystallized grain size of the matrix increased with the increase in the secondary cold rolling reduction rate, and the oversized grains were not easy to be swallowed by Goss grains resulting in the increase in the finish temperature of secondary recrystallization. In this study, the starting temperature of secondary recrystallization at four secondary cold rolling reduction rates all exceeded 1050 °C. When the reduction rates were 59.2% and 65.6%, the finish temperatures of secondary recrystallization were 1090 °C and 1100 °C; when the reduction rates were 70.4% and 72.8%, the finish temperature of secondary recrystallization was 1175 °C. Properly increasing the temperature of secondary recrystallization helps solve the problem of abnormal growth of deviation Goss and obtain sharp Goss texture [
17]. Li Sai [
19] et al.’s studies have shown that too high or too low secondary recrystallization temperature will cause deviation Goss grains and brass grains to compete with Goss for growth during high temperature annealing, thus reducing the sharpness of Goss texture. At the same time, too high temperature also easily causes the inhibitor to coarsen and the grains to grow in all directions, which further leads to the decrease in Goss sharpness. Therefore, there is an optimal secondary recrystallization temperature. In this study, the starting temperature of secondary recrystallization is 1050–1060 °C and the finish temperature is 1090–1100 °C at 59.2% and 65.6% reduction rates, which was more favorable to obtain Goss texture with high orientation.
In this study, when the annealing temperature is close to the starting temperature of secondary recrystallization and the secondary cold rolling reduction rate increased from 59.2% to 72.8%, it resulted in the decrease in the total content of {111}<112> and {114}<481> textures gradually. The relationship of {111}<112> and {114}<481> with Goss texture are 35.4°<110> and 39.4°<110>, respectively, close to Σ9 grain boundaries (38.9°<110>) [
20], and the migration velocity of Σ9 is the fastest, which is most favorable for the development of Goss texture; Goss-oriented grains can move rapidly by Σ9 grain boundaries and swallow the surrounding {111}<112> and {411}<148> texture components to form a complete Goss orientation during high temperature annealing. However, during high temperature annealing it is difficult for Goss to swallow α oriented grains, and the existence of α oriented grains will affect the secondary recrystallization texture and magnetic induction intensity [
7]. Therefore, when the reduction rate was 59.2% the total content of favorable textures {111}<112> and {114}<481> was highest at 24.22%, which was most conducive to the development of secondary recrystallization Goss texture and also conducive to obtain the minimum deviation angle and high magnetic induction value.
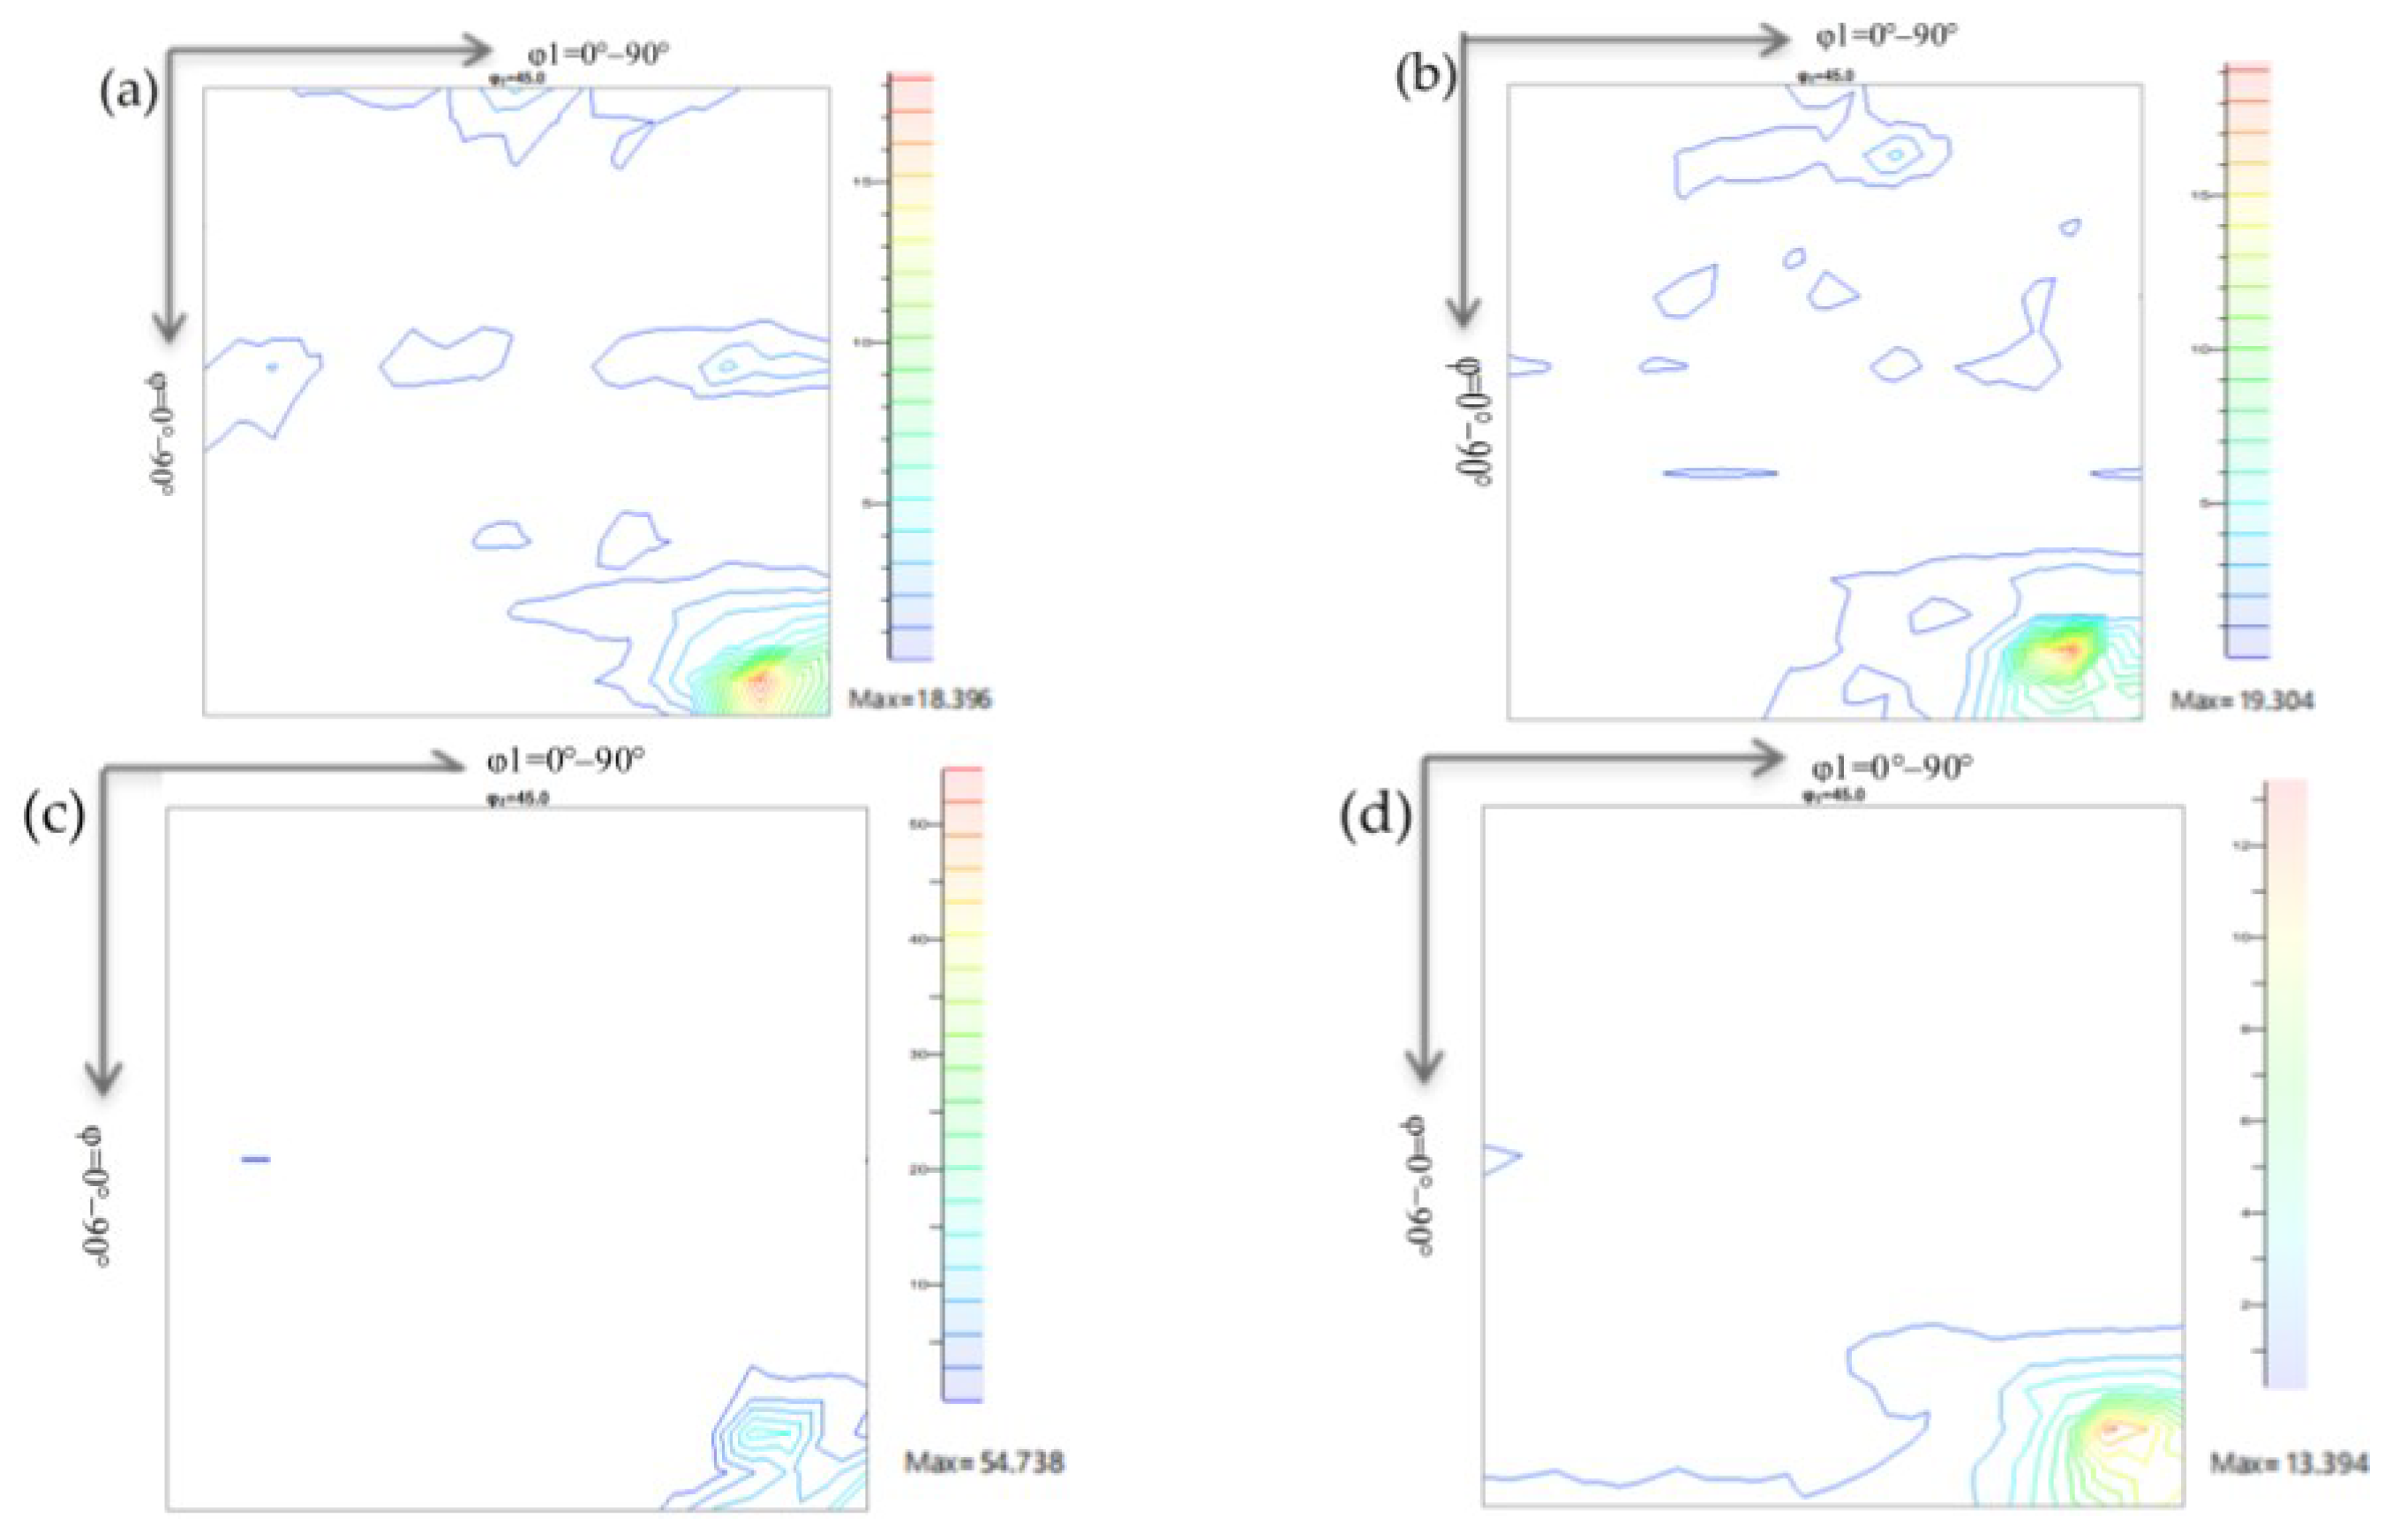
The closer the high temperature annealing process is to the starting temperature of secondary recrystallization, the greater the influence of Goss texture content. When the annealing temperature was increased to 1020 °C and the reduction rate was 59.2%, the highest Goss content was 0.798% because the {111}<112> component in the cold rolled sheet was the most, and the Goss crystal nuclei were easy to nucleate inside the {111}<112> shear bands during the annealing process; under other cold rolling reduction rates the {111}<112> components in the cold rolled sheet are less, and the less Goss nucleation position leads to the decreased in content. The iron loss (P
T) includes magnetic hysteresis loss (P
h), eddy current loss (P
e), and excess loss (P
a), in which P
a and P
e account for a large proportion of grain-oriented silicon steel. Finally, the decrease in the average grain size of the secondary recrystallization narrowed the width of the 180° main magnetic domain, which is conducive to the rotation of the magnetic domain during the magnetization period, thereby reducing P
h; however, the rotation of the magnetic domain is hindered by the grain boundaries and the grain boundaries in the finished sheet increase the P
h, so the final P
h does not change significantly. However, as the main magnetic domain width narrows the energy loss during the magnetization process becomes smaller, and P
e1.7/50 decreases significantly as the final grain size decreases [
21]. Therefore, when the reduction rate is 59.2%, the more Goss content in the high temperature annealing process and the smaller the grain size after the secondary recrystallization is completed, which is most conducive to reducing iron loss and improving magnetic induction.
Therefore, the optimum secondary cold rolling reduction rate is 59.2% by studying the microstructure and texture of the secondary cold rolled sheet, the starting and finish temperature of secondary recrystallization, and the microstructure and texture during the heating process. Although thinner grain-oriented silicon steel is the future product trend, it is also found from the above research that the thinning thickness cannot only depend on increasing the secondary cold rolling reduction rate, otherwise it will cause the deterioration of magnetic properties, but should be controlled from the thickness of hot rolled plate, the thickness of single cold rolled sheet, and optimized the single and secondary cold rolling reduction rate; only in this way can the whole process of integrated control obtain excellent magnetic properties while reducing the thickness.
Author Contributions
Writing–original draft, L.F.; Validation, Z.G.; Resources, E.Y.; Methodology, J.H. All authors have read and agreed to the published version of the manuscript.
Funding
This work was financially supported by the Inner Mongolia Science and Technology Project (2020GG0265, 2022YFHH0079), Inner Mongolia Science Foundation(2020MS05006), Program for Young Talents of Science and Technology in Universities of Inner Mongolia Autonomous Region (NJYT23116), Program for Innovative Research Team in Universities of Inner Mongolia Autonomous Region (NMGIRT2211), Inner Mongolia University of Technology Key Discipline Team Project of Materials Science (ZD202012).
Institutional Review Board Statement
Not applicable.
Informed Consent Statement
Informed consent was obtained from all subjects involved in the study.
Data Availability Statement
The accuracy of the experimental data can ensure that.
Conflicts of Interest
The authors declare no conflict of interest.
References
- Yang, J.H. Smelting method of oriented silicon steel alloyed in RH furnace. J. Metall. Inf. Rev. 2022, 59, 24–267. [Google Scholar]
- Zhu, C.Y.; Chen, X.H.; Li, G.Q.; Fu, Y.; Xu, G. The latest development of composition controlling in high quality grain-oriented silicon steel and its influence on magnetic properties. J. Mater. Rep. 2015, 29, 6–14. [Google Scholar]
- He, Z.Z.; Zhang, X.Y.; Zhou, Z.Q. The magnetic properties and the degree of crystal orientation of 3% silicon-iron after rolling and annealing. J. Acta Metall. Sin. 1964, 2, 165–173. [Google Scholar]
- Dong, H.; Zhao, Y.; Yu, X.J.; Lian, F.Z. Effect of secondary cold rolling reduction rate on magnetic properties and texture of thin non-oriented electrical steel sheets. J. Iron Steel. 2008, 43, 80–83. [Google Scholar]
- Pan, L.M.; Zhou, Y.J.; Xia, Z.S.; Feng, L.L. Effect of secondary cold rolling reduction rate on microstructure and property of oriented silicon steel. In Proceedings of the Eighth China Iron and Steel Annual Conference, Beijing, China, 26 October 2011. [Google Scholar]
- Sun, B.; Jiang, M.W.; Huang, X.Y. Investigate 0.2 mm thickness oriented electrical silicon sheet for process and magnetism. J. Huan Nan Metall. 2004, 32, 24–26. [Google Scholar]
- Dang, N.; Li, Z.C.; Zhang, W.K.; Sun, Q. Influence of secondary cold rolling reduction on Goss texture of a CGO silicon steel. J. Trans. Mater. Heat Treat. 2016, 37, 138–143. [Google Scholar]
- Fang, F.; Yang, J.; Zhang, Y.; Wang, Y.; Zhang, X.; Yuan, G.; Misra, R.D.K.; Wang, G. Microstructure and magnetic properties of ultra-thin grain-oriented silicon steel. J. Magn. Magn. Mater. 2021, 535, 168087. [Google Scholar] [CrossRef]
- Liang, R.Y.; Yang, P. Effects of cold rolling reduction and initial Goss grains orientation on texture evolution and magnetic performance of ultra-thin grain-oriented silicon steel. J. Mater. Eng. 2017, 45, 87–96. [Google Scholar]
- Yang, P.; Chang, S.H. Orientational analysis of warm-compressed ferrite in a low carbon steel by means of orientation mapping. J. Chin. J. Mater. Res. 2003, 17, 520–529. [Google Scholar]
- Matsuo, M.; Sakai, T.; Tanino, M.; Shindo, T.; Hayami, S. Proceedings of the 6th International Conference on Textures of Materials; Iron and Steel Institute of Japan: Tokyo, Japan, 1981; Volume 918, p. 27. [Google Scholar]
- Gao, X.H.; Qi, K.M.; Qiu, C.L.; Ye, H.Z. Effect of heat treatment parameters on tertiary recrystallization of Gross-shear rolled ultra-thin silicon steel strips. J. Northeast. Univ. Nat. Sci. 2005, 26, 259–262. [Google Scholar]
- Gao, Q.; Wang, X.H.; Li, J.; Gong, J.; Li, B. Effect of aluminum on secondary recrystallization texture and magnetic properties of grain-oriented silicon steel. J. Iron Steel Res. Int. 2021, 28, 479–487. [Google Scholar] [CrossRef]
- Gerber, P.; Tarasiuk, J.; Chauveau, T.; Bacroix, B. A quantitative analysis of the evolution of texture and stored energy during annealing of cold rolled copper. J. Acta Mater. 2003, 51, 6359–6371. [Google Scholar] [CrossRef]
- Zhao, X.Y. Research and Development of High-Grade Thin-Gauge Non-Oriented Silicon Steel; Inner Mongolia University of Technology: Hohhot, China, 2021. [Google Scholar]
- Wang, X.Y.; Xiang, L.; Zhang, C.; Chou, S.T.; Zhao, J.X. Effect of reduction ratio in secondary cold-rolling on microstructure and texture of V and Ti-contained grain-oriented silicon steel. J. Mater. Rep. 2015, 29, 99–103. [Google Scholar]
- Yang, P.; Li, Z.C.; Mao, W.M.; Zhao, Z.S. Formation of the {111}<112> annealing texture in steels. J. Trans. Mater. Heat Treat. 2009, 30, 46–52. [Google Scholar]
- Oyarzábal, M.; Martínez-de-Guerenu, A.; Gutiérrez, I. Effect of stored energy and recovery on the overall recrystallization kinetics of a cold rolled low carbon steel. J. Mater. Sci. Eng. A 2008, 485, 200–209. [Google Scholar] [CrossRef]
- Li, S.; Yang, Q.L.; Liu, Q.X.; Yang, P. The onset temperature of secondary recrystallization and the sharpness of Goss texture in low temperature nitriding grain-oriented silicon steel. J. Chin. J. Stereol. Image Anal. 2016, 21, 189–196. [Google Scholar]
- Liu, G.T.; Liu, Z.Q.; Yang, P.; Mao, W.M. Correlation between primary and secondary recrystallization texture components in low-temperature reheated grain-oriented silicon steel. J. Iron Steel Res. Int. 2016, 23, 1234–1242. [Google Scholar] [CrossRef]
- Gao, Y.; Xu, G.; Guo, X.; Li, G. Effect of Cr on secondary recrystallization behaviors in high permeability grain oriented silicon steel manufactured by low-temperature slab reheating. J. Magn. Magn. Mater. 2019, 476, 428–436. [Google Scholar] [CrossRef]
Figure 1.
High temperature annealing process.
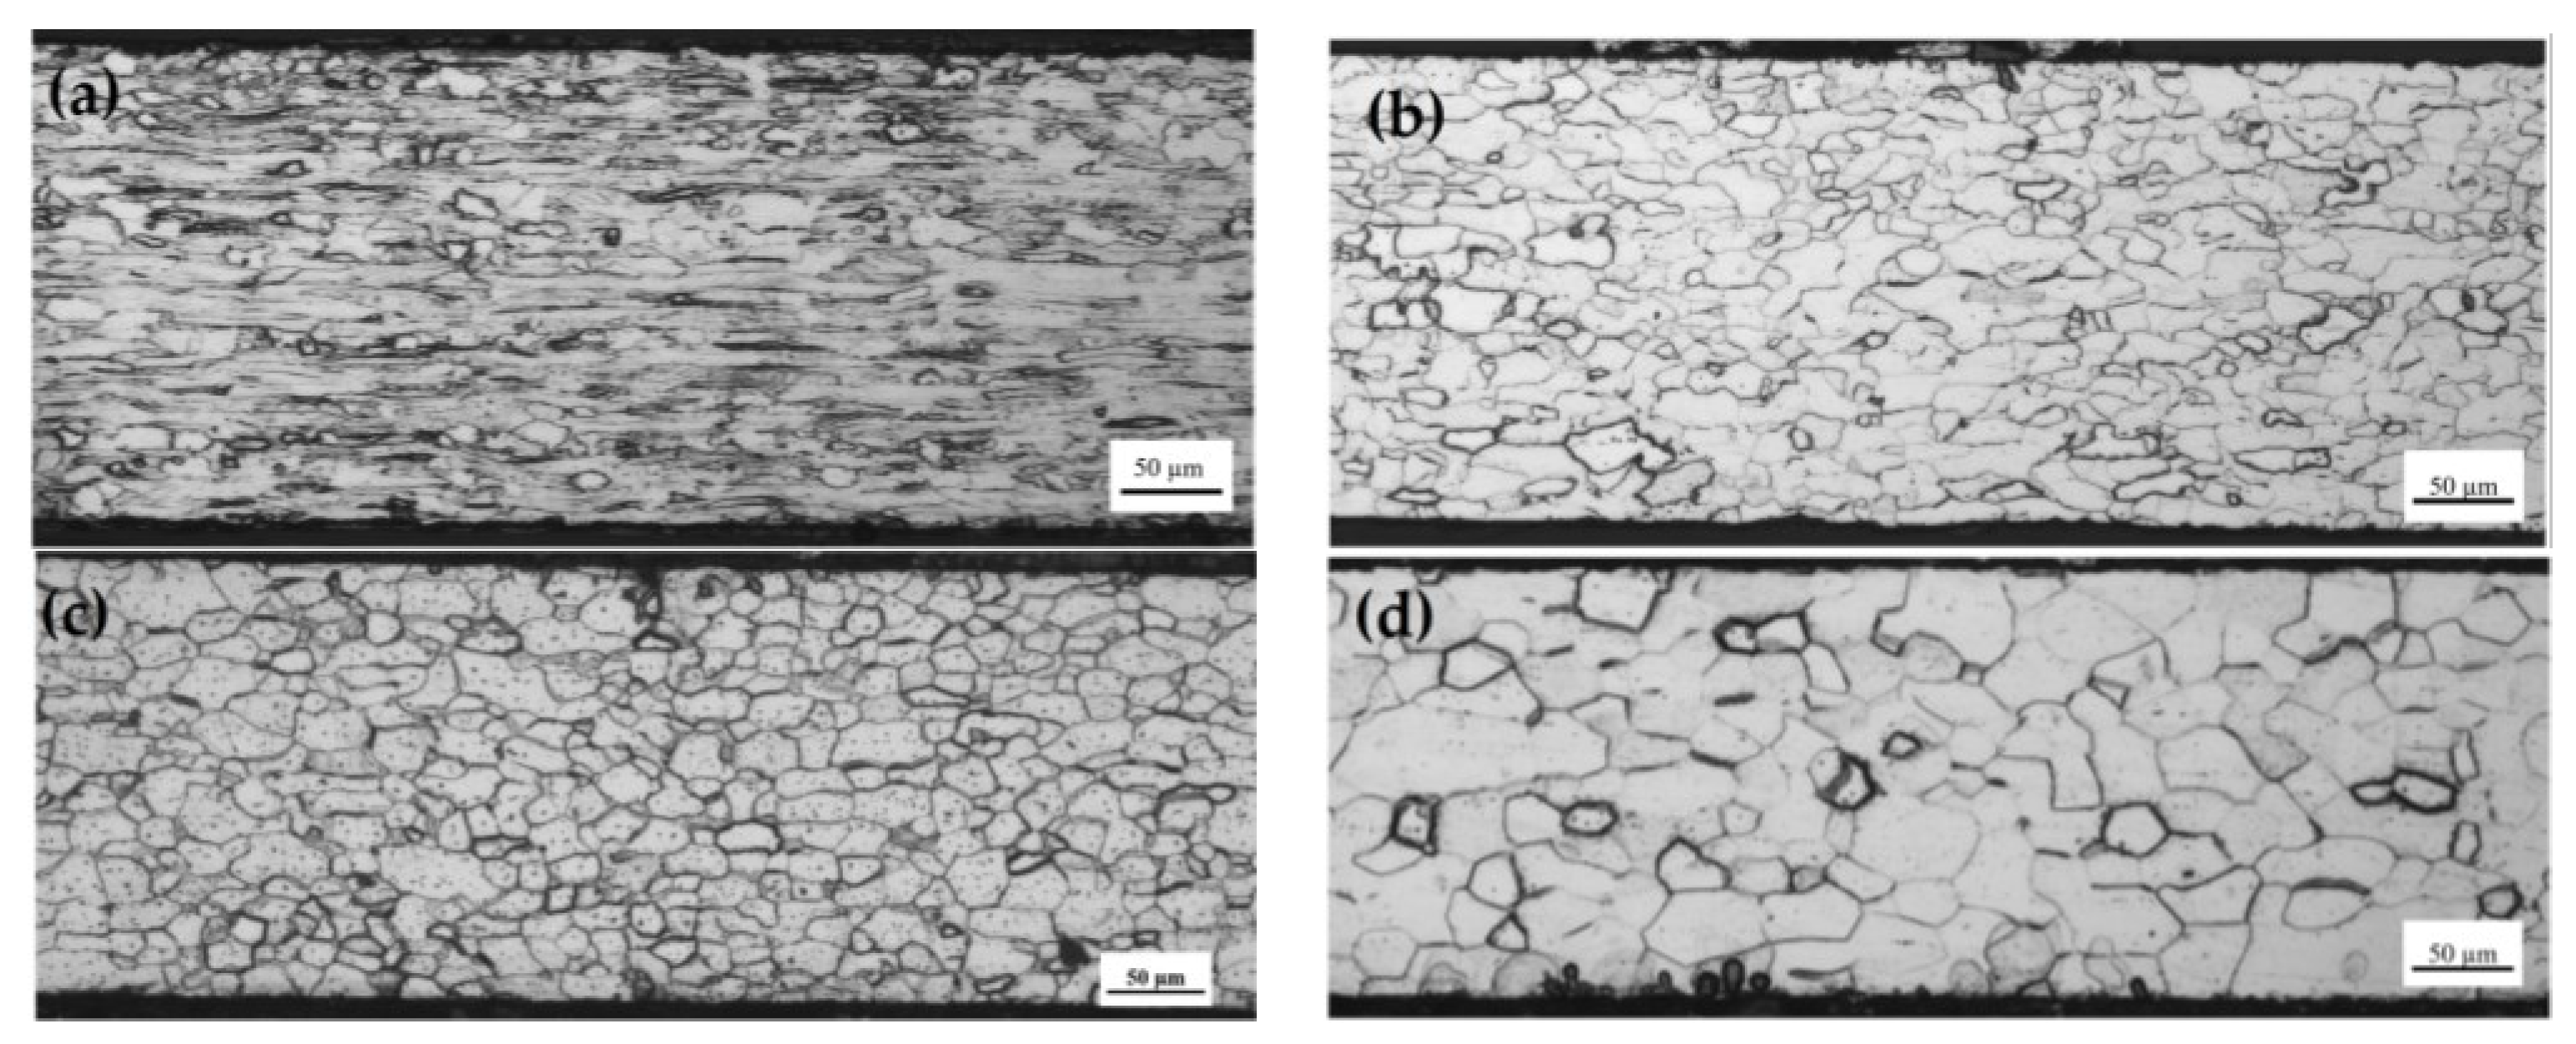
Figure 2.
Microstructure of decarburization annealed sheet and the secondary cold rolled sheet with different secondary cold rolled reduction rates: (a) decarburization annealed sheet; (b) 59.2%; (c) 65.6%; (d) 70.4%; (e) 72.8%.
Figure 3.
Microstructure at φ2 = 45° section of decarburization annealed sheet; (a) surface layer; (b) 1/2 layer.
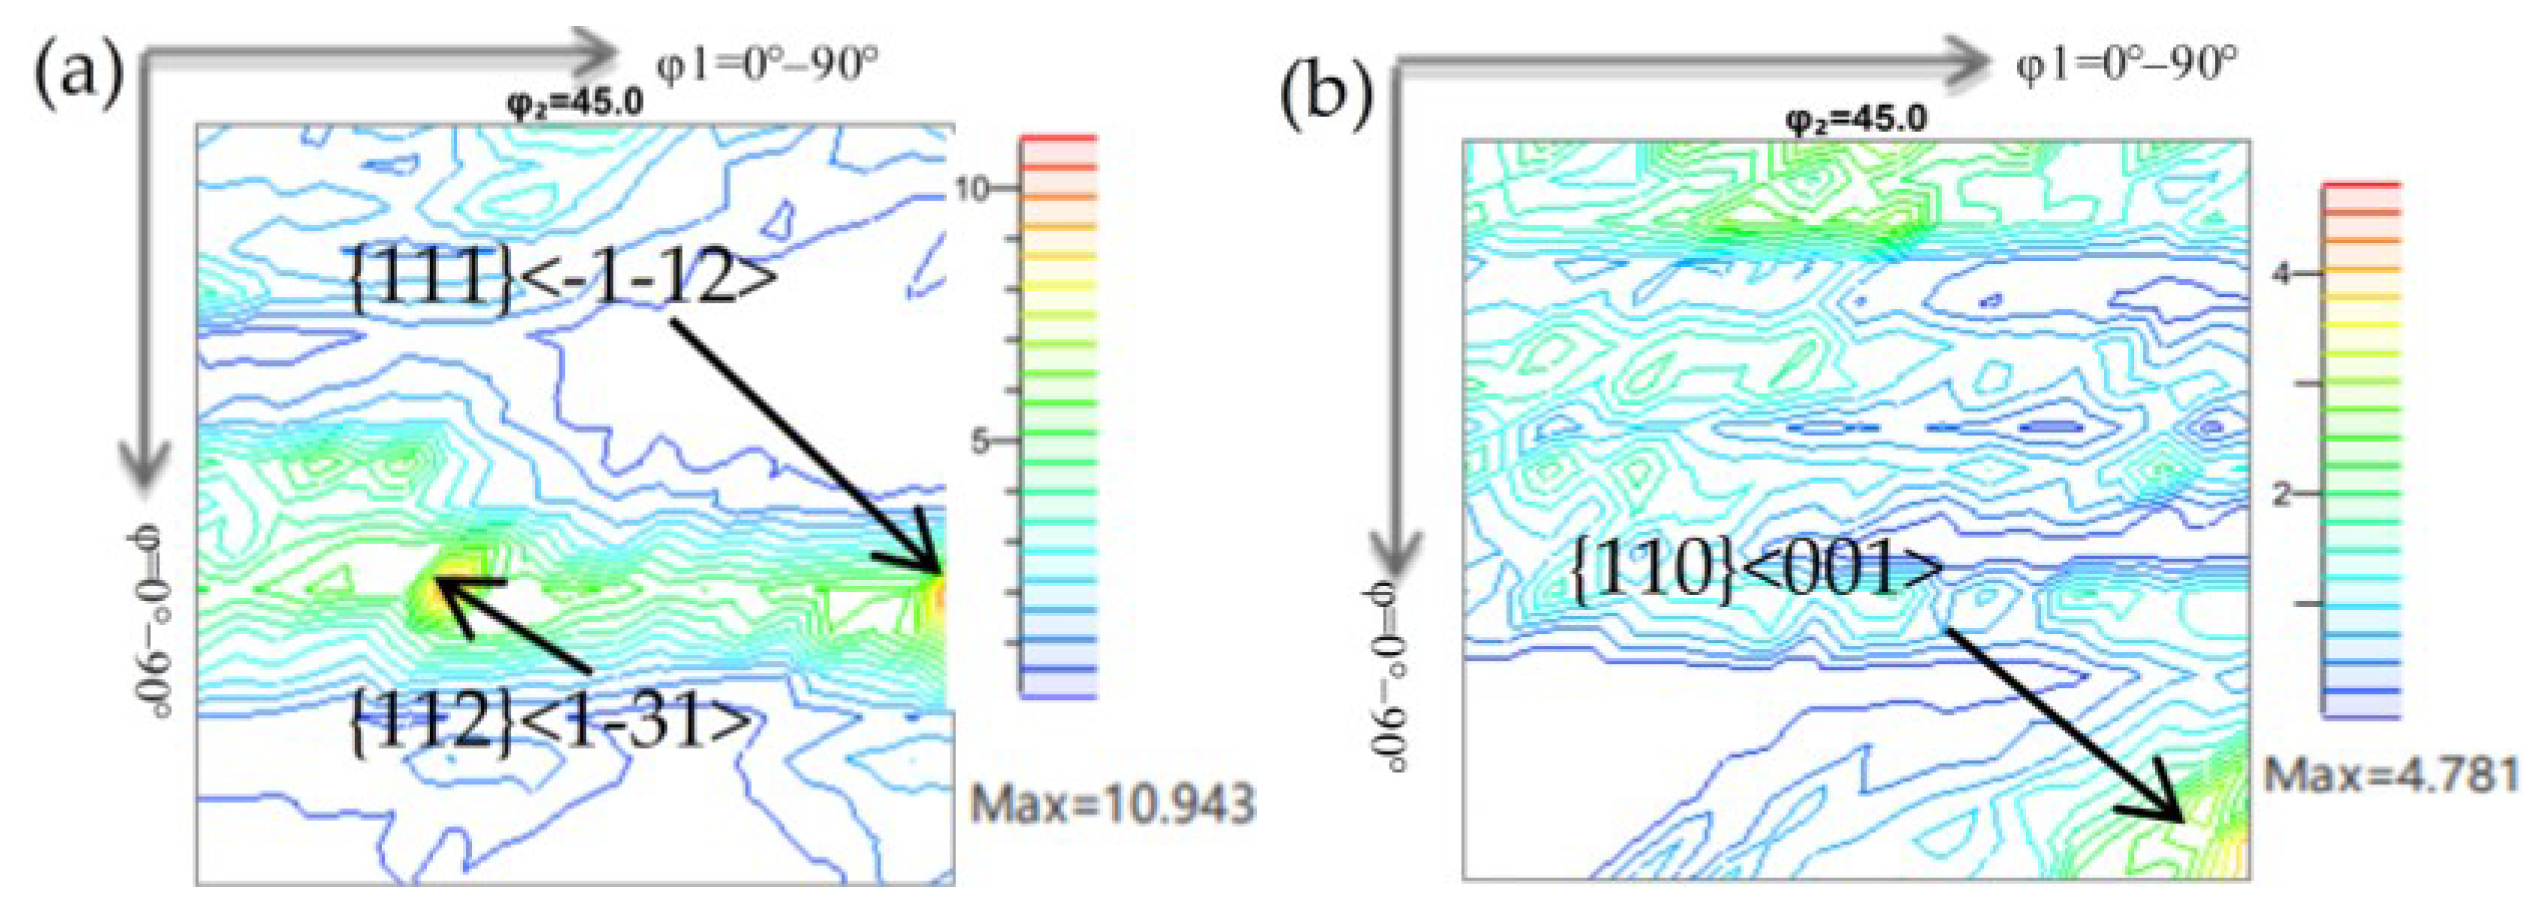
Figure 4.
Macro-texture at φ2 = 45° section of the secondary cold rolled sheet: (a) 59.2%; (b) 65.6%; (c) 70.4%; (d) 72.8%.
Figure 5.
Orientation line of the secondary cold rolled sheet: (a) α orientation line; (b) γ orientation line.
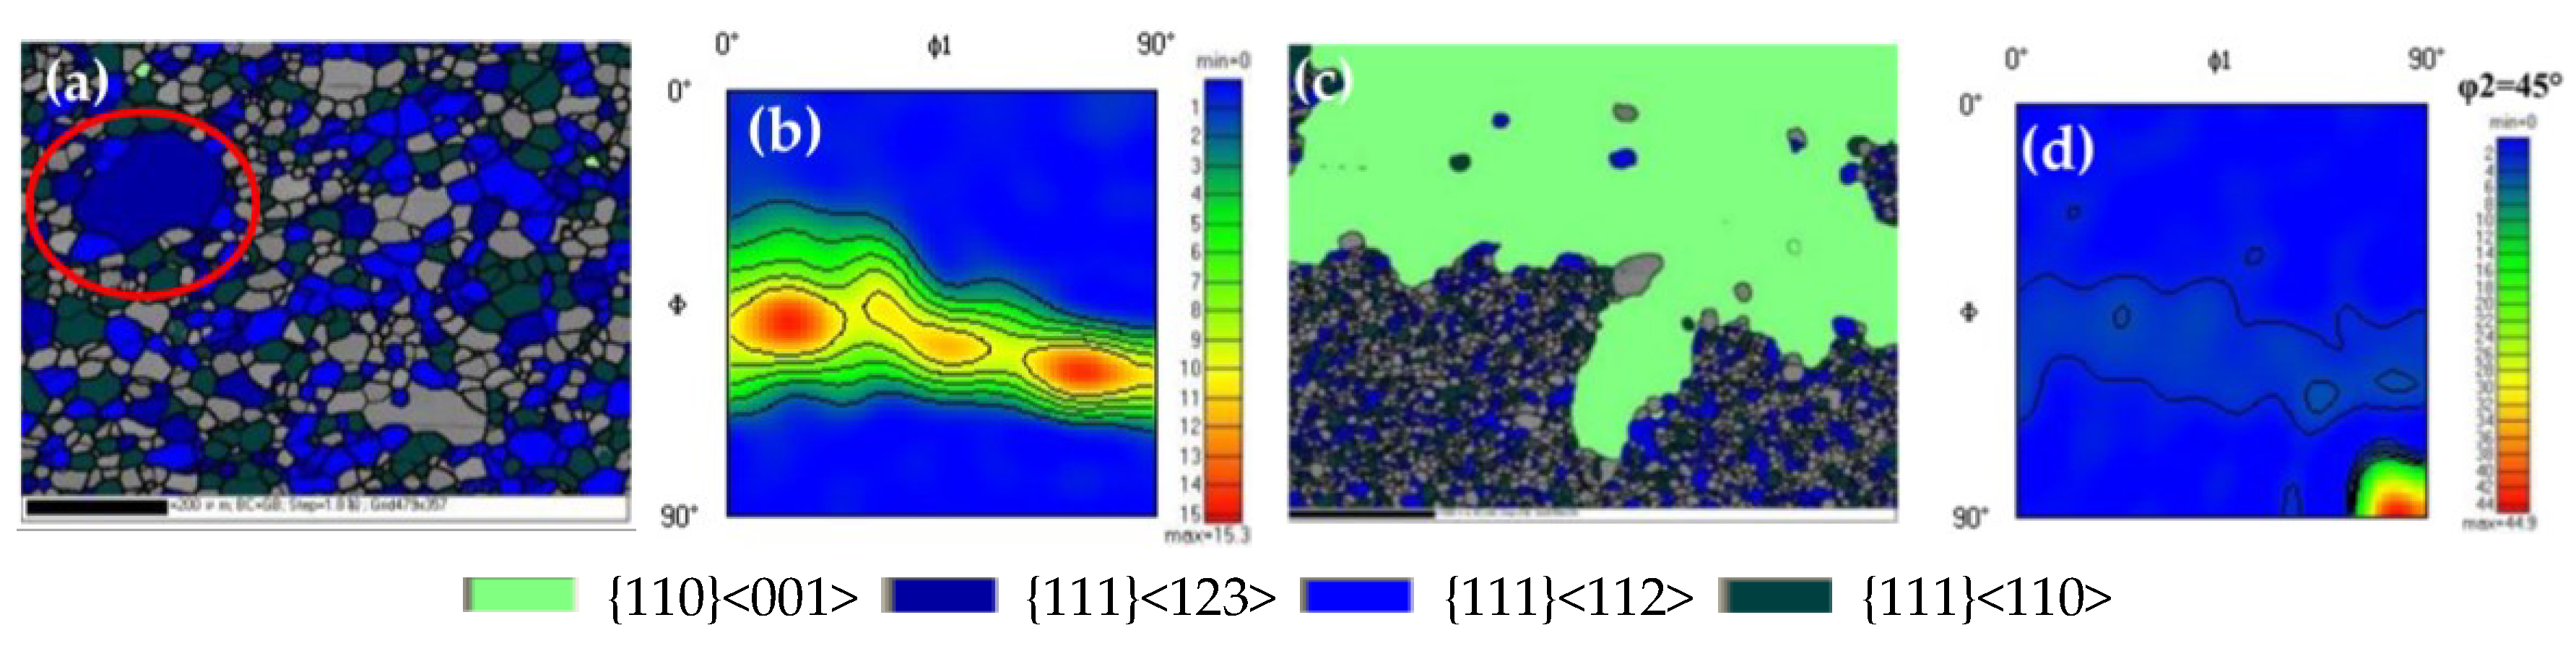
Figure 6.
Orientation and microtexture of samples with reduction rate of 59.2%: (a) 1050 °C orientation map; (b) 1050 °C Orientation Distribution Function (c) 1060 °C orientation map; (d) 1060 °C ODF.
Figure 7.
Orientation and microtexture of samples with reduction rate of 65.6%: (a) 1050 °C orientation map; (b) 1050 °C ODF; (c) 1060 °C orientation map; (d) 1060 °C ODF.
Figure 8.
Orientation and microtexture of samples with reduction rate of 70.4%: (a) 1070 °C orientation map; (b) 1070 °C ODF; (c) 1080 °C orientation map; (d) 1080 °C ODF.
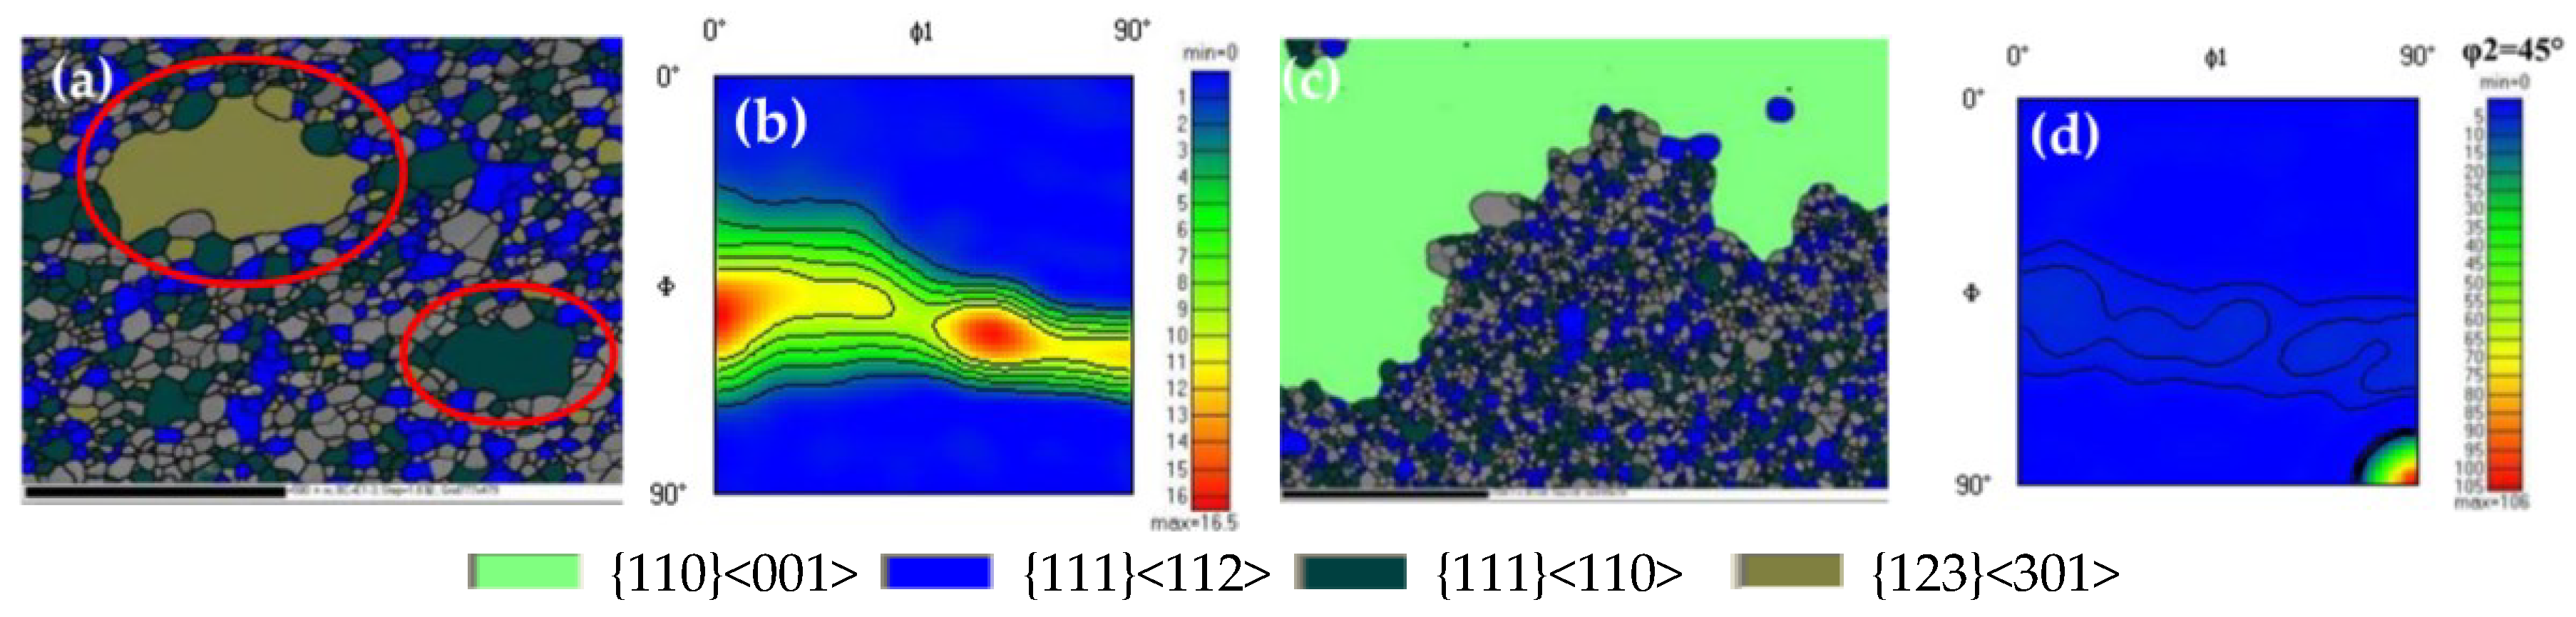
Figure 9.
Orientation and microtexture of samples with reduction rate of 72.8%: (a) 1090 °C orientation map; (b) 1090 °C ODF; (c) 1100 °C orientation map; (d) 1100 °C ODF.
Figure 10.
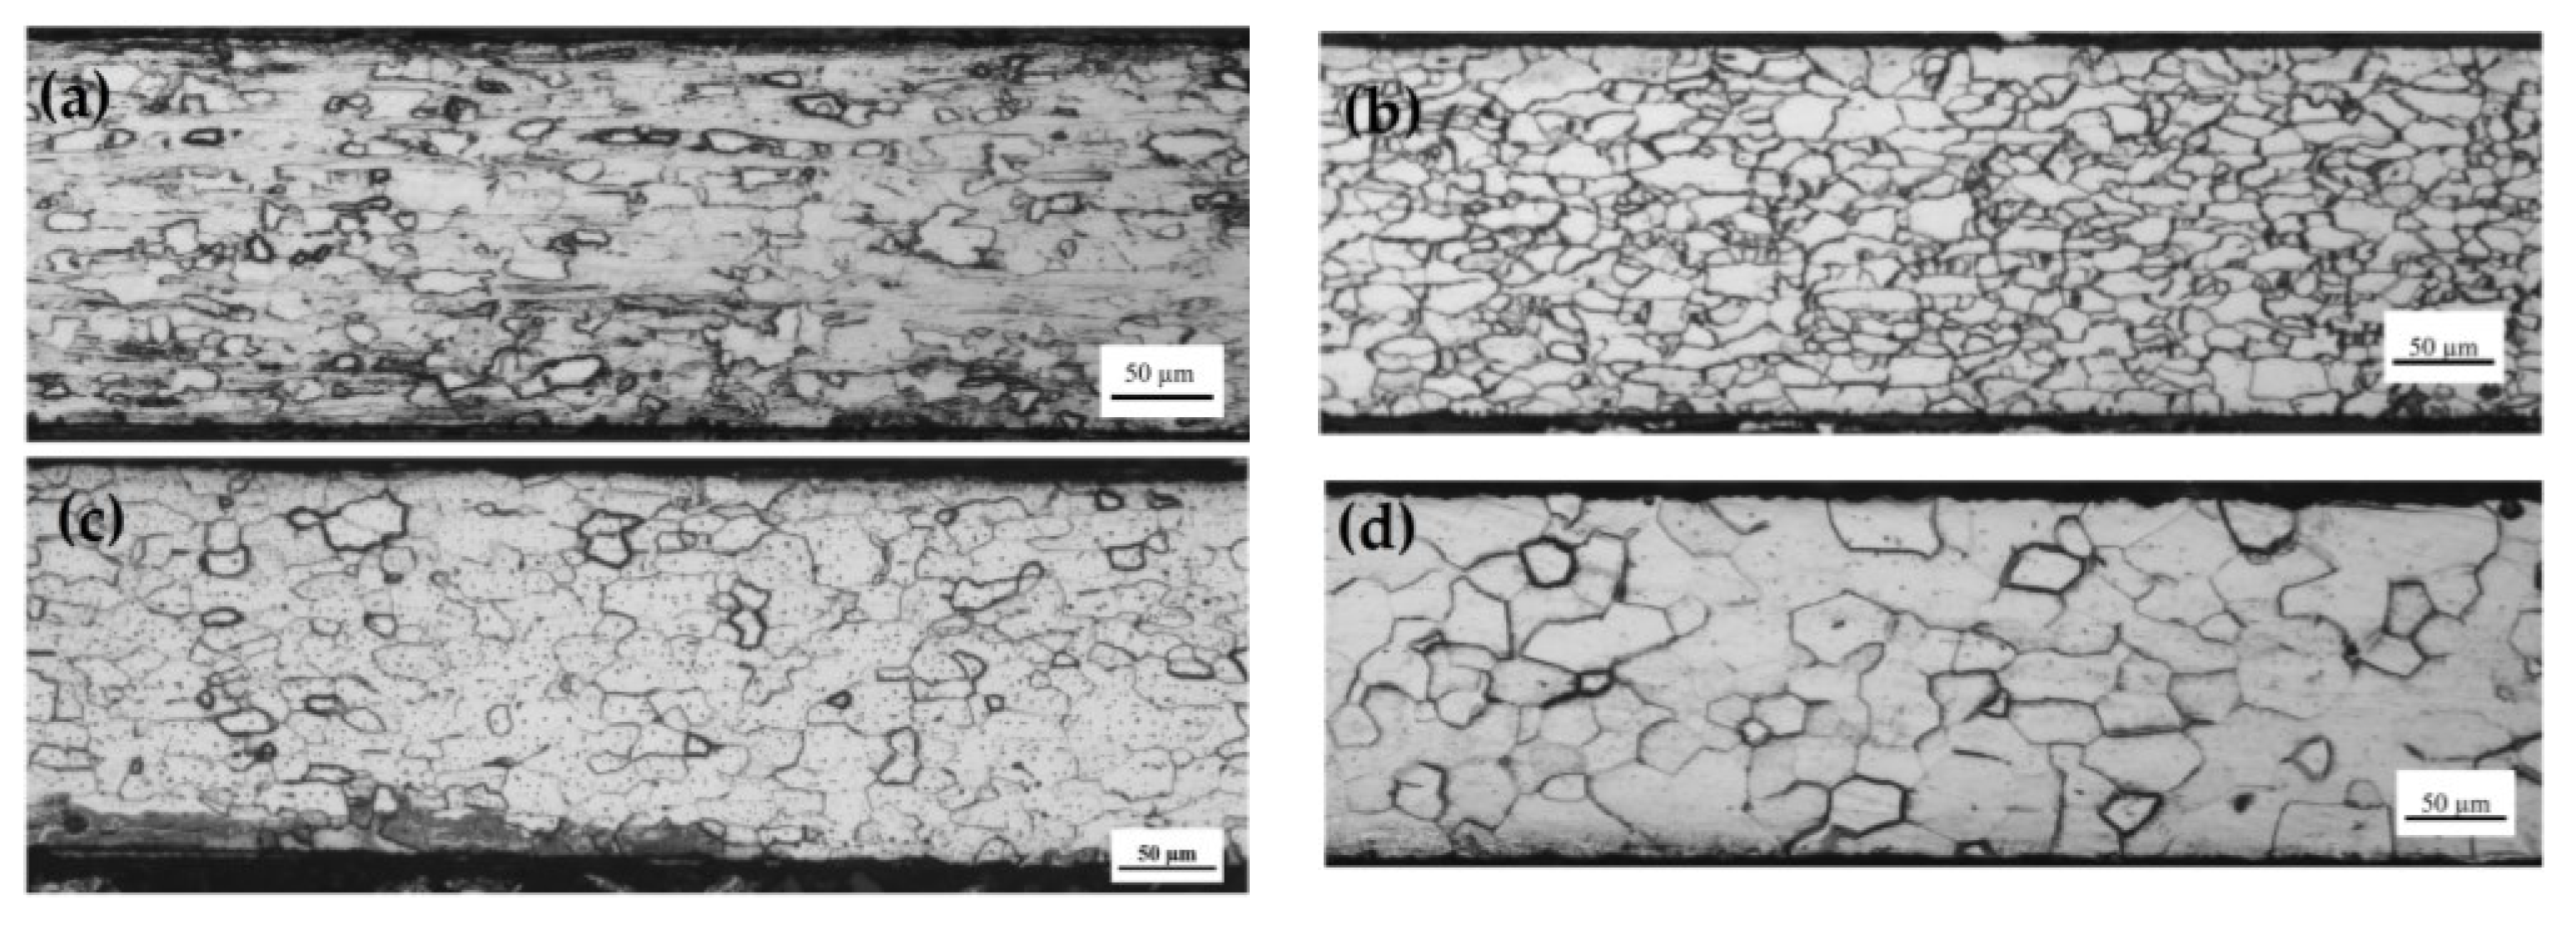
Microstructure of the samples with 59.2% secondary cold rolling reduction rate during the high temperature annealing process: (a) 750 °C; (b) 800 °C; (c) 850 °C; (d) 1020 °C.
Figure 11.
Microstructure of the samples with 65.6% secondary cold rolling reduction rate during the high temperature annealing process: (a) 750 °C; (b) 800 °C; (c) 850 °C; (d) 1020 °C.
Figure 12.
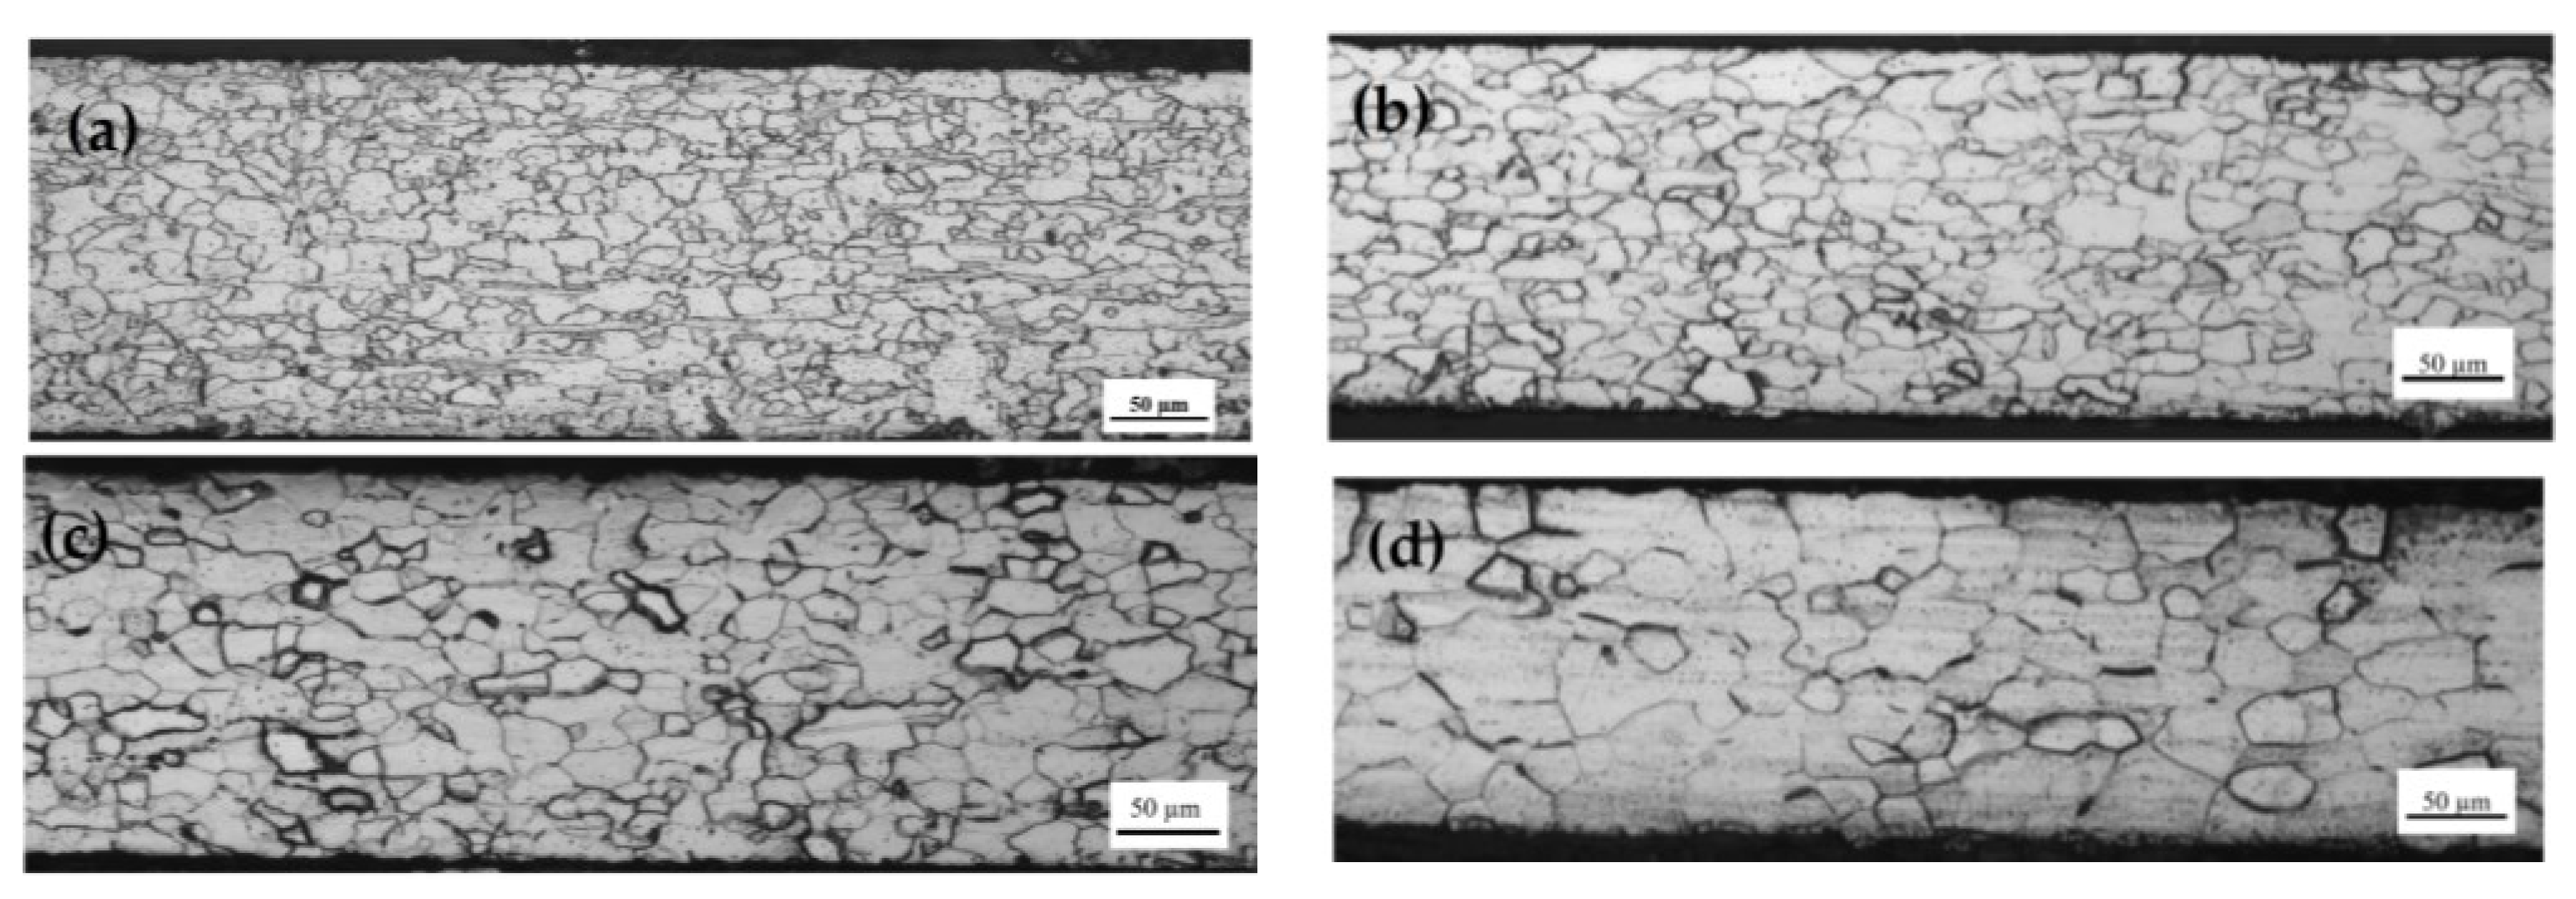
Microstructure of the samples with 70.4% secondary cold rolling reduction rate during the high temperature annealing process: (a) 750 °C; (b) 800 °C; (c) 850 °C; (d) 1020 °C.
Figure 13.
Microstructure of the samples with 72.8% secondary cold rolling reduction rate during the high temperature annealing process: (a) 750 °C; (b) 800 °C; (c) 850 °C; (d) 1020 °C.
Figure 14.
Trend of microstructure and grainsize of samples with different secondary cold rolling reduction rates.
Figure 15.
Average grain size at 850 °C and 1020 °C.
Figure 16.
φ2 = 45° ODF section of samples annealed to 1020 °C after secondary cold rolling reduction rates of: (a) 59.2%; (b) 65.6%; (c) 70.4%; (d) 72.8%.
Figure 17.
Effect of secondary cold rolling reduction rate on the macro-texture φ2 = 45° ODF sections of finished sheets with different cold rolling reduction rates: (a) 59.2%; (b) 65.6%; (c) 70.4%; (d) 72.8%.
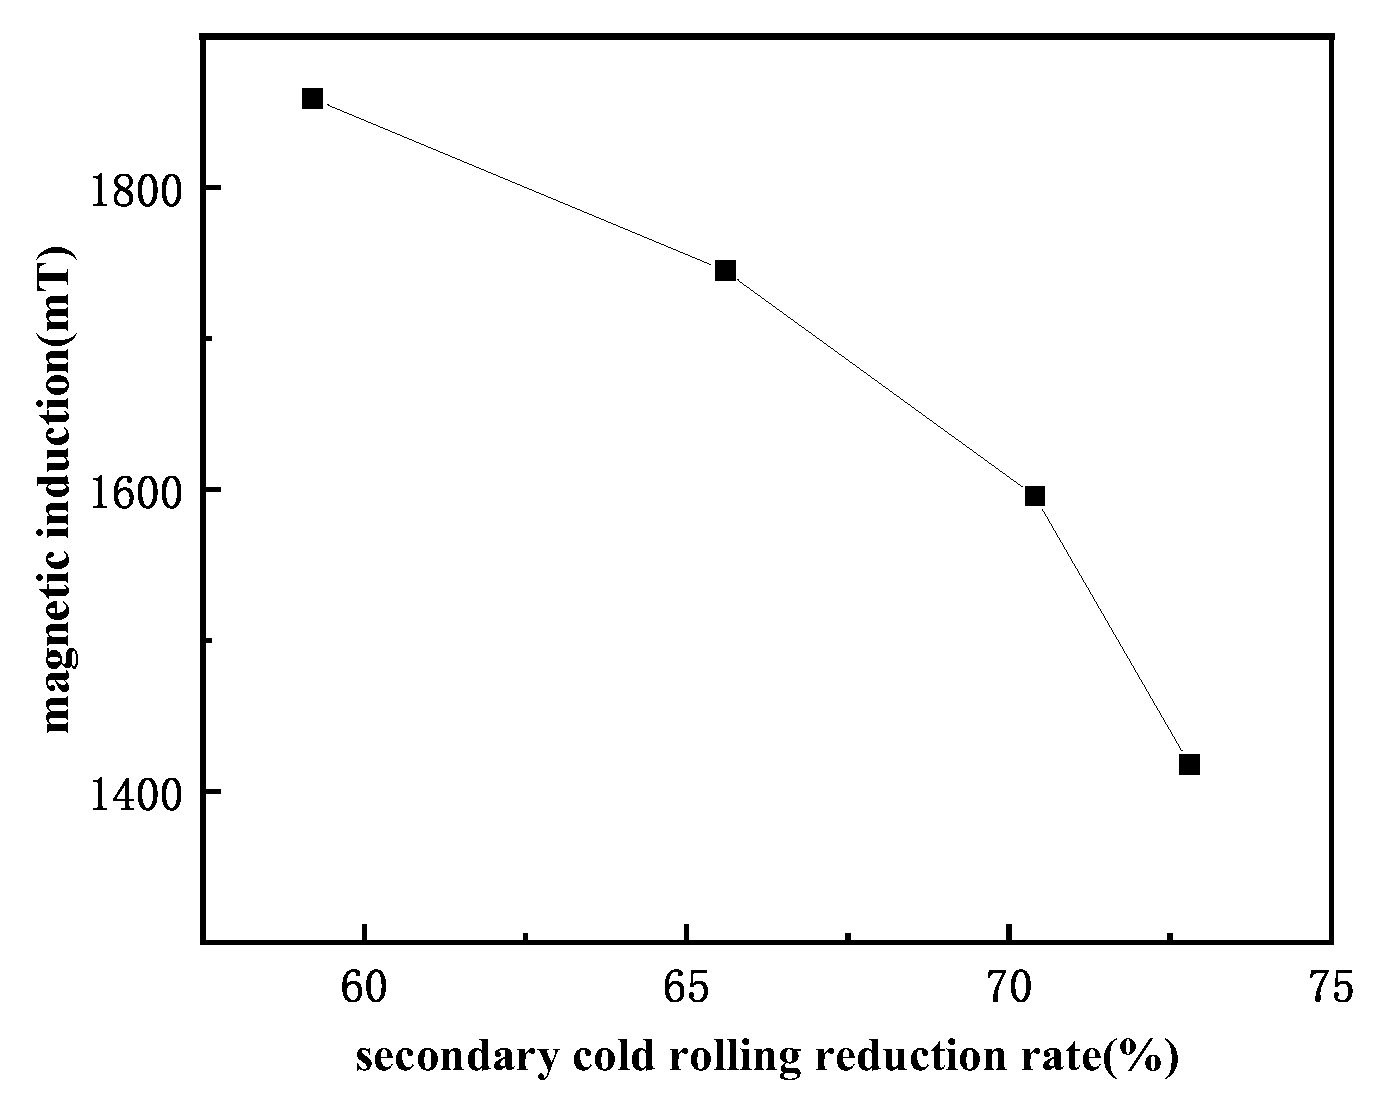
Figure 18.
B8 of samples with different secondary cold rolling reduction rates.
Table 1.
Chemical composition of grain-oriented silicon steel (wt%).
| C | Si | Mn | P | S | Al | Cu | N | Fe |
|---|
| 0.030 | 3.0 | 0.20 | 0.015 | 0.008 | 0.020 | 0.45 | 0.008 | balance |
Table 2.
The secondary cold rolled test.
| Decarburized Annealing Sheet Thickness/mm | Target Thickness/mm | Observed Thickness (Negative Allowance)/mm | Secondary Cold Rolling Reduction Rate/% |
|---|
| 0.625 | 0.27 | 0.255 | 59.2 |
| 0.23 | 0.215 | 65.6 |
| 0.20 | 0.185 | 70.4 |
| 0.18 | 0.170 | 72.8 |
Table 3.
Texture content of {111}<112> and {112}<110> in the secondary cold rolled sheet.
| Reduction Rate/% | 59.2 | 65.6 | 70.4 | 72.8 |
|---|
| {111}<112> content/% | 27.6 | 4.4 | 4.2 | 3.3 |
| {112}<110> content/% | 0.9 | 0.5 | 12.1 | 17.48 |
Table 5.
Secondary recrystallization temperature of samples with different secondary cold rolling reduction rates.
| Reduction Rate/% | Starting Temperature/°C | Finish Temperature/°C |
|---|
| 59.2 | 1050–1060 | 1090 |
| 65.6 | 1050–1060 | 1100 |
| 70.4 | 1070–1080 | 1175 |
| 72.8 | 1090–1100 | 1175 |
Table 6.
Volume fractions of the main texture components in samples with different secondary cold rolling reduction rates and annealed up to 1020 °C.
| Secondary Cold Rolling Reduction Rate/% | Volume Fractions of Texture Components (%) |
|---|
| {112}<110> | {111}<110> | {111}<112> | {114}<481> | {110}<001> |
|---|
| 59.2 | 6.47 | 11.1 | 19.4 | 4.82 | 0.798 |
| 65.6 | 6.4 | 17.2 | 18.4 | 2.5 | 0 |
| 70.4 | 8.18 | 18 | 16.4 | 3.23 | 0.0391 |
| 72.8 | 4.11 | 4.41 | 4.41 | 4.02 | 0 |
Table 7.
Goss Deviation angle of samples with different secondary cold rolling reduction rates (°).
| Secondary Cold Rolling Reduction Rate/% | 59.2 | 65.6 | 70.4 | 72.8 |
|---|
| Goss deviation angle/° | 9.66 | 10.68 | 16.78 | 11.69 |
| Disclaimer/Publisher’s Note: The statements, opinions and data contained in all publications are solely those of the individual author(s) and contributor(s) and not of MDPI and/or the editor(s). MDPI and/or the editor(s) disclaim responsibility for any injury to people or property resulting from any ideas, methods, instructions or products referred to in the content. |
© 2023 by the authors. Licensee MDPI, Basel, Switzerland. This article is an open access article distributed under the terms and conditions of the Creative Commons Attribution (CC BY) license (https://creativecommons.org/licenses/by/4.0/).


