1. Introduction
As the lightest engineering structural material, magnesium alloy has the benefits of low density, high specific strength, and good performance in vibration and noise reduction [
1,
2,
3]. With advancements in associated technologies, magnesium alloys have found extensive applications in aerospace, automotive manufacturing, biomedicine, and various other industries [
4,
5,
6]. However, the mechanical characteristics of magnesium alloys, such as strength, ductility and high-temperature creep, have imposed limitations on their broader potential applications [
7,
8].
In 1994, Luo made a significant discovery by identifying the existence of the long- period stacking order (LPSO) structure while investigating the impact of rare earth elements on the strength of Mg-Zn-Zr alloys [
9]. The fundamental structure of the LPSO phase comprises Mg-RE (rare earth element)-X (transition elements such as Zn, Cu, Ni), wherein varying compositions and subsequent heat treatment processes yield diverse morphologies. The arrangement of internal atoms allocates the LPSO phase into structures denoted as 6H, 10H, 14H, 18R, and 24R, with ‘H’ representing a hexagonal lattice and ‘R’ representing a rhombic lattice [
10,
11]. Notably, the structure of the LPSO phase with the same composition can be altered by heat treatment. For instance, the 18R structure of the LPSO phase will change to a 14H structure after annealing at 773 K [
12,
13,
14,
15]. Further investigations have underscored that the LPSO phase can enhance the mechanical properties of magnesium alloys at room and high temperatures through mechanisms such as fine grain strengthening and dispersion strengthening [
16,
17,
18]. This unique attribute significantly enhances the overall utility and performance of magnesium alloys.
As an impurity element in Mg alloys, trace addition of Ni would accelerate the degradation of anti-corrosion performance. Mg
2Ni stands out as the primary form of nickel found in magnesium alloys. Studies have demonstrated that as the Ni content increases, there is a corresponding rise in corrosion rates alongside improvements in compressive strength and micro-hardness. This phenomenon is primarily attributed to the augmented presence of secondary phases [
19]. Consequently, magnesium alloys incorporating Ni-containing LPSO exhibit accelerated dissolution rates coupled with robust mechanical characteristics, rendering them well-suited for the fabrication of innovative types of fracture-resistant tools.
Ma et al. [
20] prepared Mg-Gd-Ni alloys containing the LPSO phase with various morphologies. They investigated the impact of microstructure changes at various extrusion temperatures on the mechanical and degradation properties of the alloys. Their investigation revealed the pivotal role of the LPSO phase as the primary strengthening agent in the alloy. Notably, both bulk-shaped and lamellar configurations of the LPSO phase demonstrated effective contributions to enhancing the material’s strength. The escalated degradation rate observed in the material was attributed to the collective impact of the bulk shaped LPSO phase, lamellar LPSO phase, and the presence of the eutectic phase. Dai et al. [
21] investigated the influence of diverse forms and structures of the LPSO phase on its relative corrosion performance. Their findings indicated that with an increase in the LPSO phase content within the material, an early establishment of a corrosion barrier occurred during the dissolution process, consequently reducing the corrosion rate. However, after annealing the network structure comprising the LPSO phase underwent a certain degree of decomposition. Concurrently, the bulk reticular LPSO phase, characterized by specific 18R structures, transformed into a lamellar 14H structure, thereby creating additional paths for corrosion propagation. The synergistic effect of these phenomena ultimately led to an escalation in the corrosion rate. This mechanism has also been validated in various other studies [
22]. The delaminated bulk shaped LPSO phase tends to lose its inhibitory effect on corrosion propagation. As the content of the LPSO phase increases, there is a corresponding rise in the proportion of cathode within the electrochemical system, consequently accelerating the overall corrosion process.
Although there have been several studies on the effect of the LPSO phase on the cor-rosion behavior of magnesium alloys, little research has focused on the comparison of different processes (casting, hot working and machining) on the microstructure and cor-rosion behavior of magnesium alloy, thus clarifying the influence of the LPSO phase on the dissolution mechanism of Mg alloy. This study aims to elucidate the influence of the LPSO phase on the dissolution mechanism of Mg alloy. In this paper, Mg-Gd-Ni alloys containing the LPSO phase were synthesized. An in situ corrosion test, in conjunction with a micro-electrochemical method, was conducted to investigate the entire corrosion pro-cess, enabling a detailed discussion of the corrosion mechanism.
2. Materials and Methods
Mg-5Gd-6Ni-1Y (wt.%) alloy was prepared by the casting method using pure Mg, Ni, Mg-Gd and Mg-Y master alloys as raw materials. These materials were melted at 750 °C under the protection of a CO
2 and SF
6 atmosphere. After melting is completed, the mixture was stirred to ensure uniformity and subsequently held at 720 °C for 20 min. Upon reaching a homogeneous liquid state, the melt was cast into a pre-heated (200 °C) steel mold with an inner diameter of 100 mm upon cooling to 700 °C. An inductively coupled plasma atomic emission spectrometer (ICP-AES, Shimadzu ICPE-9810, Shimadzu, Colombia, MD, USA) was used to determine the precise chemical compositions shown in
Table 1. The as-cast alloy material was named 561. Subsequently, two distinct alloys were derived from the ‘561’ as-cast alloy. The first underwent annealing at 500 °C for 10 h, forming the as-annealed alloy (A561). Meanwhile, the second underwent extrusion processing at a ratio of 10 and a speed of 5 mm/s, leading to the creation of the as-extruded alloy (E561).
Microstructural characterization was conducted using a Metallographic microscope (OLYMPUS, BX53M, Olympus IMS, Tokyo, Japan), Scanning Electron Microscope (SEM, ZEISS MERLIN COMPACT, UFZ, Leipzig, Germany) equipped with Energy Dispersive Spectroscopy (EDS, Oxford instruments, Abingdon, UK), and Transmission Electron Microscopy (TEM, FEI Talos F200X, Thermo Fisher Scientific, Waltham, MA, USA). Specimens intended for TEM analysis were initially sliced to a thickness of 0.5 mm and subsequently ground down to 200 μm. These slices were then punched to 3 mm in diameter and thinned further using ion polishing techniques (Gatan 691, Gatan, Pleasanton, CA, USA). In order to ascertain the phase compositions of the alloy, XRD equipment (Rigaku SmartLab, Rigaku Corporation, Tokyo, Japan) was used at 45 kV and 200 mA. The scanning step was 2°/min in the range (e.g., 2θ angle) from 20° to 80°.
The corrosion properties of the experimental materials were investigated by immer-sion and electrochemical experiments. Immersion experiments involved subjecting sam-ples sized 20 × 20 × 20 mm to a 3.5 wt.% NaCl solution, whose dissolution rates were meticulously examined at various temperatures, including room temperature, 50 °C, and 70 °C. These experiments provided crucial insights into the material’s response to corro-sive environments across different thermal conditions. Electrochemical experiments were conducted in 3.5 wt.% NaCl solution at room temperature utilizing an electrochemical workstation (GAMRY, Reference 600+, Warminster, PA, USA). A meticulously calibrated standard three-electrode system was established, with a saturated calomel electrode (SCE) as the reference electrode. Open circle potential test (OCP) was carried out for 1800 s., Potentiodynamic polarization was carried out at a scan rate of 1 mV·s
−1, at a potential range of −300 mV to +700 mV relative to the OCP. Icorr is calculated according to the fol-lowing formula. These meticulous electrochemical analyses provided comprehensive in-sights into the material’s corrosion behavior and electrochemical response under con-trolled conditions, facilitating a nuanced understanding of its performance in corrosive environments.
An in situ approach was employed to comprehensively study the entire corrosion process of the experimental materials. In order to enhance the observation of the corrosion process, a 0.001% NaCl solution was selected to deliberately decelerate the corrosion rate. The entire sample was fully immersed in the solution to isolate the influence of the liquid film on the corrosion process. The localized volta potential distribution of the sample was scanned and analyzed by the atomic force microscope with a Kelvin probe (AFM-KPFM, Bruker Dimension Icon), and the scan parameters were meticulously set to a scan height and frequency of 80 nm and 0.4 Hz, respectively.
The corrosion mechanism of the sample was studied by micro-electrochemical characterization with an electrochemical workstation (GAMRY, Reference 600+). After being cleaned with ethanol and deionized water, the photoresist was applied to the surface of the polished sample in a specific array using the photolithographic mask technique. The array pattern consisted of holes with a diameter of 10 μm and a pitch of 500 μm, which acted as a part of the micro-electrochemical cell [
23,
24].
Figure 1 depicts the surface of the treated sample. Since the previous results showed that the experimental material has a high rate of corrosion in NaCl solution, the micro-electrochemical test was adjusted to use a Na
2SO
4 solution with a concentration of 0.001 mol/L and a silver chloride electrode was utilized. The potentiodynamic polarization was performed over a potential range of −250 mV to +250 mV relative to the OCP at a scan rate of 1 mV·s
−1.
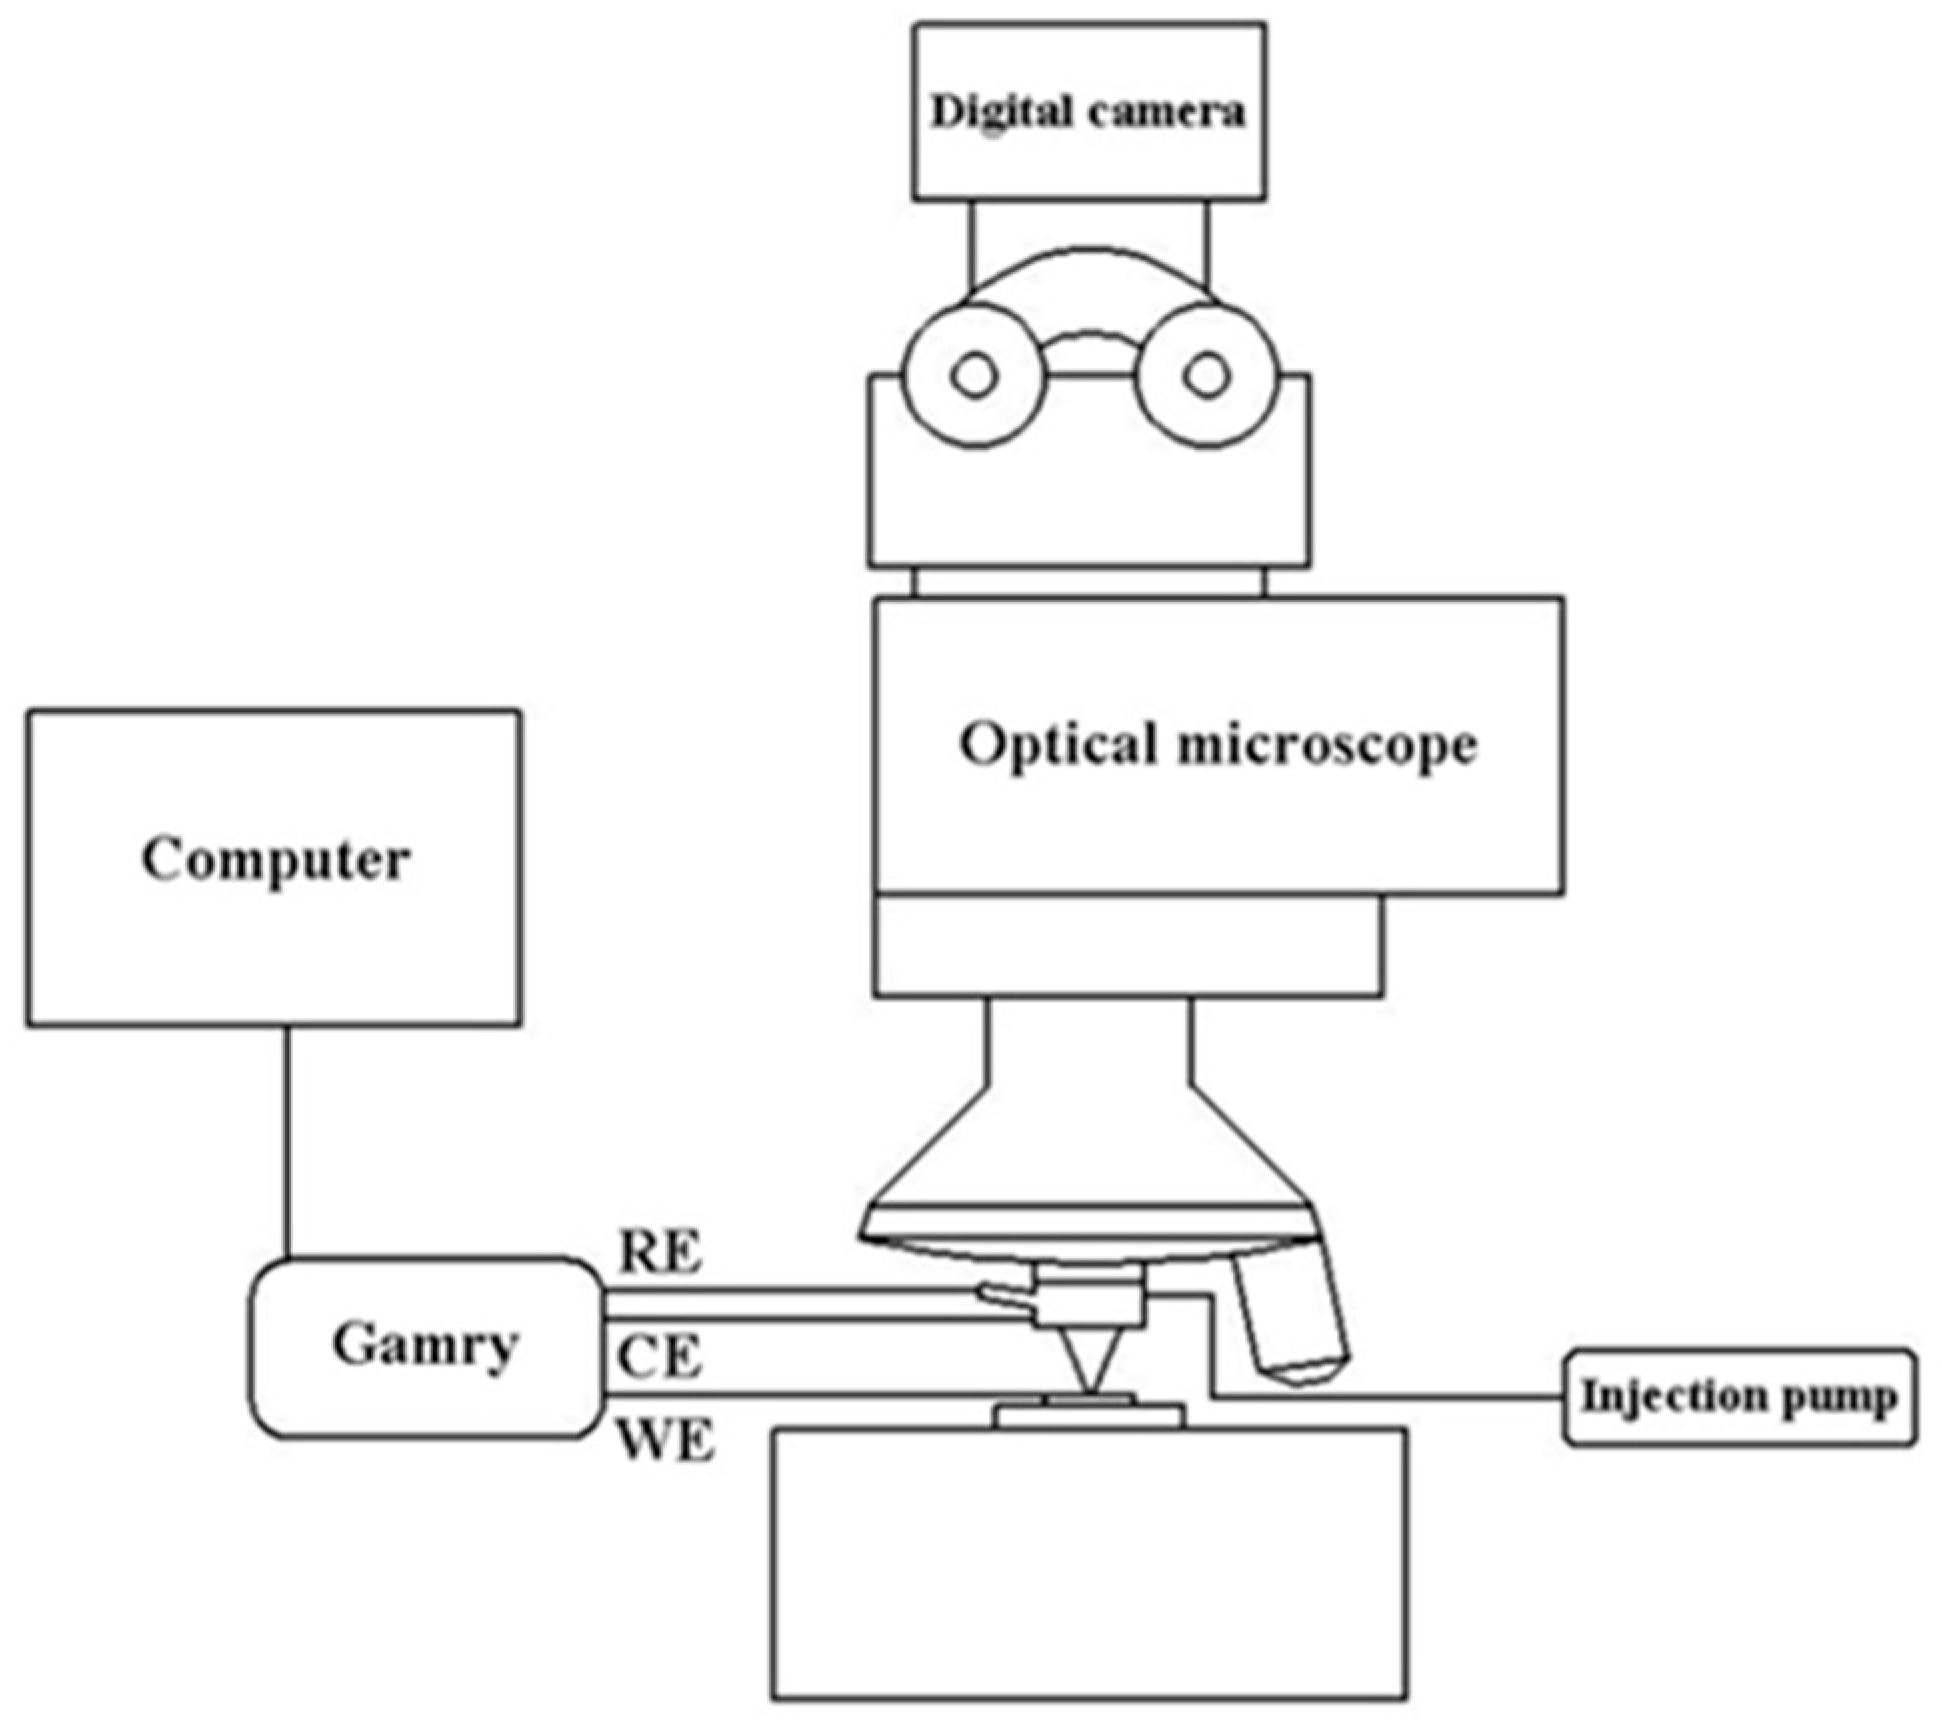
The automated test platform for high throughput microelectrochemical characteriza-tion of metallic materials was developed by Lai [
25], and its schematic diagram is shown in
Figure 2. First, control the setup by choosing an interesting area with a microscope and an XYZ stage, then inject the desired volume of electrolyte by syringe pump before the working electrode (WE) surface approaches contact with the capillary tip, followed by setting the parameters to start electrochemical tests. Ag-AgCl and Pt electrodes were used as the reference (RE) and counter electrodes (CE), respectively.
Author Contributions
Conceptualization, L.W. and X.R.; investigation, J.Z. and Y.L.; data analysis, J.Z.; literature search, M.L.; data curation, M.L.; validation, M.L.; supervision, Y.L and X.R.; project administration, Y.A., L.W. and X.R.; methodology, L.W.; writing—original draft preparation, writing—review and editing, L.W. and X.R.; resources, W.Z. All authors have read and agreed to the published version of the manuscript.
Funding
This work was supported by National Key Research and Development Program of China (2021YFA1601103) and National Natural Science Foundation of China (U21B2053).
Data Availability Statement
Data is available on reasonable request.
Conflicts of Interest
Author Mingxing Li was employed by the company Oil and Gas Technology Research Institute of Changqing Oilfield Branch of CNPC. The remaining authors declare that the research was conducted in the absence of any commercial or financial relationships that could be construed as a potential conflict of interest.
References
- Joost, W.J.; Krajewski, P.E. Towards magnesium alloys for high-volume automotive applications. J. Scr. Mater. 2017, 128, 107–112. [Google Scholar] [CrossRef]
- Wang, C.J.; Kang, J.W.; Deng, K.K.; Nie, K.B.; Li, W.G. Microstructure and mechanical properties of Mg-4Zn-xGd (x=0, 0.5, 1, 2) alloys. J. Magnes. Alloys 2020, 8, 441–451. [Google Scholar] [CrossRef]
- Pollock, T.M. Materials science. Weight loss with magnesium alloys. J. Sci. 2010, 328, 986–987. [Google Scholar]
- Sezer, N.; Evis, Z.; Kayhan, S.M.; Tahmasebifar, A.; Koc, M. Review of magnesium-based biomaterials and their applications. J. Magnes. Alloys 2018, 6, 23–43. [Google Scholar] [CrossRef]
- Song, J.F.; She, J.; Chen, D.L.; Pan, F.S. Latest research advances on magnesium and magnesium alloys worldwide. J. Magnes. Alloys 2020, 8, 1–41. [Google Scholar] [CrossRef]
- Jafari, S.; Raman, R.K.S.; Davies, C.H.J. Corrosion fatigue of a magnesium alloy in modified simulated body fluid. J. Eng. Fract. Mech. 2015, 137, 2–11. [Google Scholar] [CrossRef]
- Su, C.; Wang, J.F.; Hu, H.; Wen, Y.L.; Liu, S.J.; Ma, K. Enhanced strength and corrosion resistant of Mg-Gd-Y-Al alloys by LPSO phases with different Al content. J. Alloys Compd. 2021, 885, 160557. [Google Scholar] [CrossRef]
- Zhang, M.Q.; Feng, Y.; Zhang, J.H.; Liu, S.J.; Yang, Q.; Liu, Z.; Li, R.G.; Meng, J.; Wu, R.Z. Development of extruded Mg-6Er-3Y-1.5Zn-0.4Mn (wt.%) alloy with high strength at elevated temperature. J. Mater. Sci. Technol. 2019, 35, 2365–2374. [Google Scholar] [CrossRef]
- Luo, Z.P.; Song, D.Y.; Zhang, S.Q. Strengthening effects of rare earths on wrought Mg-Zn-Zr-RE alloys. J. Alloys Compd. 1995, 230, 109–114. [Google Scholar] [CrossRef]
- Kishida, K.; Nagai, K.; Matsumoto, A.; Inui, H. Data in support of crystal structures of highly-ordered long-period stacking-ordered phases with 18R, 14H and 10H-type stacking sequences in the Mg–Zn–Y system. J. Data in Brief. 2015, 5, 314–320. [Google Scholar] [CrossRef]
- Song, W.J.; Dong, H.P.; Zhang, G.; Liu, J.; Yang, G.; Liu, Y.H.; Li, Y.Z.; Li, J.S.; Shen, J.H.; Chen, Y.X.; et al. Enhanced hydrogen absorption kinetics by introducing fine eutectic and long-period stacking ordered structure in ternary eutectic Mg–Ni–Y alloy. J. Alloys Compd. 2020, 820, 153187. [Google Scholar] [CrossRef]
- Itoi, T.; Seimiya, T.; Kawamura, Y.; Hirohashi, M. Long period stacking structures observed in Mg97Zn1Y2 alloy. J. Scr. Mater. 2004, 51, 107–111. [Google Scholar] [CrossRef]
- Kawamura, Y.; Kasahara, T.; Izumi, S.; Yamasaki, M. Elevated temperature Mg97Y2Cu1 alloy with long period ordered structure. J. Scr. Mater. 2006, 55, 453–456. [Google Scholar] [CrossRef]
- Yamasaki, M.; Anan, T.; Yoshimoto, S.; Kawamura, Y. Mechanical properties of warm-extruded Mg–Zn–Gd alloy with coherent 14H long periodic stacking ordered structure precipitate. J. Scr. Mater. 2005, 53, 799–803. [Google Scholar] [CrossRef]
- Wang, L.S.; Jiang, J.H.; Liu, H.; Saleh, B.; Ma, A.B. Microstructure characterization and corrosion behavior of Mg–Y–Zn alloys with different long period stacking ordered structures. J. Magnes. Alloys 2020, 8, 1208–1220. [Google Scholar] [CrossRef]
- Wang, D.D.; Zhang, W.B.; Zong, X.M.; Nie, K.B.; Xu, C.X.; Zhang, J.S. Abundant long period stacking ordered structure induced by Ni addition into Mg–Gd–Zn alloy. J. Mater. Sci. Eng. A 2014, 618, 355–358. [Google Scholar] [CrossRef]
- Liu, H.; Xue, F.; Bai, J.; Zhou, J.; Liu, X.D. Effect of substitution of 1 at% Ni for Zn on the microstructure and mechanical properties of Mg94Y4Zn2 alloy. J. Mater. Sci. Eng. A 2013, 585, 387–395. [Google Scholar] [CrossRef]
- Garces, G.; Perez, P.; Cabeza, S.; Lin, H.K.; Kim, S.; Gan, W.; Adeva, P. Reverse tension/compression asymmetry of a Mg–Y–Zn alloys containing LPSO phases. J. Mater. Sci. Eng. A 2015, 647, 287–293. [Google Scholar] [CrossRef]
- Niu, H.Y.; Deng, K.K.; Nie, K.B.; Cao, F.F.; Zhang, X.C.; Li, W.G. Microstructure, mechanical properties and corrosion properties of Mg-4Zn-xNi alloys for degradable fracturing ball applications. J. Alloys Compd. 2019, 787, 1290–1300. [Google Scholar] [CrossRef]
- Ma, K.; Wang, J.F.; Peng, Y.H.; Dai, C.H.; Pan, Y.L.; Wang, Y.; Wang, D.Q.; Wang, J.X.; Ma, Y.L.; Pan, F.S. Achieving high strength and rapid degradation in Mg-Gd-Ni alloys by regulating LPSO phase morphology combined with extrusion. J. Magnes. Alloys 2022, in press. [CrossRef]
- Dai, C.N.; Wang, J.F.; Pan, Y.L.; Ma, K.; Peng, Y.H.; Ren, J.; Wang, Y.; Wang, D.Q.; Wang, J.X.; Ma, Y.L. Tailoring the microstructural characteristic and improving the corrosion rate of Mg-Gd-Ni alloy by heat treatment with different volume fraction of LPSO phase. J. Corros. Sci. 2023, 210, 110806. [Google Scholar] [CrossRef]
- Ma, K.; Wang, J.F.; Peng, Y.H.; Dai, C.N.; Pan, Y.L.; Wang, D.Q.; Wang, Y.; Pei, S.L.; Ma, Y.L. Enhanced degradation properties of Mg-Gd-Ni alloys by regulating LPSO morphology. J. Phys. Chem. Solids 2022, 171, 110974. [Google Scholar] [CrossRef]
- Jin, Y.; Lai, Z.G.; Bi, P.; Yan, S.T.; Wen, L.; Wang, Y.C.; Pan, J.S.; Leygraf, C. Combining lithography and capillary techniques for local electrochemical property measurements. J. Electrochem. Commun. 2018, 87, 53–57. [Google Scholar] [CrossRef]
- Lai, Z.G.; Bi, P.; Wen, L.; Xue, Y.P.; Jin, Y. Local electrochemical properties of fusion boundary region in SA508-309L/308L overlay welded joint. J. Corros. Sci. 2019, 155, 75–85. [Google Scholar] [CrossRef]
- Lai, Z.G.; Zou, Y.; Zhao, Z.Y.; Huang, F.F.; Liu, P.; Lai, T.X.; Jin, Y. An Automated Test Platform for High-Throughput Micro-Electrochemical Characterization of Metallic Materials and Its Application on a Fe–Cr–Ni Combinatorial Materials Chip. J. Electrochem. Soc. 2021, 168, 091501. [Google Scholar] [CrossRef]
- Hao, L.Y.; Yang, X.; Lv, S.L.; Fang, X.G.; Wu, S.S. Influence of squeeze casting pressure and heat treatment on microstructure and mechanical properties of Mg94Ni2Y4 alloy with LPSO structure. J. Mater. Sci. Eng. A 2017, 707, 280–286. [Google Scholar] [CrossRef]
- Jiang, M.; Zhang, S.; Bi, Y.D.; Li, H.X.; Ren, Y.P.; Qin, G.W. Phase equilibria of the long-period stacking ordered phase in the Mg–Ni–Y system. J. Intermetallics. 2015, 57, 127–132. [Google Scholar] [CrossRef]
- Ma, K.; Wang, J.F.; Ren, J.; Dai, C.N.; Liu, S.J.; Peng, Y.H.; Pan, Y.L. Enhanced degradation properties of Mg-Y-Ni alloys by tailoring the LPSO morphology for fracturing tools applications. J. Mater. Charact. 2021, 181, 111489. [Google Scholar] [CrossRef]
Figure 1.
Optical morphology of the treated sample.
Figure 2.
The schematic diagram of the automated test platform for Micro Electrochemical characterization of metallic materials.
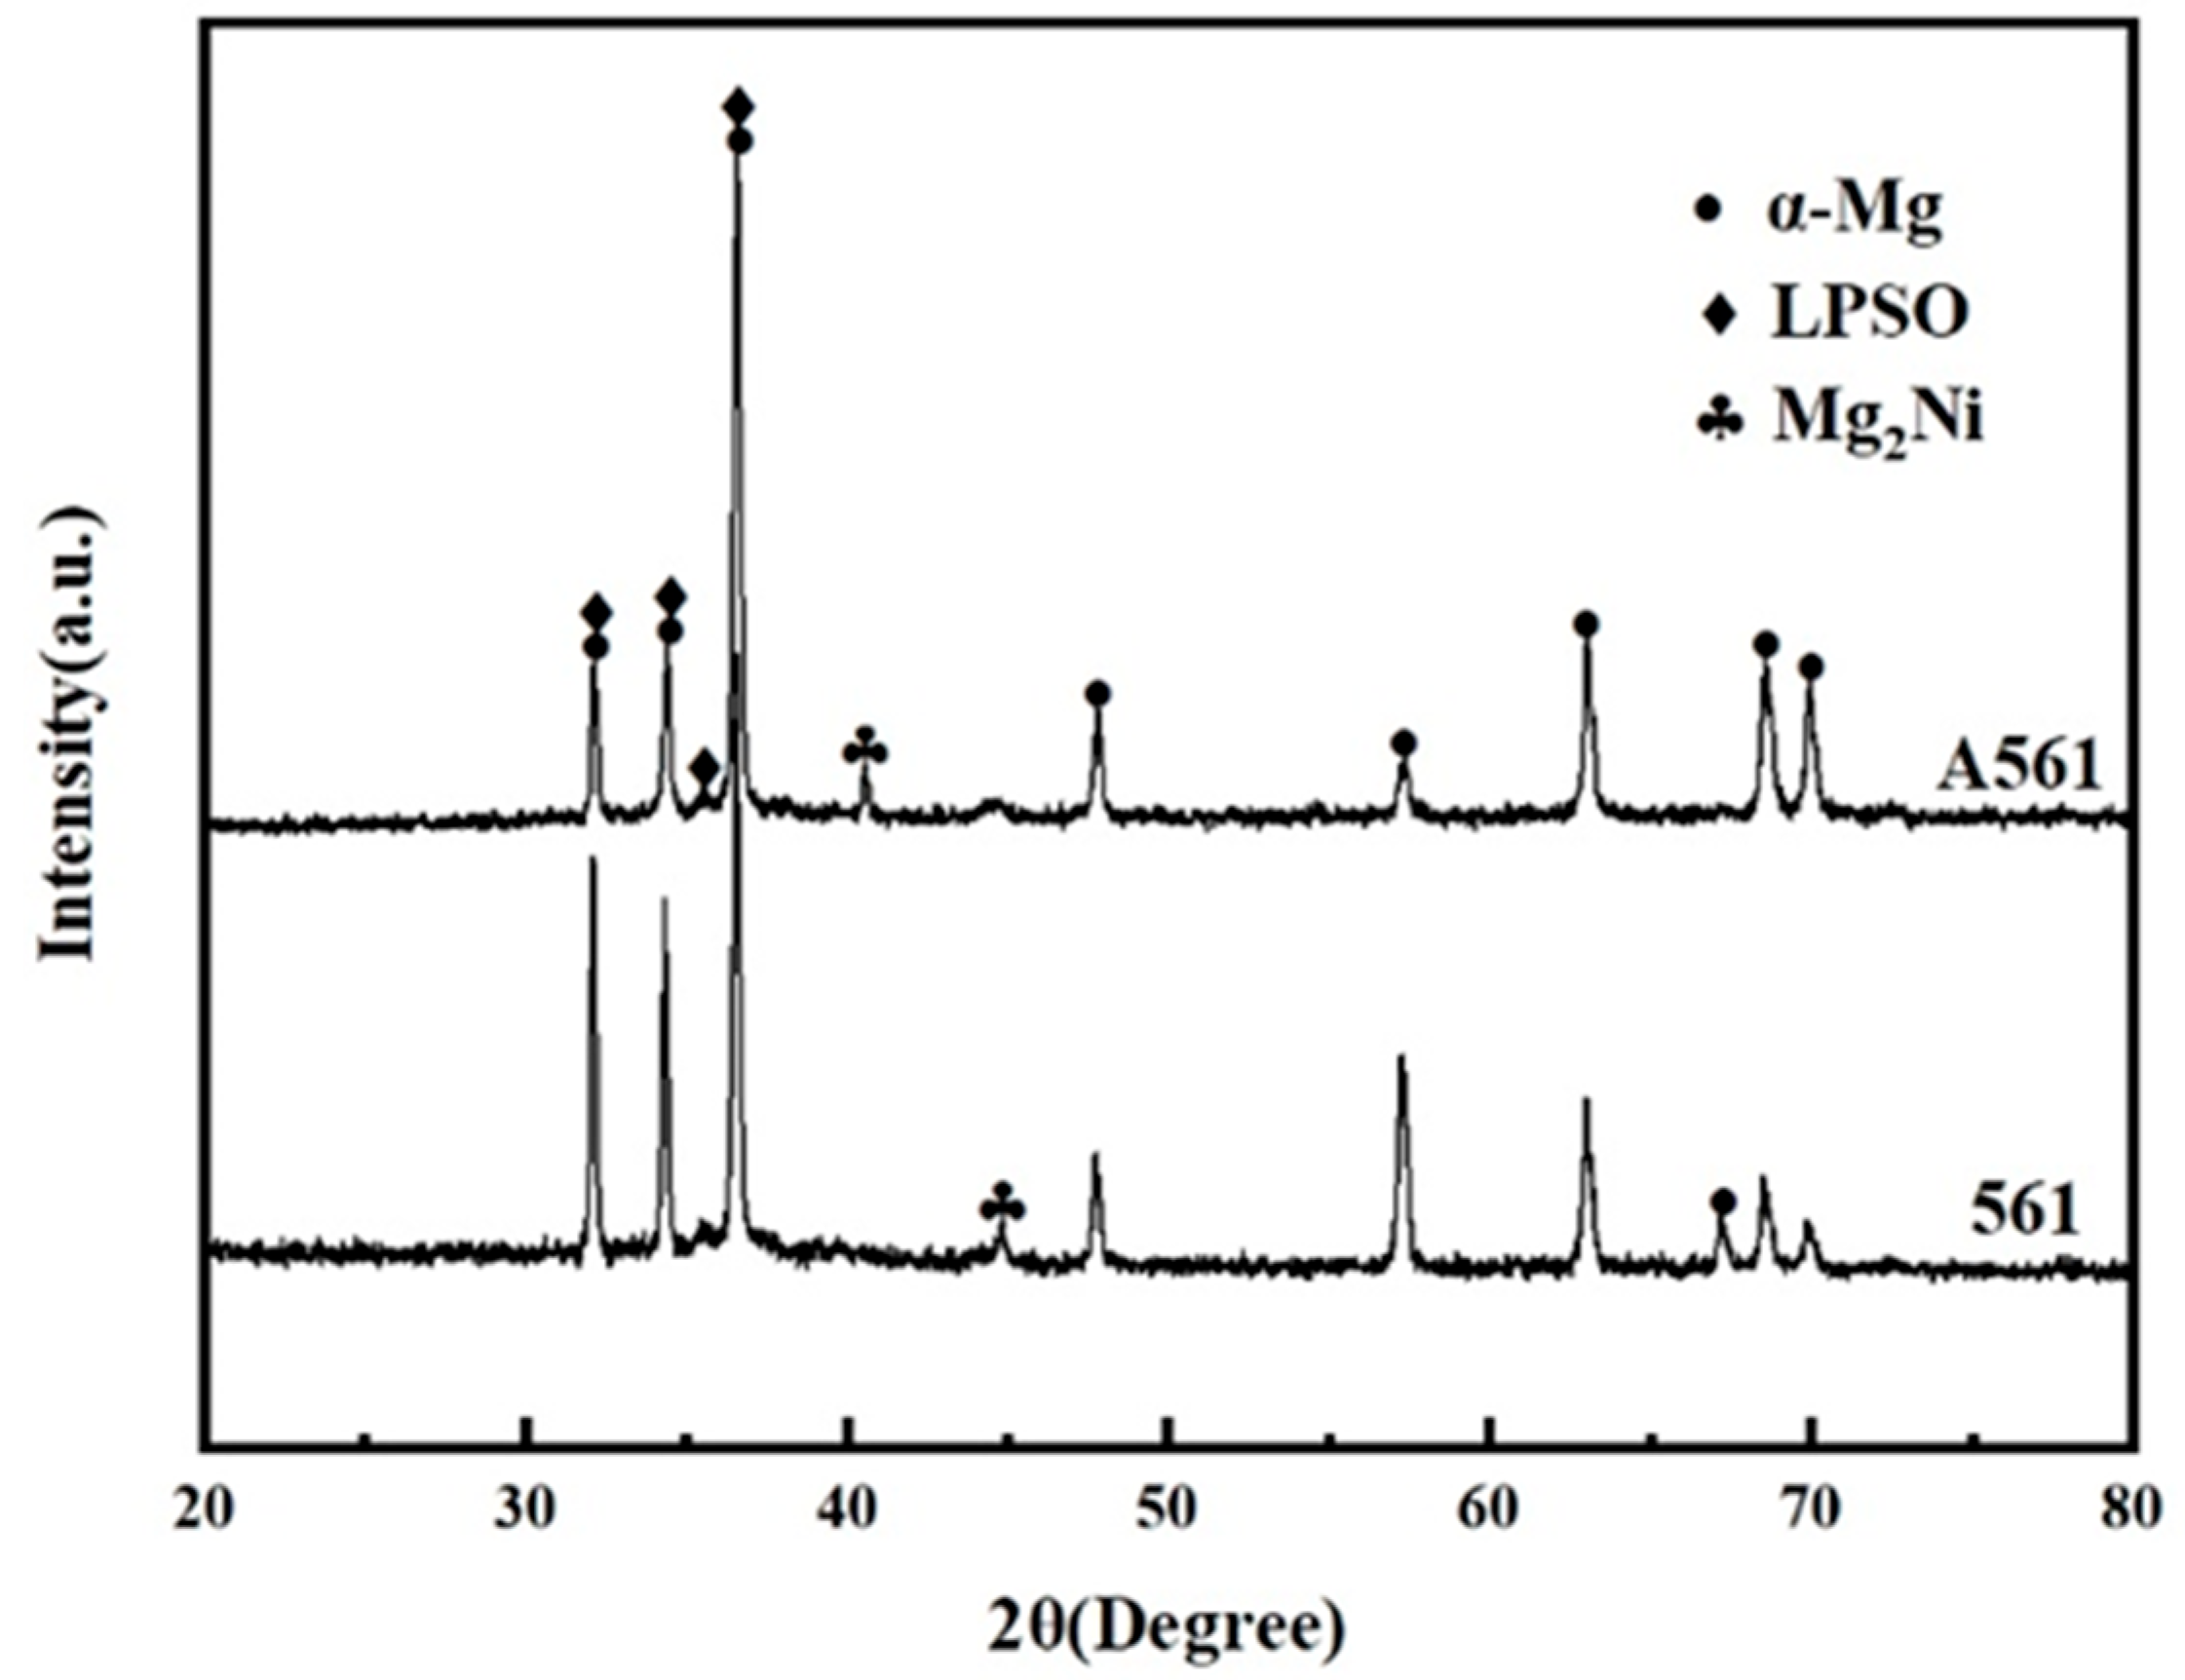
Figure 3.
XRD pattern of Mg-6Gd-7Ni-1Y alloys.
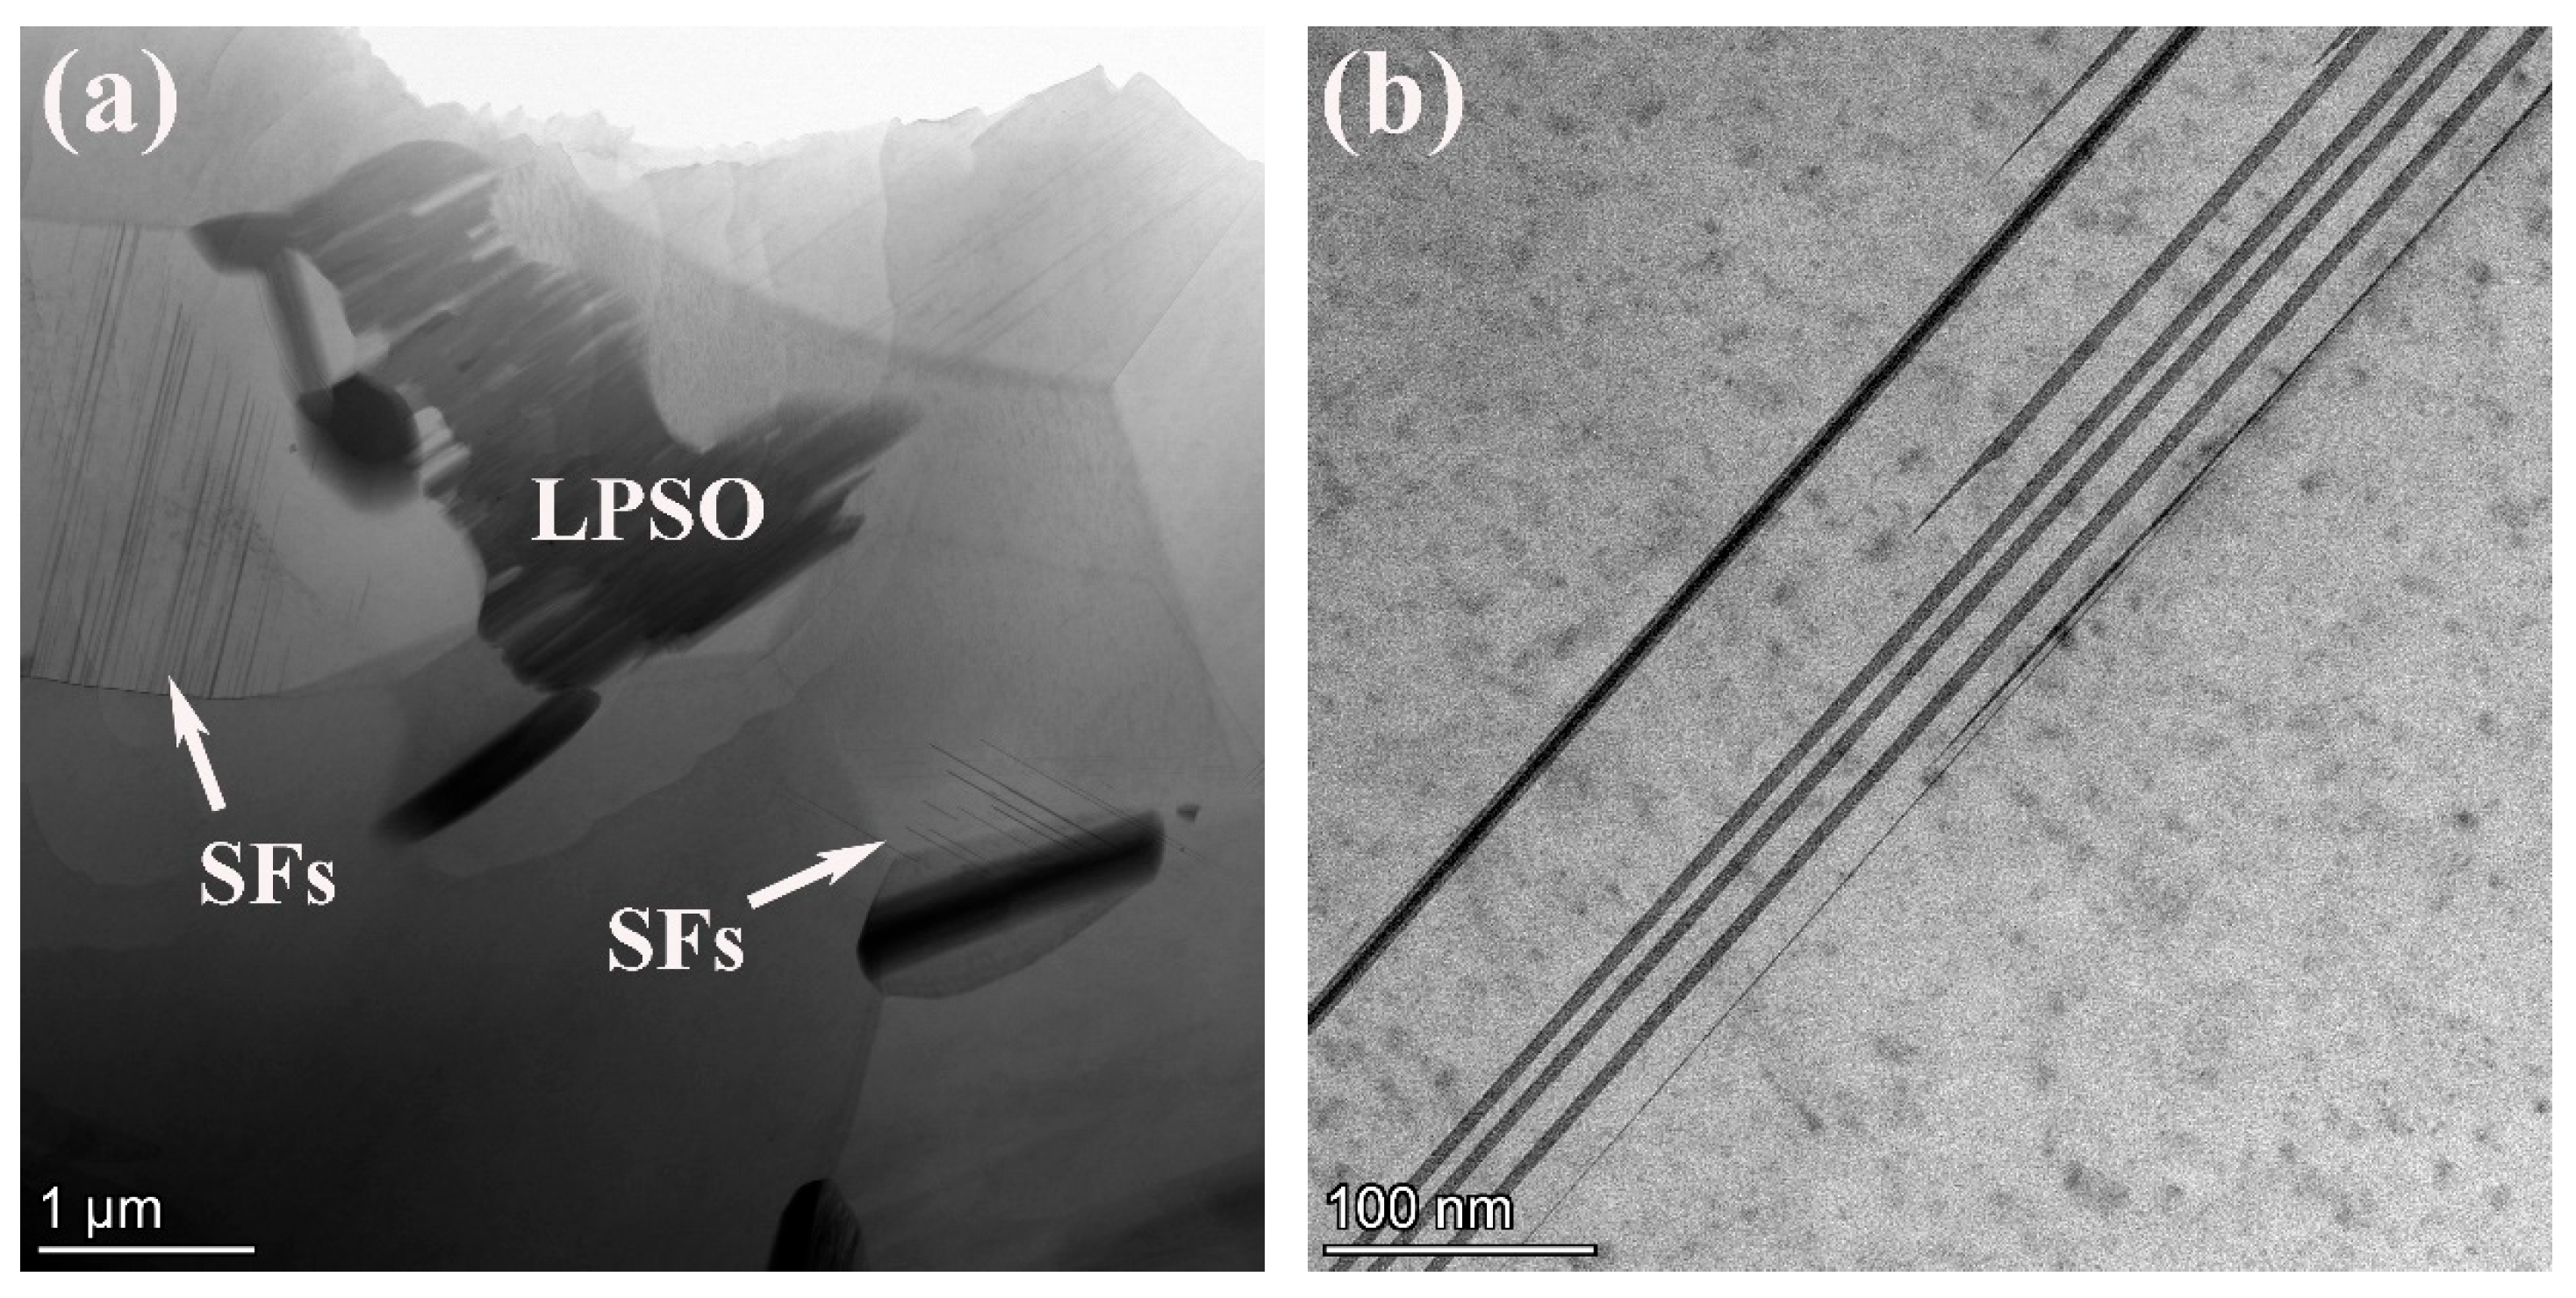
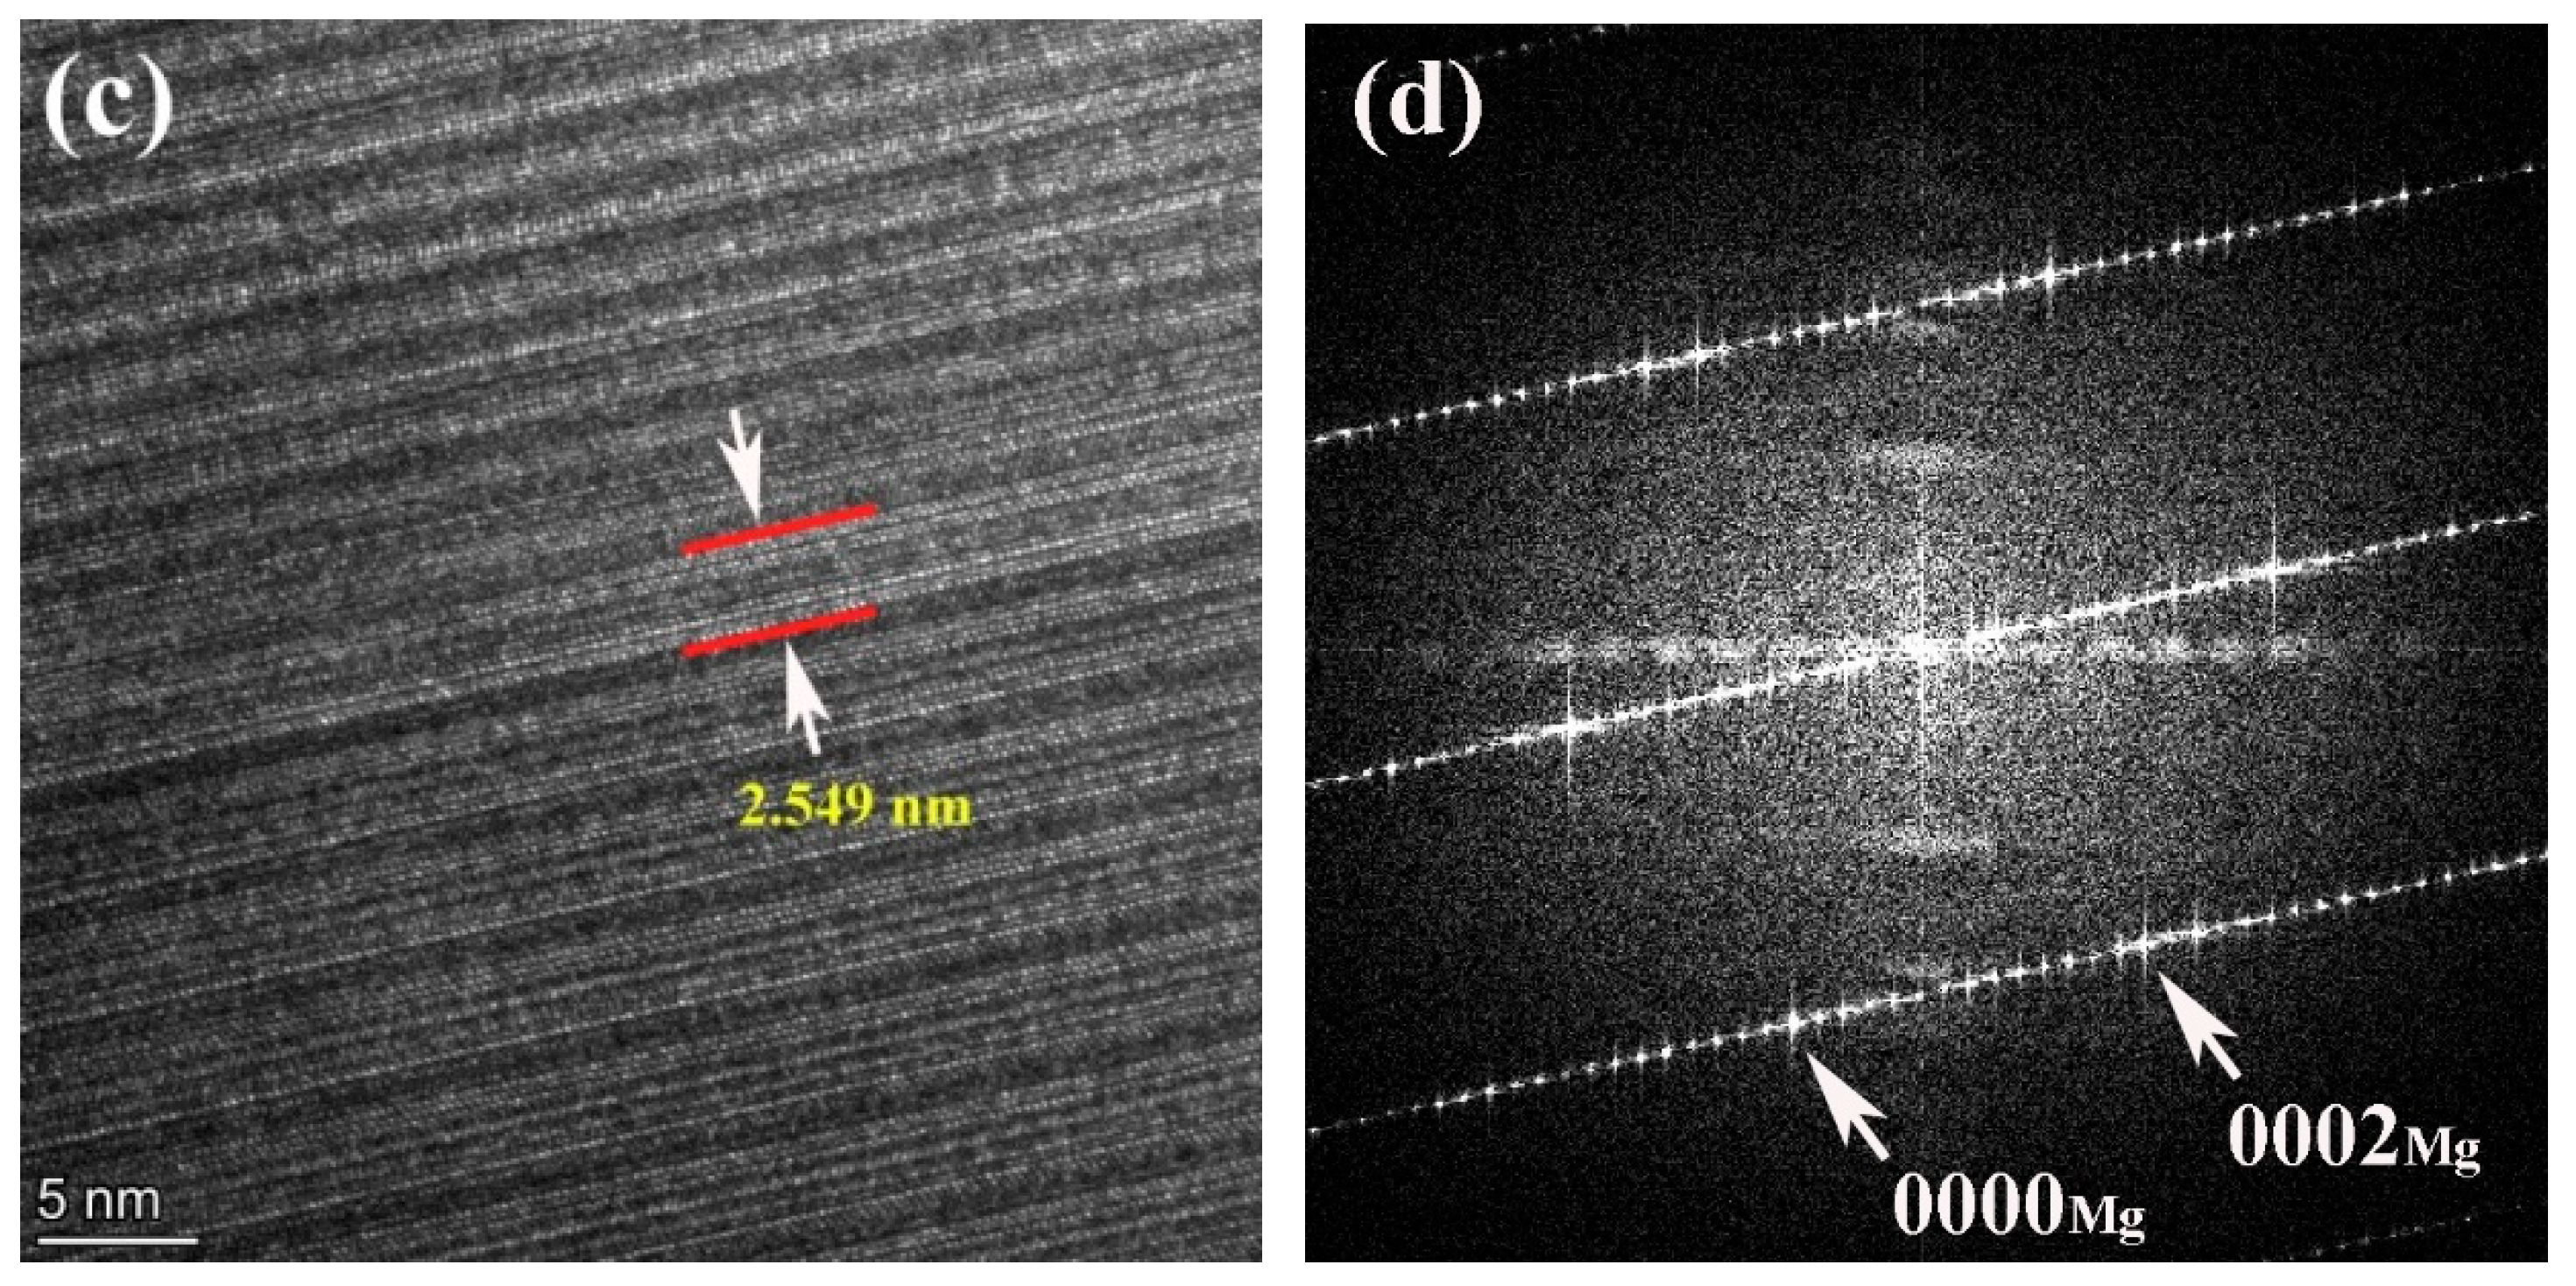
Figure 4.
STEM image (a), HAADF-STEM image (b), high-resolutionin image (c) and corresponding SAED pattern (d) of the 561 alloy.
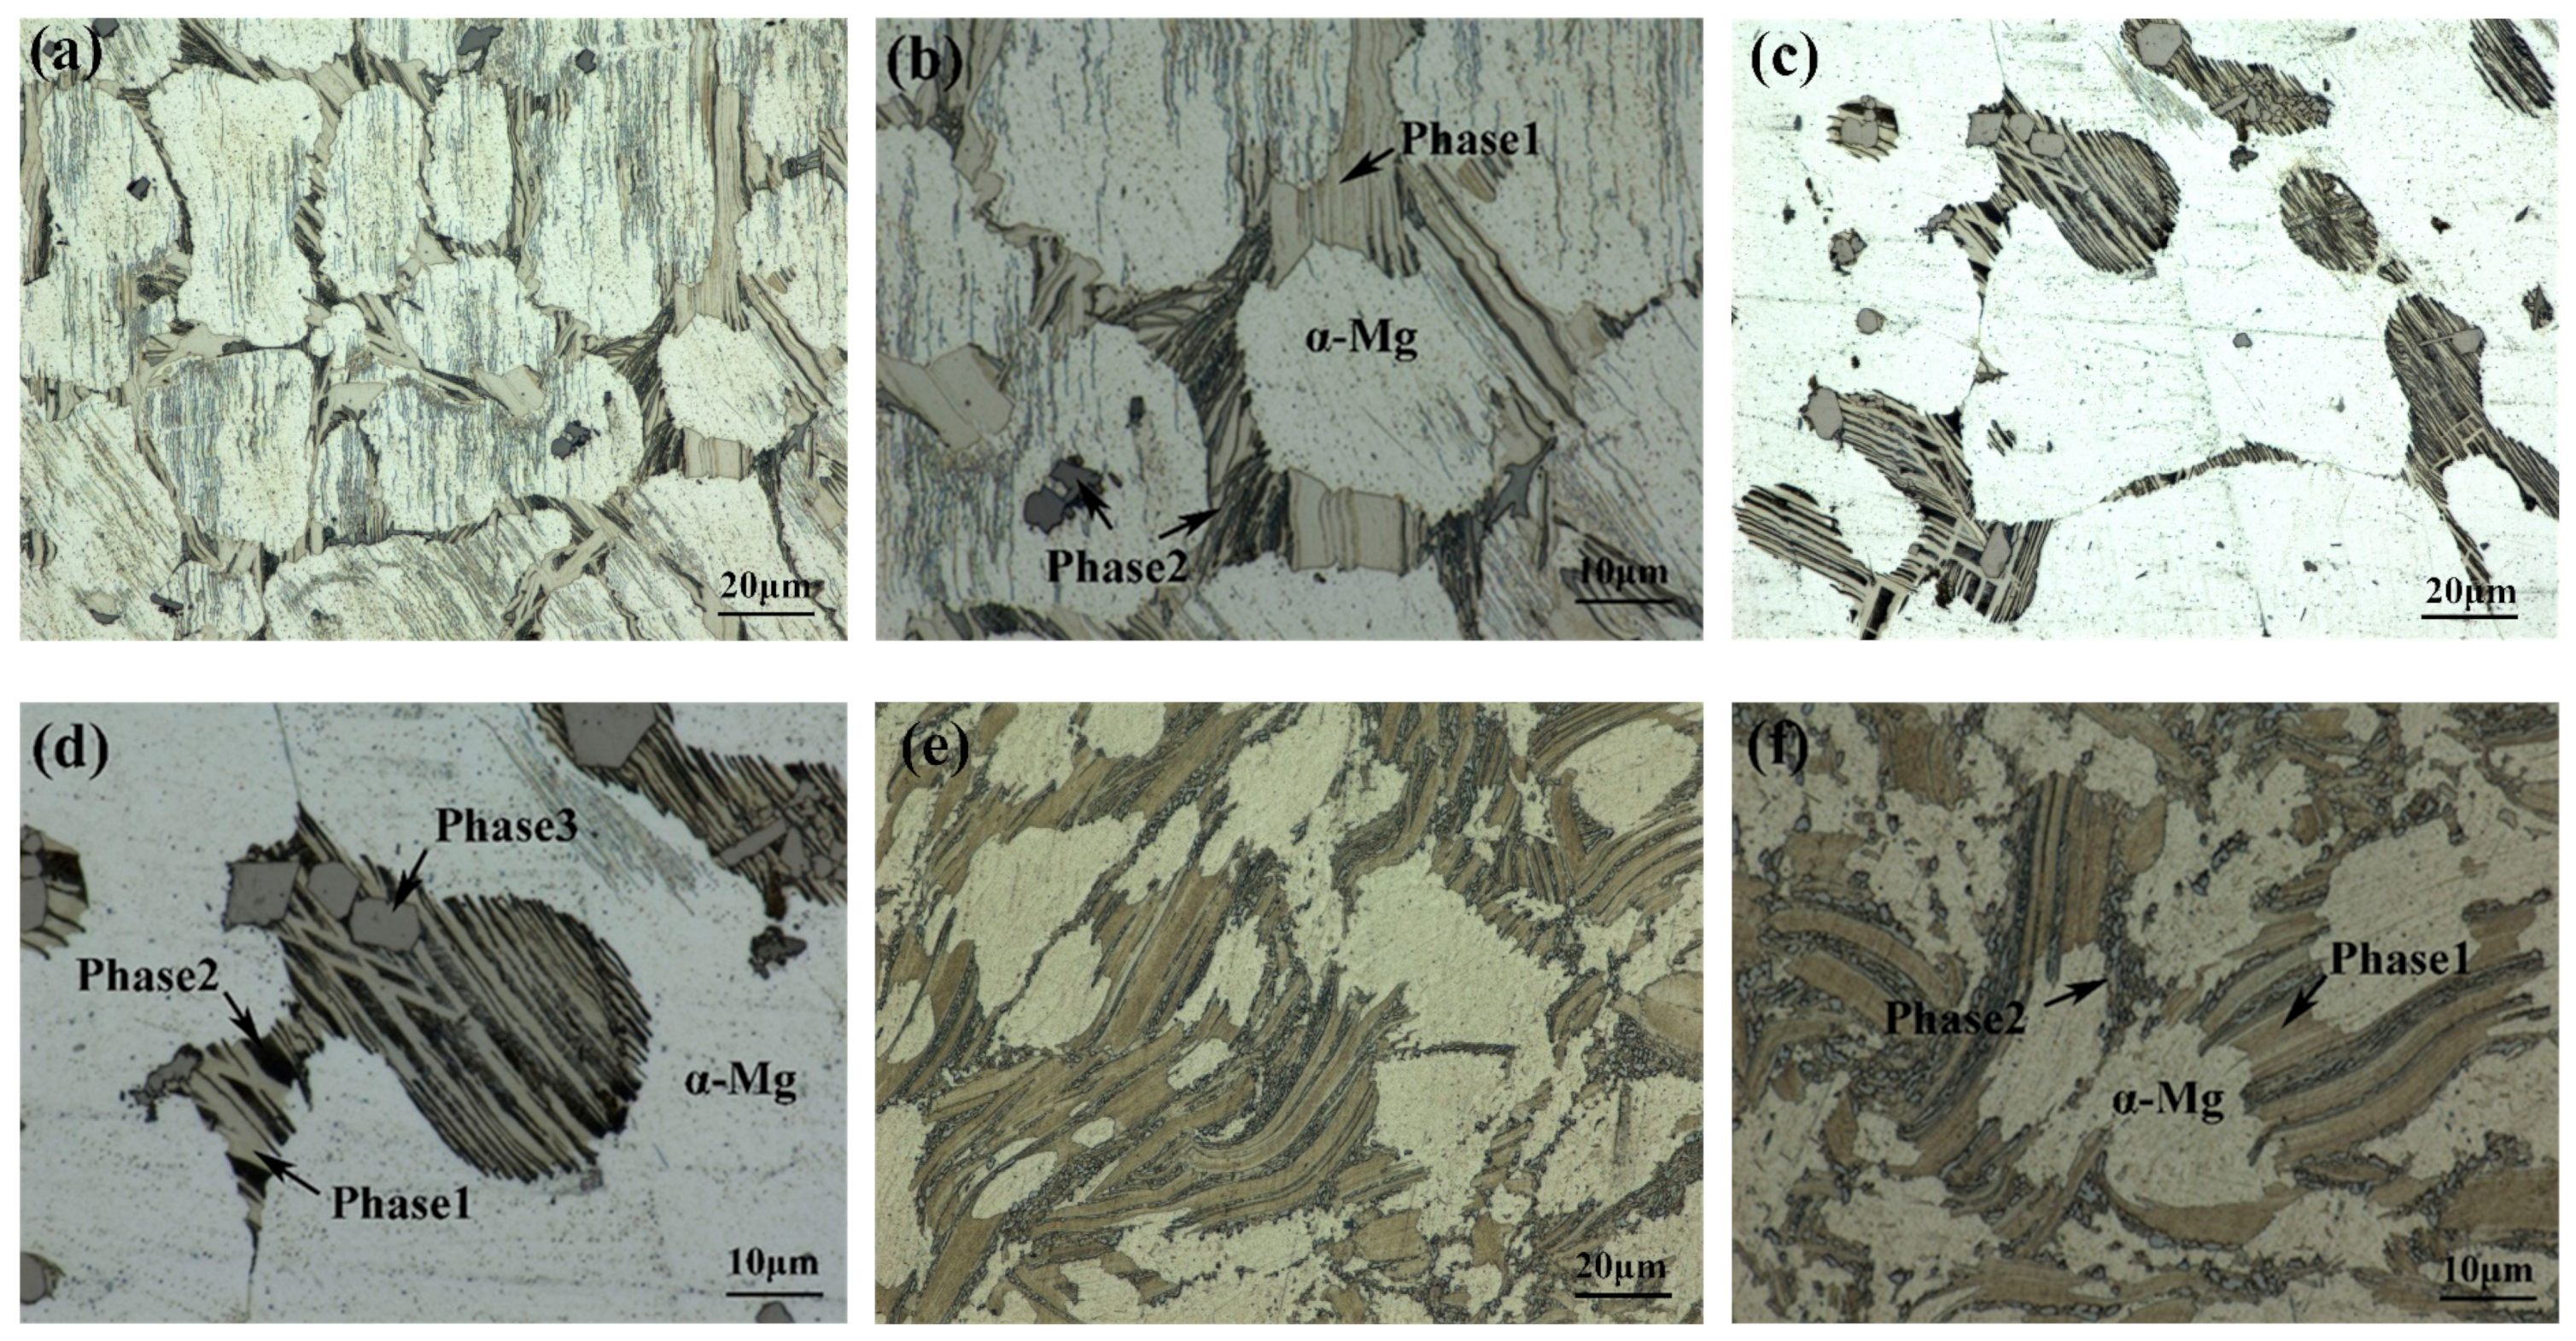
Figure 5.
Optical Microstructure of 561 (a,b), A561 (c,d), and E561 (e,f).
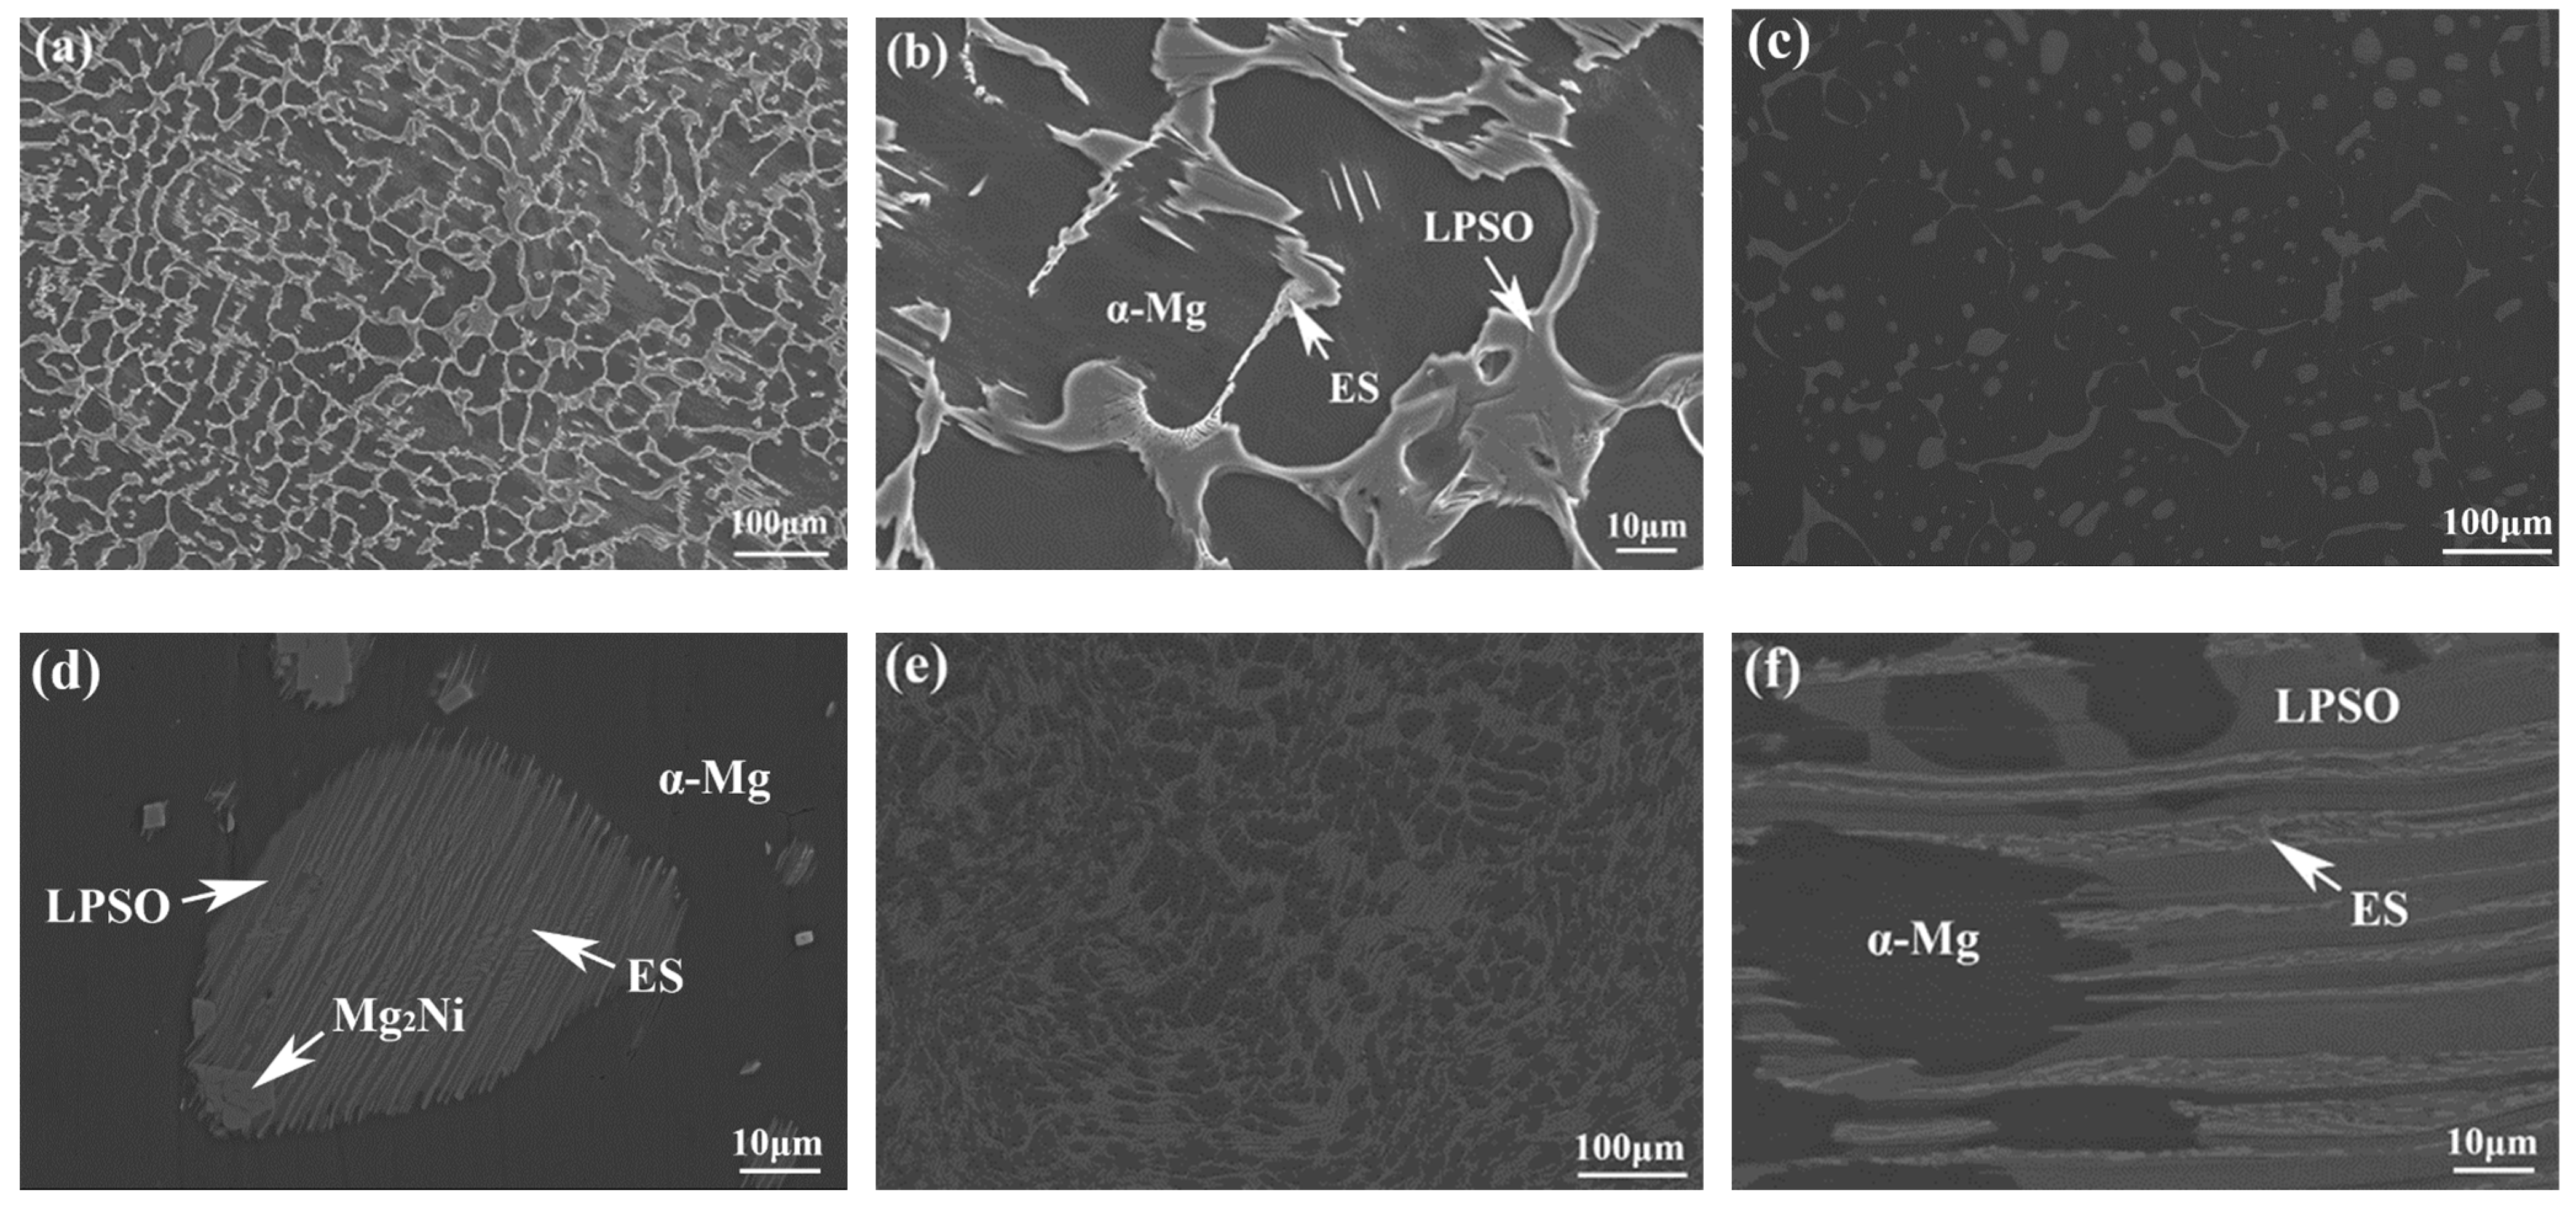
Figure 6.
SEM microstructure of 561 (a,b), A561 (c,d), and E561 (e,f).
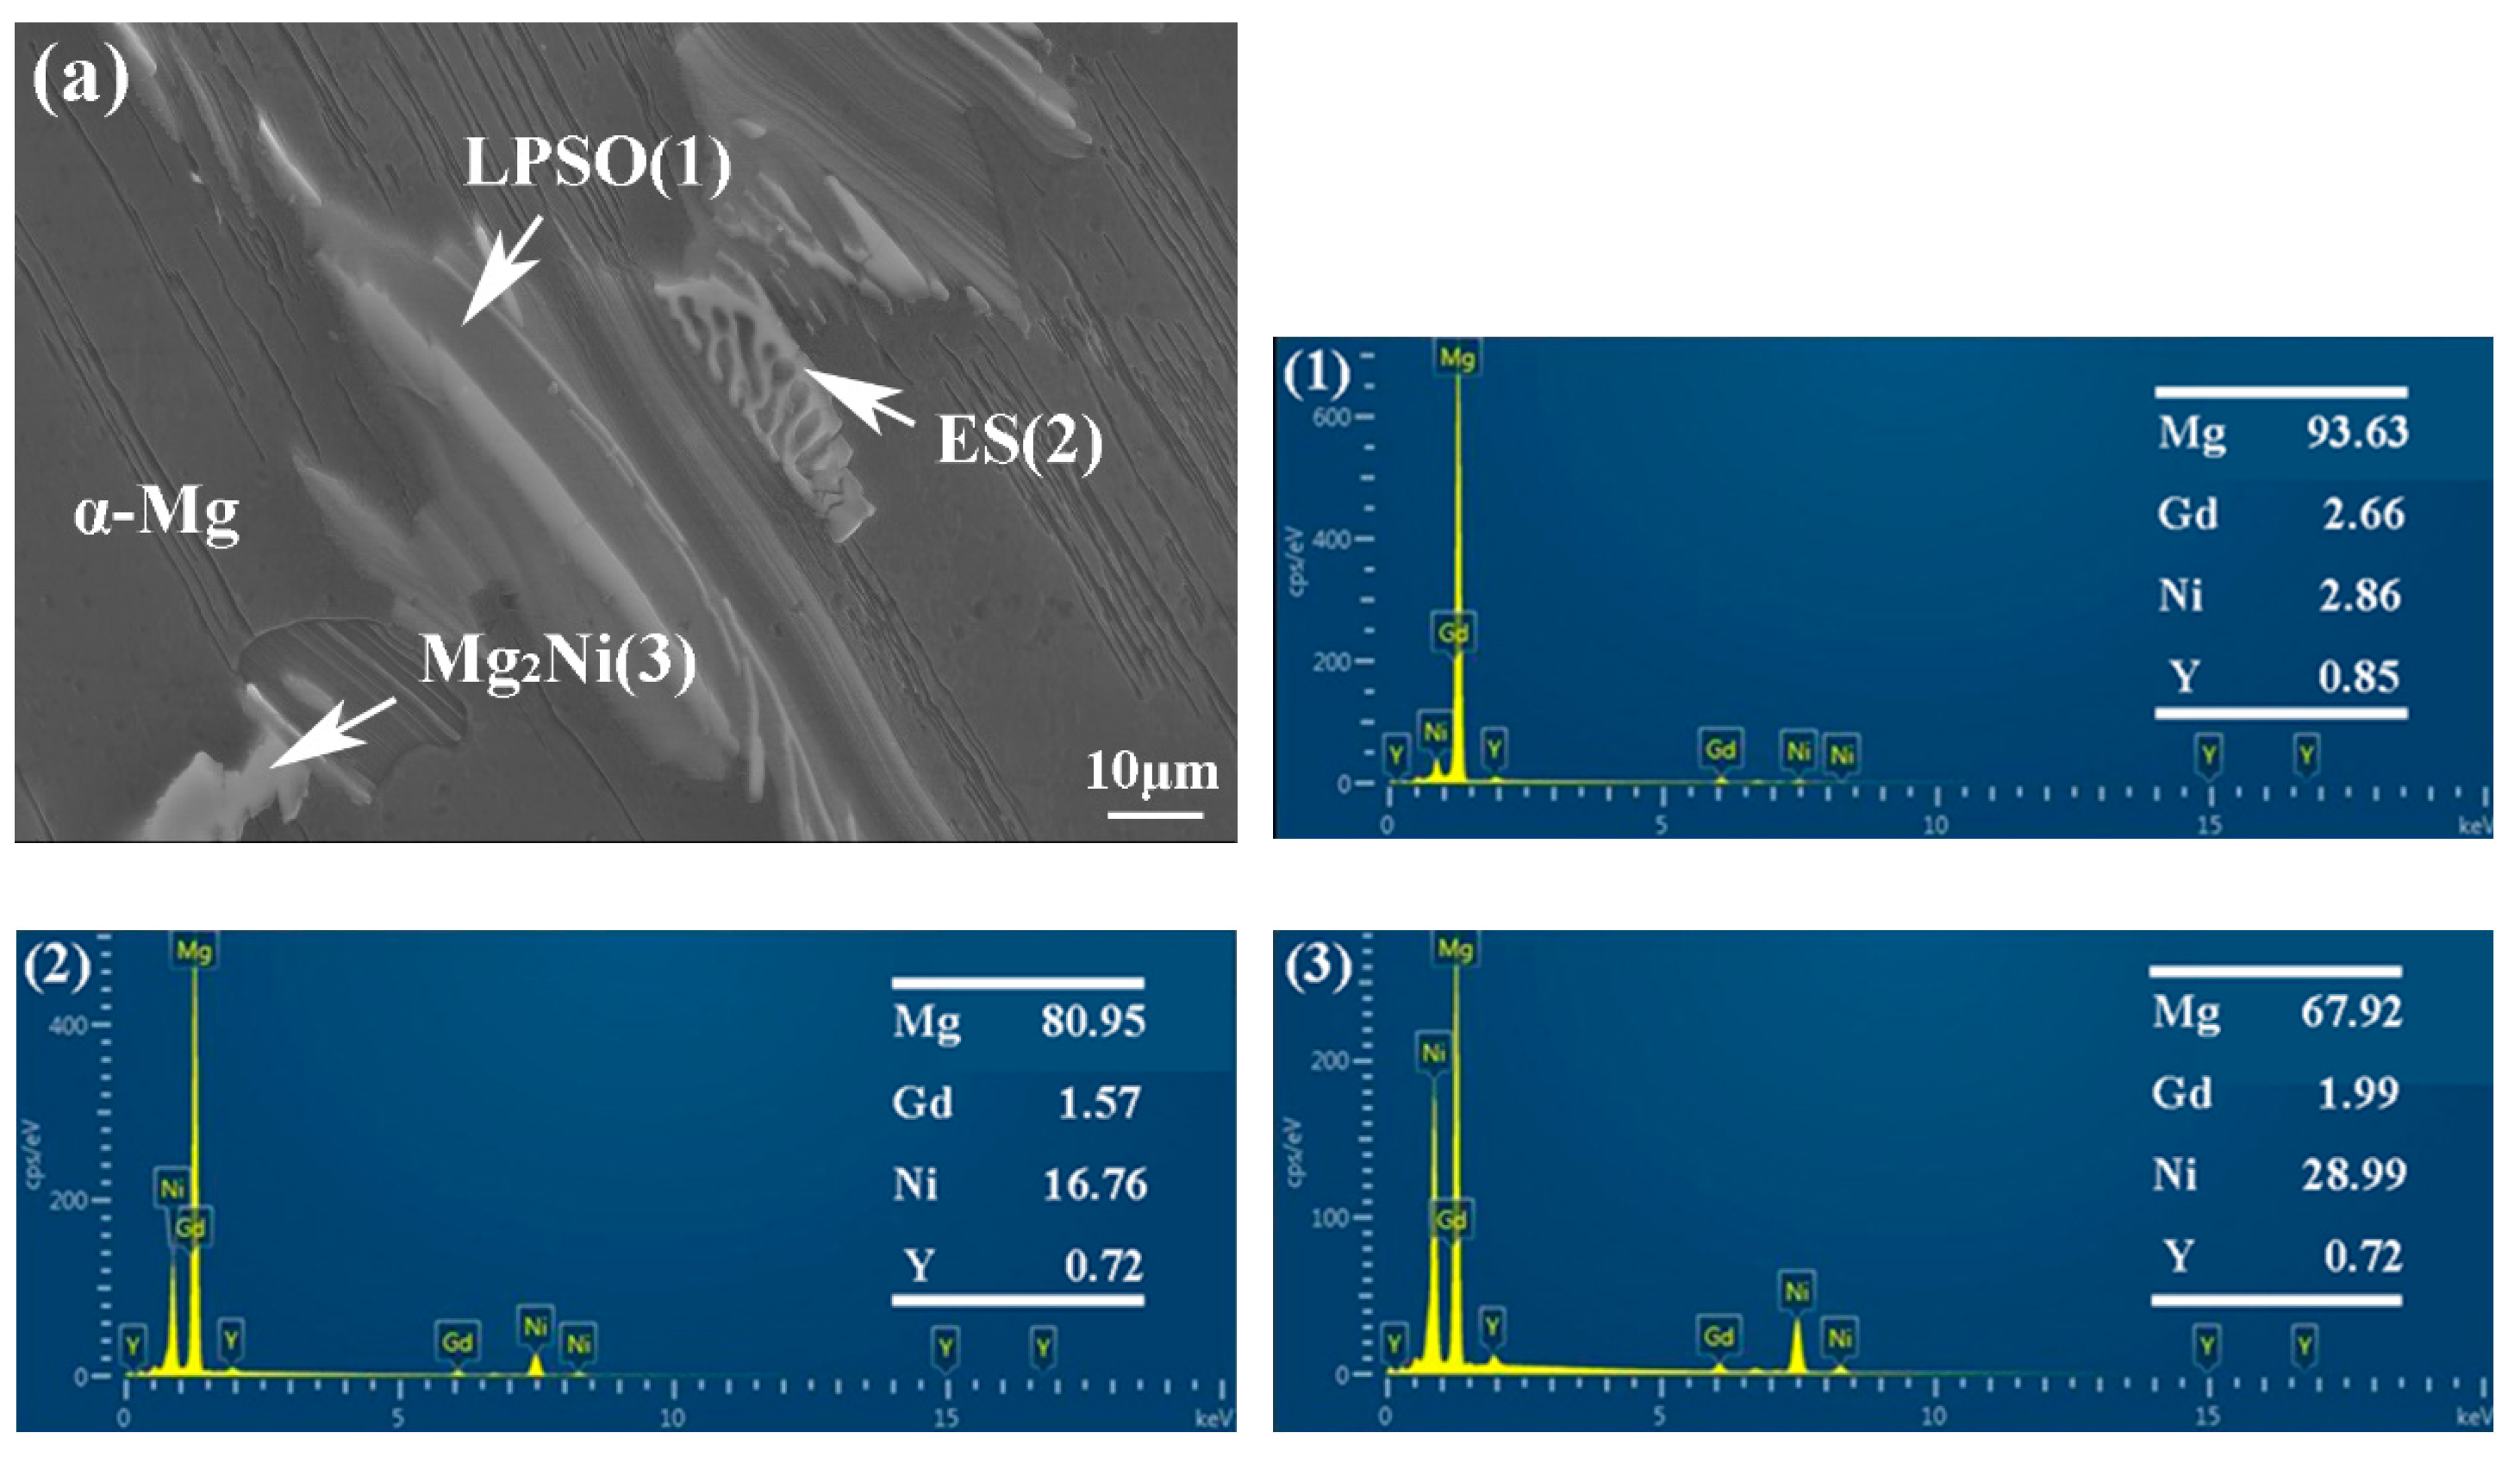
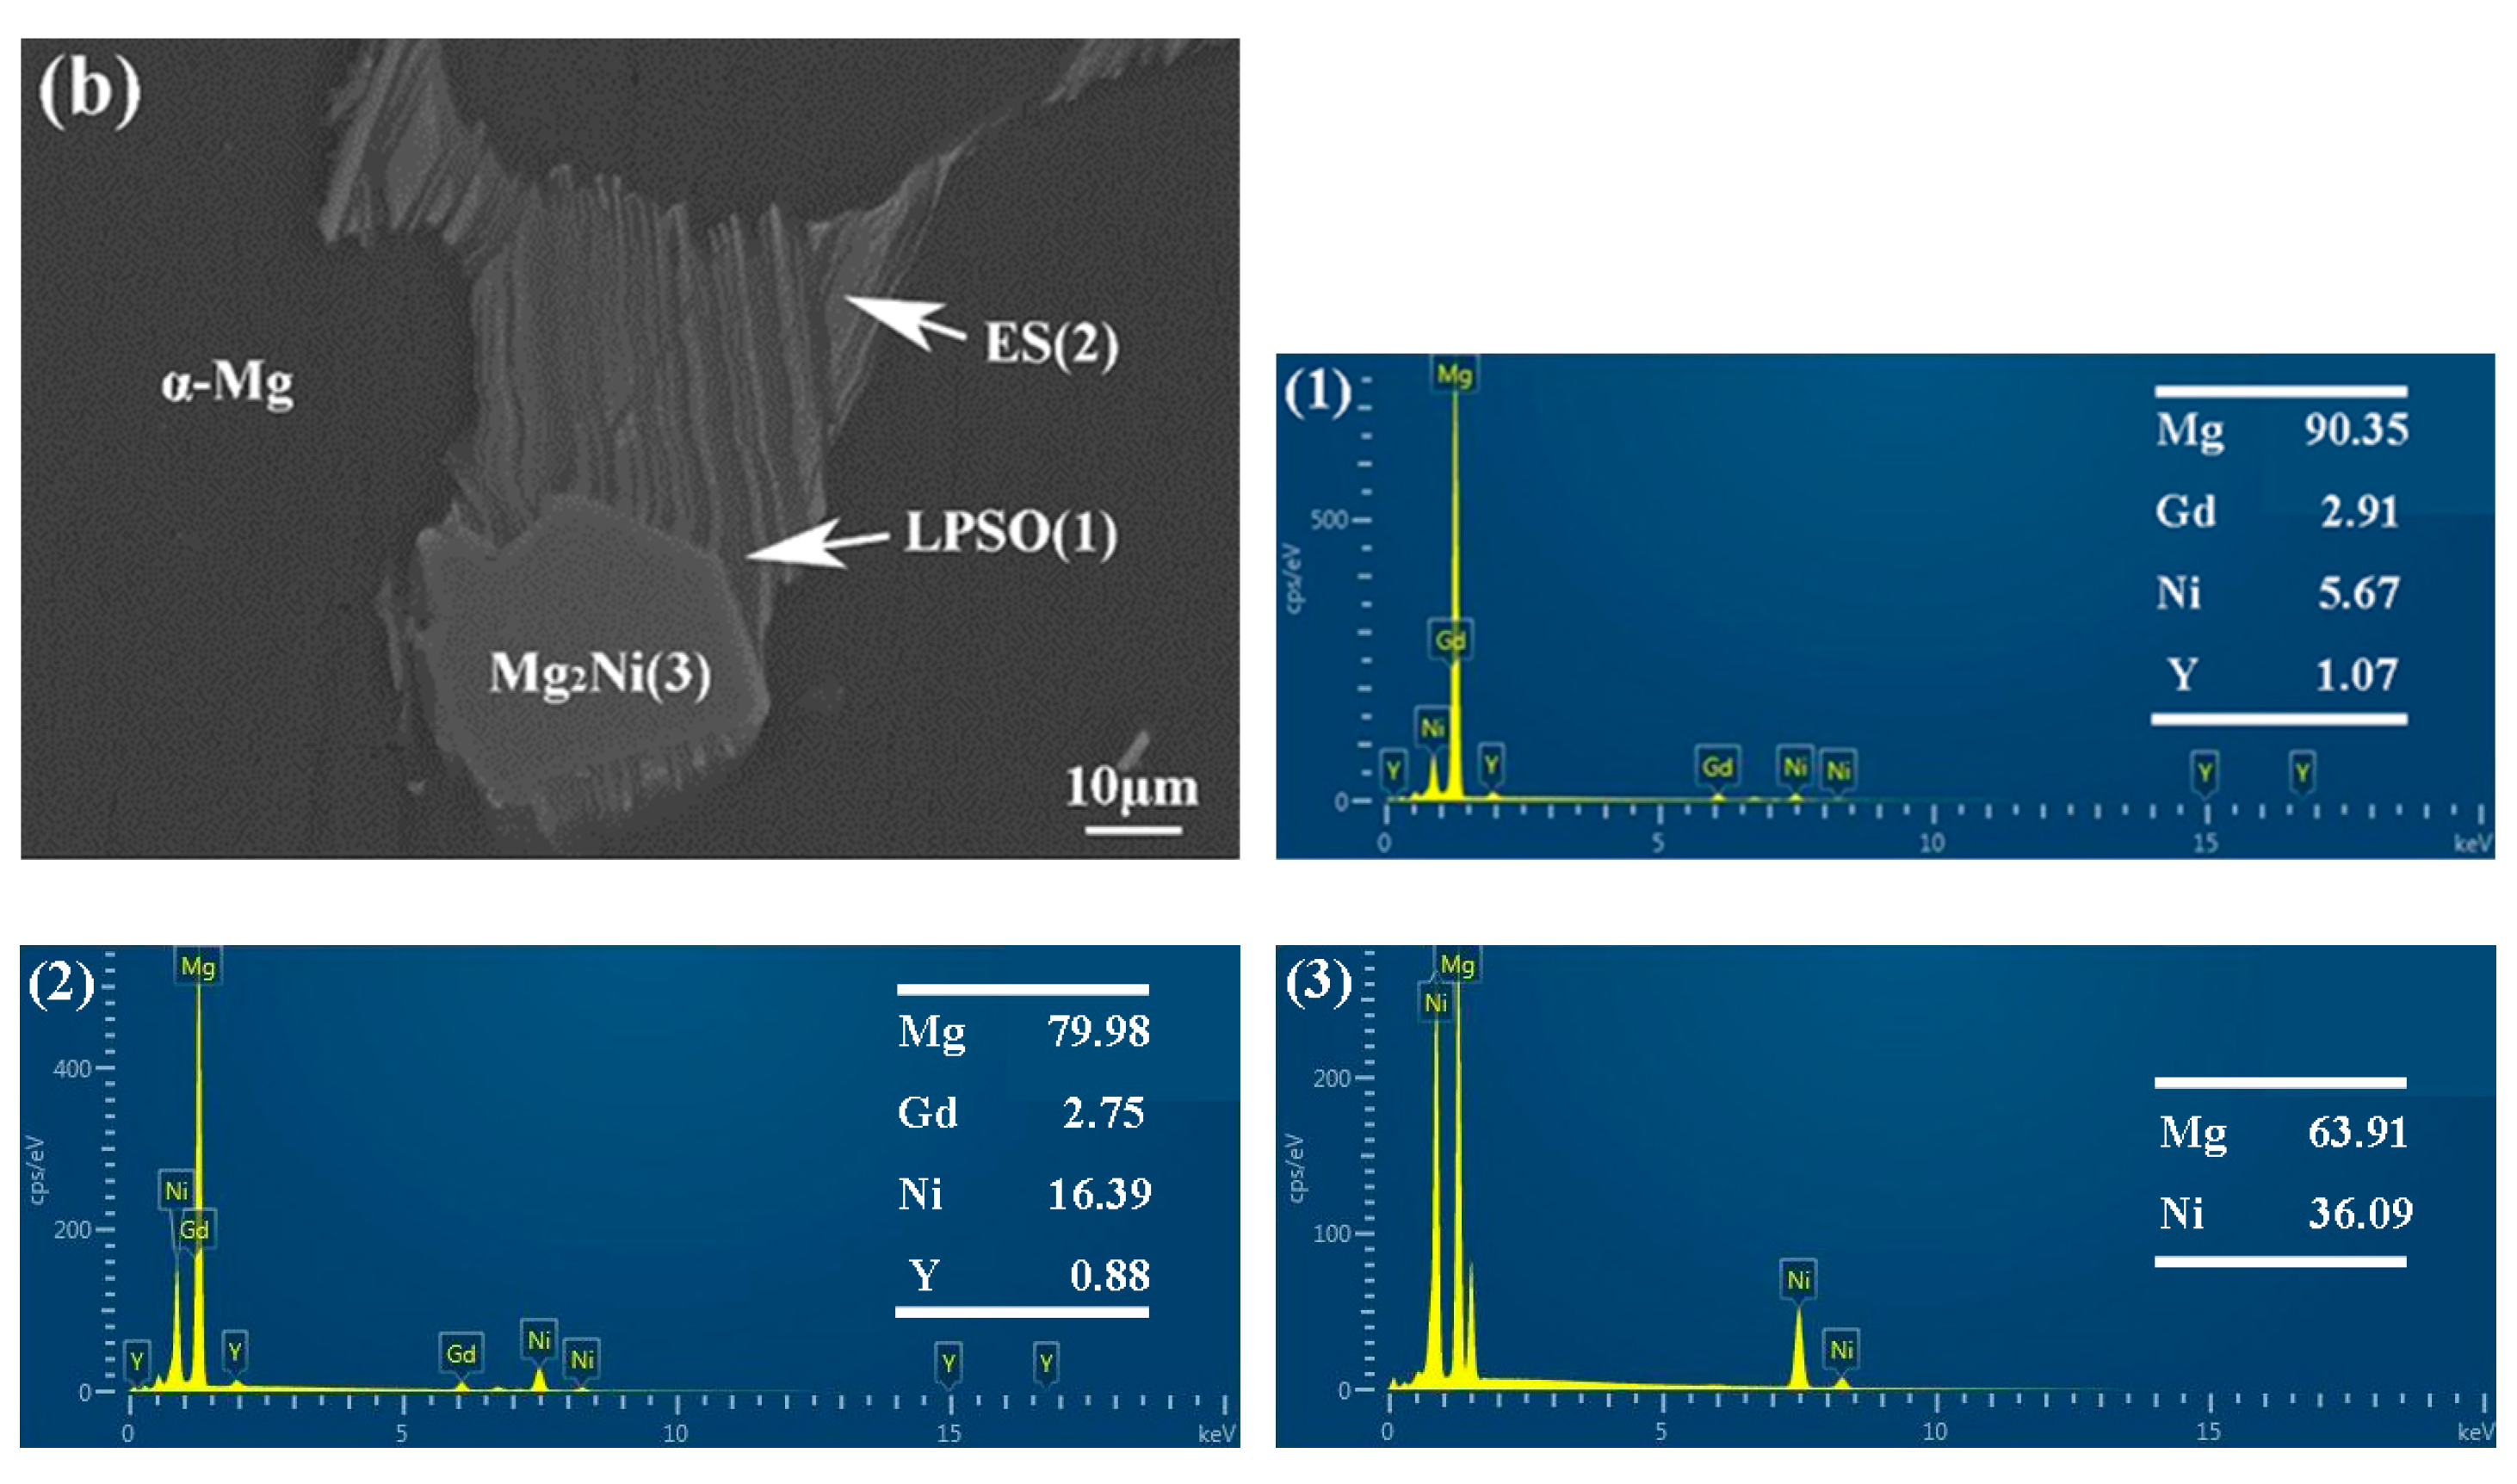
Figure 7.
EDS analysis of 561 (a) and A561 (b) (at.%).
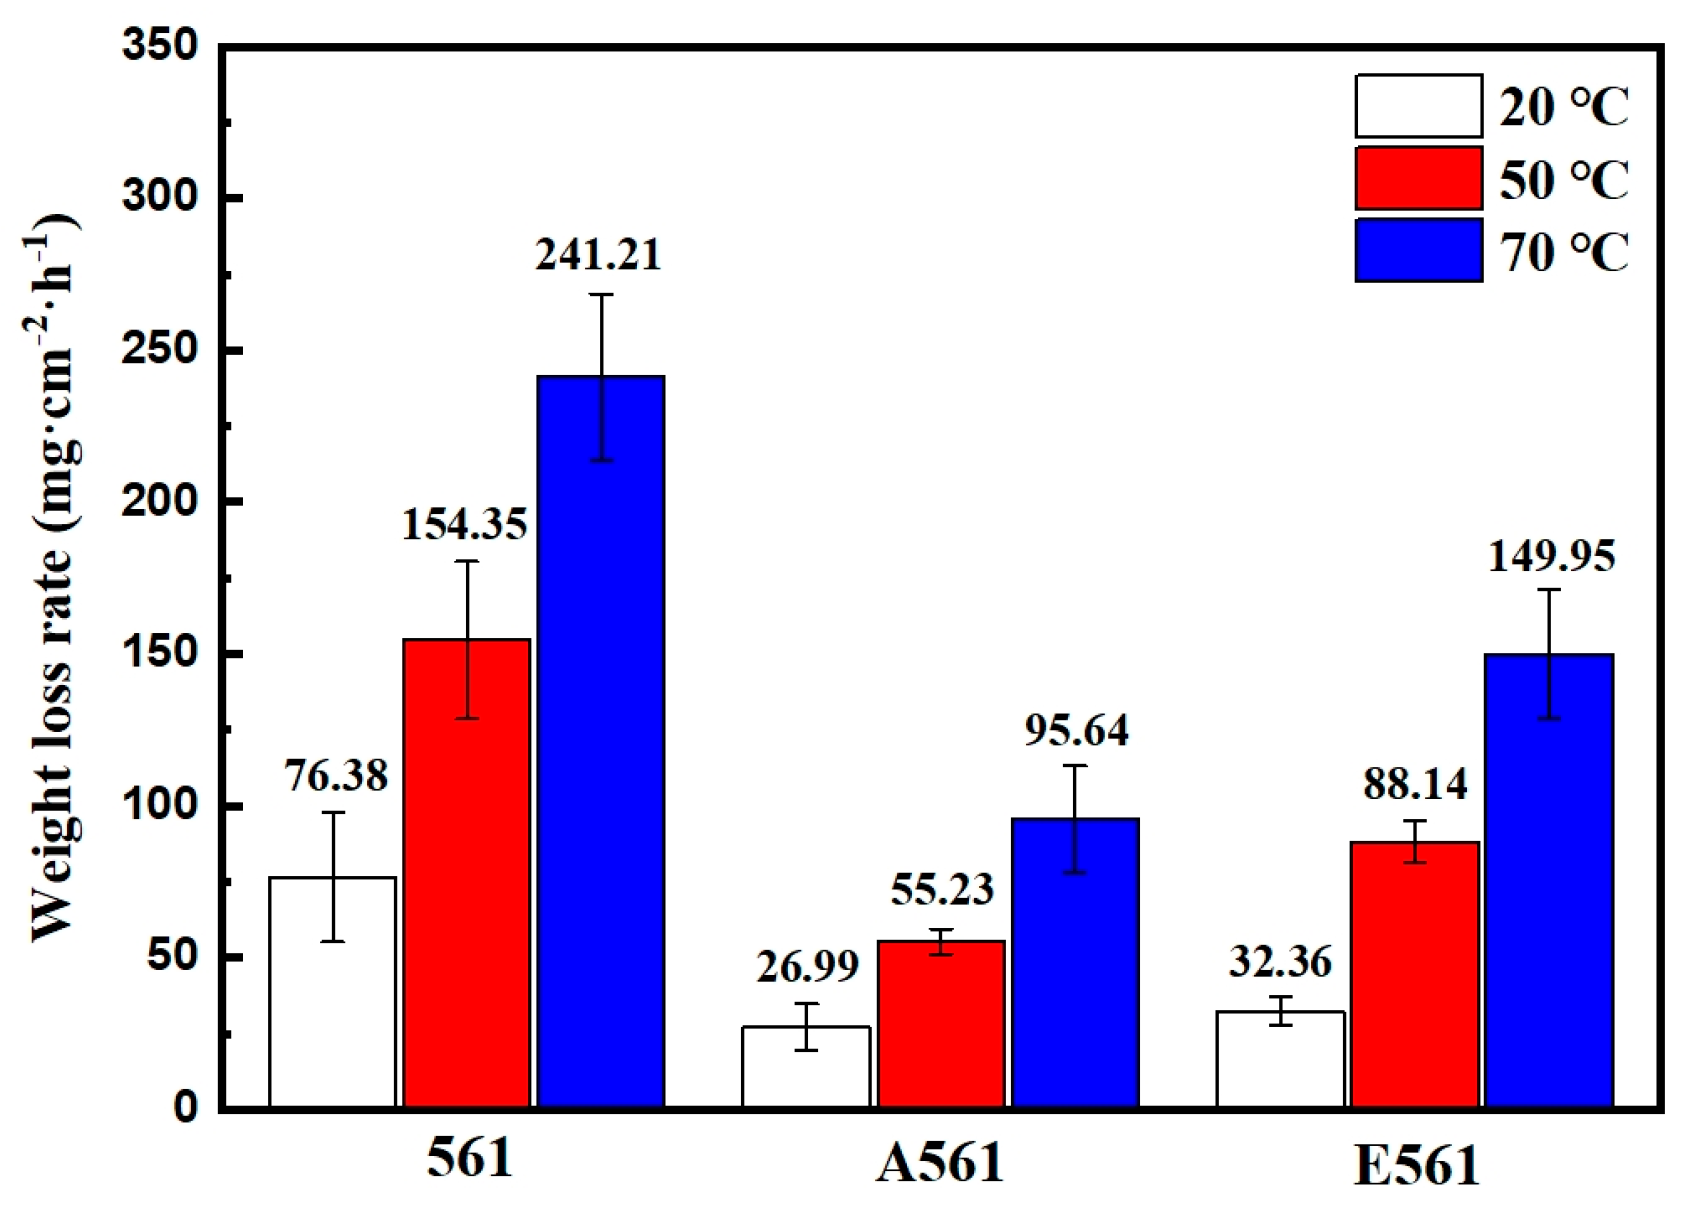
Figure 8.
Degradation rates measured by weight loss at different temperatures.
Figure 9.
Corrosion surface morphologies of 561 (a), A561 (b), and E561 (c).
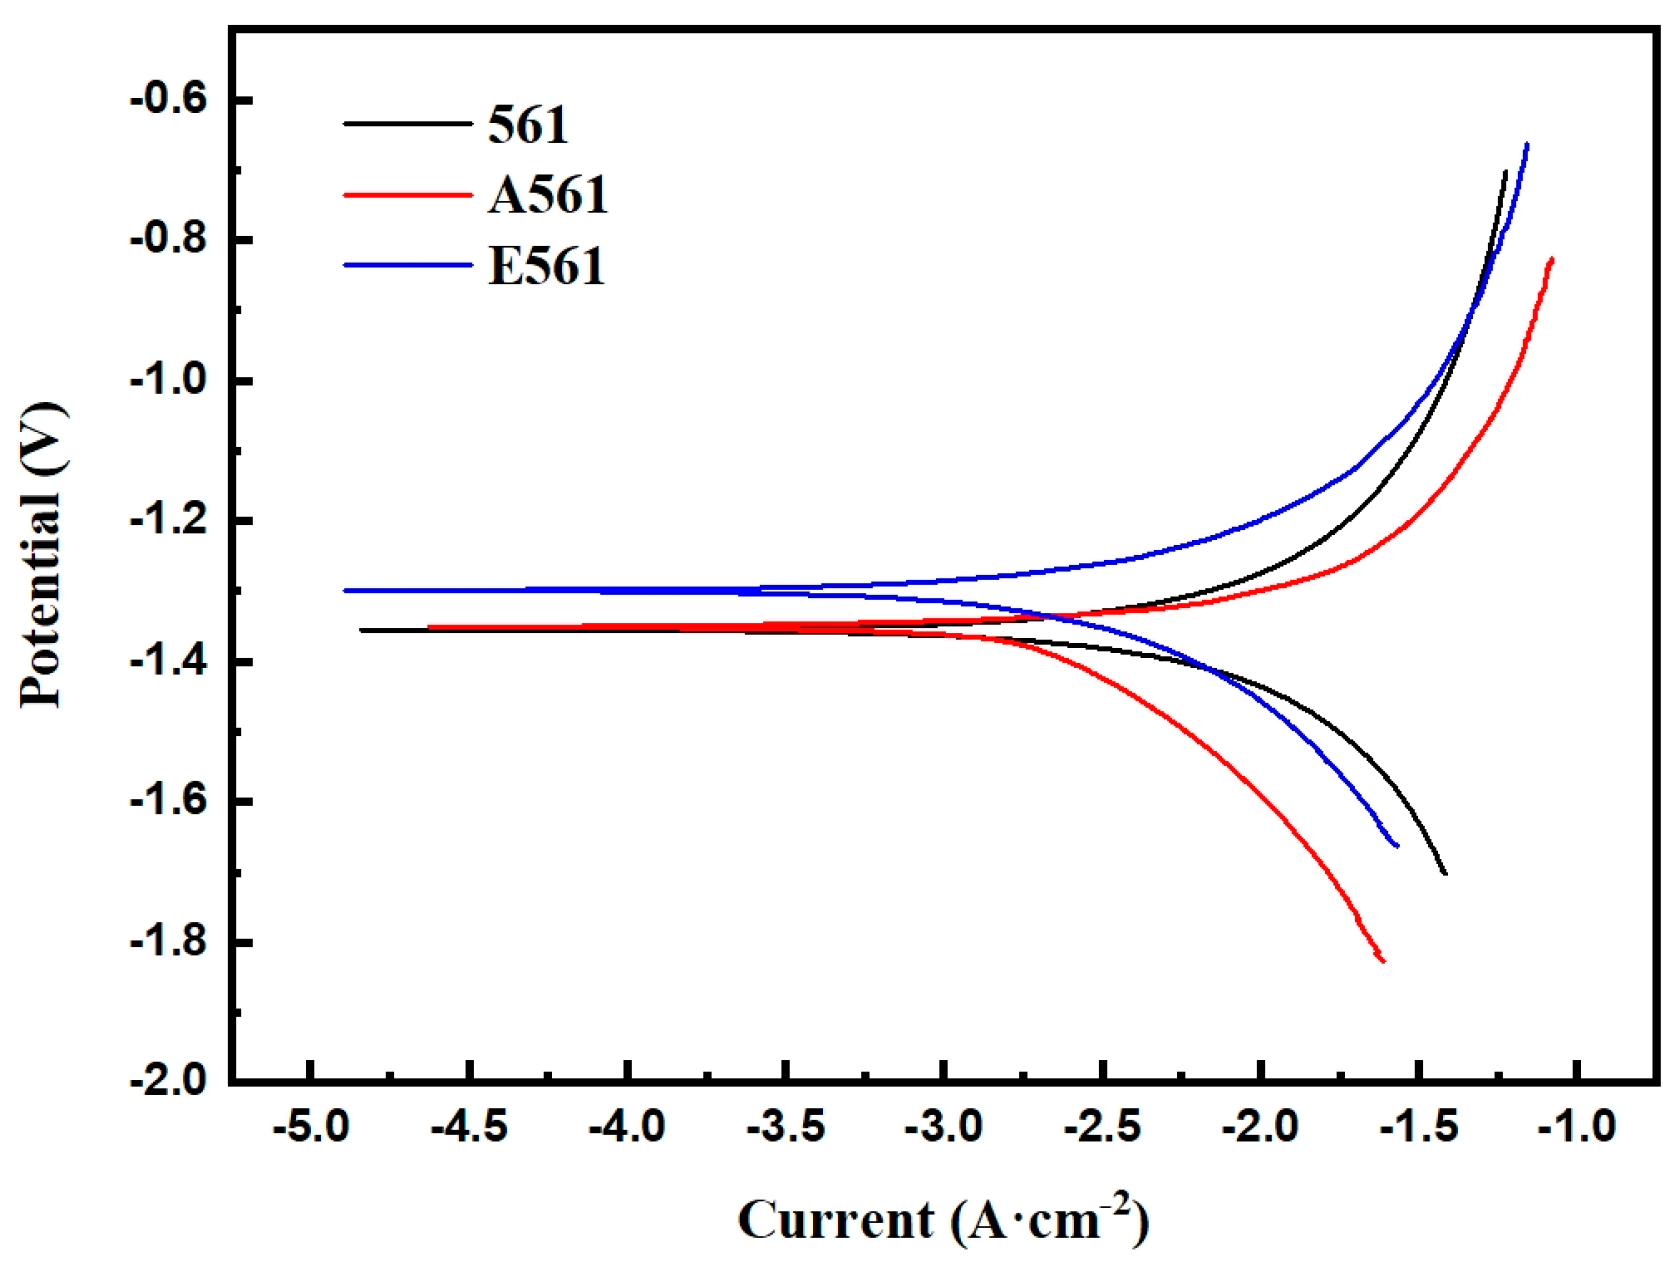
Figure 10.
Potentiodynamic polarization curves of the alloys.
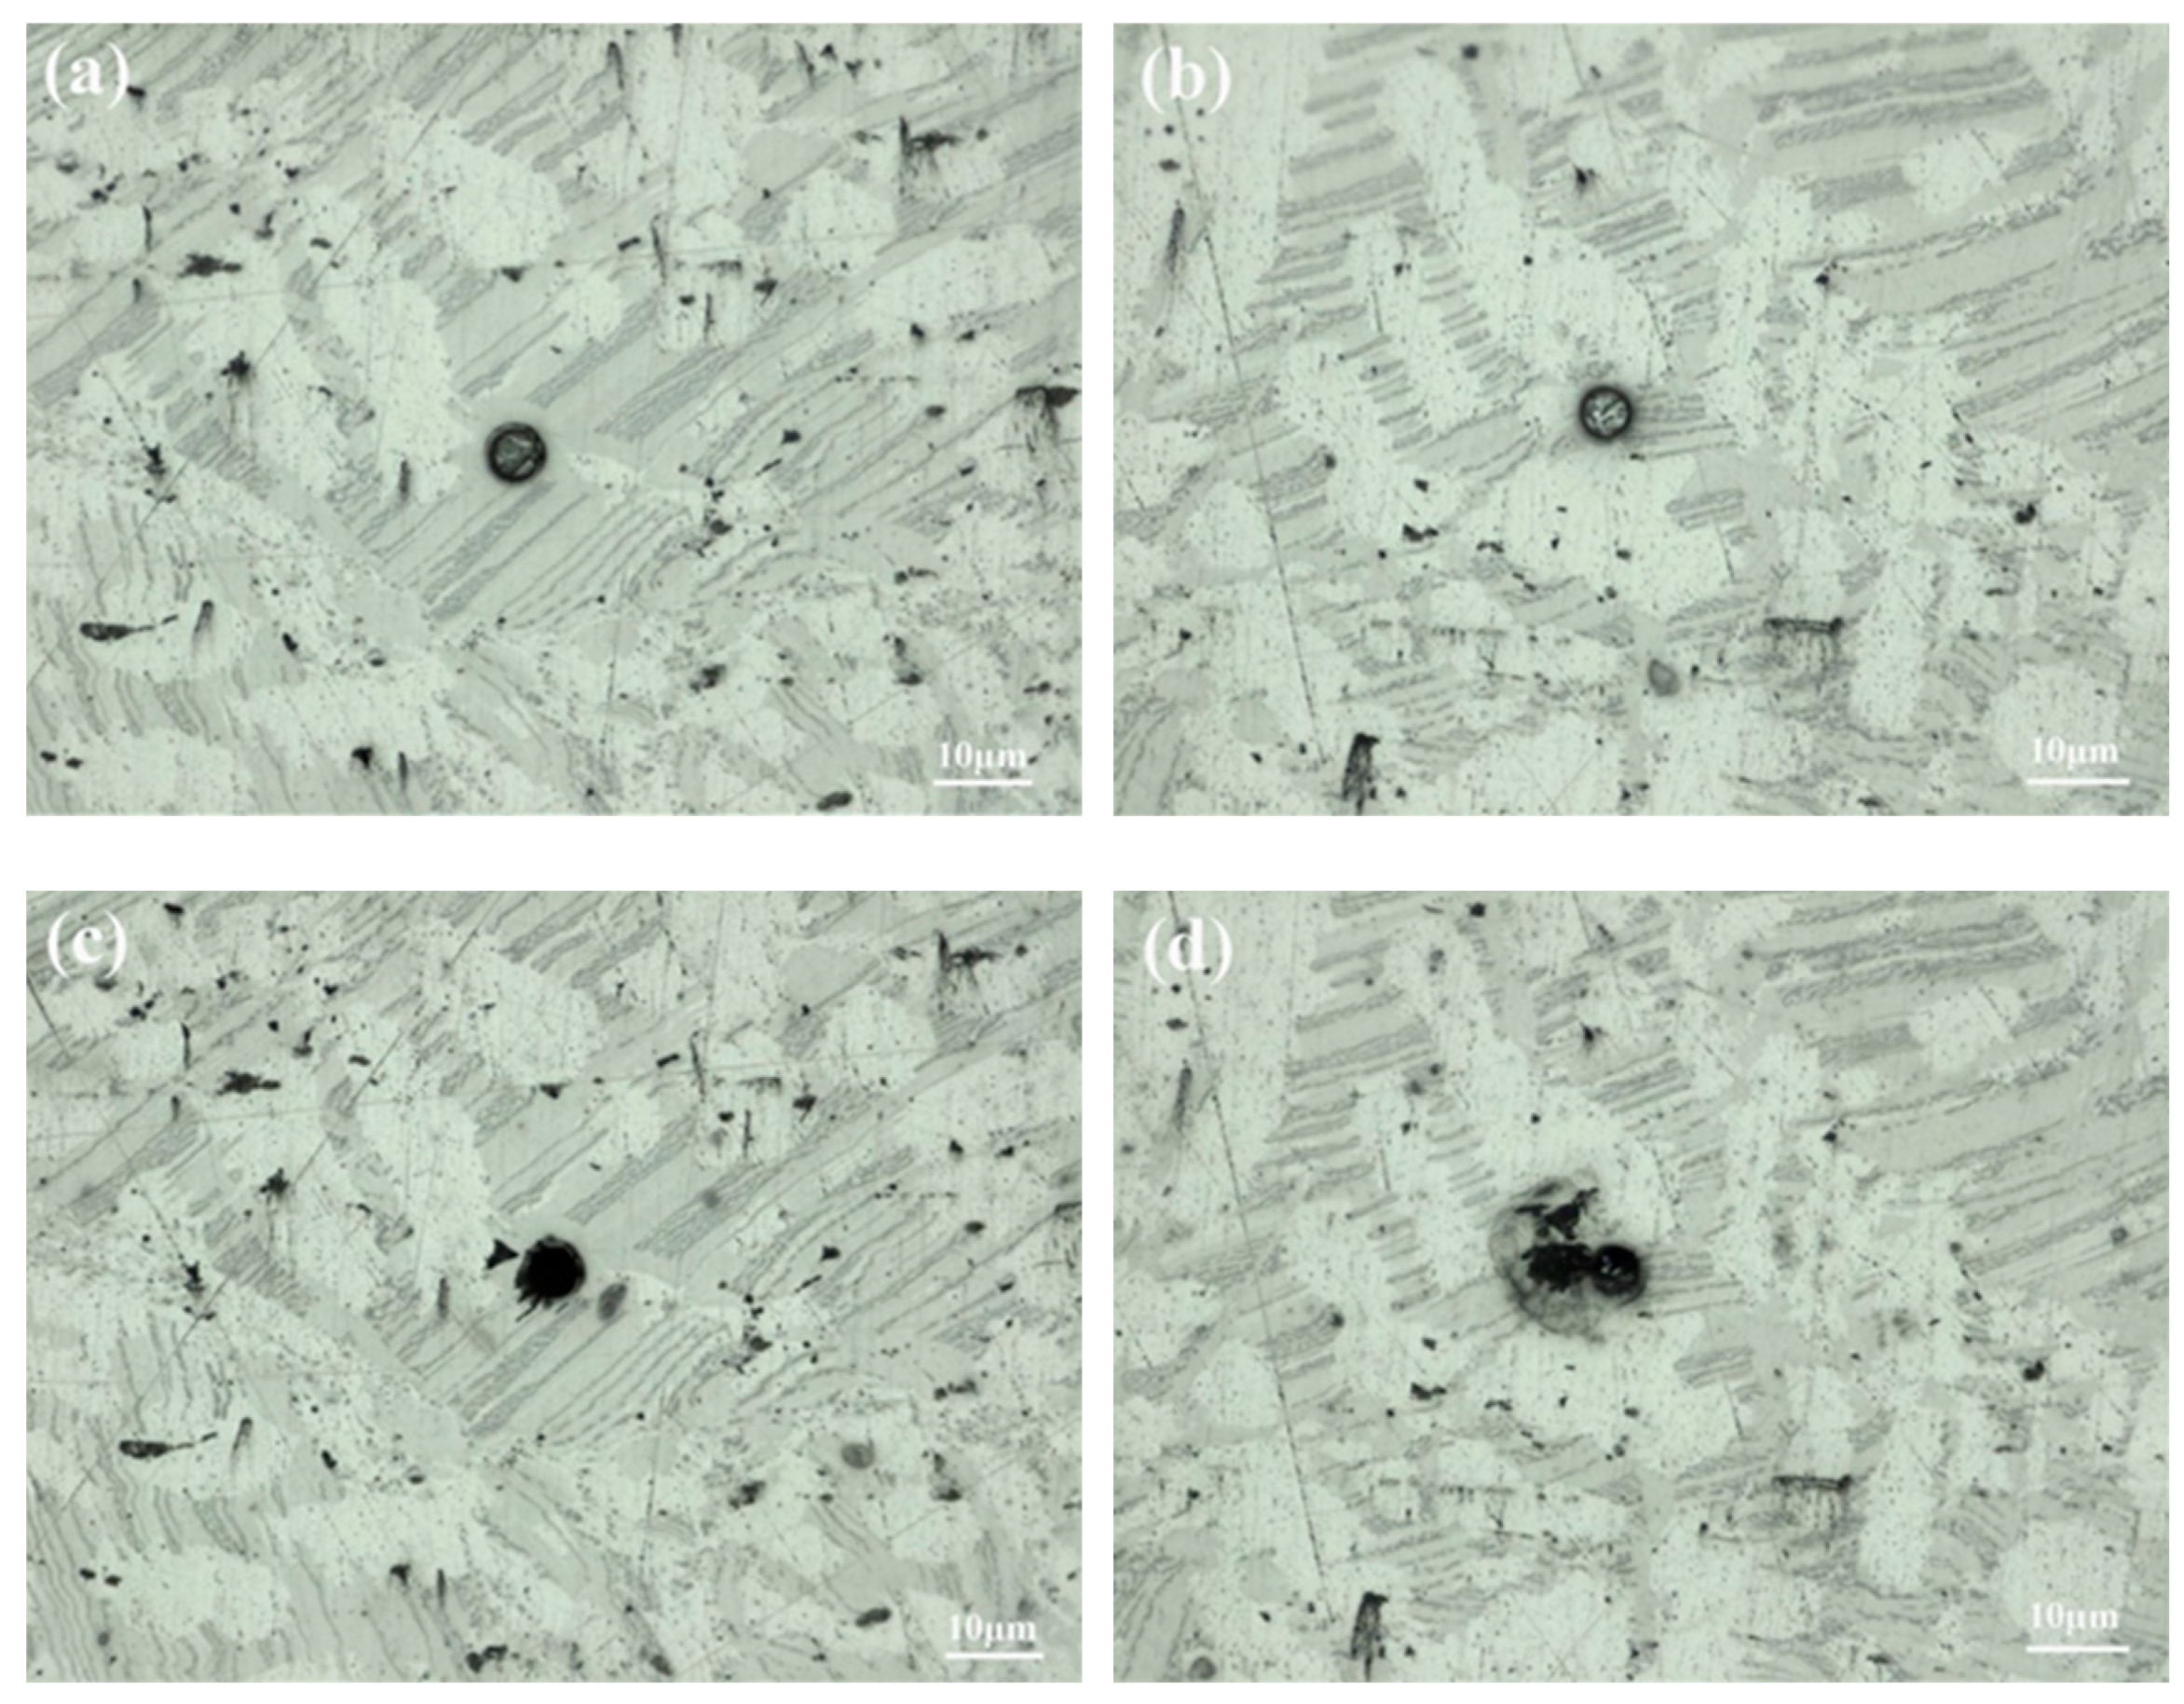
Figure 11.
Optical morphologies of in-situ corrosion test. (a) 0 s, (b) 60 s, (c) 120 s.
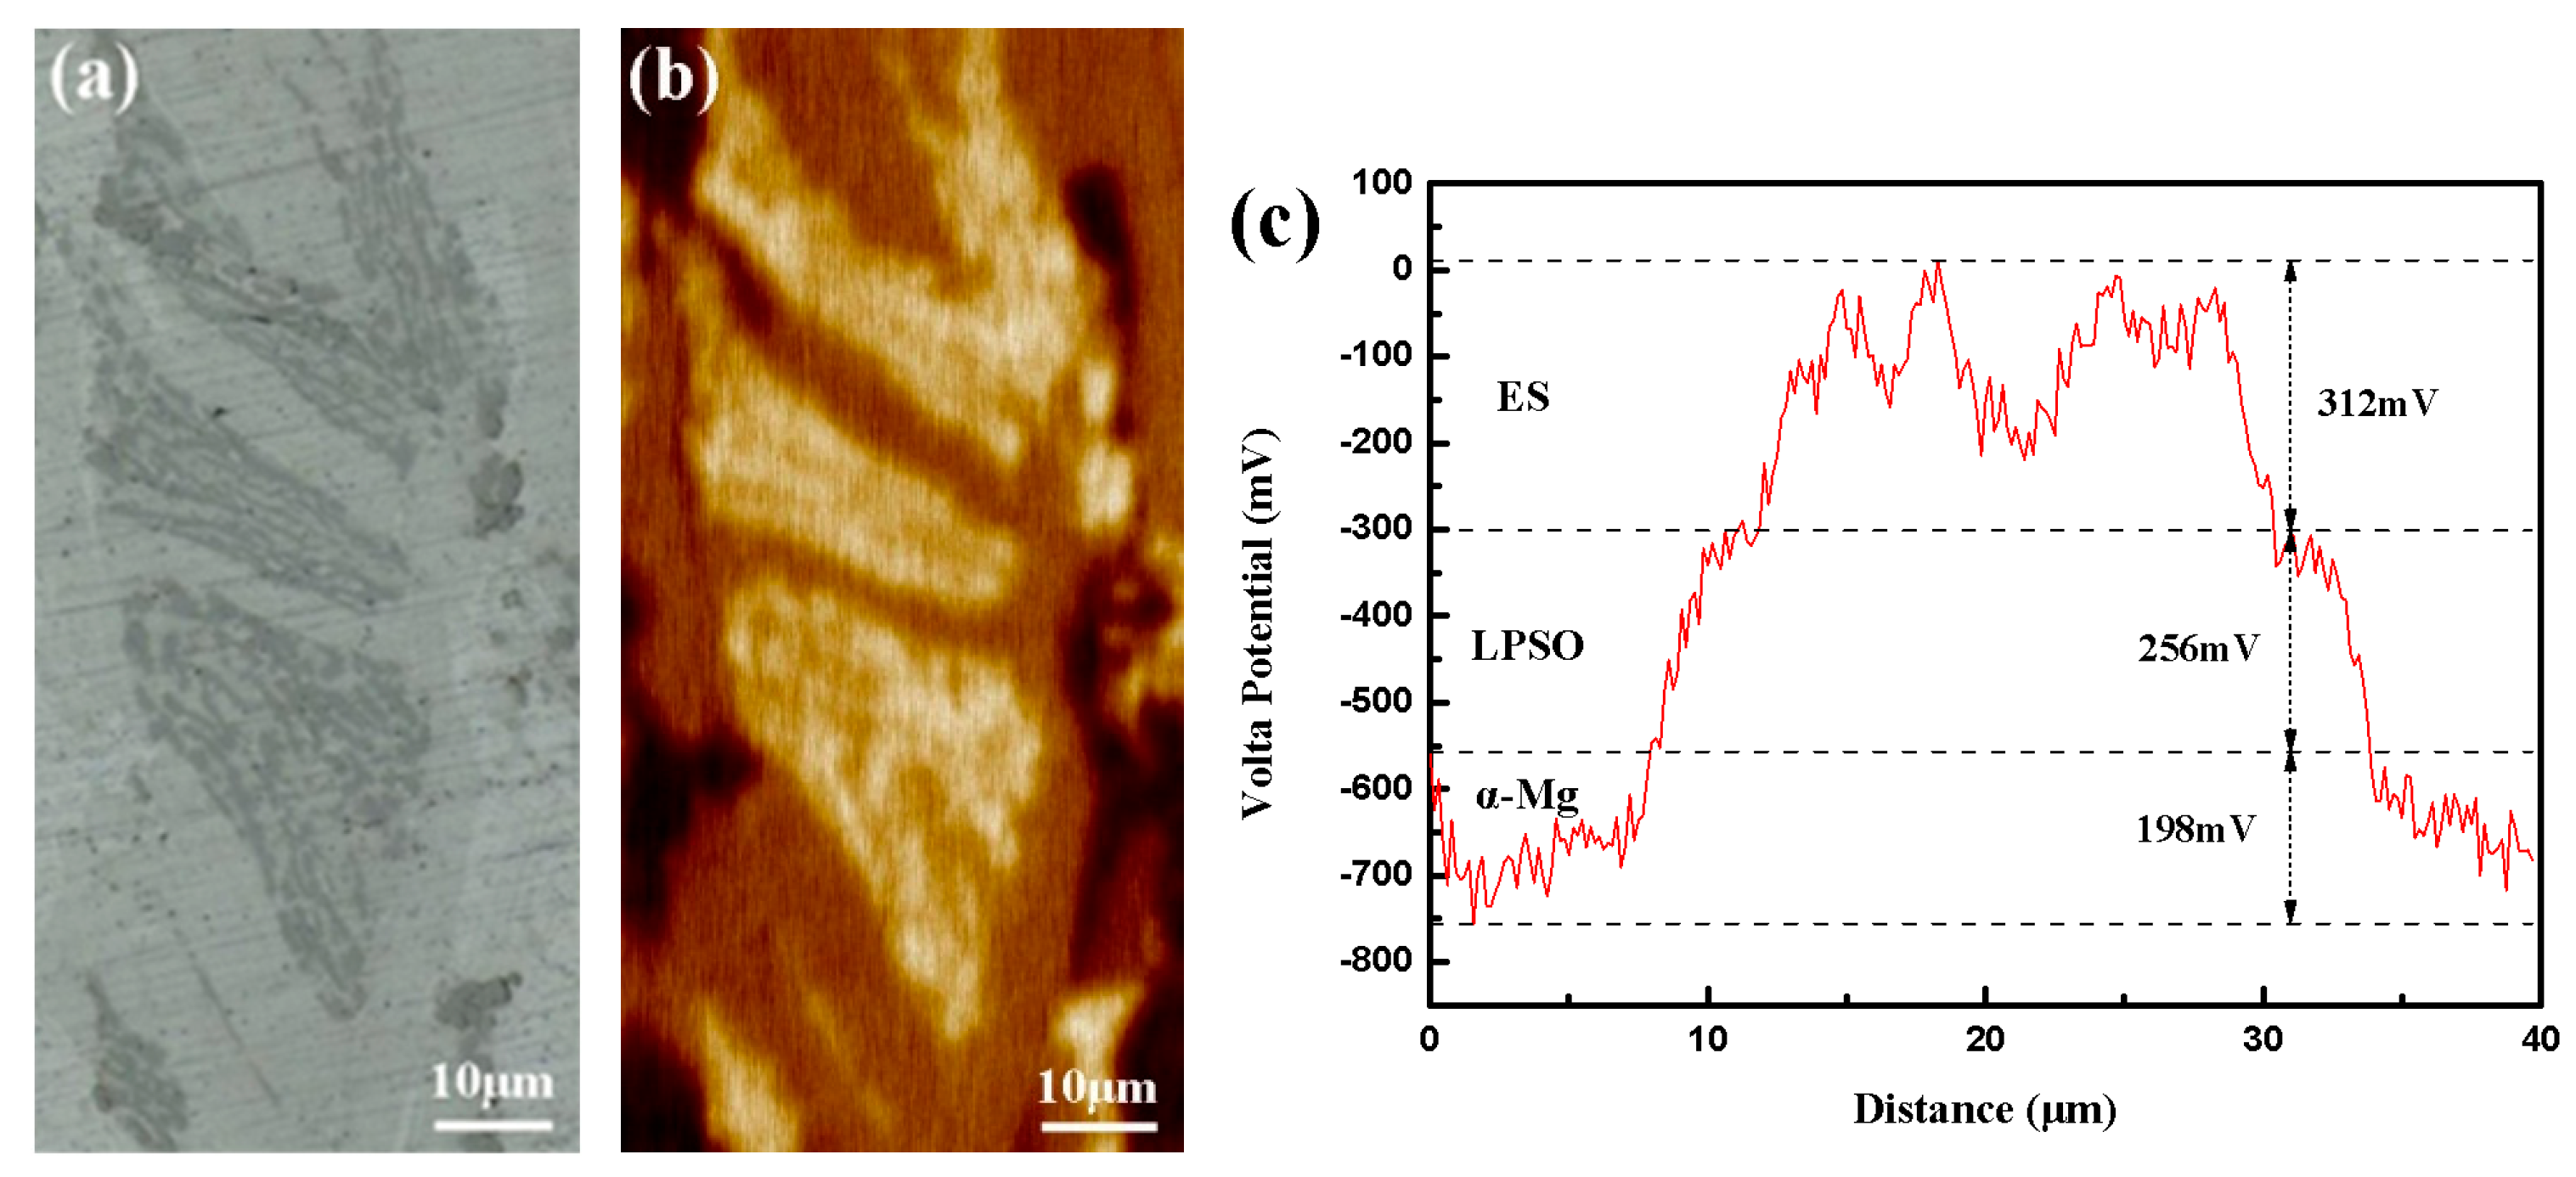
Figure 12.
The target area for immersion experiments. (a) Optical morphology of SKPFM testing area, (b) SKPFM surface potential map, (c) SKPFM potential line profile.
Figure 13.
Optical morphologies of the sample before (a,b) and after (c,d) electrochemical test.
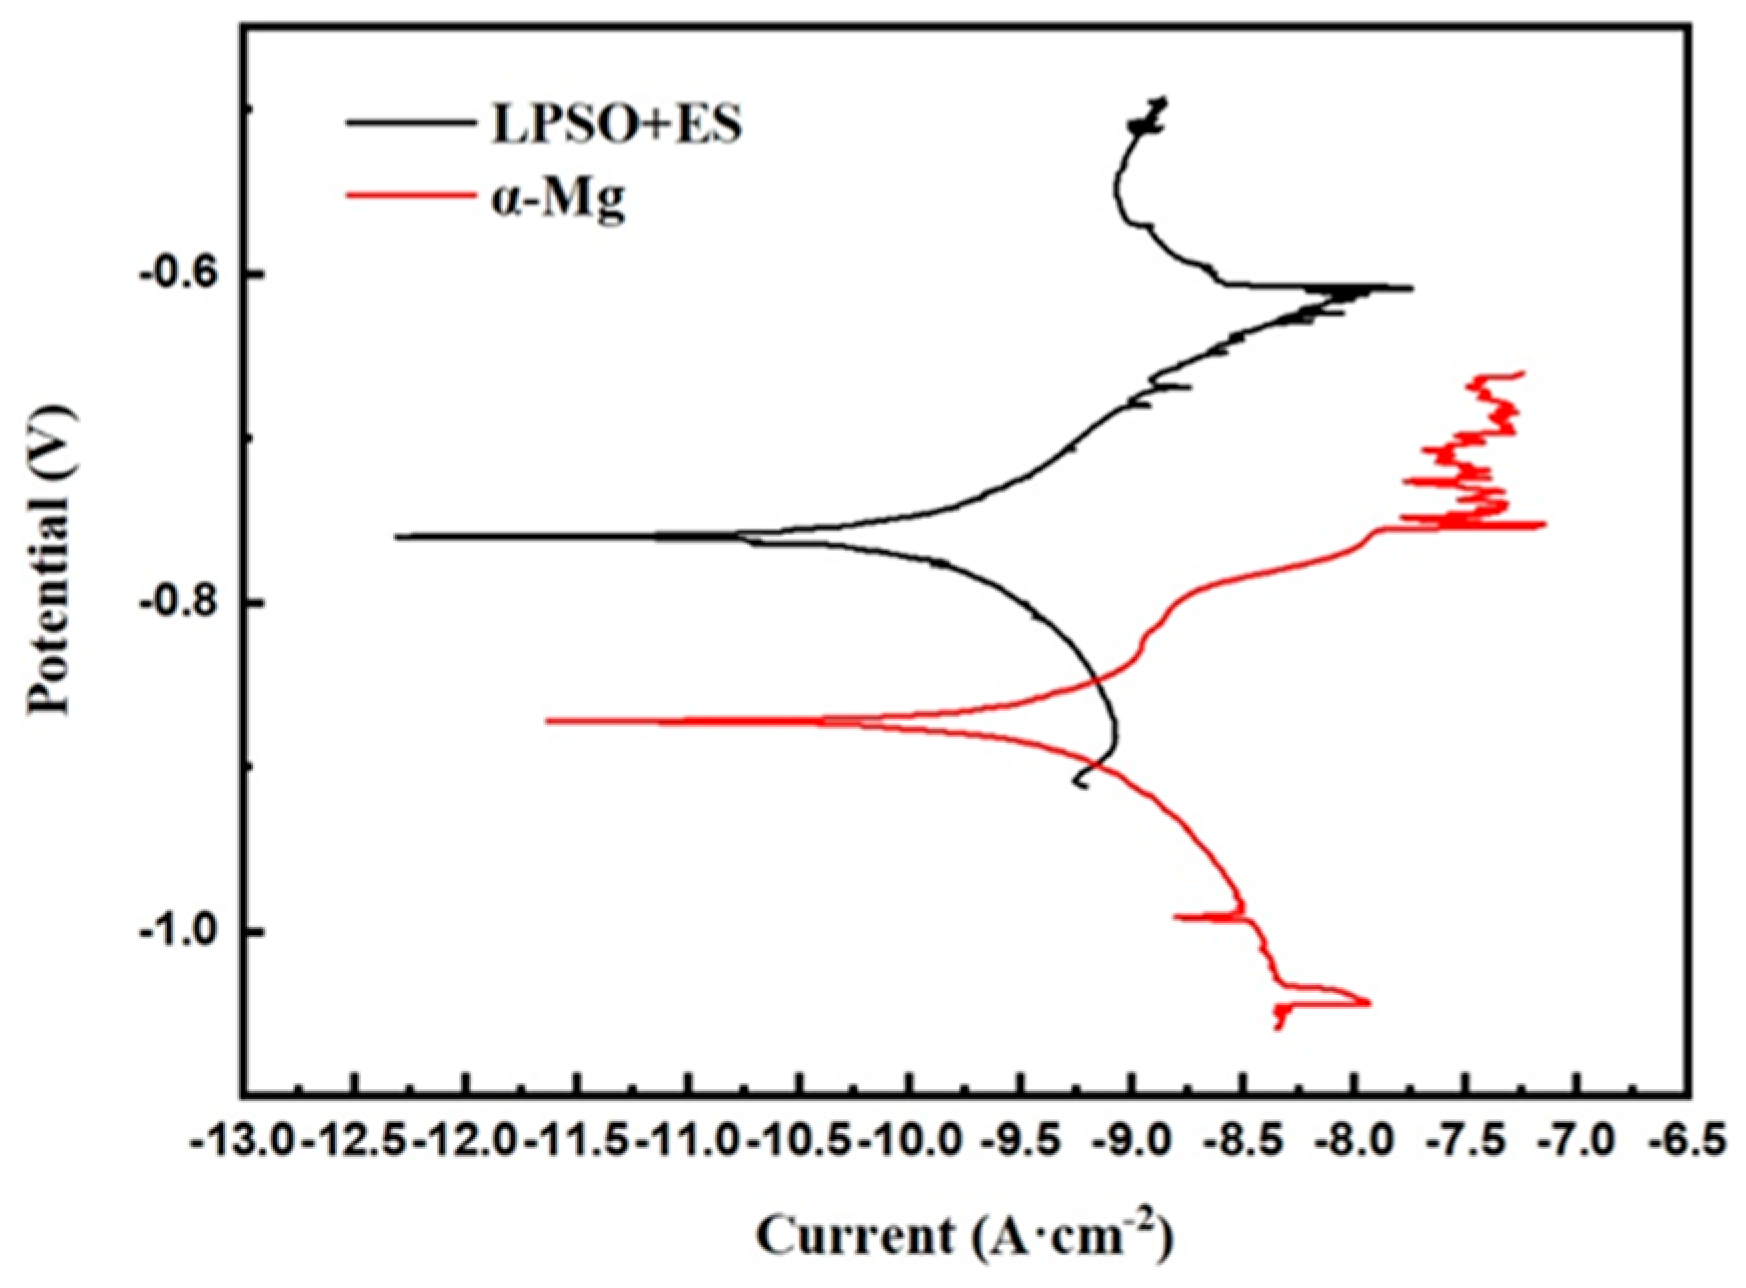
Figure 14.
Micro-electrochemical potentiodynamic polarization curves.
Table 1.
Chemical compositions of the alloys determined by ICP.
| Nominal Composition | Actual Composition(wt.%) |
|---|
| Mg-5Gd-6Ni-1Y (wt.%) | Mg | Gd | Ni | Y |
| Balance | 5.32 | 6.85 | 0.78 |
Table 2.
Corrosion properties of the alloys.
| Alloy | Ecorr (VSCE) | Icorr (μA·cm−2) |
|---|
| 561 | −1.43 | 3811.94 |
A561
E561 | −1.41
−1.38 | 2496.99
2993.43 |
| Disclaimer/Publisher’s Note: The statements, opinions and data contained in all publications are solely those of the individual author(s) and contributor(s) and not of MDPI and/or the editor(s). MDPI and/or the editor(s) disclaim responsibility for any injury to people or property resulting from any ideas, methods, instructions or products referred to in the content. |
© 2023 by the authors. Licensee MDPI, Basel, Switzerland. This article is an open access article distributed under the terms and conditions of the Creative Commons Attribution (CC BY) license (https://creativecommons.org/licenses/by/4.0/).


