Article

Tensile and Fracture Characteristics of 304L Stainless Steel at Cryogenic Temperatures for Liquid Hydrogen Service

Department of Reliability Assessment, Korea Institute of Machinery and Materials, Daejeon 34103, Republic of Korea
*
Author to whom correspondence should be addressed.
Metals 2023, 13(10), 1774; https://doi.org/10.3390/met13101774
Submission received: 2 September 2023 / Revised: 11 October 2023 / Accepted: 18 October 2023 / Published: 19 October 2023

Abstract

:
As the urgency for carbon-neutral fuels grows in response to global warming and environmental pollution, liquid hydrogen, with its high energy density, emerges as a promising candidate. Stored at temperatures below 20 K, liquid hydrogen’s containment system requires materials resilient to such cryogenic temperatures. Austenitic stainless steel, including 304L grade, has been widely used due to its favorable properties. However, designing pressure vessels for these systems necessitates a deep understanding of fracture mechanics and accurate assessments of the material’s fracture toughness at cryogenic temperatures. The mechanical behavior at these temperatures differs significantly from that at room temperature, making testing at 20 K a complex procedure that requires stringent facilities. This study examines the tensile behavior and fracture toughness of 304L stainless steel at cryogenic temperatures, comparing and analyzing the characteristics observed at 20 K with those at room temperature. The phenomenon of discontinuous yield, with abrupt stress drops and stepwise deformation at low temperatures, has been identified, resulting in more complex stress–strain curves. Limitations were found in the calculation of the crack length during the assessment of fracture toughness in stainless steel under extremely low-temperature environments through the J-integral compliance method. To address these constraints, a comparative analysis was carried out to determine potential corrective measures.

1. Introduction

The need for carbon-neutral fuels is escalating in order to address global warming and environmental pollution issues. One such promising candidate is hydrogen, which serves as an energy carrier without the undesirable consequence of greenhouse gas emissions, thus its growing interest in the field [1,2,3]. In order to convert the current energy source used in industry to hydrogen, it is necessary to store large quantities of hydrogen in confined spaces. Hydrogen is mainly stored by compressing it at high pressures, liquefying it at extremely low temperatures, or storing it in metal hydrides [3,4]. Among various methods, cryogenic liquid-hydrogen storage stands out due to its unparalleled energy density and storage efficiency [5,6,7]. From the viewpoint of a completely cyclical system, wherein liquid hydrogen acts as a working substance in enclosed chemical and thermodynamic cycles, it emerges as an ideal fuel. Given that liquid hydrogen has three times the energy per unit weight compared to gasoline or other hydrocarbon fuels, it is particularly advantageous for aircraft and long-distance terrestrial transportation. For these reasons, it has been technically confirmed since the 1970s that liquid hydrogen can be used as a fuel for terrestrial and aircraft use [8].
Austenitic stainless steel has so far been employed in cryogenic-temperature and hydrogen applications due to its excellent mechanical properties in such environments [9]. However, there is a need to enhance cost-effectiveness, either by substituting with more affordable materials or by developing improved welding techniques. In the context of mobile liquid-hydrogen storage systems, particularly in marine settings, the design of a large capacity and efficient storage system is imperative. Following pressure vessel design principles that require a fracture-mechanics-based approach, it is critical to perform cryogenic testing to evaluate fracture toughness. However, assessing tensile behavior and fracture toughness in a liquid-hydrogen atmosphere presents significant challenges. This is due to unique phenomena such as hydrogen embrittlement in a hydrogen environment and discontinuous yielding at cryogenic temperatures. It is necessary to investigate how these phenomena influence tensile behavior and fracture toughness.
First, metallic materials should be carefully selected to ensure compatibility and safety in hydrogen-related applications. Several factors need to be considered when dealing with metals in a hydrogen environment, such as hydrogen embrittlement, permeation, and diffusivity. Hydrogen embrittlement is a phenomenon where hydrogen diffuse into the metal lattice, leading to a decrease in crack resistance. This phenomenon depends on three main factors: the hydrogen environment, material characteristics, and applied stress. Previous studies have shown that the effect of hydrogen embrittlement is negligible at liquid-hydrogen temperatures [10,11,12,13]. This can be attributed to the reduced mobility of hydrogen atoms in extremely low-temperature environments and changes in the thermal properties of the metal. Thus, materials for liquid-hydrogen service are primarily studied in environments simulated by temperature alone [14,15,16]. Interestingly, a low strain rate is required to evaluate the effects of extreme-low-temperature and hydrogen environments. In an extremely low-temperature environment, a high strain rate raises the temperature of the test specimen, rendering the test invalid. For the evaluation of hydrogen effects, the slow diffusion of hydrogen atoms limits the strain rate to less than 2.0 × 10⁻⁵ s−1 [17].
Cryogenic liquid hydrogen, which must be stored below 20 K, brings accompanying insulation issues. Due to the evaporation problem of liquid hydrogen, hydrogen has typically been stored and transported as a compressed gas through pipelines and mobile applications [18,19,20]. Besides insulation issues, liquid-hydrogen storage systems must be able to withstand extremely low temperatures, and hydrogen resistance is also required. Unlike at room temperature, a somewhat different physical phenomenon can be observed in extreme-low-temperature environments below 20 K. As metal deforms at cryogenic temperatures, temperature increases are observed along with sudden stress drops, like serration, a phenomenon known as discontinuous yielding or discontinuous plastic flow. Until recently, the mechanism of discontinuous yielding at low temperatures has been primarily explained by mechanical instability and thermodynamic instability [21]. Obst and Nyilas proposed that the cause of discontinuous yielding is the creation of lattice barriers for dislocation motion [22,23]. The pile-ups of dislocations on the internal barriers in the lattice may lead to stress concentrations. Once these internal barriers are broken, there is a spontaneous generation of dislocations, which gives rise to load drops. Basinski (1957) proposed a thermodynamic approach, considering that both the specific heat and thermal conductivity approach zero with decreasing temperature [24]. On the basis of the adiabatic heating hypothesis, any rapid dissipative process occurring at extremely low temperatures leads to an increase in the local temperature, which subsequently results in a dramatic decrease in the flow stress. Recently, it has been revealed that the accumulation of dislocations and the failure of lattice barriers, as well as the adiabatic heating, leads to substantial temperature rise [25,26]. The primary reason for the increase in temperature is the dissipation of plastic power in the course of the drop of stress, leading to heat generation. Ultimately, this temperature rise plays a crucial role in stress relaxation. Commonly observed in FCC metals, as the deformation rate increases, the localized temperature rise also intensifies, causing this phenomenon to temporarily disappear. In general, this is a phenomenon that occurs in FCC metals. When the strain rate increases, the local temperature rise also expands, and the phenomenon temporarily disappears [27]. For these reasons, ASTM E1450 stipulates limits on the strain rate during tensile testing [28]. To ensure the maintenance of target temperatures following a rapid temperature rise due to discontinuous yielding at ultra-low temperatures, it is necessary to control displacement at the slowest possible rate [28,29,30,31].
The unique behaviors observed at cryogenic temperatures are not confined to tensile tests. In such conditions, when performing the compliance method, phenomena may occur where the measured crack length appears to decrease and variations in calculated crack lengths can be observed, regardless of the testing equipment’s precision. Weiss and Nyilas (2006) explained that such phenomena occur due to the development of a plastic zone beyond the crack tip, which leads to a reduction in compliance and thereby gives the appearance of a decreasing crack length [32]. This is referred to as apparent negative crack growth [32,33]. One proposed method to correct this issue is the offset technique, which involves shifting the smallest measured negative growth crack length to align with the blunting line [34]. In the Japanese standard for fracture-toughness tests in liquid-helium environments (JIS Z 2284: 1998), it is advised to exclude data that neither align with the blunting line nor stay within the bounds of a 0.2 mm offset line [35]. Nylias et al. (1998) have proposed a method to correct for the phenomena of apparent negative crack growth and scatter at cryogenic temperatures [36]. Their approach involves deriving a second-order polynomial-regression function based on the slope of the load line, or stiffness, as a function of load-line displacement. The point where this function reaches its maximum is considered the initiation point of the crack. The application of second-order polynomial regression for corrections has been adopted in several studies [32,33,36]; however, the absence of a unified procedure and methodology can lead to disparate outcomes contingent on the user.
This study investigates the effects of a 20 K cryogenic environment on the mechanical assessment of metallic materials. A cryostat equipped with a mechanical cryocooler was constructed to establish a cryogenic-temperature environment. Using this setup, the study discusses how tensile testing and fracture-toughness tests at ultra-low temperatures differ in characteristics compared to those conducted at room temperature. Additionally, a comparative analysis of the correction methodologies of the fracture-toughness evaluations in cryogenic environments are carried out.

2. Experimental Procedure

2.1. Material and Specimen

In the present study, the 304L stainless-steel specimens were obtained by processing 13T hot-rolled stainless-steel plates. These steel plates were manufactured in compliance with ASTM A240/240M [37] and were solution-annealed at a minimum of 1040 °C. The chemical composition of the 304L stainless steel is summarized in Table 1.
The centers of the tensile specimens and compact specimens were machined to align with the center of the base material. The direction of the length of the tensile specimen and the notch direction of the compact specimen match the rolling direction of the base material. The detailed dimensions of the tensile and compact specimen are shown in Figure 1. The diameter within the gauge length of the tensile specimen and the parallel section length are 4 mm and 16 mm, respectively. Compact specimens were fabricated to have a width ( W ) of 25.4 mm and thickness ( B ) of 12.7 mm according to ASTM E1820–21 [38]. The length of the fatigue precrack was applied at 5 hz to ensure that the minimum stress intensity factor reached 33 MPa m1/2 for the length ratio of the precrack to the width ( a 0 / W ) to reach 0.6. After the precrack reached the target, a side groove was machined on the compact specimen, and the net thickness ( B N ) was 10.16 mm.

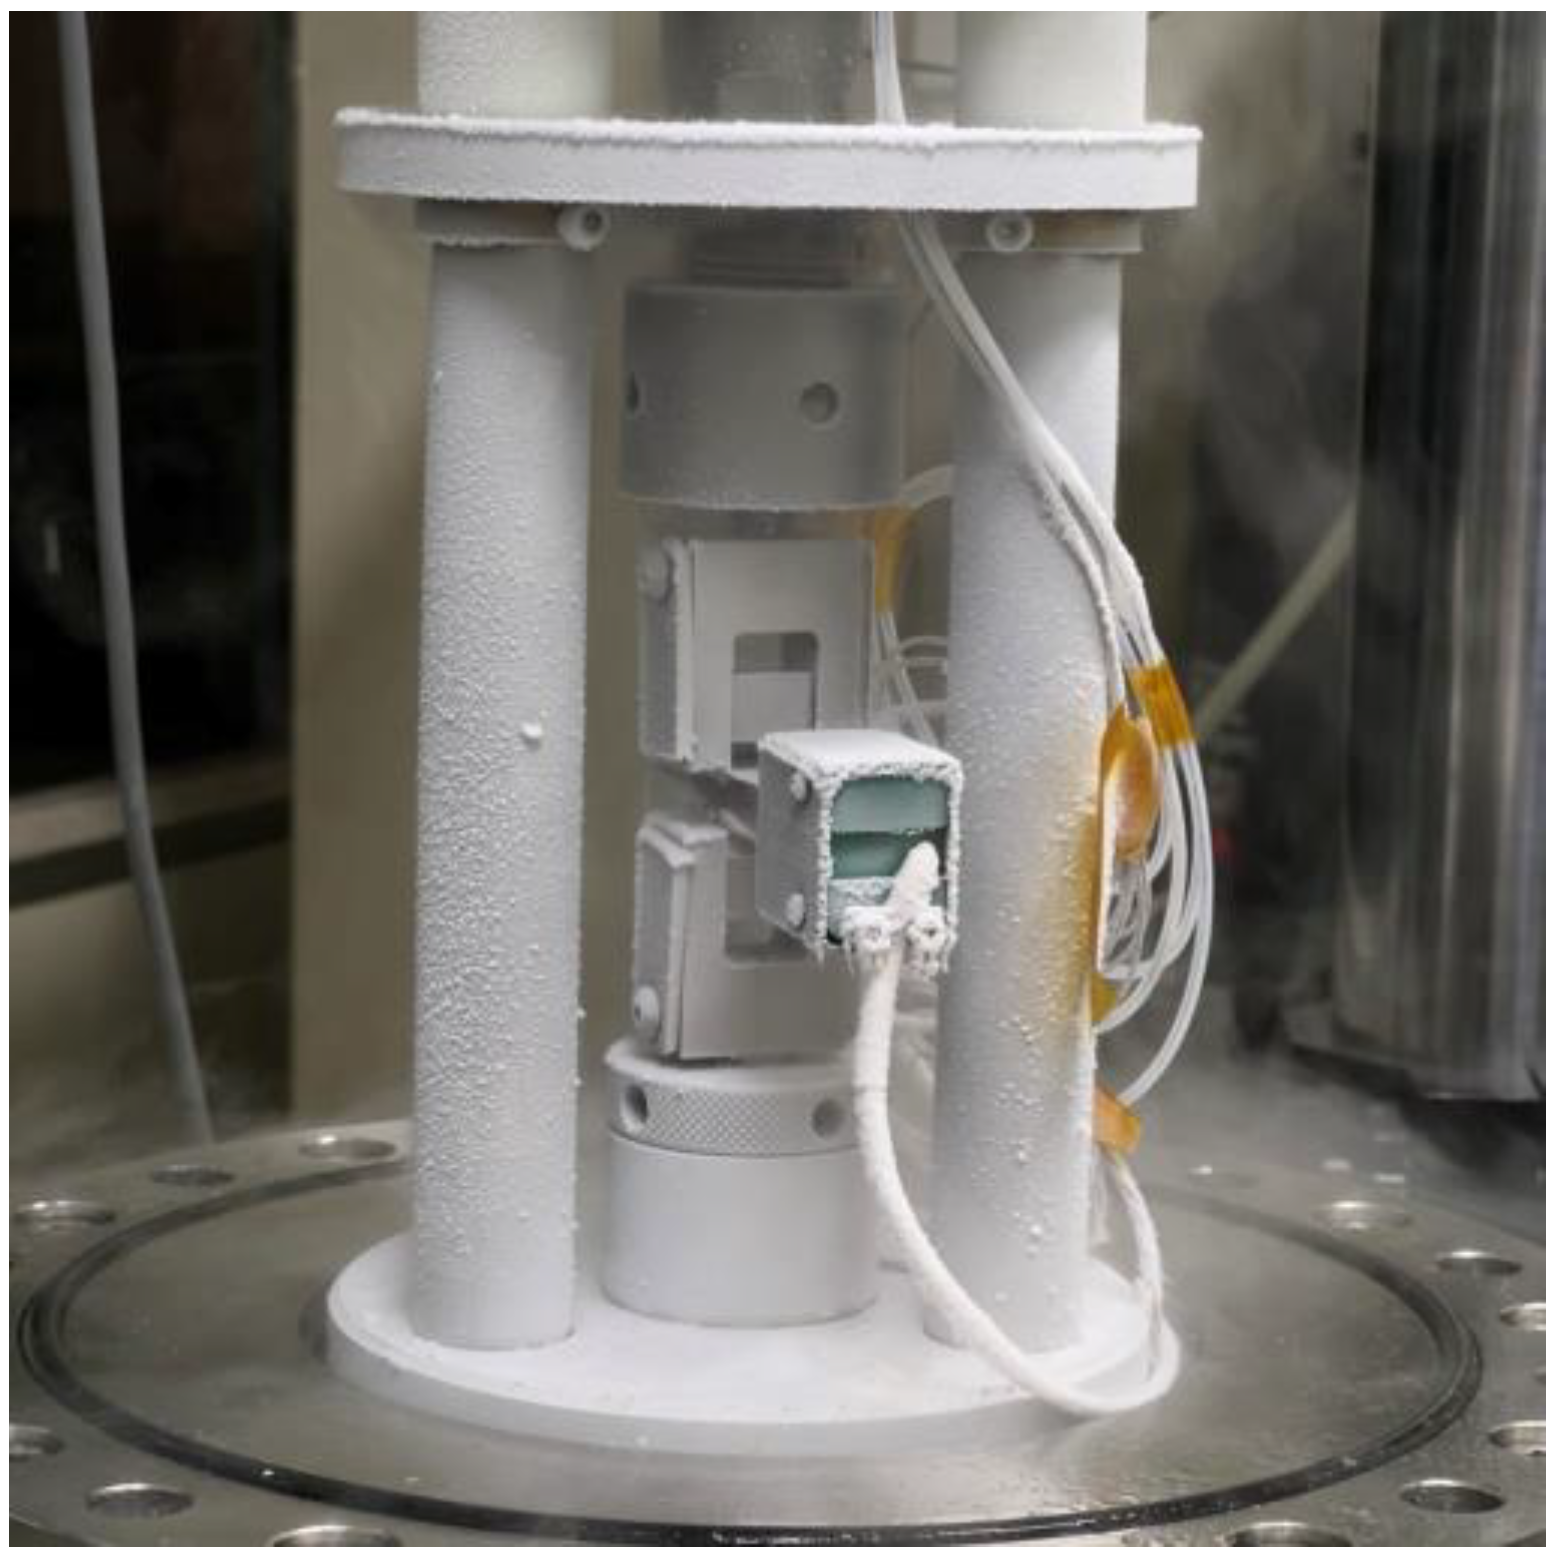
2.2. Experimental Apparatus

To evaluate material performance at extreme-low temperatures, it is necessary to cool down to the target temperature and maintain it. Common methods to create and maintain these low temperatures involve using a coolant like liquid nitrogen or liquid helium. Cooling methods using liquid coolant can reach and maintain the liquid coolant’s vaporization temperature or higher. Considering the cost, liquid nitrogen is mostly used to establish temperatures above 77 K. To reach temperatures below this, liquid or gaseous helium can be adopted. Ogata and Keisuke (1986) proposed a method of cooling the inner wall of a cryostat with a G–M cooler instead of direct cooling with liquid helium [39]. The helium gas inside the cryostat was cooled to 20 K by the convection heat transfer principle within 10 h. The use of a mechanical cooler is relatively inexpensive because it uses very little gaseous helium.
In this study, a fatigue-testing machine equipped with a cryostat capable of cooling and maintaining temperatures up to 20 K was adopted, as shown in Figure 2. Gaseous helium was injected into the cryostat and then cooled to low temperatures using a G–M (Gifford–McMahon) cryocooler (UHE15, ULVAC) attached to the cryostat. The cryostat has a vacuum structure made of 304L stainless steel. The metallic specimen was installed on the specimen grip inside the test vessel. A silicon diode was attached to the tensile support installed to carry a tensile load to the metallic specimen, and the change in resistance according to temperature was measured by Lakeshore’s Model 335. Servo hydraulic load frames (Walter + bai) have a 100 kN static loading capacity and 80 kN dynamic loading capacity.

2.3. Tensile Test

Tensile testing was conducted under displacement control. Plastic deformation and phase transformation of the metal materials lead to a notable increase in heat generation as the strain rate escalates [40]. Importantly, this heat generation associated with the strain rate is not confined to ambient environments but also occurs at cryogenic temperatures [28,29,41]. Therefore, to continuously maintain the target temperature during the mechanical-performance evaluation at extreme-low temperatures, it is not only important to keep the surrounding environment of the test specimen at a constant temperature, but also to minimize the temperature increase due to the deformation of the specimen. If the displacement control speed is too fast in a cryogenic environment, even though the specimen has reached 4 K or 20 K, the temperature may rise rapidly and produce test results similar to 77 K [42].
For this reason, ASTM E1450 limits the strain rates during cryogenic tensile testing [28]. In tensile testing at cryogenic temperatures, it is necessary to control the displacement at as slow a rate as possible to suppress the accumulation of temperature rise caused by the discontinuous yielding of the specimen [29,30,31]. Ogata (2014) recommended cryogenic tensile testing at strain rates lower than 3 × 10⁻³ s−1. Thus, to minimize the heat generation of the specimen at cryogenic temperatures, the crosshead control speed was set to 0.03 mm per minute. This corresponds to an initial strain rate of 5.0 × 10⁻⁵ s−1, which is significantly below the 1.0 × 10⁻³ s−1 suggested by ASTM E1450 [28], the standard for tensile testing in a liquid-helium environment.
The measurement of deformation of the tensile test specimen was carried out using the Epsilon’s Model 3442 with a gauge length of 10 mm. All testing commenced 30 min after the prescribed target temperature was achieved. The target temperatures were 20, 77, and 300 K. The entire testing procedure adhered to ASTM E8/E8M [43]. All experimental results were obtained from a single test specimen.

2.4. Fracture Mechanics Test

In this study, the unloading compliance method was adopted to analyze the temperature-dependent fracture-toughness characteristics of a single specimen. The unloading compliance method can predict the current crack length and fracture toughness as the slope of an unloading/reloading cycle performed at regular and equally spaced displacement intervals. This method is particularly useful for materials that exhibit stable crack growth prior to fracture. According to ASTM E1820–21, fracture toughness is expressed as a J-integral, which represents the force required to propagate a crack [38]. In this study, for the compact specimen at a point corresponding to v and P on the specimen force versus the load-line displacement record, the J -integral was calculated as follows:
J = J e l + J p l
J e l = K 2 1 ν 2 E
J p l = η p l A p l B N b 0
where J e l and J p l are the elastic and plastic component of the J-integral, respectively; K is the stress-intensity factor, which represents the magnitude of the ideal crack-tip stress field (stress-field singularity) for a particular mode in a homogeneous, linear elastic body; ν and E is Poisson’s ratio and the elastic modulus, respectively; A p l is the plastic area under the load–displacement curve; η p l is the geometry factor, dependent on a / W . For the compact specimen, Clarke and Landes obtained an approximate fitted function of η p l ( = 2 + 0.522 b 0 / W ) [44]. B N is the net specimen thickness. b 0 is the remaining ligament ( W a 0 ). For the compact specimen at force P ( i ) , the stress-intensity factor is calculated as follows:
K = P i B B N W 1 2 f a i W
f a i W = 2 + a i W 0.886 + 4.64 a i W 13.32 a i W 2 + 14.72 a i W 3 5.6 a i W 4 1 a i W 3 / 2
The crack length of a compact specimen with the crack-opening displacement measured on the load line was calculated according to A2.13 in ASTM E1820–21 as follows [38]:
a i W = 1.000196 4.06319 u + 11.242 u 2 106.043 u 3 + 464.355 u 4 650.677 u 5
u = 1 B e E C c ( i ) 1 2 + 1
where C c ( i ) is the specimen load-line crack-opening elastic compliance ( v / P ) on an unloading/reloading sequence corrected for rotation, and B e is the effective thickness for the side-grooved specimens ( B B B N 2 / B ).
The calculation of the crack size in elastic compliance followed the recommendations of Appendix X3 of ASTM E1820–21: only the unloading portion of each cycle was used, and the first and last 5% of the unloading portion were excluded from the linear regression [38]. The displacement increment during loading and unloading was 0.005 b 0 (0.05 mm), as recommended by A8.2.3 in ASTM E1820–21 [38], while the crosshead was displacement-controlled at a rate of 0.001 mm/s. Crack-opening displacement measurements were made using an Epsilon Model 3541. Testing was performed at 20, 77, and 300 K. After the completion of the test, thermal heat-tint was performed for about 2 h at 250 °C to identify the part where the cracking progressed. All experimental results were obtained from a single test specimen.
The scattering of compliance and crack length at cryogenic temperatures has a considerable impact on the resulting JR curve and JIC acquisition. Various methods have been proposed to correct for the scattering and decrease in crack length that occur during evaluations of fracture toughness at cryogenic temperatures. Seok (2000) proposed an offset technique based on the fact that the apparent negative crack-extension point during the blunting process should be on the blunting line [34]. Along the crack-extension direction, all JR curves are parallel-shifted by the distance from the most negative crack-extension point to the blunting line. The method, hereby referred to as the aggressive-exclusion technique, involves disregarding data that do not align with the blunting line and even exceed the 0.2 mm offset line, as recommended by the Japanese liquid-helium environment fracture-toughness testing standard (JIS Z 2284: 1998). Based on the fact that the stiffness determined by the unloading slope begins to decrease only after crack initiation, Nylias et al. (1998) have proposed the correction method for the phenomena of apparent negative crack growth and scatter at cryogenic temperatures using a second-order least-square regression [36]. Therefore, the point of maximum stiffness is shifted parallel to the blunting line. In this process, the utilization of second-order least-square regression allows for effective acquisition of JIC by smoothing the scattered data. The methods primarily proposed for correction can be categorized into three types: the aggressive-exclusion technique, offset technique, and polynomial-regression technique. In this study, fracture toughness is evaluated based on the compliance method in ASTM E1820 [38], with the aim of assessing the effect of applying these three methods to correct for the scattering and reduction in crack length observed during evaluations at cryogenic temperatures.

3. Results and Discussion

3.1. Tensile Behavior

The stress–strain curve corresponding to the different temperatures is illustrated in Figure 3a. The tensile properties at room and extreme-low temperatures are summarized in Table 2. A smooth flow stress was observed during the tensile test at 300 K. At both 20 K and 77 K, discontinuous yielding was noted, with the stress drop at 77 K being notably less severe than at 20 K. This discontinuous yielding leads to a stepwise increase in displacement due to an abrupt stress drop. The phenomenon of discontinuous yielding primarily prompts a sudden stress drop and temperature rise as the FCC metals deform at extremely low temperatures. This manifestation varies depending on the test temperature, deformation rate, and the material in question [21,31]. At 20 K, a reduction in the strain measured in the extensometer resulted in a tangled stress–strain curve [45]. A more detailed explanation of this will be presented later.
Figure 4 illustrates the force and displacement time history of a tensile specimen at 77 K and 300 K. At first glance, no stepwise increase in displacement, a phenomenon characteristic of serration, is observed at 77 K. In Figure 4b, a stepwise increase in displacement due to serration is observed from the end of the elastic section. The increment of displacement measured by the extensometer was small due to a very minimal stress drop. As shown in Figure 4c, a stepwise increase in displacement due to a stress drop is also observed in the yield plateau. This phenomenon was similarly observed in the necking region. In contrast, as depicted in Figure 4d, no stress drop and stepwise increase in displacement were observed at 300 K. In the previous studies, no discontinuous yielding was observed in the tensile test of 304L stainless steel at 77 K [10,14,33]. Discontinuous yielding was observed in the 304L stainless steel during tensile testing at a strain rate of 4.0 × 10⁻⁴ s−1, even at a temperature as low as 30 K [14]. Furthermore, when tested at 4 K, the extent of discontinuous yielding in austenitic stainless steel exhibited variability depending on the strain rate [46]. The increase in the strain rate of the tensile test can induce a localized temperature rise, causing the discontinuous-yielding phenomenon to temporarily disappear.
Figure 5 displays the force and displacement, measured by an extensometer, time history at 20 K. Similar to observations at 77 K, serration began after the elastic region even at 20 K. Just before reaching the yield plateau, a momentary smooth segment of the flow stress appeared, where the stepwise increase in displacement measured by the extensometer disappeared. From around the 40 min mark, an increase in the amount of displacement corresponded with the amplification of the stress drop. The tangled phenomenon in the stress–strain relationship at 20 K, mentioned earlier, was induced by the strain drop In Figure 5c,d. This is because the formation of slip bands occurs randomly, unlike at room temperature [31]. According to previous research, slip bands also form outside the gauge-length range of the test specimen, leading to a decrease in the measured displacement. In Figure 5c,d, the stress drop appears as a combination of small and large types. The large type is characterized by a large stress drop and an increase in the measured displacement. The range of the large type stress drop at the yield plateau (Figure 5d) is further expanded compared to the necking region (Figure 5c). In this study, at 20 K, a mixed form of large- and small-type discontinuous yielding was observed, whereas at 77 K, only small-type discontinuous yielding was observed.
The temperature-dependent fracture morphology analysis of the fractured tensile specimens is illustrated in Figure 6 using SEM. As the temperature decreases, there is a noticeable reduction in the cross-sectional area after fracture. At 300 K, a cup–cone shape, which is typical evidence of ductile fracture, is observed. The fibrous zone and the shear-lip zone are clearly distinguished. In the SEM image, the dimples were distributed in both the fibrous zone and the shear-lip zone. The main fracture mechanism observed in the tensile specimens at 300 K was microvoid coalescence.
At 77 K, splitting at the center of fracture surface is observed. The split occurrence, which is mainly found at low temperatures, is related to the high-stress triaxiality state, leading to the breakage of material weak interfaces oriented parallel to the rolling direction [47,48,49]. Numerous dimples were observed on the fracture surface, and along the propagated crack, dominant dimples coexisted with evidence of cleavage fracture. At 20 K, the fibrous zone was not observed, but only the shear-lip zone appearing at the edge of the 300 K tensile specimen was observed. The SEM image revealed a mixed distribution of both fine and coarse dimples.

3.2. Fracture Toughness

The load and displacement relationships obtained through the unloading compliance method at 20 K are shown in Figure 7. A force drop due to discontinuous yielding was observed during the unloading compliance test for the 20 K and 77 K cryogenic environment, as in the tensile test. To individually evaluate the load and displacement, the load and displacement time histories for specific periods are illustrated in Figure 8. No serration occurs during the unloading sequence. During reloading, the force drop occurred only when the previous peak load was exceeded. This is because discontinuous yielding is also associated with the dislocation motion [22,23]. As depicted in the time history of the load and crack-opening displacement in Figure 8, each load reduction is accompanied by a stepwise increase in the crack-opening displacement, which momentarily jumps before returning to its original position. This phenomenon manifests as a tangled-thread-like appearance in the enlarged portion of the load- and crack-opening displacement graph in Figure 7b. Additionally, as the unloading compliance tests in this study were conducted under displacement control, the momentary increase in the crack-opening displacement resulted in irregular initiation points for the unloading sequence. This phenomenon was not observed at 300 K.
The compliance according to the crack-opening displacement was calculated through the slope in all unloading sequences, and the estimated compliance is shown in Figure 9. An irregular compliance is observed at cryogenic temperatures compared to room temperature. The irregular and scattered compliance at cryogenic temperatures has been previously reported in the literature [36]. To correct for these issues, the polynomial technique mentioned in Section 2 was applied to the unloading slope. The rotation-corrected compliance was calculated using the unloading slope applied with the polynomial-regression technique, and is represented by the solid line in Figure 9. The estimated compliance at all temperatures was slightly scattered, with frequent observations of increases and decreases in the compliance. Notably, at 77 K, the estimated compliance displayed a substantial, repetitive pattern of increase and decrease until the crack-opening displacement reached 1.5 mm.
The relationship between the J-integral and crack extension in accordance with temperature is shown in Figure 10. The black circle represents the dataset to which the polynomial-regression technique has been applied in the unloading slope. The black solid line and black dotted solid line, respectively, illustrate the power-law fitting ( J = C 1 a C 2 ) within the region of qualified data for the untreated dataset and the dataset with the polynomial-regression technique applied. The gray dotted line represents, from left to right, the construction line, 0.15 mm exclusion line, 0.2 mm offset line, and 1.5 mm exclusion line, in that order. An improved a 0 q was derived to calculate the crack extension according to the initial crack size, as per A9.1 of ASTM E1820–21 [38], and is summarized in Table 3. At 300 K, there were approximately two instances of crack-length increase and decrease due to apparent negative crack growth around the blunting line. Nevertheless, the resistance curve at 300 K for the untreated data exhibited a similar trend to that of data processed using a polynomial-regression technique. As a result, the intersection point between the two power-law curves and the 0.2 mm offset line was quite close. At 77 K and 20 K, the data of the JR curve were significantly scattered due to the variation in the estimated compliance. In the resistance curve, numerous data points were observed to deviate significantly from the blunting line. Although ASTM E1820 defines the region of qualified data as being within two exclusion lines [38], the region of qualified data presented in Figure 10b,c includes only the final continuous dataset where the crack extension occurs consistently between the two exclusion lines. The coefficient of the power law in accordance with the testing temperature and correction method is listed in Table A1.
Table 4 summarizes the JIC values corresponding to aggressive-exclusion techniques, polynomial-regression techniques, and the corrected a 0 q at testing temperatures. The utilization of offset techniques was not employed in this study, as they are only applicable when a vertex maximum exists in the stiffness or compliance data derived from polynomial-regression techniques. Instead, the influence of applying the corrected a 0 q to second-order polynomial-regression data was examined. In the absence of the corrected a 0 q , the respective a 0 values at 300 K, 77 K, and 20 K are 15.34 mm, 15.92 mm, and 15.61 mm. In the dataset where neither regression techniques nor exclusion techniques were applied, no change in JIC values was observed at 300 K. However, compared to when applying the exclusion technique, a reduction of 58% and 13.8% was observed in the JIC values at 77 K and 20 K, respectively. When utilizing regression techniques on corrected data, the application of the corrected a 0 q showed differences of 4.1%, 13.9%, and 6.9% compared to the untreated data at 300 K, 77 K, and 20 K, respectively. However, when a 0 was adopted without applying the corrected a 0 q , a reduction of 0.6%, 41.8%, and 34.4% was observed in JIC values at each respective temperature. At 300 K, the J-integral and crack-extension data were concentrated along the blunting line. When the data were not dispersed, the application of the corrected a 0 q did not yield any significant difference. However, for the scattered data at 77 K and 20 K requiring an exclusion technique, the resistance curve was closer to the untreated data when both the regression technique and the corrected a 0 q were applied. As shown in Table 4, the JIC values obtained by adhering to the ASTM E1820 standard without implementing the exclusion technique [38] were similar to the values from the corrected data using the regression technique without incorporating the corrected a 0 q . In this study, the JIC values determined through the introduction of the exclusion technique were considered to be representative and were compared with previous research, as summarized in Appendix B.
Figure 11 represents the fracture surface of the compact specimen after heat-tinting and fracture. The initial crack lengths of the specimens tested at each temperature are listed in Table 3. Furthermore, in Figure 11, a variety of numerous secondary cracks perpendicular to the crack-growth direction were observed in the cryogenic compact specimen. Often observed in the toughness tests of hot-rolled steel plates in the T–L and L–T orientations, these secondary cracks are also known by other names, such as splits, separations, and delamination [47]. It is worth noting that these splits mainly arise in metals characterized by a ferrite microstructure or austenite/ferrite phase boundaries, especially those with a banded microstructure [50,51,52,53]. Elaborating on this, Sieurin and Sandström (2006) confirmed that the split propagates through the ferrite phase or ferrite–austenite phase boundaries in a three-point bend specimen at 168 K [54]. The root cause for such splits primarily occurring at low temperatures is attributed to the increase in yield strength at these temperatures, which causes cracks to form only at the weaker interfaces [48]. Delving deeper into the distinctions at different temperatures, at 20 K, the secondary cracks were both deeper and wider as opposed to those at 77 K. Specifically, deep secondary cracks, demarcated by a yellow arrow, emerged predominantly beyond the crack tip, while at 77 K, numerous more diminutive secondary cracks were detected. Neither quantitative comparisons of the length, width, or depth of secondary cracks emerging at different temperatures nor a detailed analysis of the microstructure was undertaken.
Figure 12 presents the SEM image of the fracture surface of the C(T) specimen in accordance with the test temperature. On the fracture surface at 300 K, elongated dimples, indicative of ductile failure, were predominantly observed. For the fracture surfaces at 77 K and 20 K, both dimples on the crack-growth plane and cleavage facets perpendicular to the direction of the crack-growth plane were noted. The size of the dimples on the crack-growth plane visually appeared to be smaller at 20 K compared to 77 K. Figure 12f shows that, at the boundary between the crack-growth plane and secondary cracks, both elongated dimples and cleavage facets were observed in a mixed manner. Figure 12h,I indicates that, at such boundaries, cleavage facets were predominantly observed.

4. Conclusions

In the present study, the impact of a 20 K cryogenic environment on the mechanical evaluation of metallic materials was investigated, and a comparative analysis was conducted on the correction methodologies for fracture-toughness evaluations in cryogenic conditions. This study examines the unique phenomena that occur in 304L stainless steel at cryogenic temperatures and how they affect the fracture-toughness evaluation. Tensile tests and fracture-toughness tests were conducted at room temperature, and at low temperatures of 77 K and 20 K, to analyze how the mechanical behavior at low temperatures differs from that at room temperature. At cryogenic temperature, the 304L stainless steel displayed a distinctly different mechanical behavior and fracture morphology from that at room temperature. The results of this study can be summarized as follows.
-
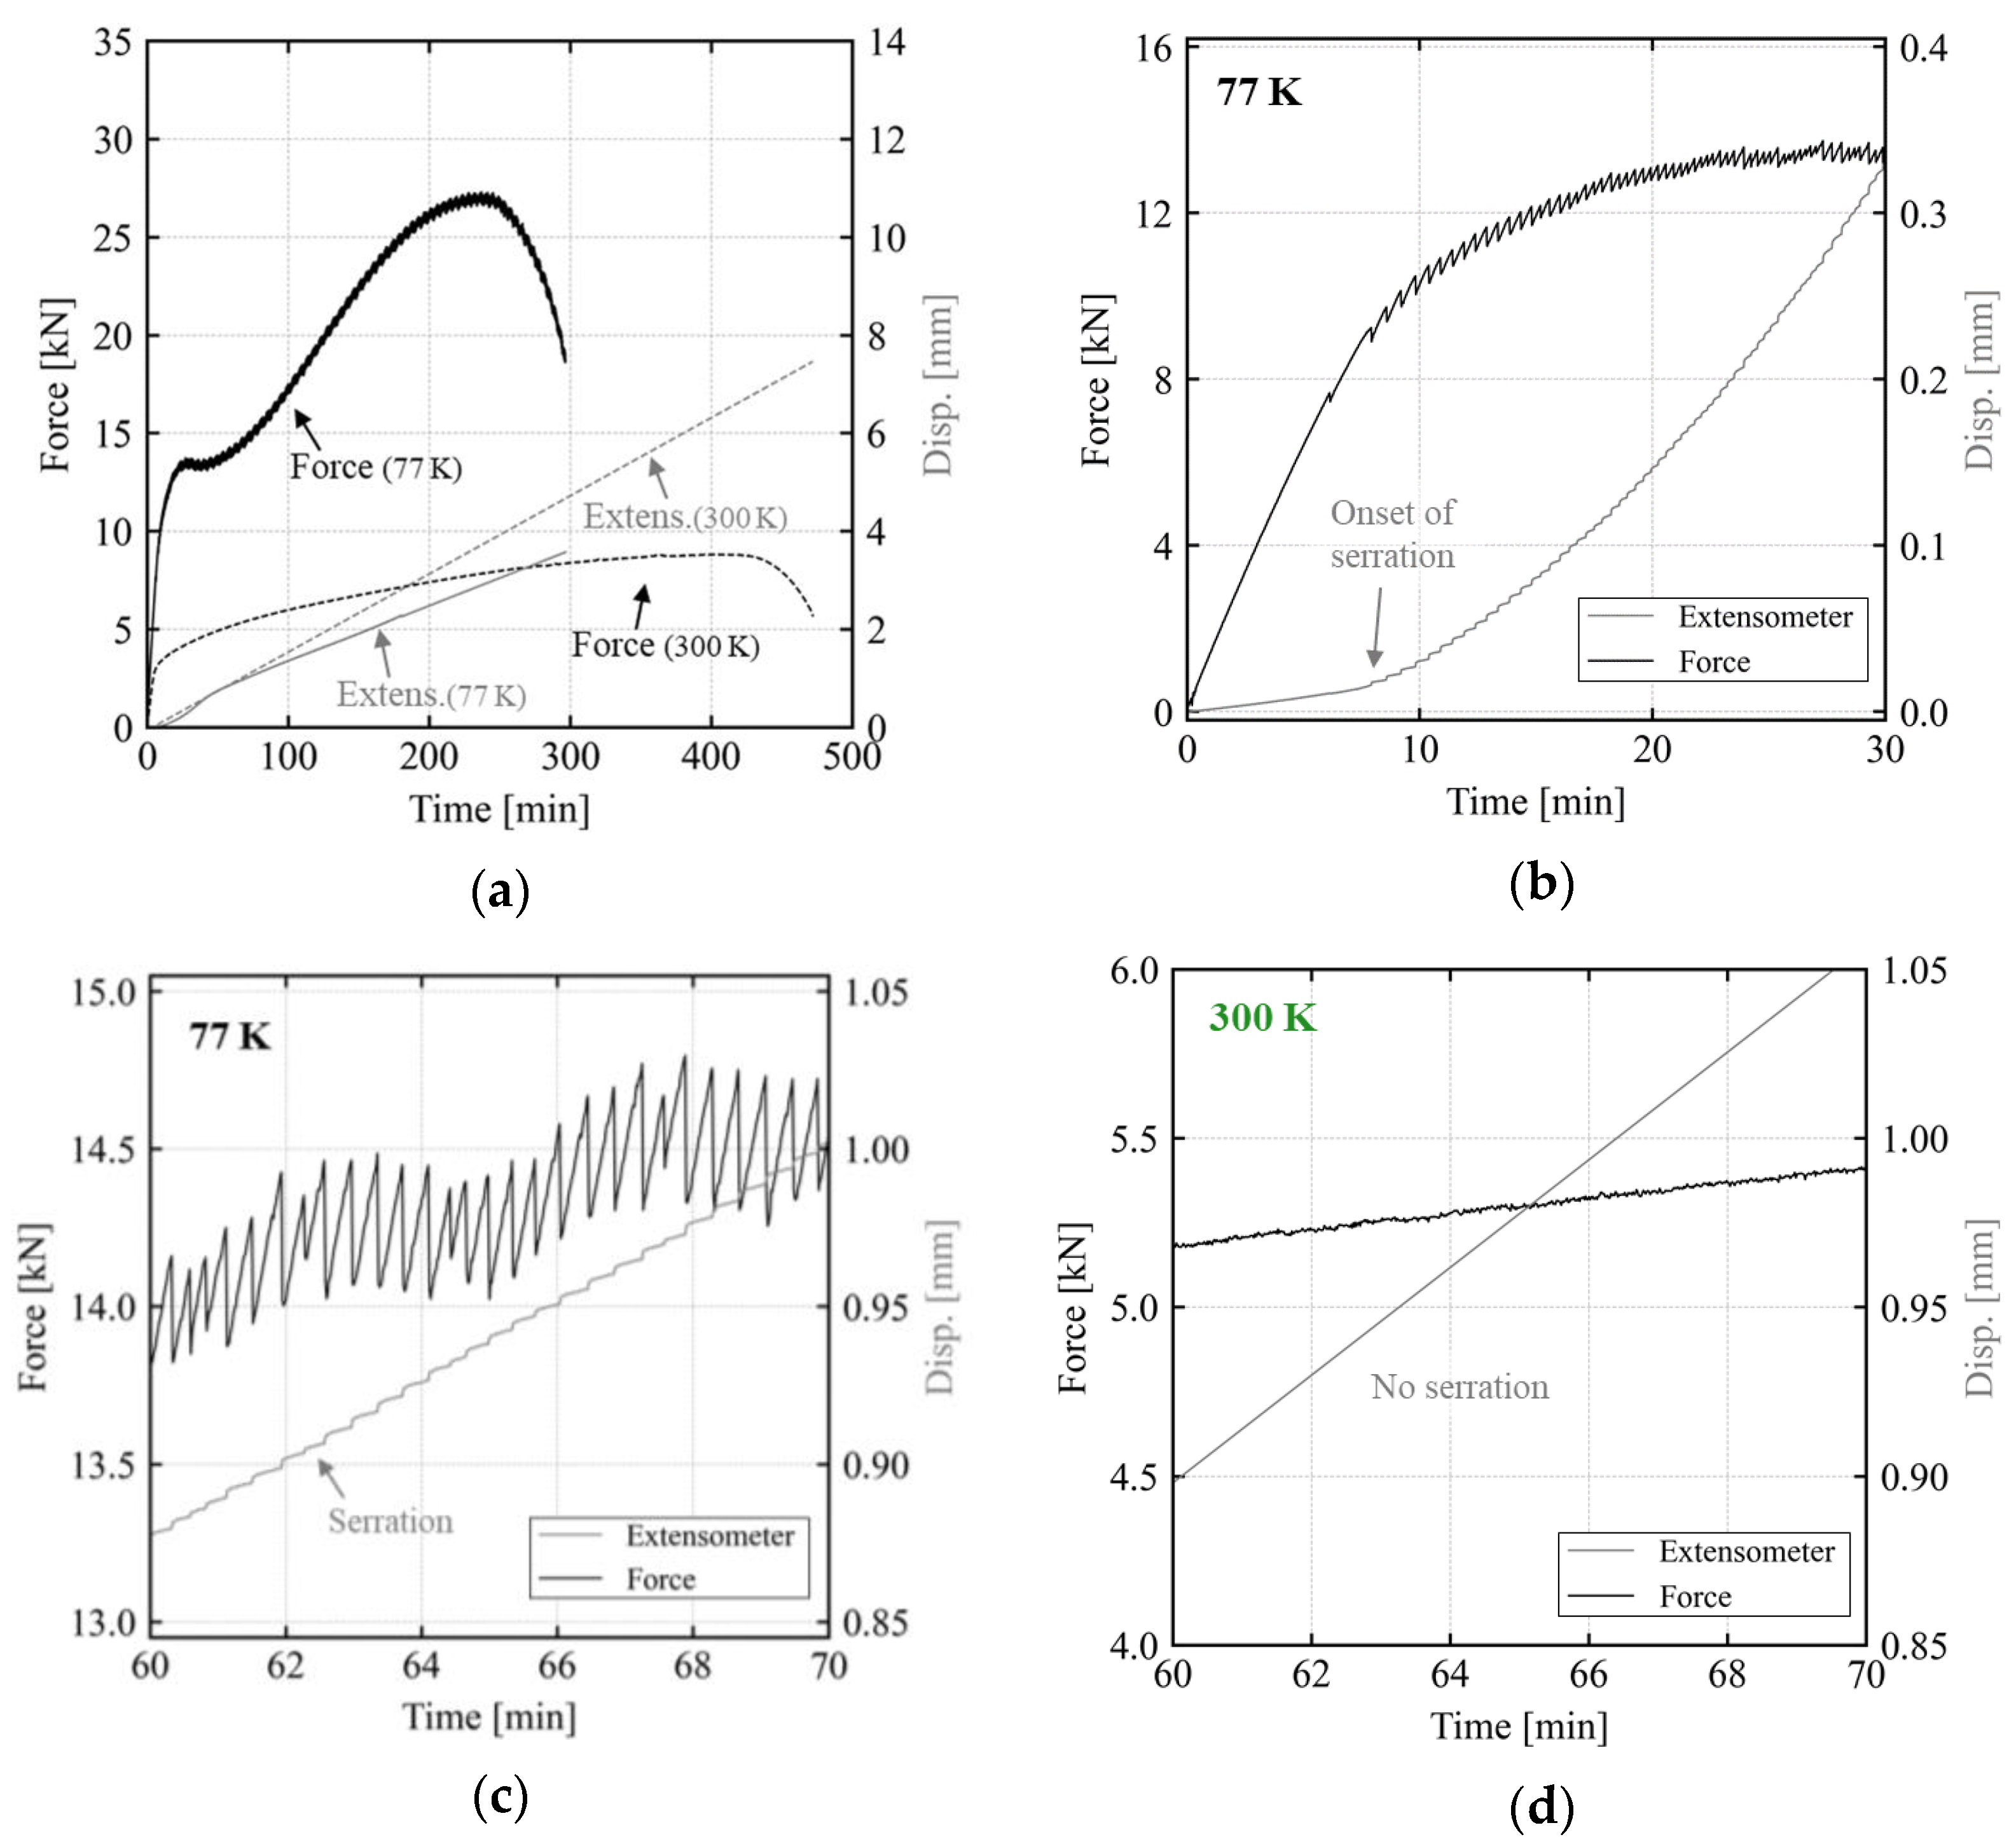
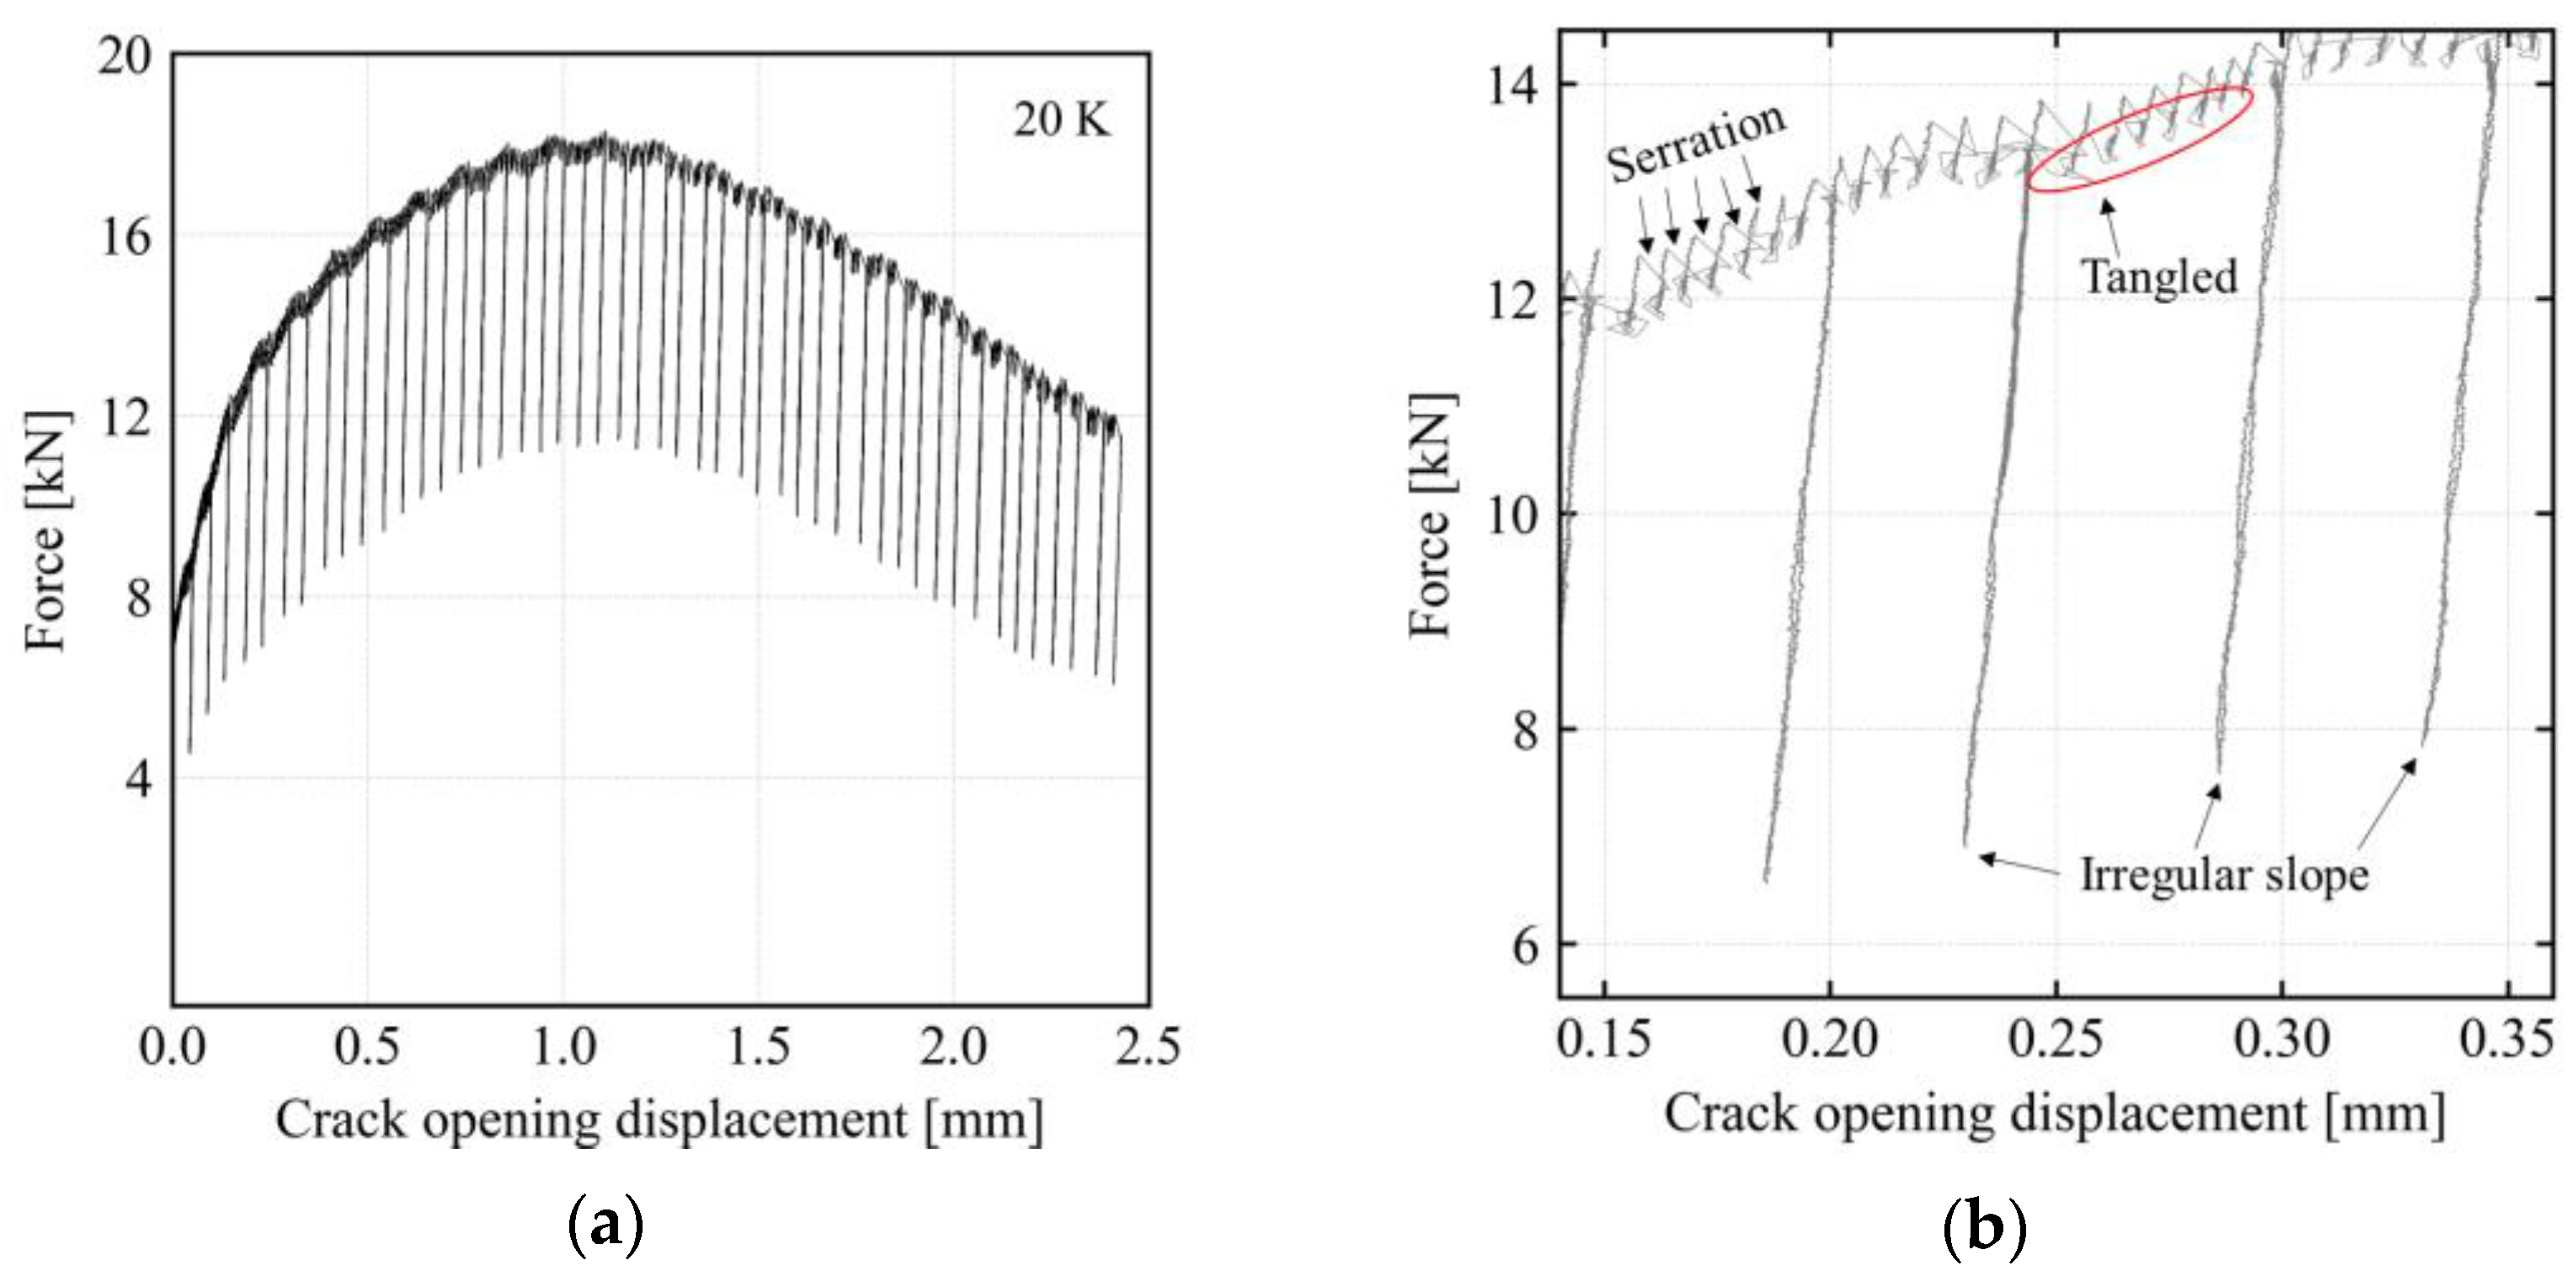
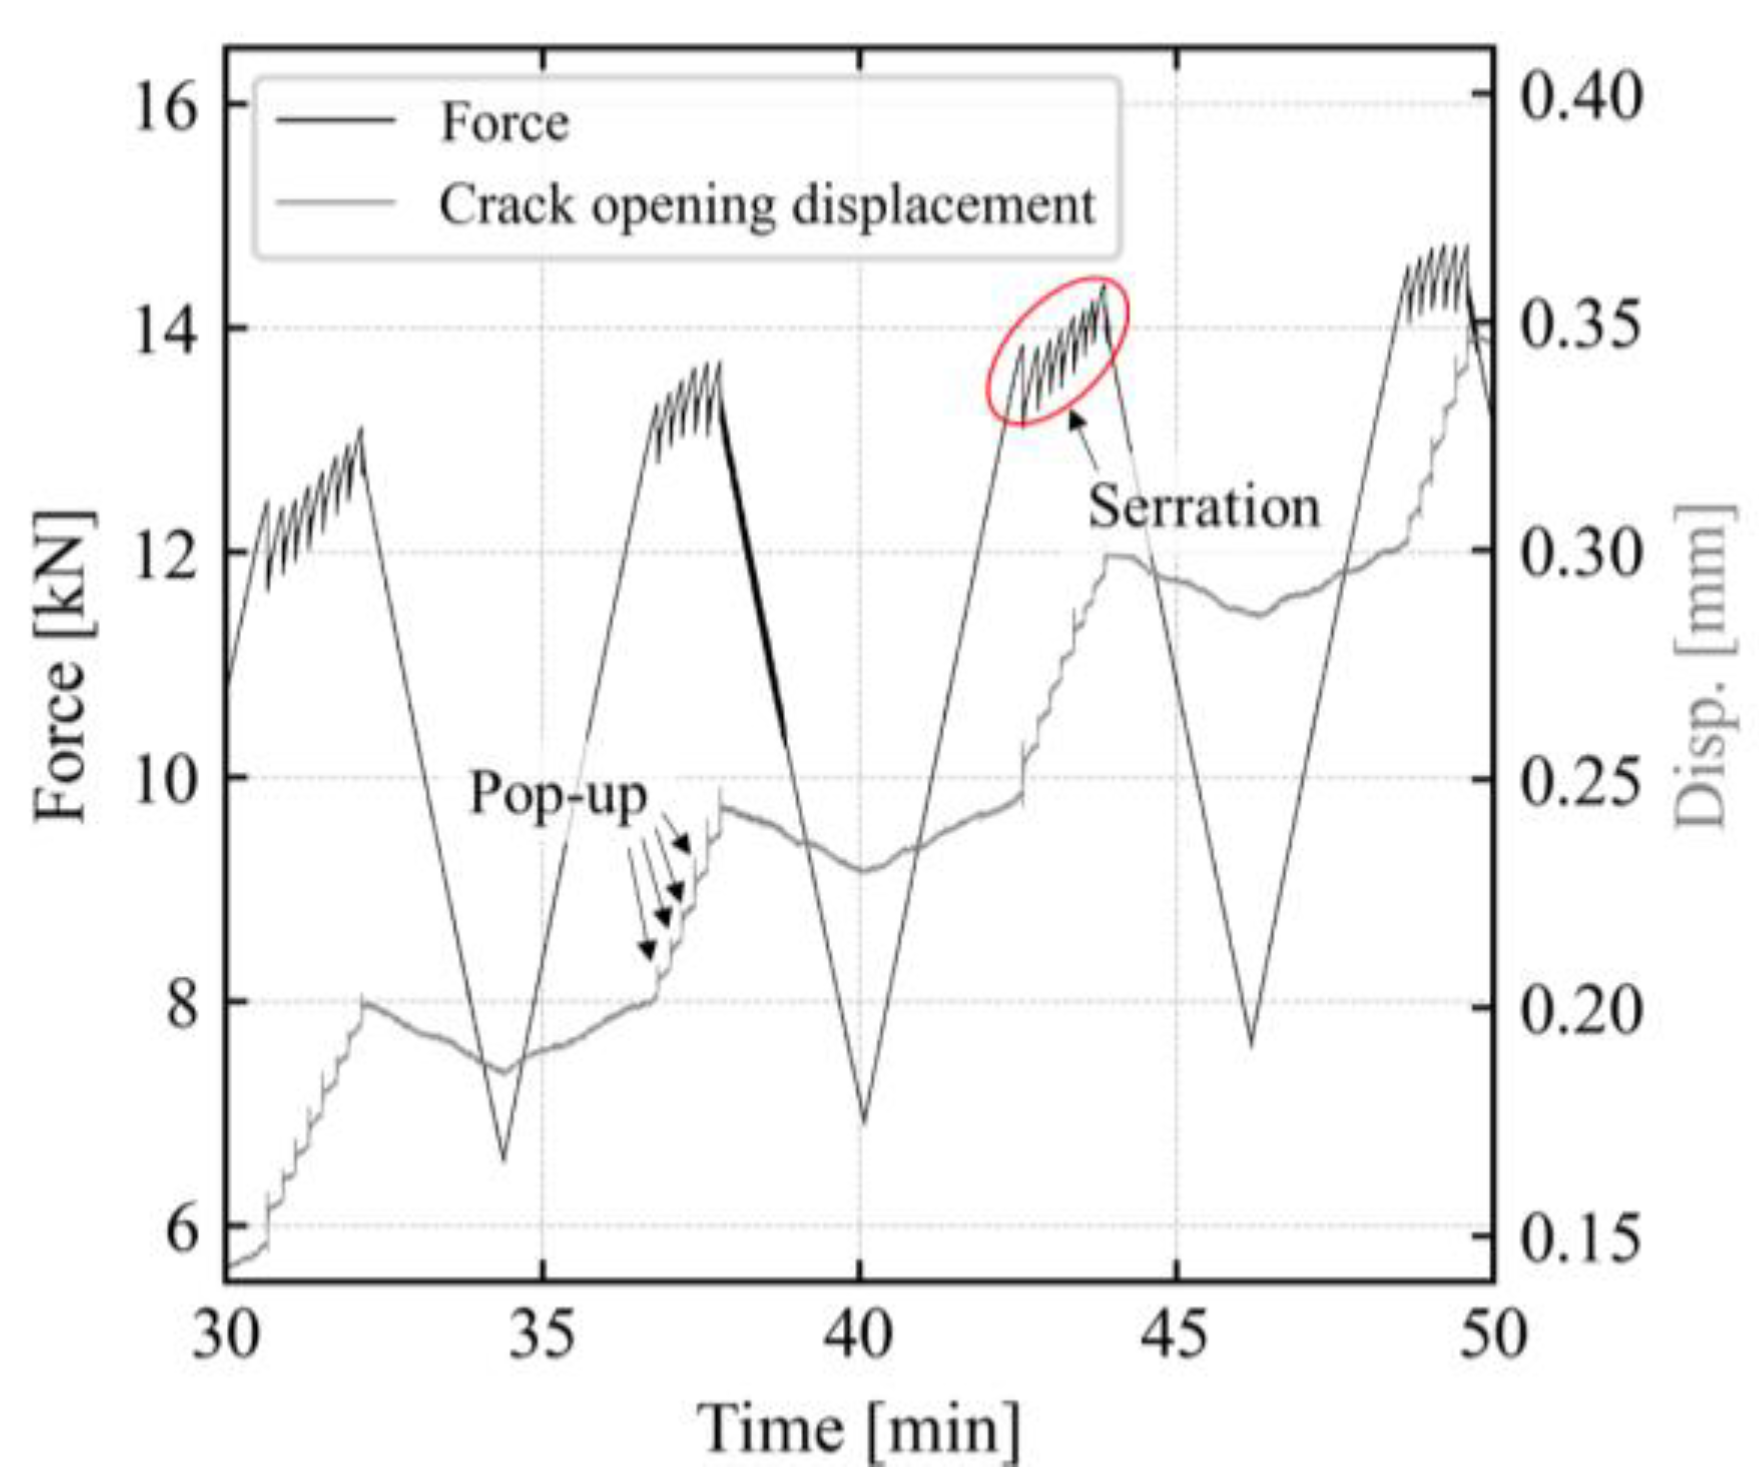
In tensile testing, discontinuous yielding can cause a slip of the extensometer, due to randomly appearing slip bands, or affect the strength calculation. In fracture-toughness testing using the unloading compliance method, discontinuous yielding has a very limited effect, unlike tensile testing. This is because compliance was calculated solely based on the slope of the unloading sequence during the fracture-toughness evaluation. Load drops resulting from discontinuous yielding only occur at the end of the reloading sequence;
-
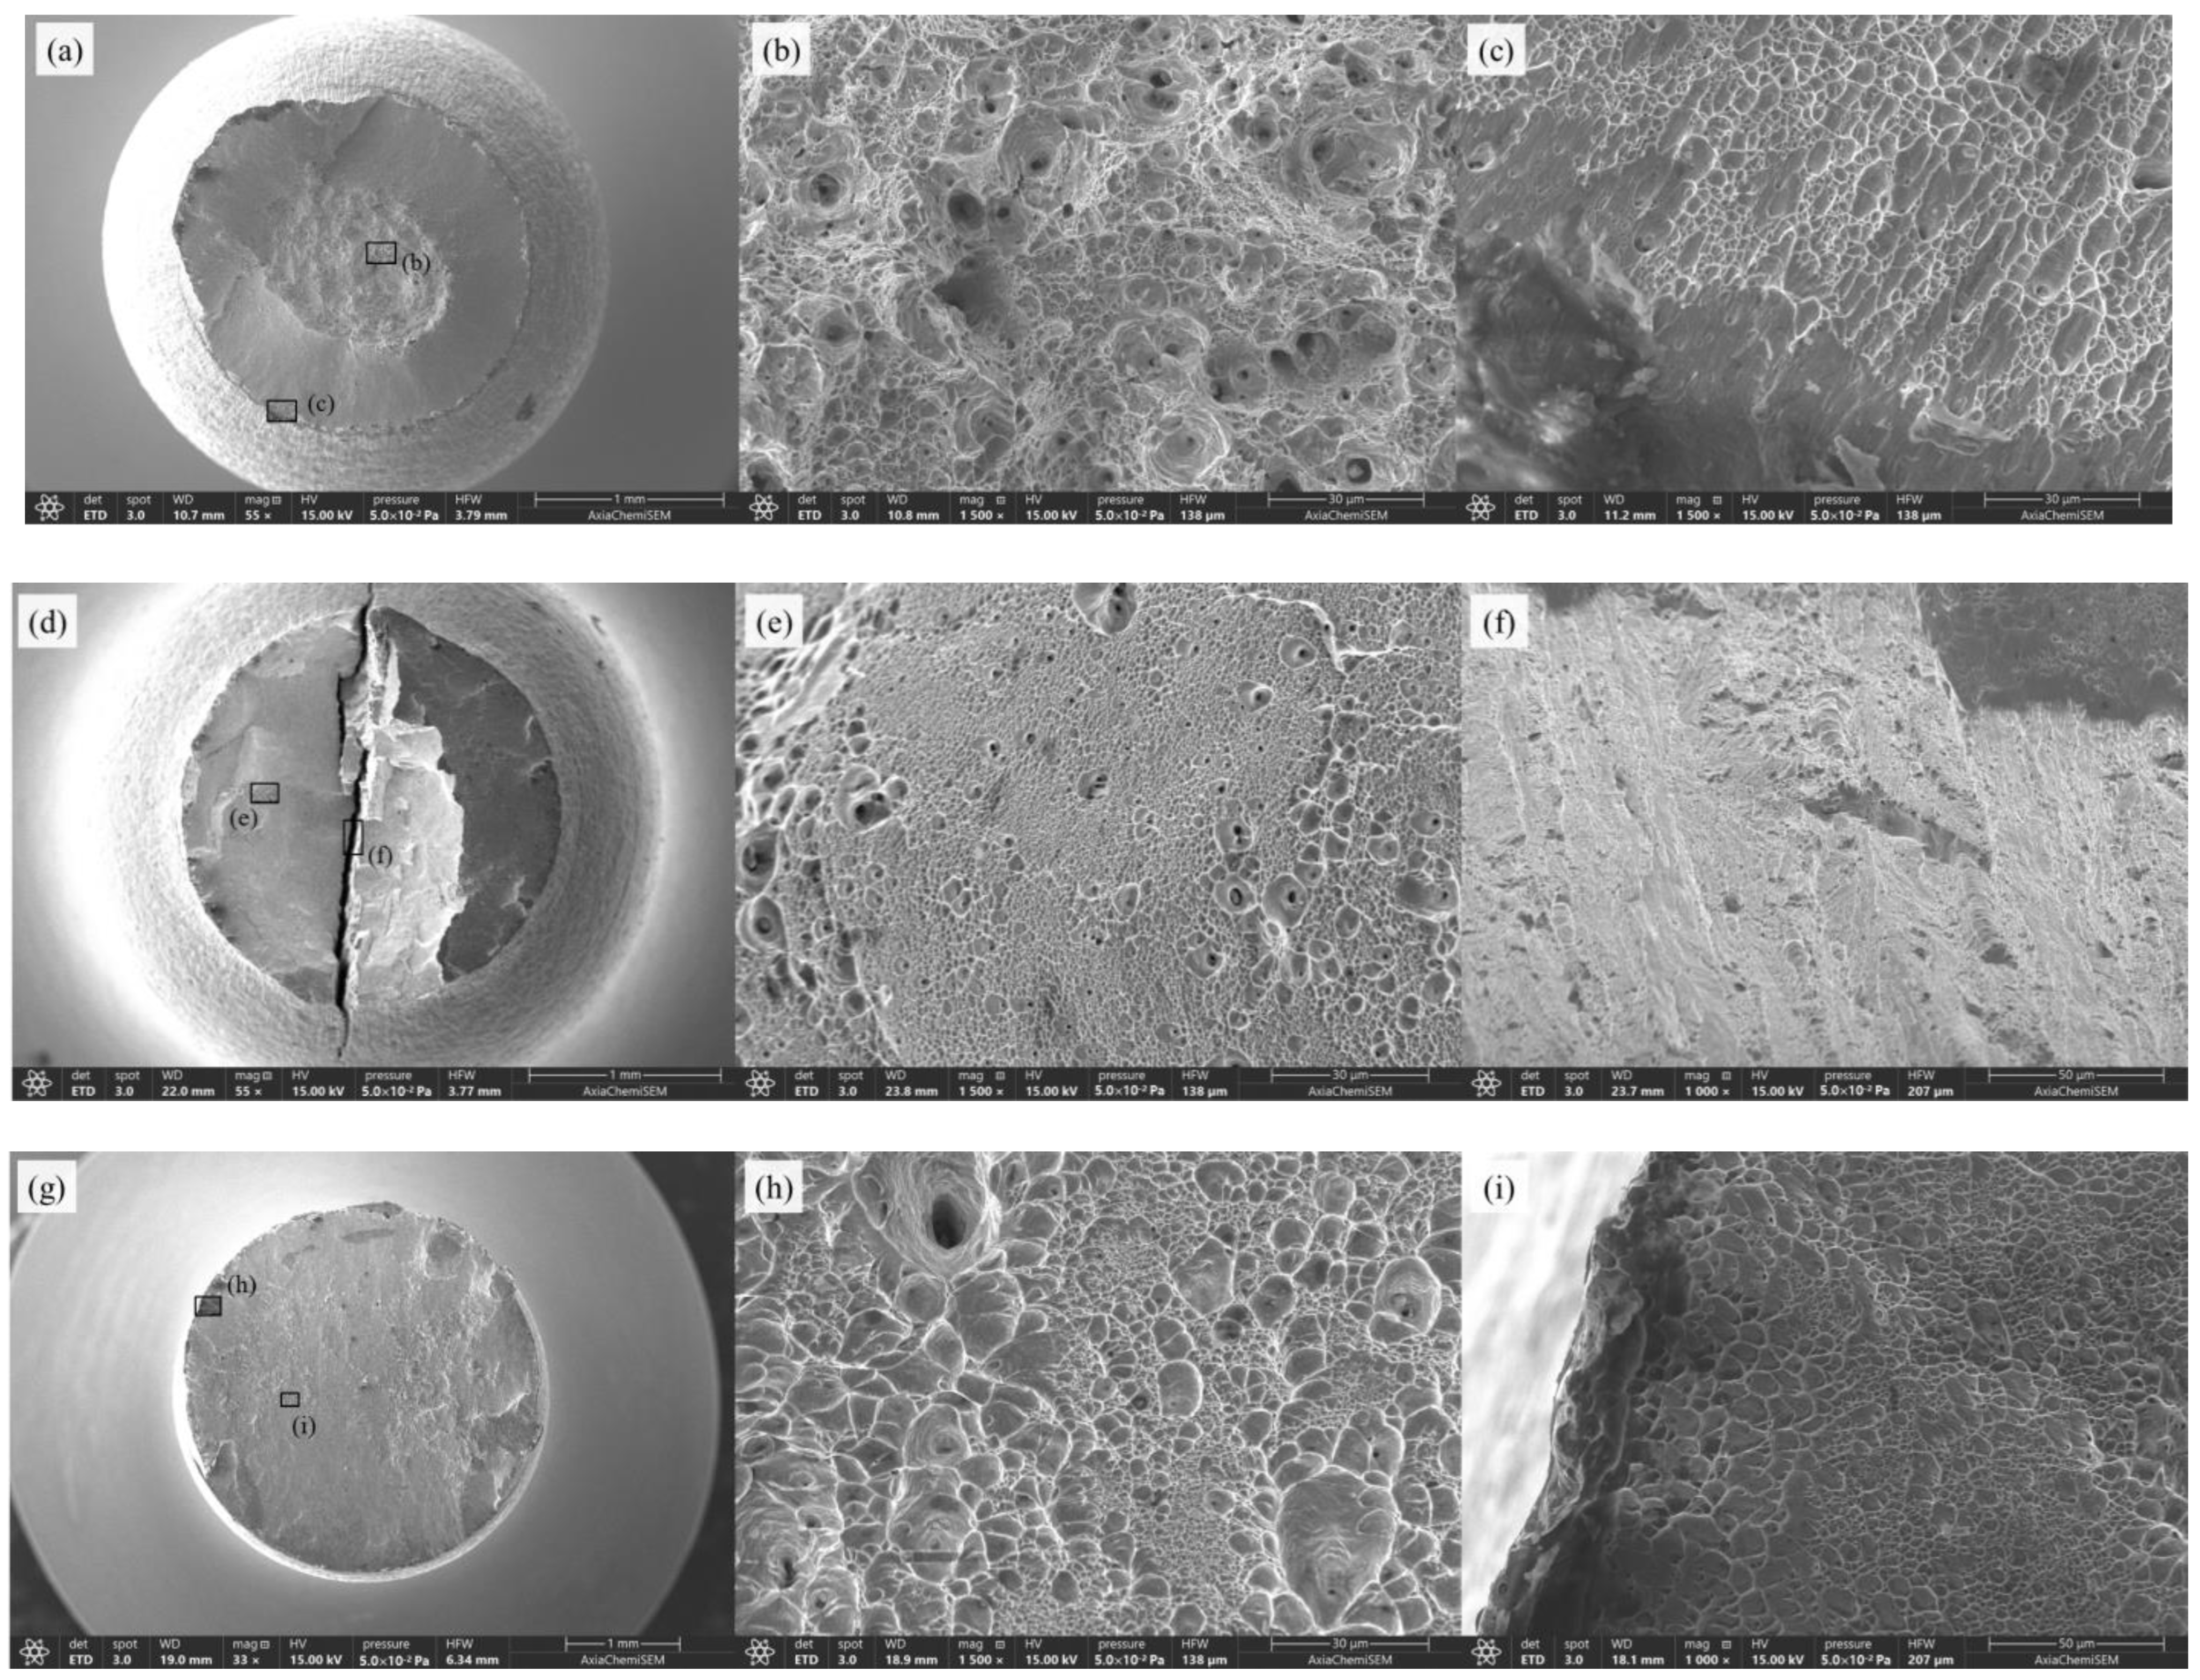
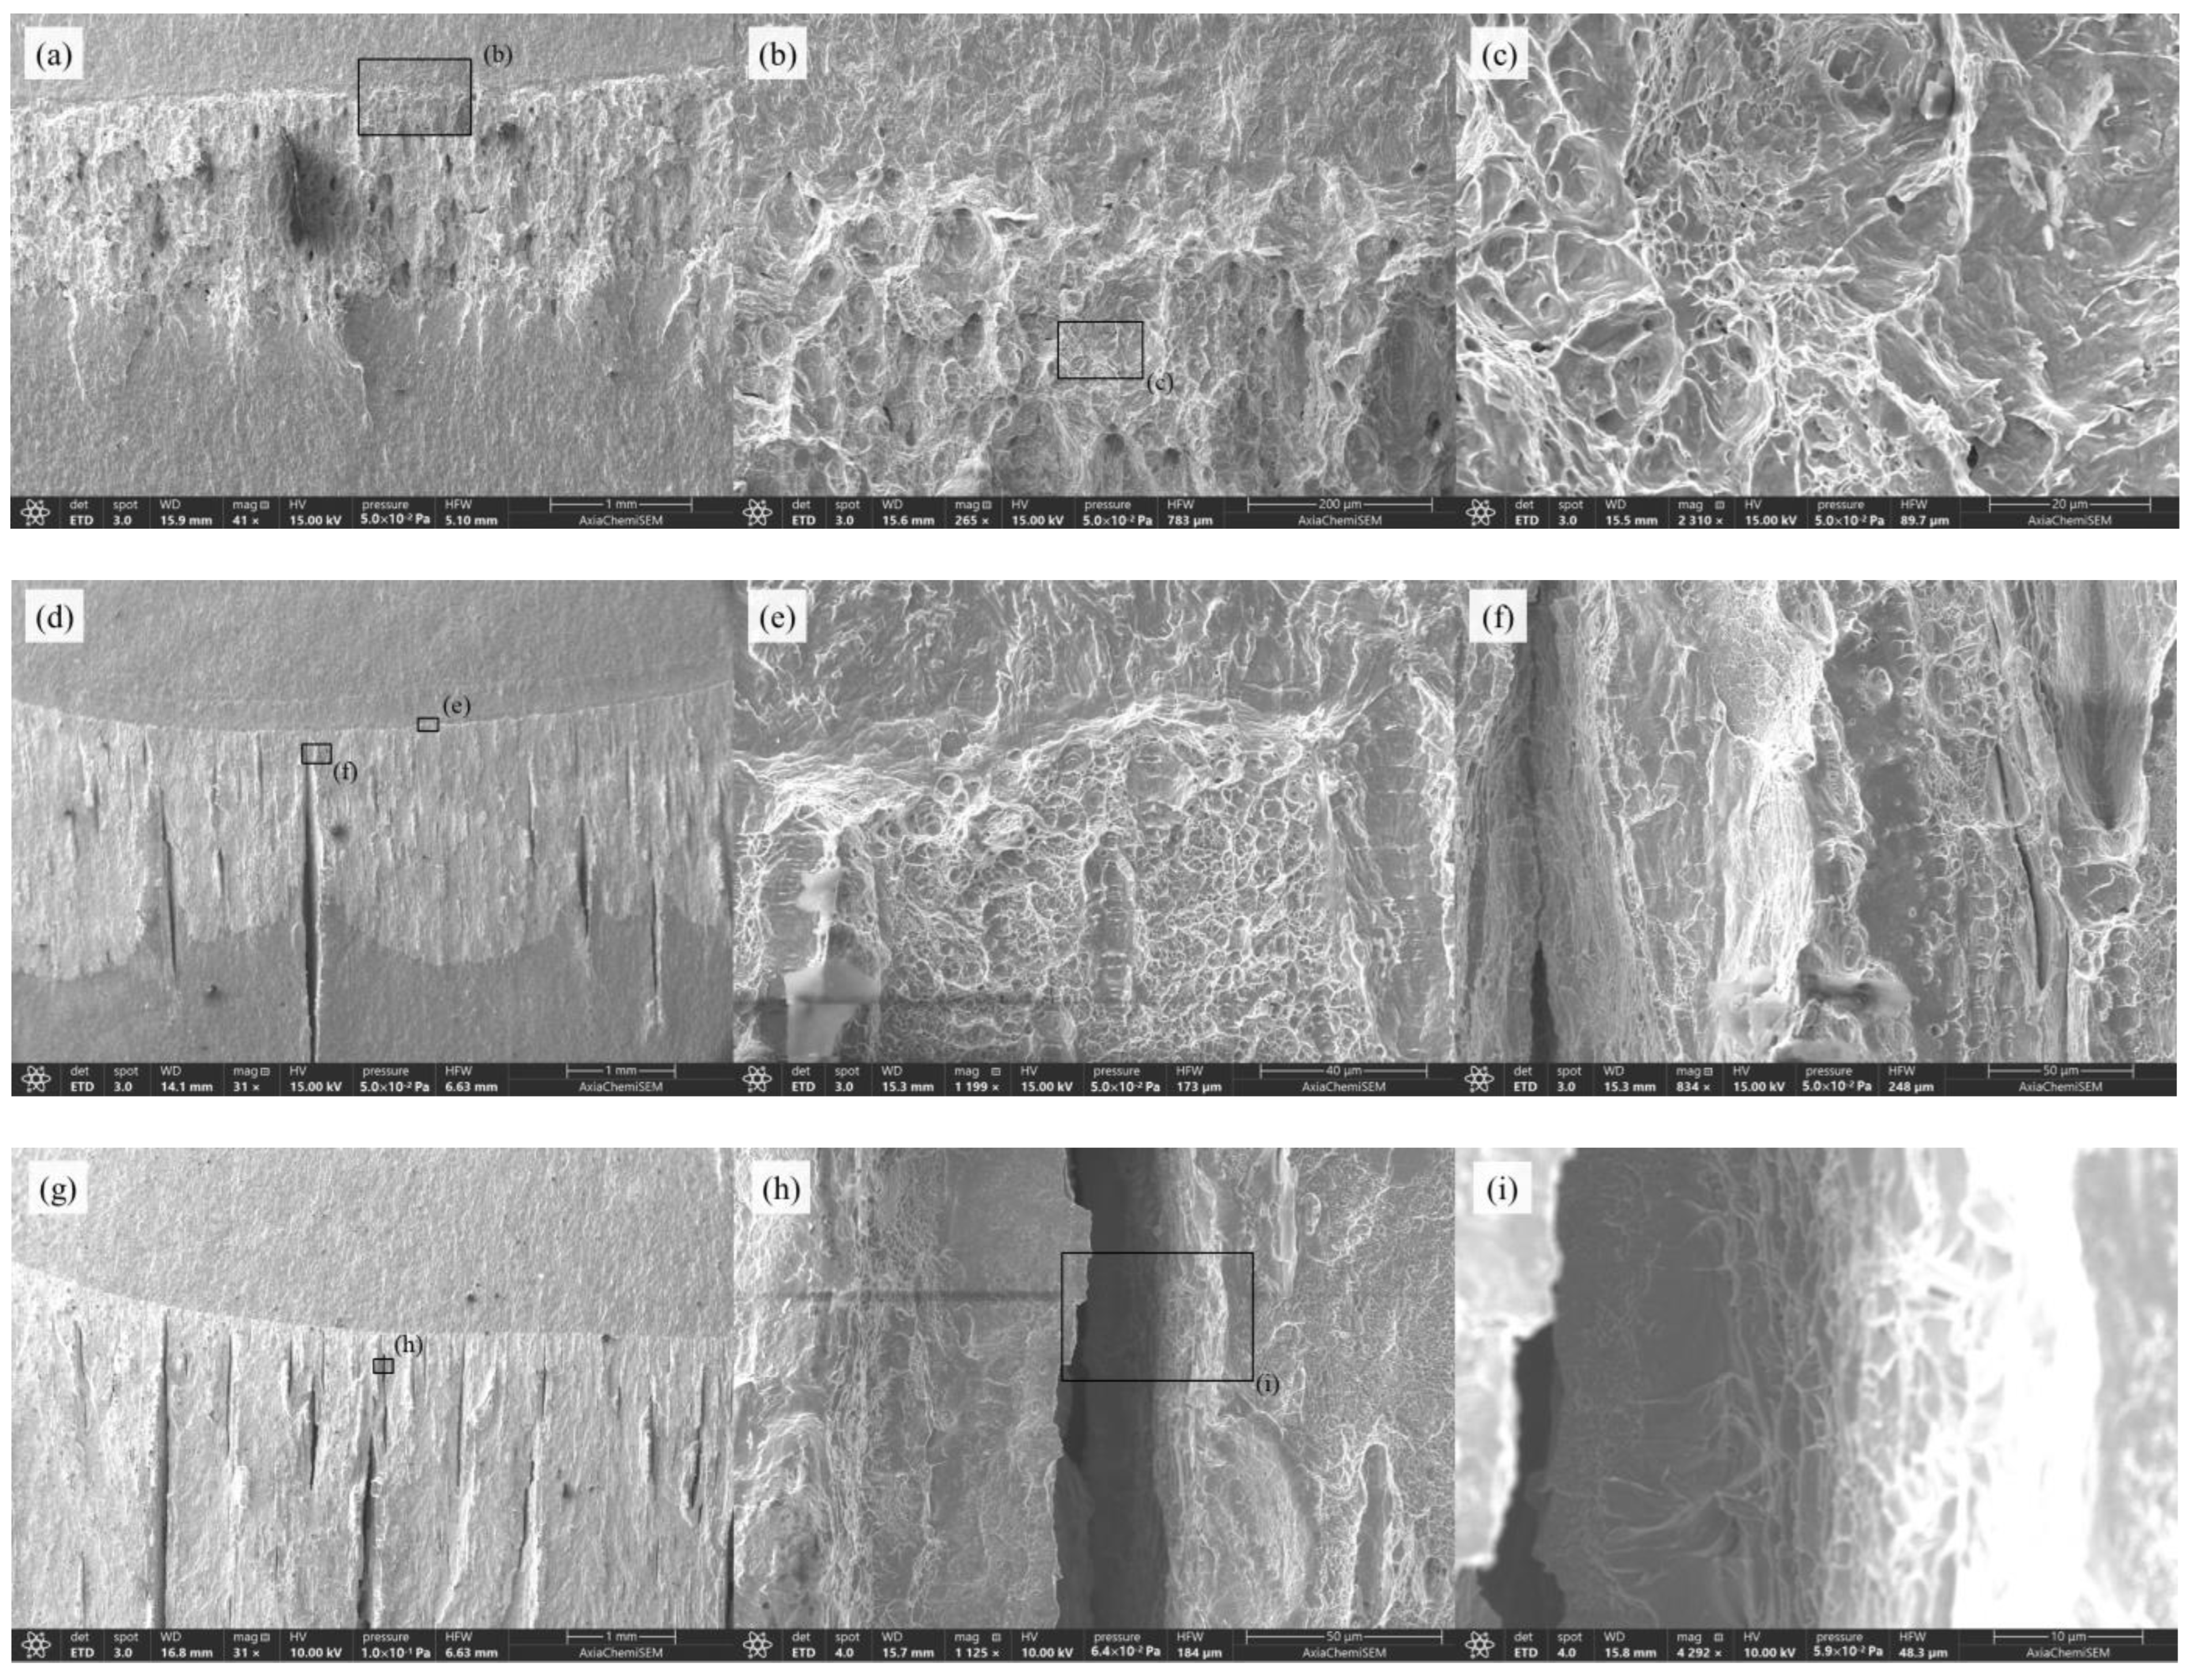
Across all temperatures, the fracture surface of the tensile specimen predominantly exhibited dimples, with their shape and size being the only variables that differed depending on temperature. Notably, the occurrence of splits was exclusive to the fracture surface of the tensile specimen subjected to testing at 77 K; these splits coexisted with dominant cleavage fractures and were interspersed with microvoid coalescence. For the C(T) specimen, numerous splits were observed on the fracture surface at both 77 K and 20 K. As with the tensile specimen, cleavage fractures were the dominant feature in regions where splits were observed;
-
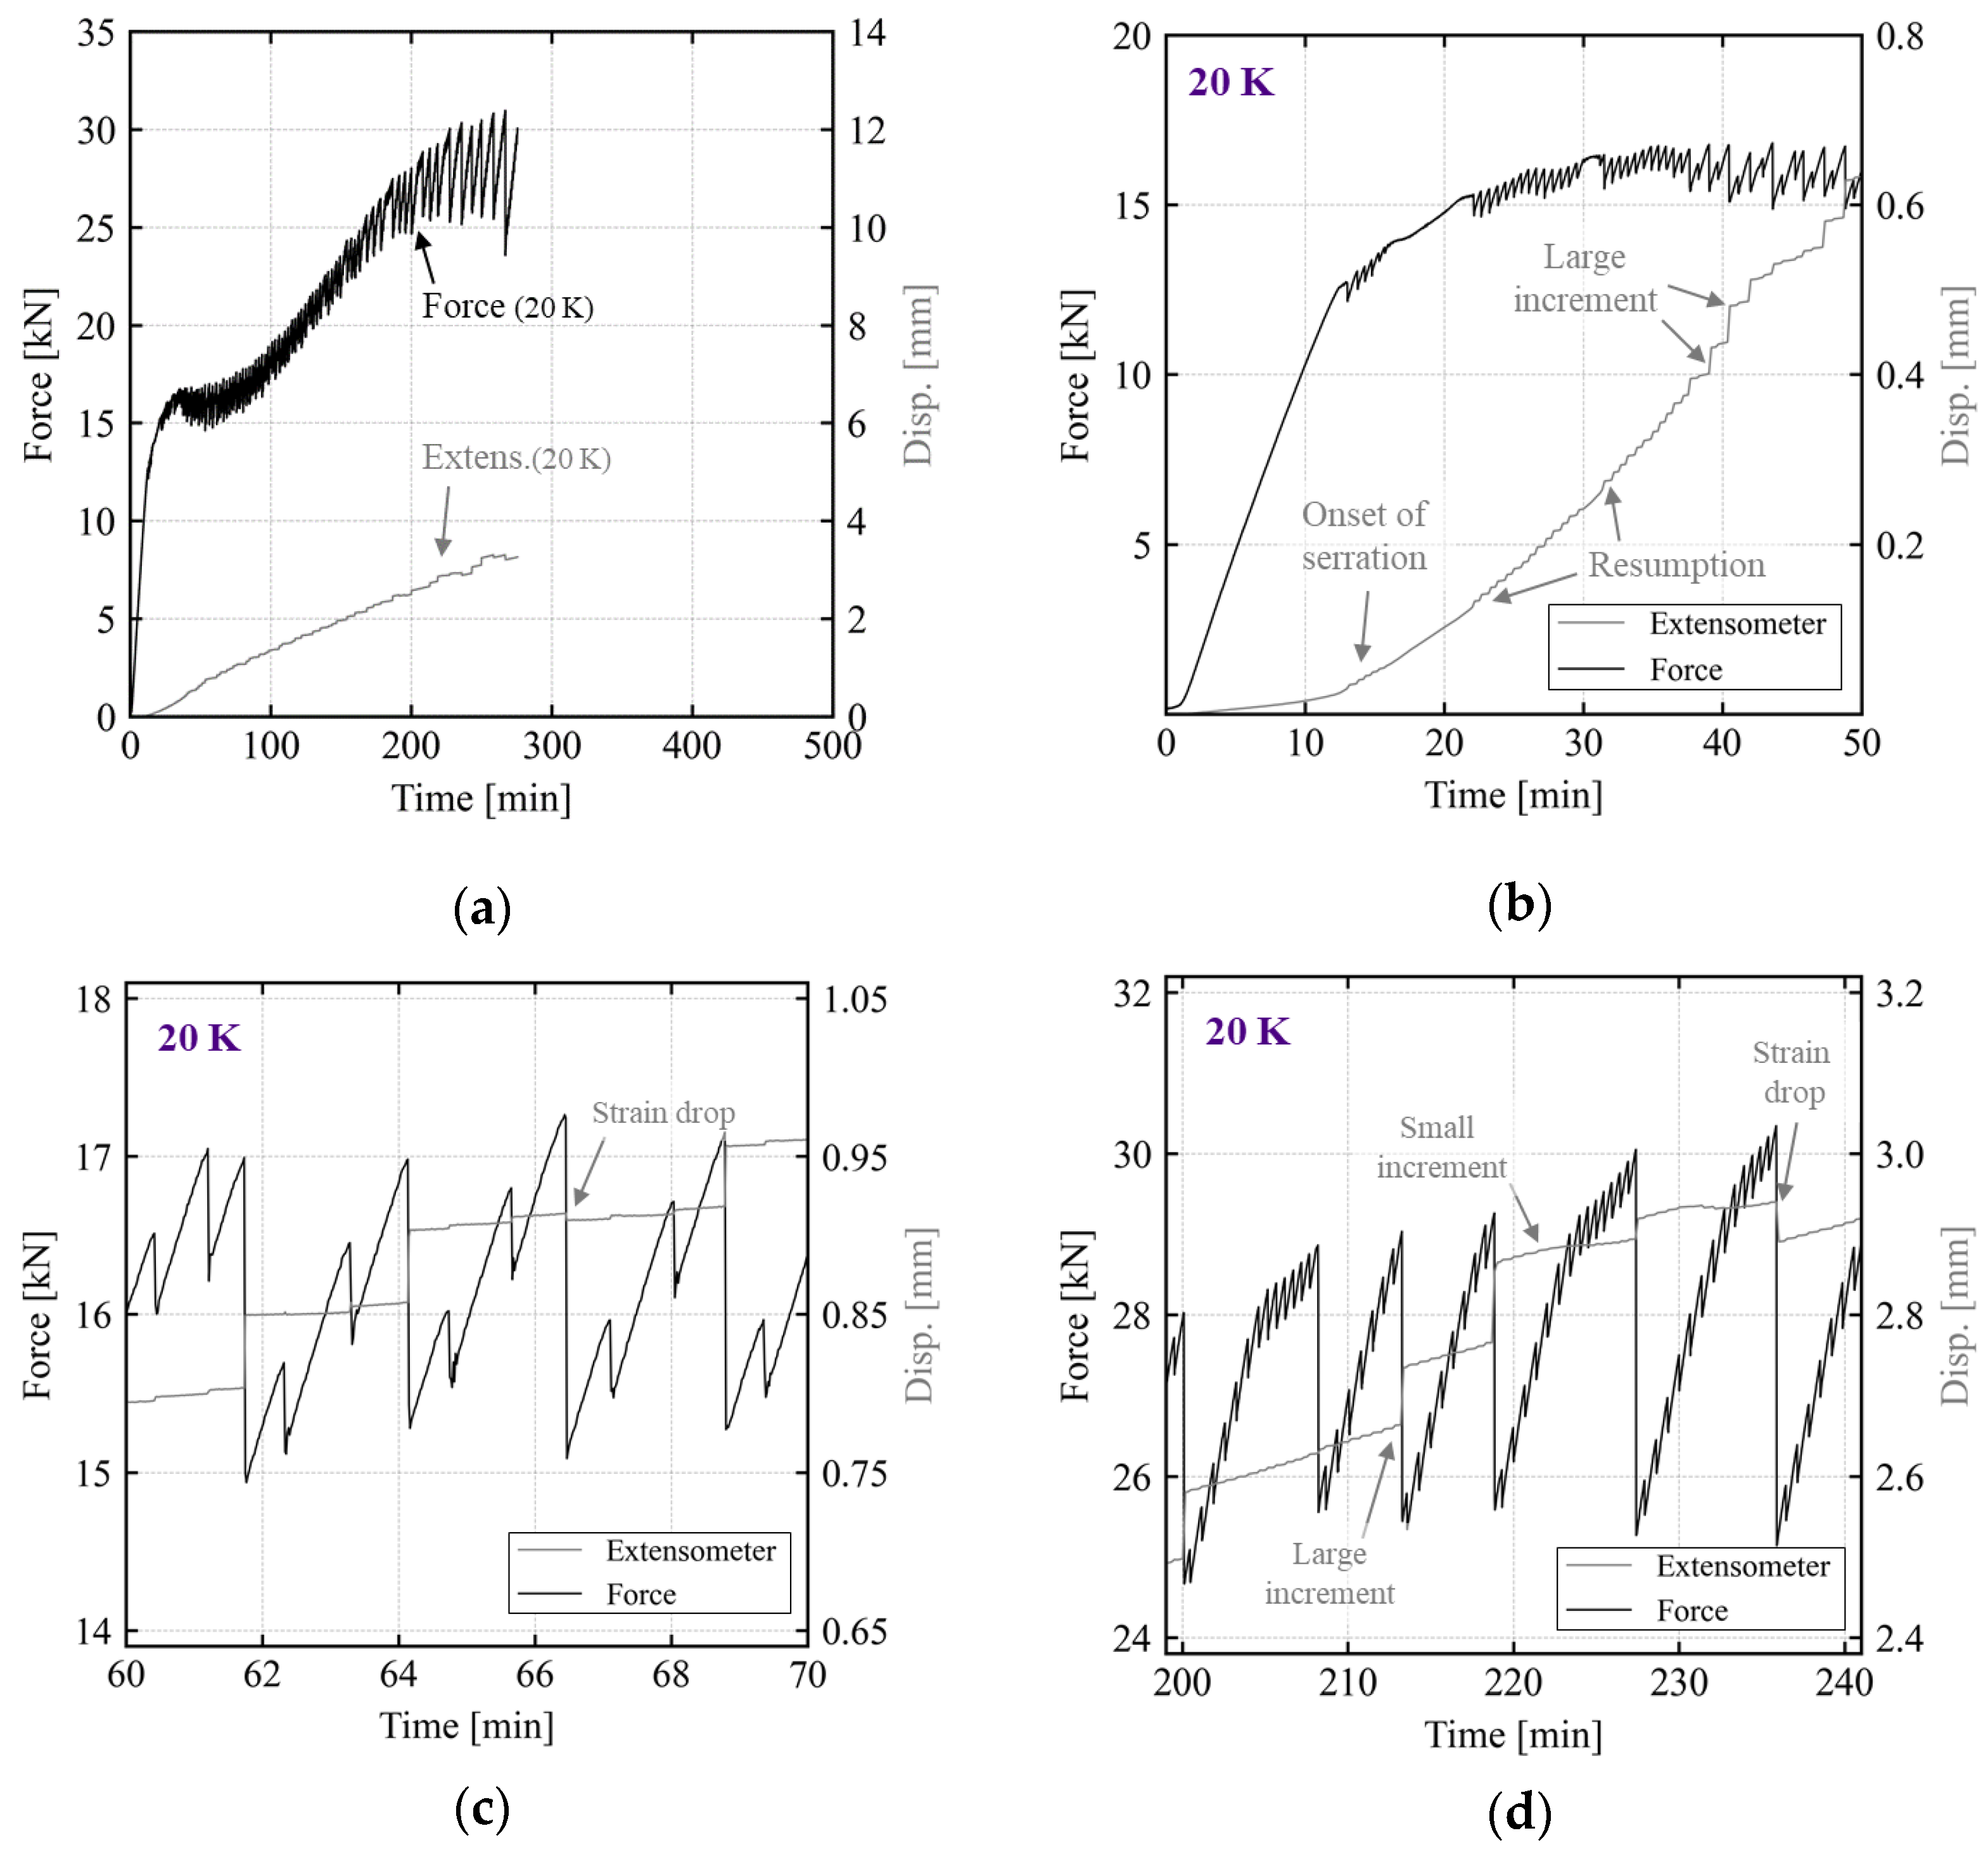
During the tensile test conducted at 20 K, a pronounced stress drop due to discontinuous yielding was observed. Instead of propagating uniformly, the plastic deformation, or slip bands, appeared sporadically. These slip bands formed even outside the gauge-length range of the extensometer, leading to a decrease in the measured strain. This made the stress–strain curve appear tangled. At low temperatures, the stainless steel exhibited two types of discontinuous yield. At 77 K, only the small type of stress drop with a minor strain increment was observed;
-
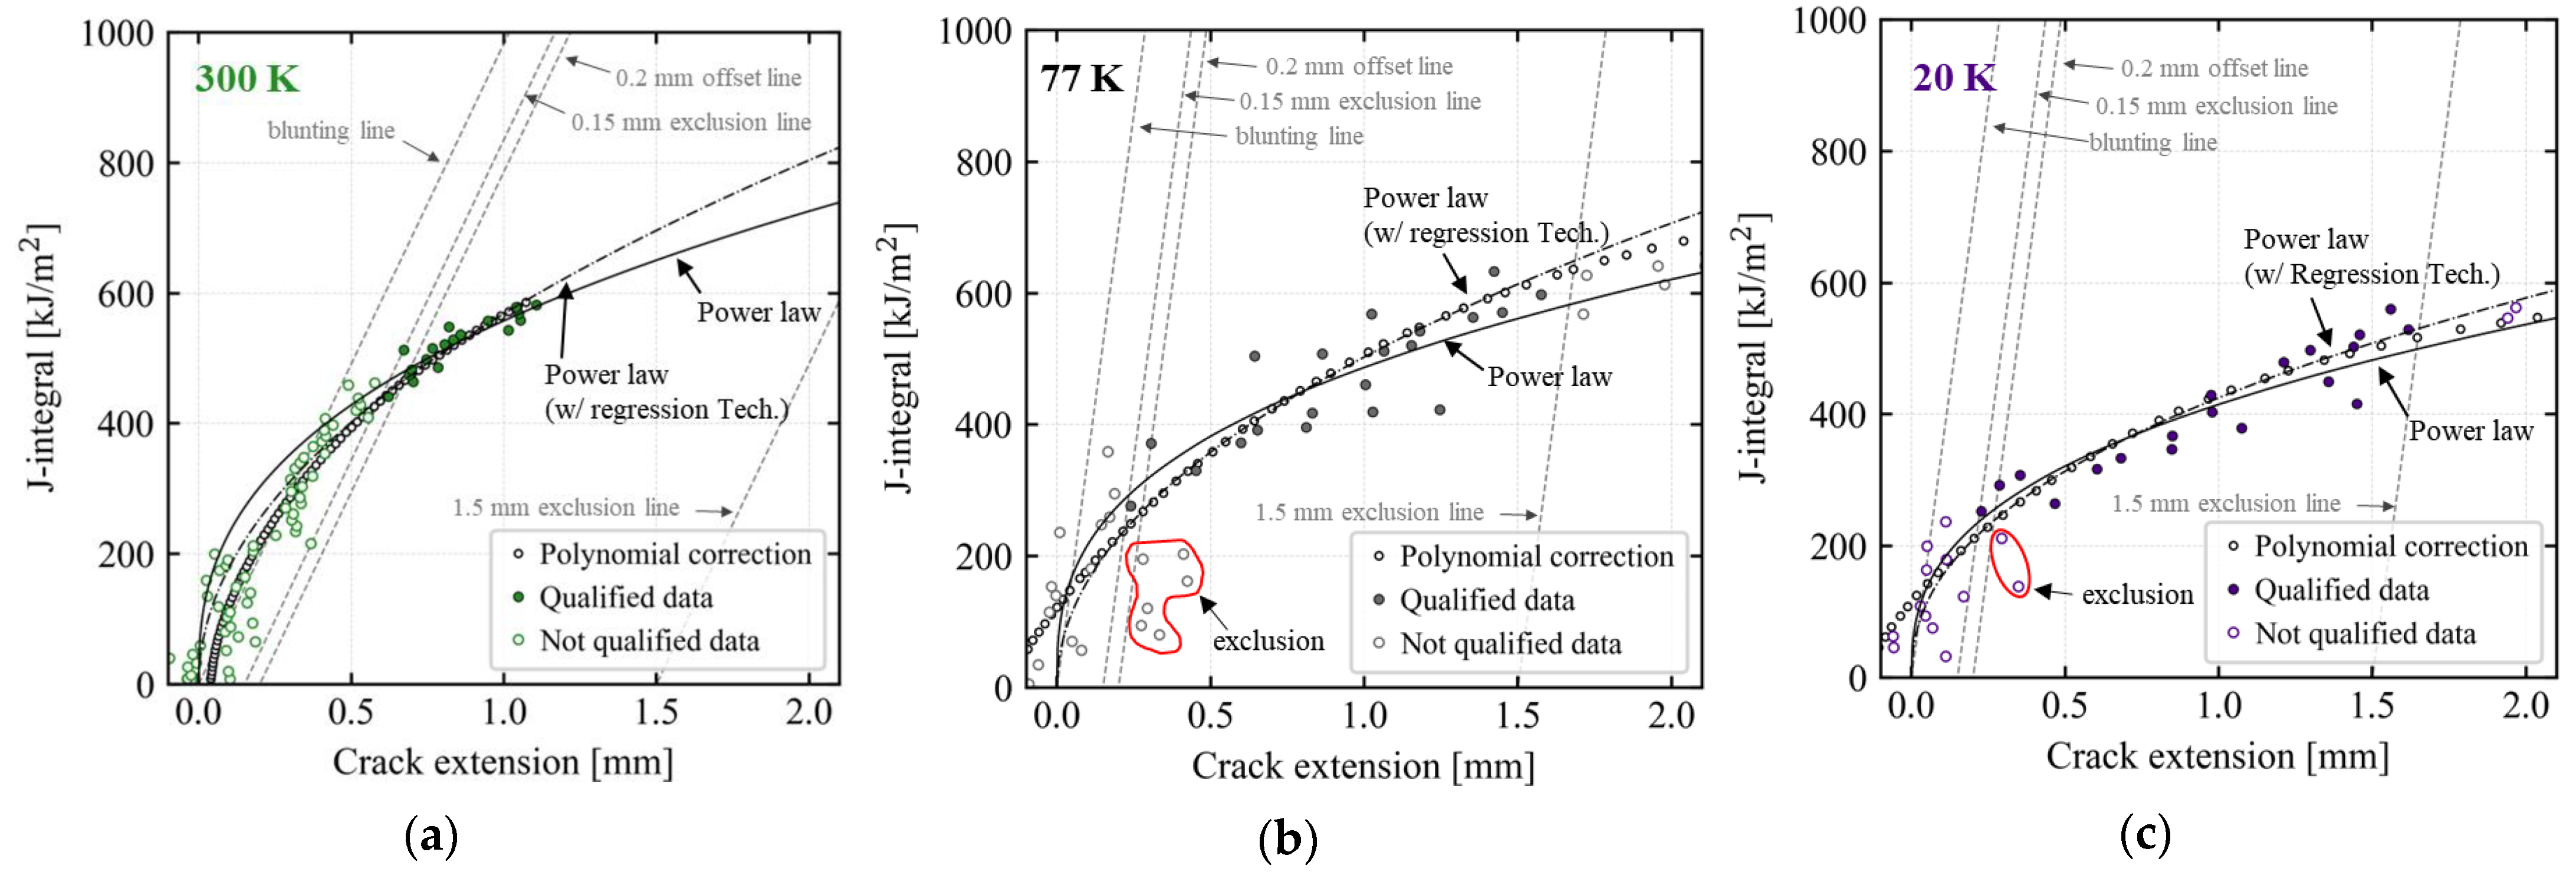
In this study, an exclusion technique and a polynomial-regression technique were adopted to correct for scatter in the unloading slope at cryogenic temperatures and compared to the JIC values determined by the ASTM E1820 procedure. The JIC values obtained at 77 K and 20 K, by adhering to the ASTM E1820 method and without utilizing the exclusion technique, were significantly lower than the values obtained when the offset technique was applied. The offset technique is mainly used to determine the JIC using the polynomial-regression technique to minimize the effect of unloading slope scattering, but it was not applicable under the conditions of this study. However, the adoption of the corrected a 0 q had a similar effect as using the offset technique.

Author Contributions

Conceptualization, M.-S.K.; Methodology, M.-S.K.; Formal analysis, M.-S.K.; Writing—original draft, M.-S.K.; Supervision, T.L.; Project administration, J.-W.P. and Y.K. All authors have read and agreed to the published version of the manuscript.

Funding

This research was a part of the project titled ‘Development of Smart Port–Autonomous Ships Linkage Technology’, funded by the Ministry of Oceans and Fisheries, Korea.

Data Availability Statement

The data presented in this study are available on request from corresponding author.

Conflicts of Interest

The authors declare no conflict of interest.

Appendix A

Table A1. Comparison of the coefficient of power-law fitting.
Temp.
(K)
Type C 1 C 2 Correlation Coefficient
300Untreated data w/exclusion technique557.580.380.9142
Untreated data w/o exclusion technique557.580.380.9142
Regression technique w/corrected a 0 q 568.400.500.9998
Regression technique w/o corrected a 0 q 578.770.470.9998
77Untreated data w/exclusion technique487.080.350.7962
Untreated data w/o exclusion technique467.820.870.8846
Regression technique w/corrected a 0 q 502.950.490.9997
Regression technique w/o corrected a 0 q 456.100.670.9997
20Untreated data w/exclusion technique415.210.370.9225
Untreated data w/o exclusion technique406.910.470.9220
Regression technique w/corrected a 0 q 425.330.440.9990
Regression technique w/o corrected a 0 q 395.520.600.9993

Appendix B

To examine the validity of the fracture-toughness measurements performed in this study, comparisons of the fracture-toughness test results by temperature for the 304 and 304L stainless steels with nickel contents of 8 to 10% are listed in Table A2. It was generally confirmed from previous research results that the fracture toughness at low temperatures increases as the nickel content in stainless steel increases. Due to variations in test conditions and specimen shapes, fracture-toughness results show a great deal of variability. This study produced fracture-toughness results that fall within that range. The current study found that, at low temperatures, the tensile and yield strengths were very high. At 77 K, the yield strength was approximately 55.0% higher, while the tensile strength was roughly 24.8% higher. Despite the comparison between 20 K and 4 K, the yield strength was approximately 42.0% greater, and the tensile strength was approximately 27.6% greater. These differences can be attributed to variances in the microstructure and testing conditions.
Table A2. Comparison of mechanical properties in accordance with testing temperature between the present and previous study.
Alloy TypeNickel Contents (%)Temp. (K)Yield Strength (MPa)Tensile Strength (MPa)Fracture Toughness (kJ/m2)Remarks
304L8.052300258724.9484.8Present study
3048.2293279662[55]
304L 10293278716529[56]
304L8.052778562172321.4Present study
3048.2773811609161[55]
304L9.1577496[57]
304L 10773891656300[56]
304L8.0522010592433.4254.2Present study
3048.084634190366[58]
3048.245951622110[55]
304L9.154205[51]

References

  1. Ren, J.; Musyoka, N.M.; Langmi, H.W.; Mathe, M.; Liao, S. Current Research Trends and Perspectives on Materials-Based Hydrogen Storage Solutions: A Critical Review. Int. J. Hydrog. Energy 2017, 42, 289–311. [Google Scholar] [CrossRef]
  2. Mazloomi, K.; Gomes, C. Hydrogen as an Energy Carrier: Prospects and Challenges. Renew. Sustain. Energy Rev. 2012, 16, 3024–3033. [Google Scholar] [CrossRef]
  3. Li, M.; Bai, Y.; Zhang, C.; Song, Y.; Jiang, S.; Grouset, D.; Zhang, M. Review on the Research of Hydrogen Storage System Fast Refueling in Fuel Cell Vehicle. Int. J. Hydrog. Energy 2019, 44, 10677–10693. [Google Scholar] [CrossRef]
  4. Krishna, R.; Titus, E.; Salimian, M.; Okhay, O.; Rajendran, S.; Rajkumar, A.; Sousa, J.M.G.; Ferreira, A.L.C.; Campos, J.; Gracio, J. Hydrogen Storage for Energy Application. In Hydrogen Storage; InTech: London, UK, 2012. [Google Scholar]
  5. Barthelemy, H.; Weber, M.; Barbier, F. Hydrogen Storage: Recent Improvements and Industrial Perspectives. Int. J. Hydrog. Energy 2017, 42, 7254–7262. [Google Scholar] [CrossRef]
  6. Durbin, D.J.; Malardier-Jugroot, C. Review of Hydrogen Storage Techniques for on Board Vehicle Applications. Int. J. Hydrog. Energy 2013, 38, 14595–14617. [Google Scholar] [CrossRef]
  7. Aceves, S.M.; Espinosa-Loza, F.; Ledesma-Orozco, E.; Ross, T.O.; Weisberg, A.H.; Brunner, T.C.; Kircher, O. High-Density Automotive Hydrogen Storage with Cryogenic Capable Pressure Vessels. Int. J. Hydrog. Energy 2010, 35, 1219–1226. [Google Scholar] [CrossRef]
  8. Jones, L.W. Liquid Hydrogen as a Fuel for the Future. Science 1971, 174, 367–370. [Google Scholar] [CrossRef]
  9. Caskey, G.R., Jr. Hydrogen Compatibility Handbook for Stainless Steels; U.S. Department of Energy Office of Scientific and Technical Information: Aiken, SC, USA, 1983. [Google Scholar]
  10. Yang, H.; Nguyen, T.T.; Park, J.; Heo, H.M.; Lee, J.; Baek, U.B.; Lee, Y.-K. Temperature Dependency of Hydrogen Embrittlement in Thermally H-Precharged STS 304 Austenitic Stainless Steel. Met. Mater. Int. 2023, 29, 303–314. [Google Scholar] [CrossRef]
  11. Sun, D.; Han, G.; Vaodee, S.; Fukuyama, S.; Yokogawa, K. Tensile Behaviour of Type 304 Austenitic Stainless Steels in Hydrogen Atmosphere at Low Temperatures. Mater. Sci. Technol. 2001, 17, 302–308. [Google Scholar] [CrossRef]
  12. Ogata, T. Simple Mechanical Testing Method to Evaluate Influence of High Pressure Hydrogen Gas. In Proceedings of the ASME 2018 Pressure Vessels and Piping Conference, Prague, Czech Republic, 15–20 July 2018; American Society of Mechanical Engineers: New York, NY, USA, 2018. [Google Scholar]
  13. Deimel, P.; Sattler, E. Austenitic Steels of Different Composition in Liquid and Gaseous Hydrogen. Corros. Sci. 2008, 50, 1598–1607. [Google Scholar] [CrossRef]
  14. Ogata, T.; Yuri, T.; Ono, Y. Load-Displacement Curves, Specimen Heating, and Strain-Induced Martensitic Transformation of Austenitic Stainless Steels at Cryogenic Temperatures. TEION KOGAKU J. Cryog. Soc. Jpn. 2007, 42, 10–17. [Google Scholar] [CrossRef]
  15. Kim, M.-S.; Lee, T.; Son, Y.; Park, J.; Kim, M.; Eun, H.; Park, J.-W.; Kim, Y. Metallic Material Evaluation of Liquid Hydrogen Storage Tank for Marine Application Using a Tensile Cryostat for 20 K and Electrochemical Cell. Processes 2022, 10, 2401. [Google Scholar] [CrossRef]
  16. Merkel, D.R.; Nickerson, E.K.; Seffens, R.J.; Simmons, K.L.; San Marchi, C.; Kagay, B.J.; Ronevich, J.A. Effect of Hydrogen on Tensile Properties of 304L Stainless Steel at Cryogenic Temperatures. In Proceedings of the ASME Pressure Vessels & Piping Conference (PVP 2021), Virtual, Online, 13–15 July 2021; American Society of Mechanical Engineers: New York, NY, USA, 2021. [Google Scholar]
  17. ANSI/CSA CHMC 1-2014; Test Methods For Evaluating Material Compatibility In Compressed Hydrogen Applications—Metals (R2018). CSA Group: Toronto, ON, Canada, 2018.
  18. Rivard, E.; Trudeau, M.; Zaghib, K. Hydrogen Storage for Mobility: A Review. Materials 2019, 12, 1973. [Google Scholar] [CrossRef] [PubMed]
  19. Aziz, M. Liquid Hydrogen: A Review on Liquefaction, Storage, Transportation, and Safety. Energies 2021, 14, 5917. [Google Scholar] [CrossRef]
  20. Berstad, D.; Gardarsdottir, S.; Roussanaly, S.; Voldsund, M.; Ishimoto, Y.; Nekså, P. Liquid Hydrogen as Prospective Energy Carrier: A Brief Review and Discussion of Underlying Assumptions Applied in Value Chain Analysis. Renew. Sustain. Energy Rev. 2022, 154, 111772. [Google Scholar] [CrossRef]
  21. Pustovalov, V.V. Serrated Deformation of Metals and Alloys at Low Temperatures (Review). Low Temp. Phys. 2008, 34, 683–723. [Google Scholar] [CrossRef]
  22. Obst, B.; Nyilas, A. Experimental Evidence on the Dislocation Mechanism of Serrated Yielding in f. c.c. Metals and Alloys at Low Temperatures. Materials Sci. Eng. A 1991, 137, 141–150. [Google Scholar] [CrossRef]
  23. Obst, B.; Nyilas, A. Time-Resolved Flow Stress Behavior of Structural Materials at Low Temperatures. In Advances in Cryogenic Engineering Materials; Springer: Boston, MA, USA, 1998; pp. 331–338. [Google Scholar]
  24. Basinski, Z.S. The Instability of Plastic Flow of Metals at Very Low Temperatures. Proc. R. Soc. Lond. A Math. Phys. Sci. 1957, 240, 229–242. [Google Scholar] [CrossRef]
  25. Skoczeń, B.; Bielski, J.; Sgobba, S.; Marcinek, D. Constitutive Model of Discontinuous Plastic Flow at Cryogenic Temperatures. Int. J. Plast. 2010, 26, 1659–1679. [Google Scholar] [CrossRef]
  26. Skoczeń, B.; Bielski, J.; Tabin, J. Multiaxial Constitutive Model of Discontinuous Plastic Flow at Cryogenic Temperatures. Int. J. Plast. 2014, 55, 198–218. [Google Scholar] [CrossRef]
  27. Reed, R.P.; Walsh, R.P. Tensile Strain Rate Effects in Liquid Helium. Adv. Cryog. Eng. 1988, 34, 199–208. [Google Scholar]
  28. ASTM E1450; Standard Test Method for Tension Testing of Structural Alloys in Liquid Helium. ASTM International: Conshohocken, PA, USA, 2016.
  29. Ogata, T. Evaluation of Mechanical Properties of Structural Materials at Cryogenic Temperatures and International Standardization for Those Methods. AIP Conf. Proc. 2014, 1574, 320–326. [Google Scholar]
  30. Tabin, J. Strain Measurement by Means of Clip-on Extensometers during Discontinuous Plastic Flow at 4 K. Cryogenics 2022, 123, 103451. [Google Scholar] [CrossRef]
  31. Tabin, J.; Skoczen, B.; Bielski, J. Strain Localization during Discontinuous Plastic Flow at Extremely Low Temperatures. Int. J. Solids Struct. 2016, 97–98, 593–612. [Google Scholar] [CrossRef]
  32. Weiss, K.; Nyilas, A. Specific Aspects on Crack Advance during J-Test Method for Structural Materials at Cryogenic Temperatures. Fatigue Fract. Eng. Mater. Struct. 2006, 29, 83–92. [Google Scholar] [CrossRef]
  33. Fernández-Pisón, P.; Rodríguez-Martínez, J.A.; García-Tabarés, E.; Avilés-Santillana, I.; Sgobba, S. Flow and Fracture of Austenitic Stainless Steels at Cryogenic Temperatures. Eng. Fract. Mech. 2021, 258, 108042. [Google Scholar] [CrossRef]
  34. Seok, C.-S. Correction Methods of an Apparent Negative Crack Growth Phenomenon. Int. J. Fract. 2000, 102, 259–269. [Google Scholar] [CrossRef]
  35. JIS Z 2284; Method of elastic-plastic fracture toughness JIC testing for metallic materials in liquid helium. Japanese Standards Association: Tokyo, Japan, 1998.
  36. Nyilas, A.; Obst, B.; Harries, D.R. Mechanical Investigations on Aged Stainless Steel and Incoloy 908 Materials at 4.2 K and 7 K. In Advances in Cryogenic Engineering Materials; Springer: Boston, MA, USA, 1998; pp. 17–24. [Google Scholar]
  37. ASTM A240/A240M-22a; Standard Specification for Chromium and Chromium-Nickel Stainless Steel Plate , Sheet , and Strip for Pressure Vessels and for General Applications. ASTM International: Conshohocken, PA, USA, 2022.
  38. ASTM E1820-21; Standard Test Method for Measurement of Fracture Toughness. ASTM International: Conshohocken, PA, USA, 2021.
  39. Ogata, T.; Ishikawa, K. A New Liquid Helium Temperature Fatigue Testing System. Trans. Iron Steel Inst. Jpn. 1986, 26, 48–52. [Google Scholar] [CrossRef]
  40. Rusinek, A.; Klepaczko, J.R. Experiments on Heat Generated during Plastic Deformation and Stored Energy for TRIP Steels. Mater. Des. 2009, 30, 35–48. [Google Scholar] [CrossRef]
  41. Vazquez-Fernandez, N.I.; Soares, G.C.; Smith, J.L.; Seidt, J.D.; Isakov, M.; Gilat, A.; Kuokkala, V.T.; Hokka, M. Adiabatic Heating of Austenitic Stainless Steels at Different Strain Rates. J. Dyn. Behav. Mater. 2019, 5, 221–229. [Google Scholar] [CrossRef]
  42. Zheng, C.; Yu, W. Effect of Low-Temperature on Mechanical Behavior for an AISI 304 Austenitic Stainless Steel. Mater. Sci. Eng. A 2018, 710, 359–365. [Google Scholar] [CrossRef]
  43. ASTM E8/E8M-21; Standard Test Methods for Tension Testing of Metallic Materials. ASTM International: Conshohocken, PA, USA, 2021.
  44. Horstman, R.; Lieb, K.; Power, B.; Meltzer, R.; Vieth, M.; Clarke, G.; Landes, J. Evaluation of the J Integral for the Compact Specimen. J. Test. Eval. 1979, 7, 264. [Google Scholar] [CrossRef]
  45. Tabin, J. Kinematic and Thermal Characteristic of Discontinuous Plastic Flow in Metastable Austenitic Stainless Steels. Mech. Mater. 2021, 163, 104090. [Google Scholar] [CrossRef]
  46. Ogata, T.; Ishikawa, K.; Nagai, K. Effects of Strain Rate on the Tensile Behavior of Stainless Steels, Copper, and an Aluminium Alloy at Cryogenic Temperatures. Tetsu-Hagane 1985, 71, 1390–1397. [Google Scholar] [CrossRef]
  47. González Assías, S.L.; Kotik, H.G.; Perez Ipiña, J.E. Evolution of the Geometrical and Morphological Characteristics of Splits during Fracture Toughness Test. Theor. Appl. Fract. Mech. 2022, 117, 103179. [Google Scholar] [CrossRef]
  48. Perez Ipiña, J.; Korin, I. Effects of Divider Orientation Split-out on Fracture Toughness. Fatigue Fract. Eng. Mater. Struct. 2013, 36, 242–253. [Google Scholar] [CrossRef]
  49. Ruggieri, C.; Hippert, E. Delamination Effects on Fracture Behavior of a Pipeline Steel: A Numerical Investigation of 3-D Crack Front Fields and Constraint. Int. J. Press. Vessel. Pip. 2015, 128, 18–35. [Google Scholar] [CrossRef]
  50. Bramfitt, B.L.; Marder, A.R. A Study of the Delamination Behavior of a Very Low-Carbon Steel. Metall. Trans. A 1977, 8, 1263–1273. [Google Scholar] [CrossRef]
  51. Grange, R.A. Effect of Microstructural Banding in Steel. Metall. Trans. 1971, 2, 417–426. [Google Scholar] [CrossRef]
  52. Sun, J.; Boyd, J.D. Effect of Thermomechanical Processing on Anisotropy of Cleavage Fracture Stress in Microalloyed Linepipe Steel. Int. J. Press. Vessel. Pip. 2000, 77, 369–377. [Google Scholar] [CrossRef]
  53. Pilhagen, J.; Sandström, R. Loss of Constraint during Fracture Toughness Testing of Duplex Stainless Steels. Eng. Fract. Mech. 2013, 99, 239–250. [Google Scholar] [CrossRef]
  54. Sieurin, H.; Sandström, R. Fracture Toughness of a Welded Duplex Stainless Steel. Eng. Fract. Mech. 2006, 73, 377–390. [Google Scholar] [CrossRef]
  55. Rana, M.D.; Doty, W.D.; Yukawa, S.; Zawierucha, R. Fracture Toughness Requirements for ASME Section VIII Vessels for Temperatures Colder Than 77K. J. Press. Vessel Technol. 2001, 123, 332–337. [Google Scholar] [CrossRef]
  56. Park, J.; Lee, K.; Sung, H.; Kim, Y.J.; Kim, S.K.; Kim, S. J-Integral Fracture Toughness of High-Mn Steels at Room and Cryogenic Temperatures. Metall. Mater. Trans. A 2019, 50, 2678–2689. [Google Scholar] [CrossRef]
  57. Lee, H.M.; Shin, J.Y.; Shin, H.S. Fracture Toughness of Structural Materials for LNG Storage Tank at Cryogenic Temperatures. Korean Inst. GAS 1998, 340–349. [Google Scholar]
  58. Murase, S.; Kobatake, S.; Tanaka, M.; Tashiro, I.; Horigami, O.; Ogiwara, H.; Shibata, K.; Nagai, K.; Ishikawa, K. Effects of a High Magnetic Field on Fracture Toughness at 4.2 K for Austenitic Stainless Steels. Fusion Eng. Des. 1993, 20, 451–454. [Google Scholar] [CrossRef]
Figure 1. Dimension of the specimen of the 304L stainless steel: (a) Compact specimen and (b) tensile specimen.
Metals 13 01774 g001
Figure 2. Installation of the compact specimen in the tensile cryostat.
Metals 13 01774 g002
Figure 3. Mechanical behavior of 304L stainless steel at 20 K, 77 K, and 300 K: (a) Full range and (b) necking range.
Metals 13 01774 g003
Figure 4. Force and displacement time history of tensile specimen at 77 K and 300 K: (a) Full range, (b) elastic range for 77 K, (c) initial plastic range for 77 K, and (d) initial plastic range for 300 K.
Metals 13 01774 g004
Figure 5. Force and displacement time history of tensile specimen at 20 K: (a) Full range, (b) elastic range, (c) stress plateau range, and (d) necking range.
Metals 13 01774 g005
Figure 6. SEM image of the fractured surface of the tensile specimen in accordance with temperature: (ac) 300 K, (df) 77 K, and (gi) 20 K.
Metals 13 01774 g006
Figure 7. Force and crack-opening displacement relation of 304L stainless steel at 20 K: (a) Full range and (b) larger magnification.
Metals 13 01774 g007
Figure 8. Time history of force and crack-opening displacement of 304L stainless steel at 20 K.
Metals 13 01774 g008
Figure 9. Estimated compliance with untreated and corrected data: (a) 300 K, (b) 77 K, and (c) 20 K.
Metals 13 01774 g009
Figure 10. Resistance curve of 304L stainless steel in accordance with testing temperature: (a) 300 K, (b) 77 K, and (c) 20 K.
Metals 13 01774 g010
Figure 11. Fracture surface of C(T) specimen in accordance with test temperature: (a) 300 K, (b) 77 K, and (c) 20 K; Yellow arrows indicate delamination that has occurred beyond the heat-tint area.
Metals 13 01774 g011
Figure 12. SEM image of fractured C(T) specimen in accordance with testing temperature: (ac) 300 K, (df) 77 K, and (gi) 20 K.
Metals 13 01774 g012
Table 1. Chemical composition of the 304L stainless steel (%).
CSiMnPSCrNiMoNCu
0.02170.3751.4320.03380.003218.1218.0520.1340.03780.378
Table 2. Tensile properties of the 304L stainless steel in accordance with temperature.
Temp.
(K)
Yield Strength (MPa)Tensile Strength (MPa)Elongation (%)
0.2% Offset1.0% Offset
300258.0291.8724.975.9
77856.01022.32172.035.7
201059.01245.72433.432.6
Table 3. Comparison of physically measured and predicted initial crack size.
Temp. (K) Measured   a 0 (mm) Predicted   a 0 q (mm)
Untreated DataRegression Technique
30015.5115.3115.30
7715.7116.0516.09
2015.4815.7115.76
Table 4. Comparison of JIC based on the correction techniques.
Temp. (K)w/Exclusion Techniquew/o Exclusion TechniqueRegression Technique
w / Corrected   a 0 q w / o   Corrected   a 0 q
300484.8484.8465.1487.8
77321.4134.9276.7187.1
20254.2219.2236.7166.8
(unit: kJ/m2).
Disclaimer/Publisher’s Note: The statements, opinions and data contained in all publications are solely those of the individual author(s) and contributor(s) and not of MDPI and/or the editor(s). MDPI and/or the editor(s) disclaim responsibility for any injury to people or property resulting from any ideas, methods, instructions or products referred to in the content.

