

Mechanical Characteristics and Corrosion Behavior of Two New Titanium Alloys

 , ,
, ,  and
and 
Abstract
:1. Introduction
2. Materials and Methods
2.1. Material Preparation
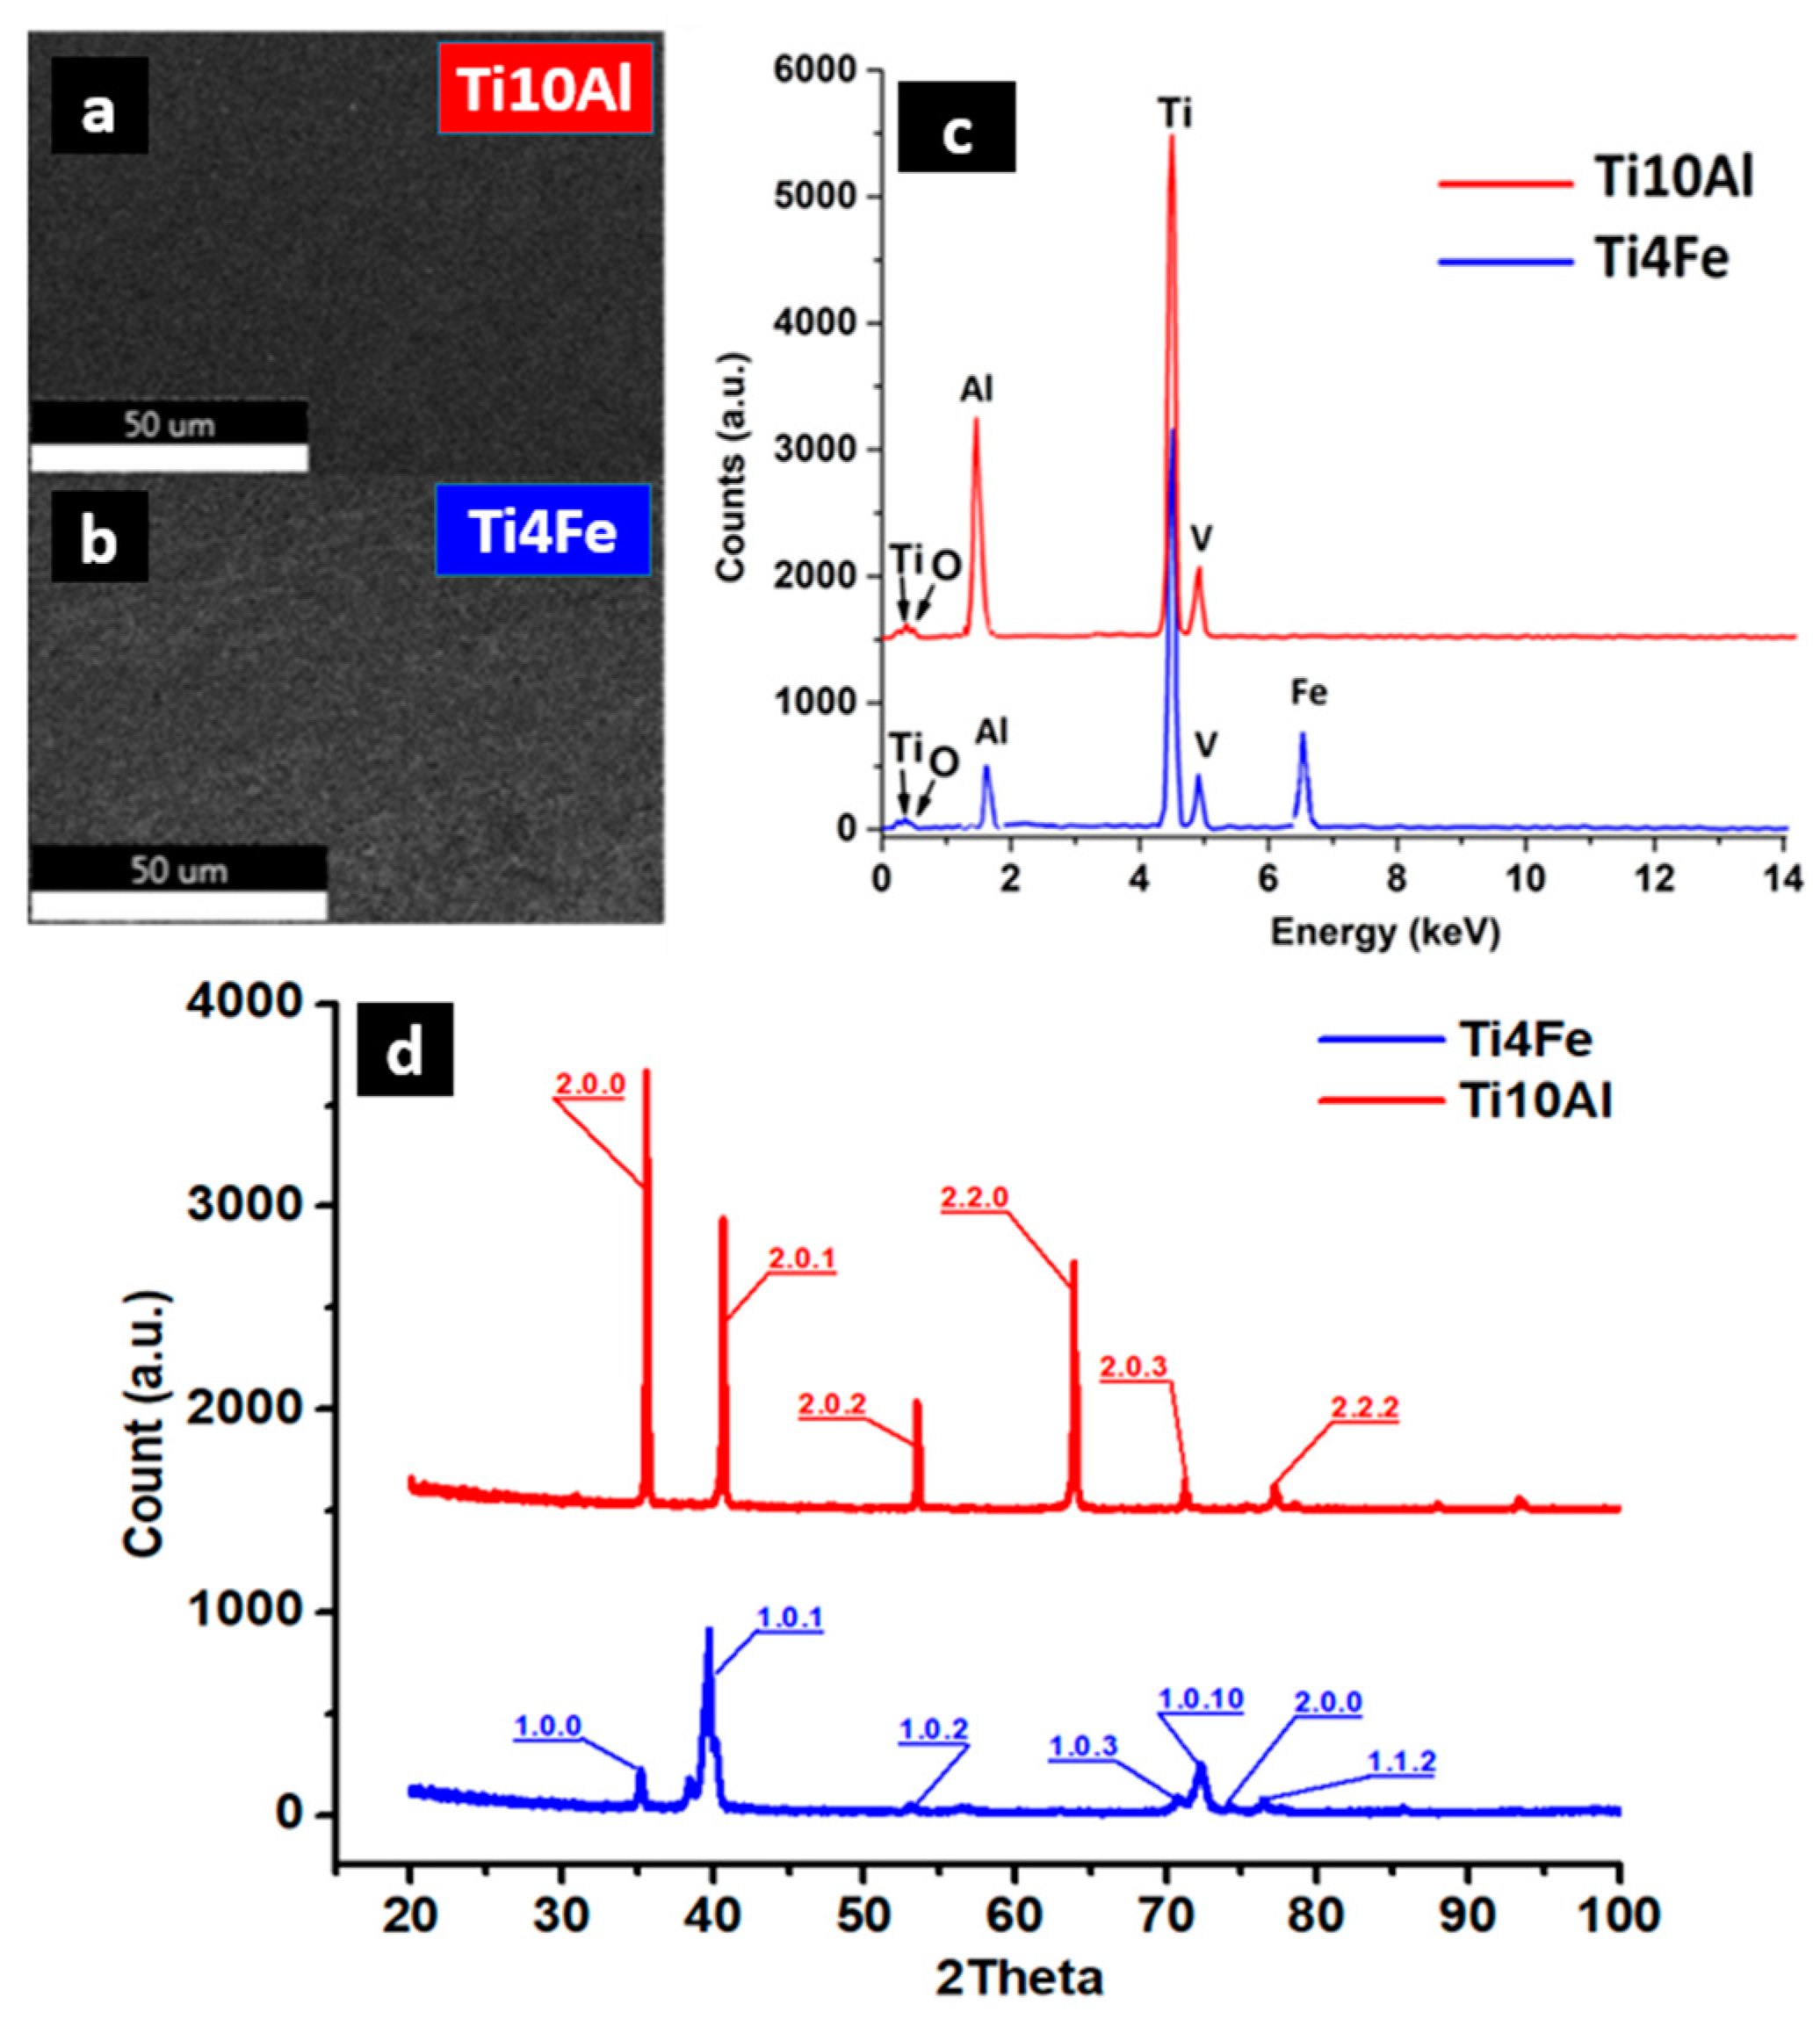
2.2. Microstructure
2.3. Electrochemical Tests
2.4. Three-Point Bending Test
2.5. Microhardness Test
3. Results
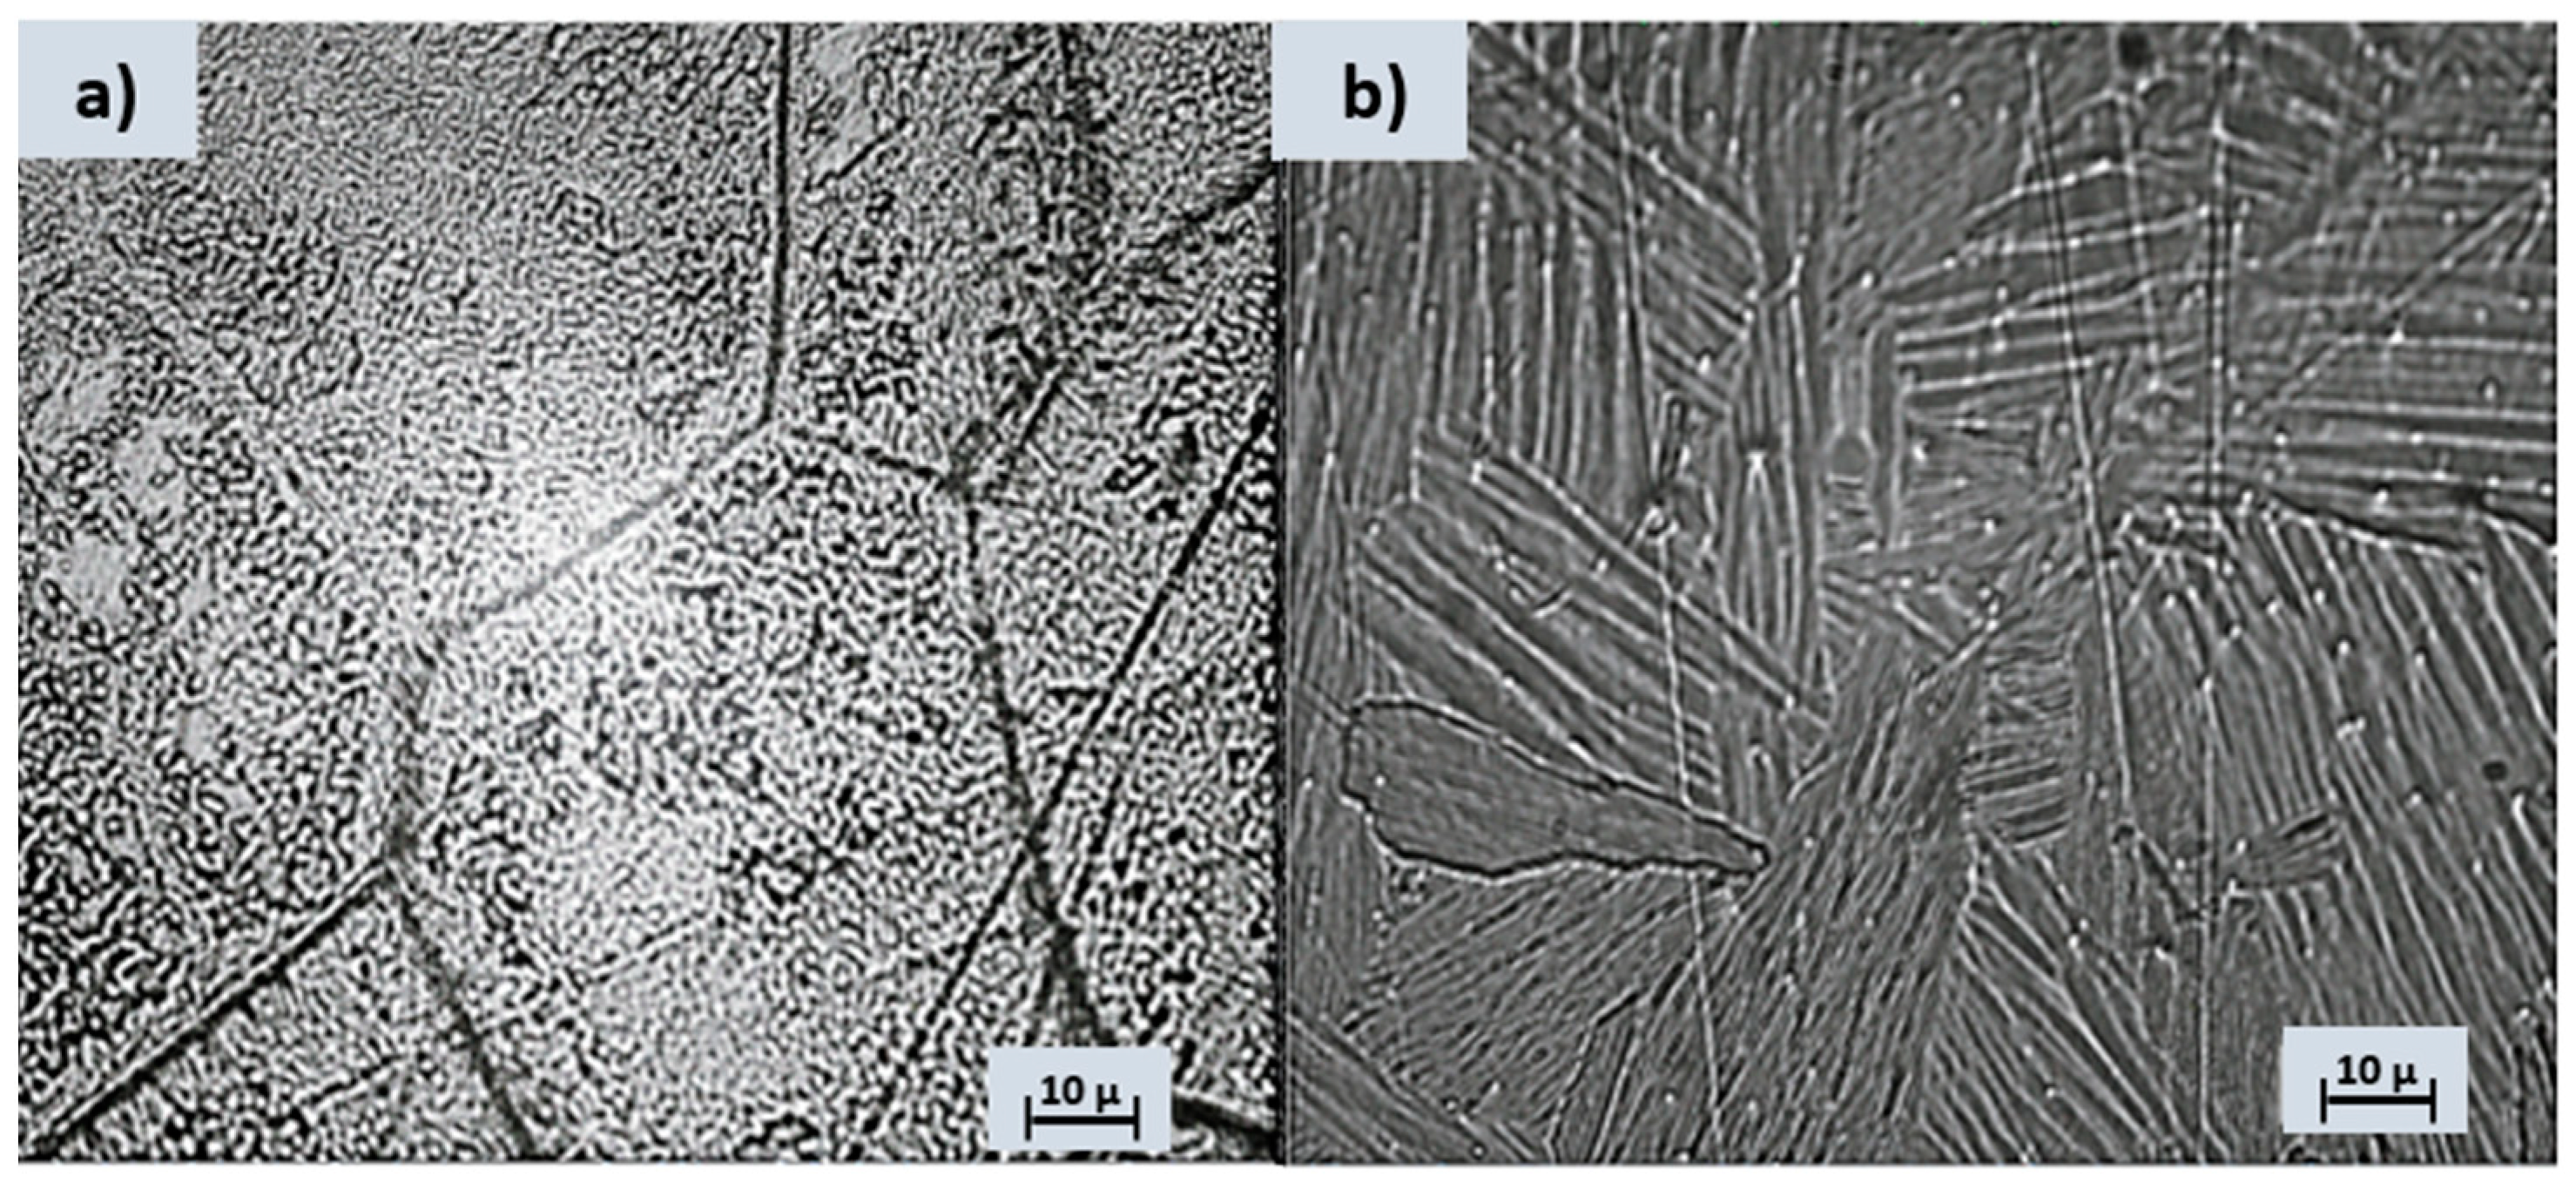
3.1. Metallography
3.2. Electrochemical Tests
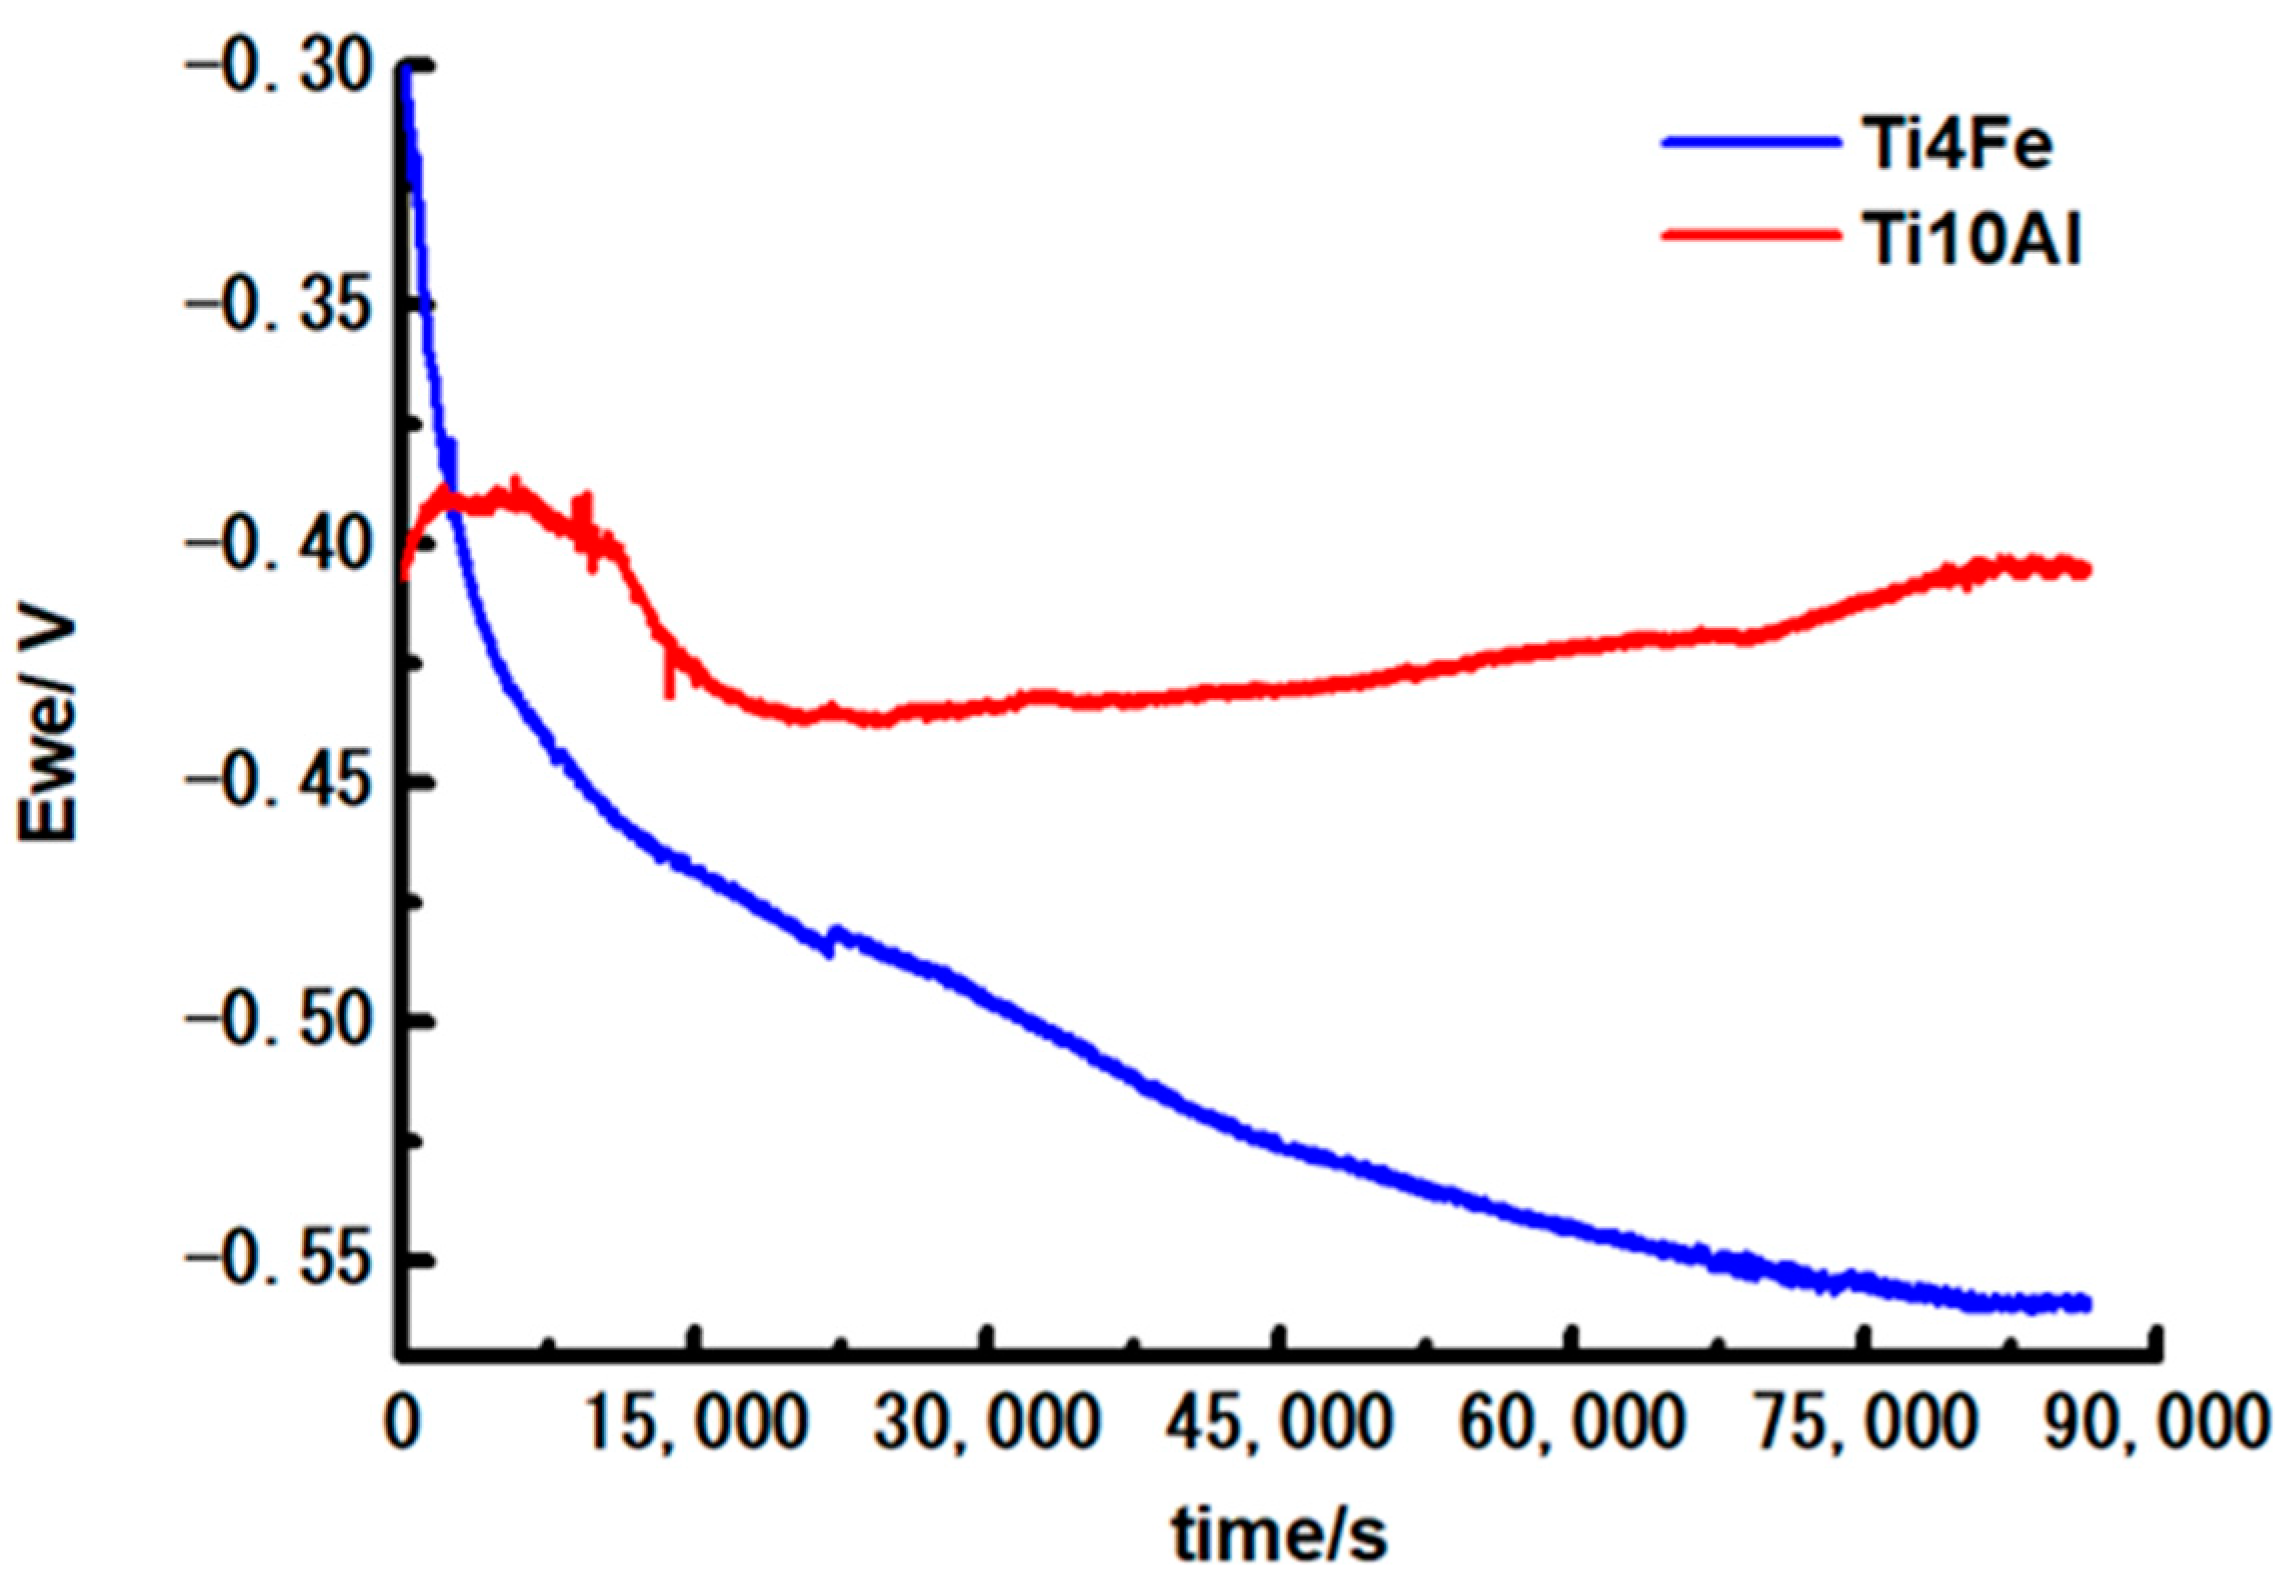
3.2.1. Corrosion Potential (Ecorr)
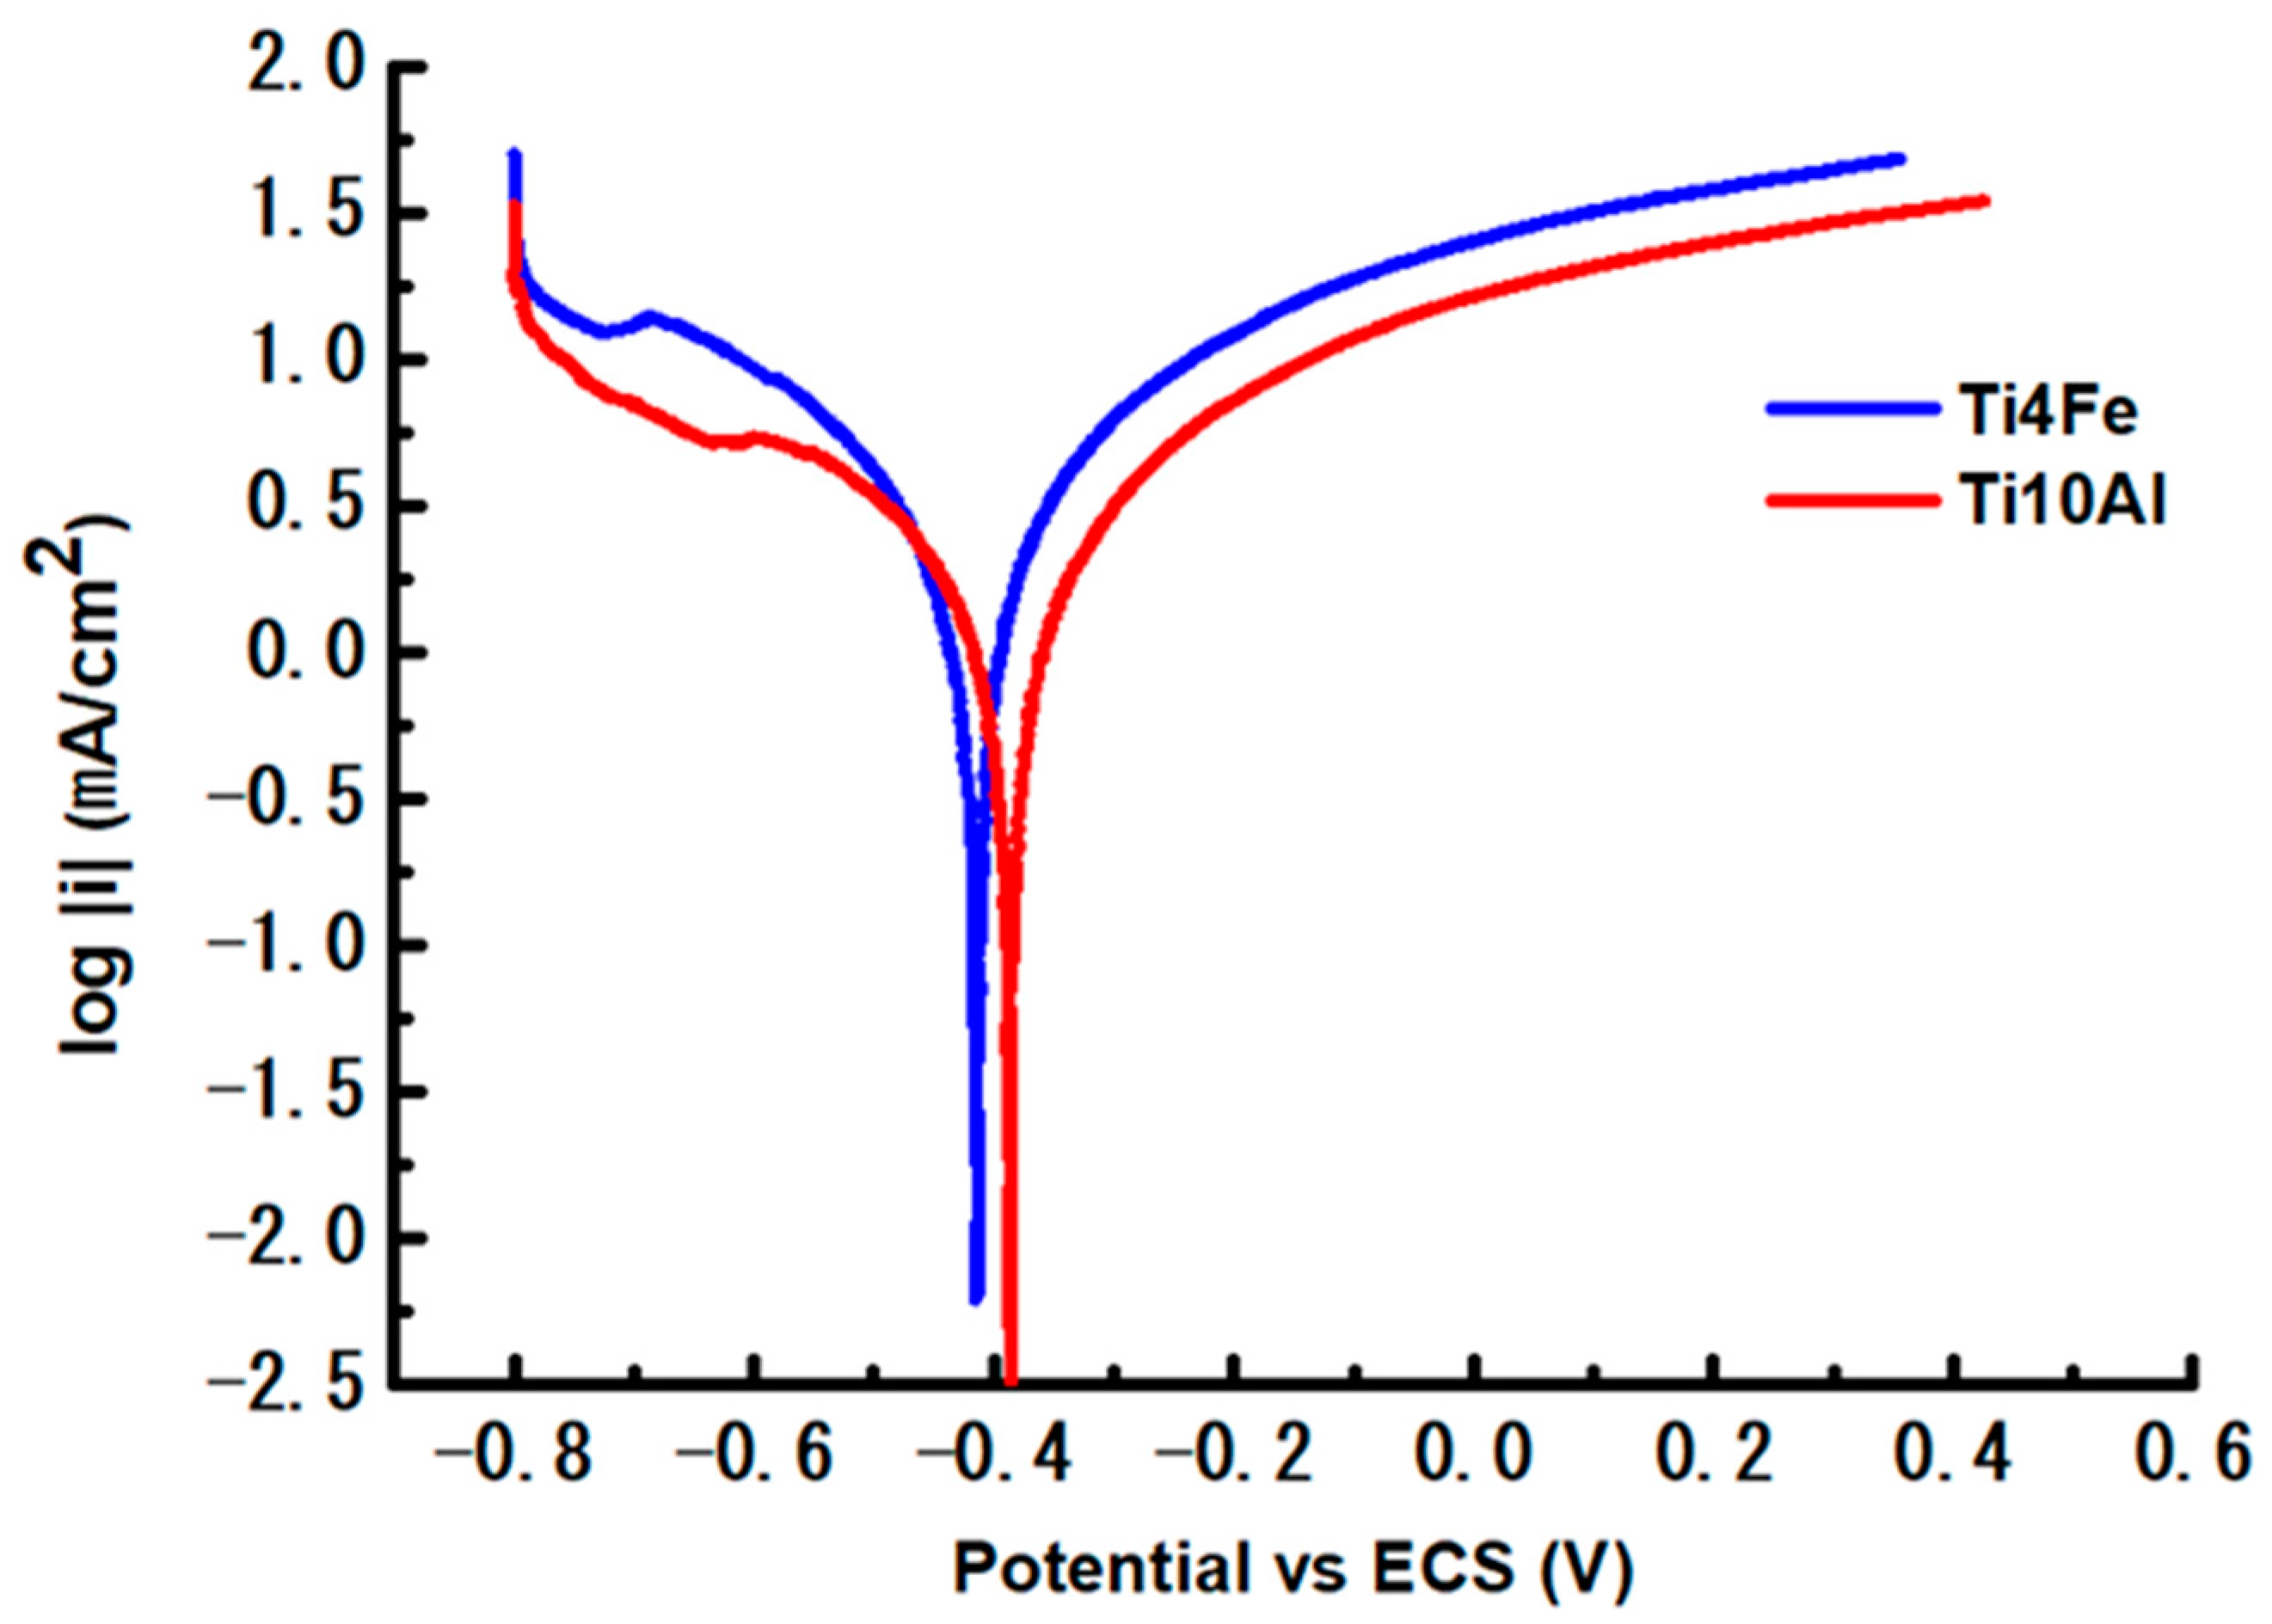
3.2.2. Corrosion Rate (CR)
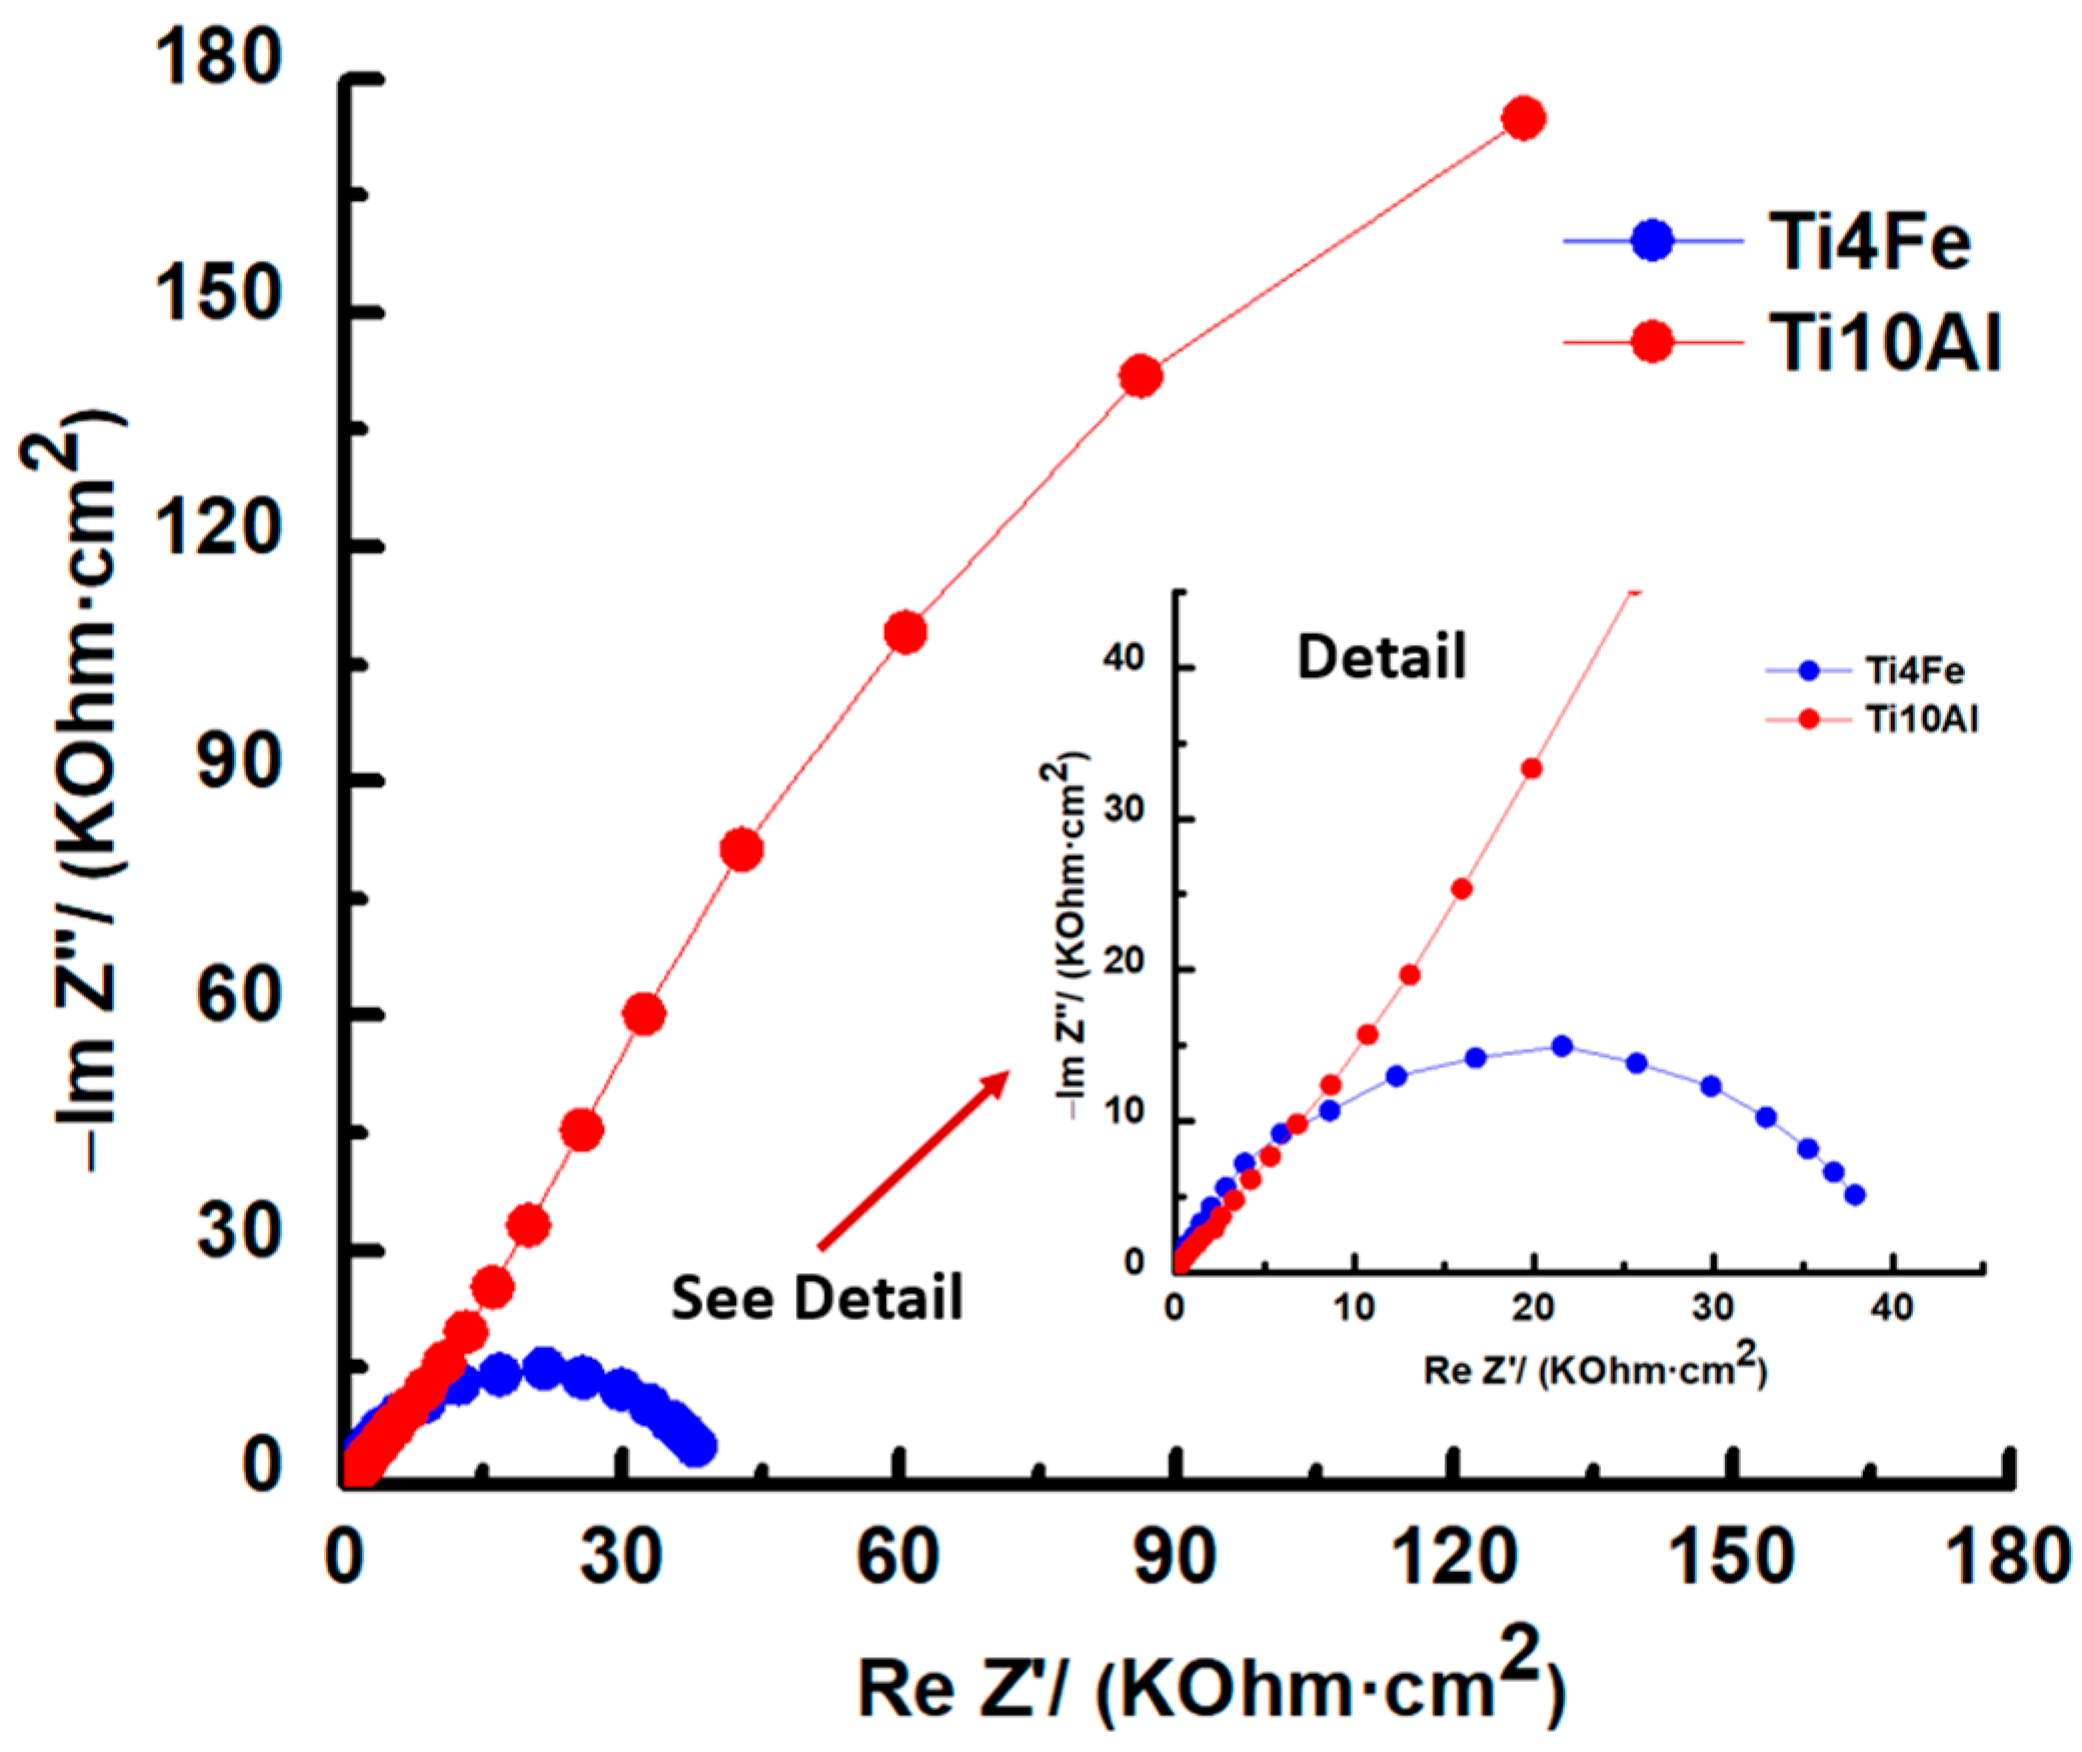
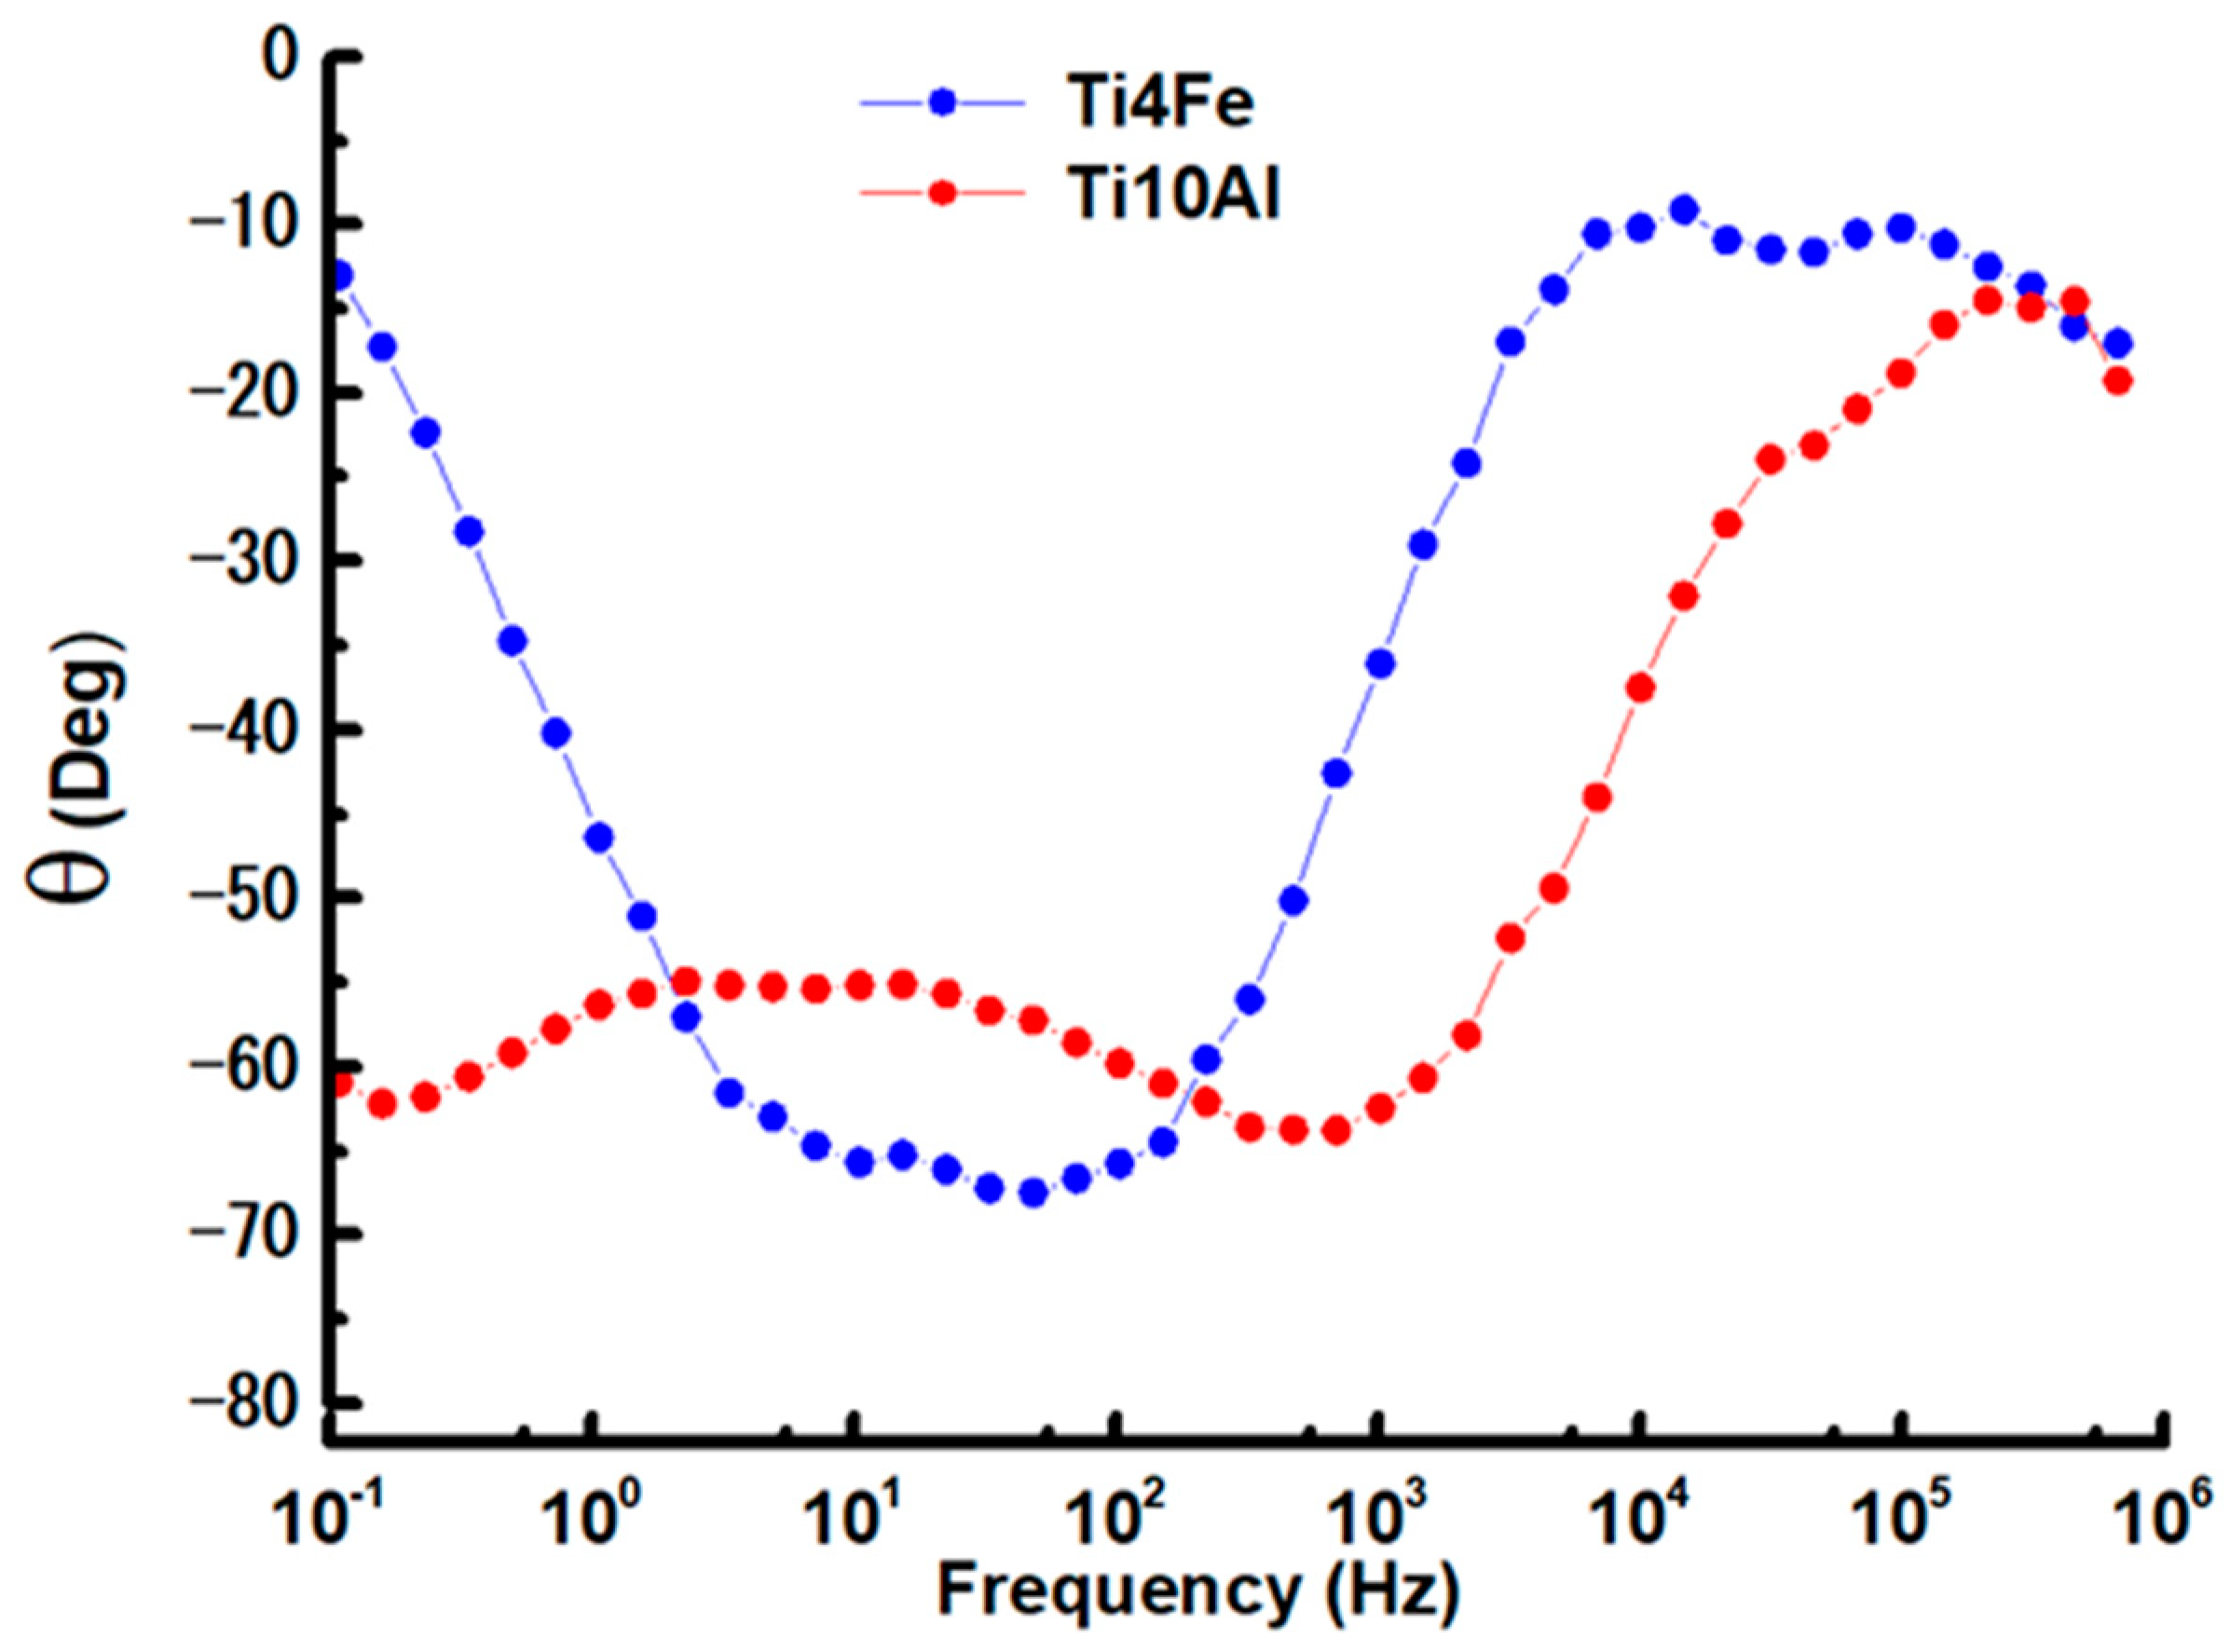
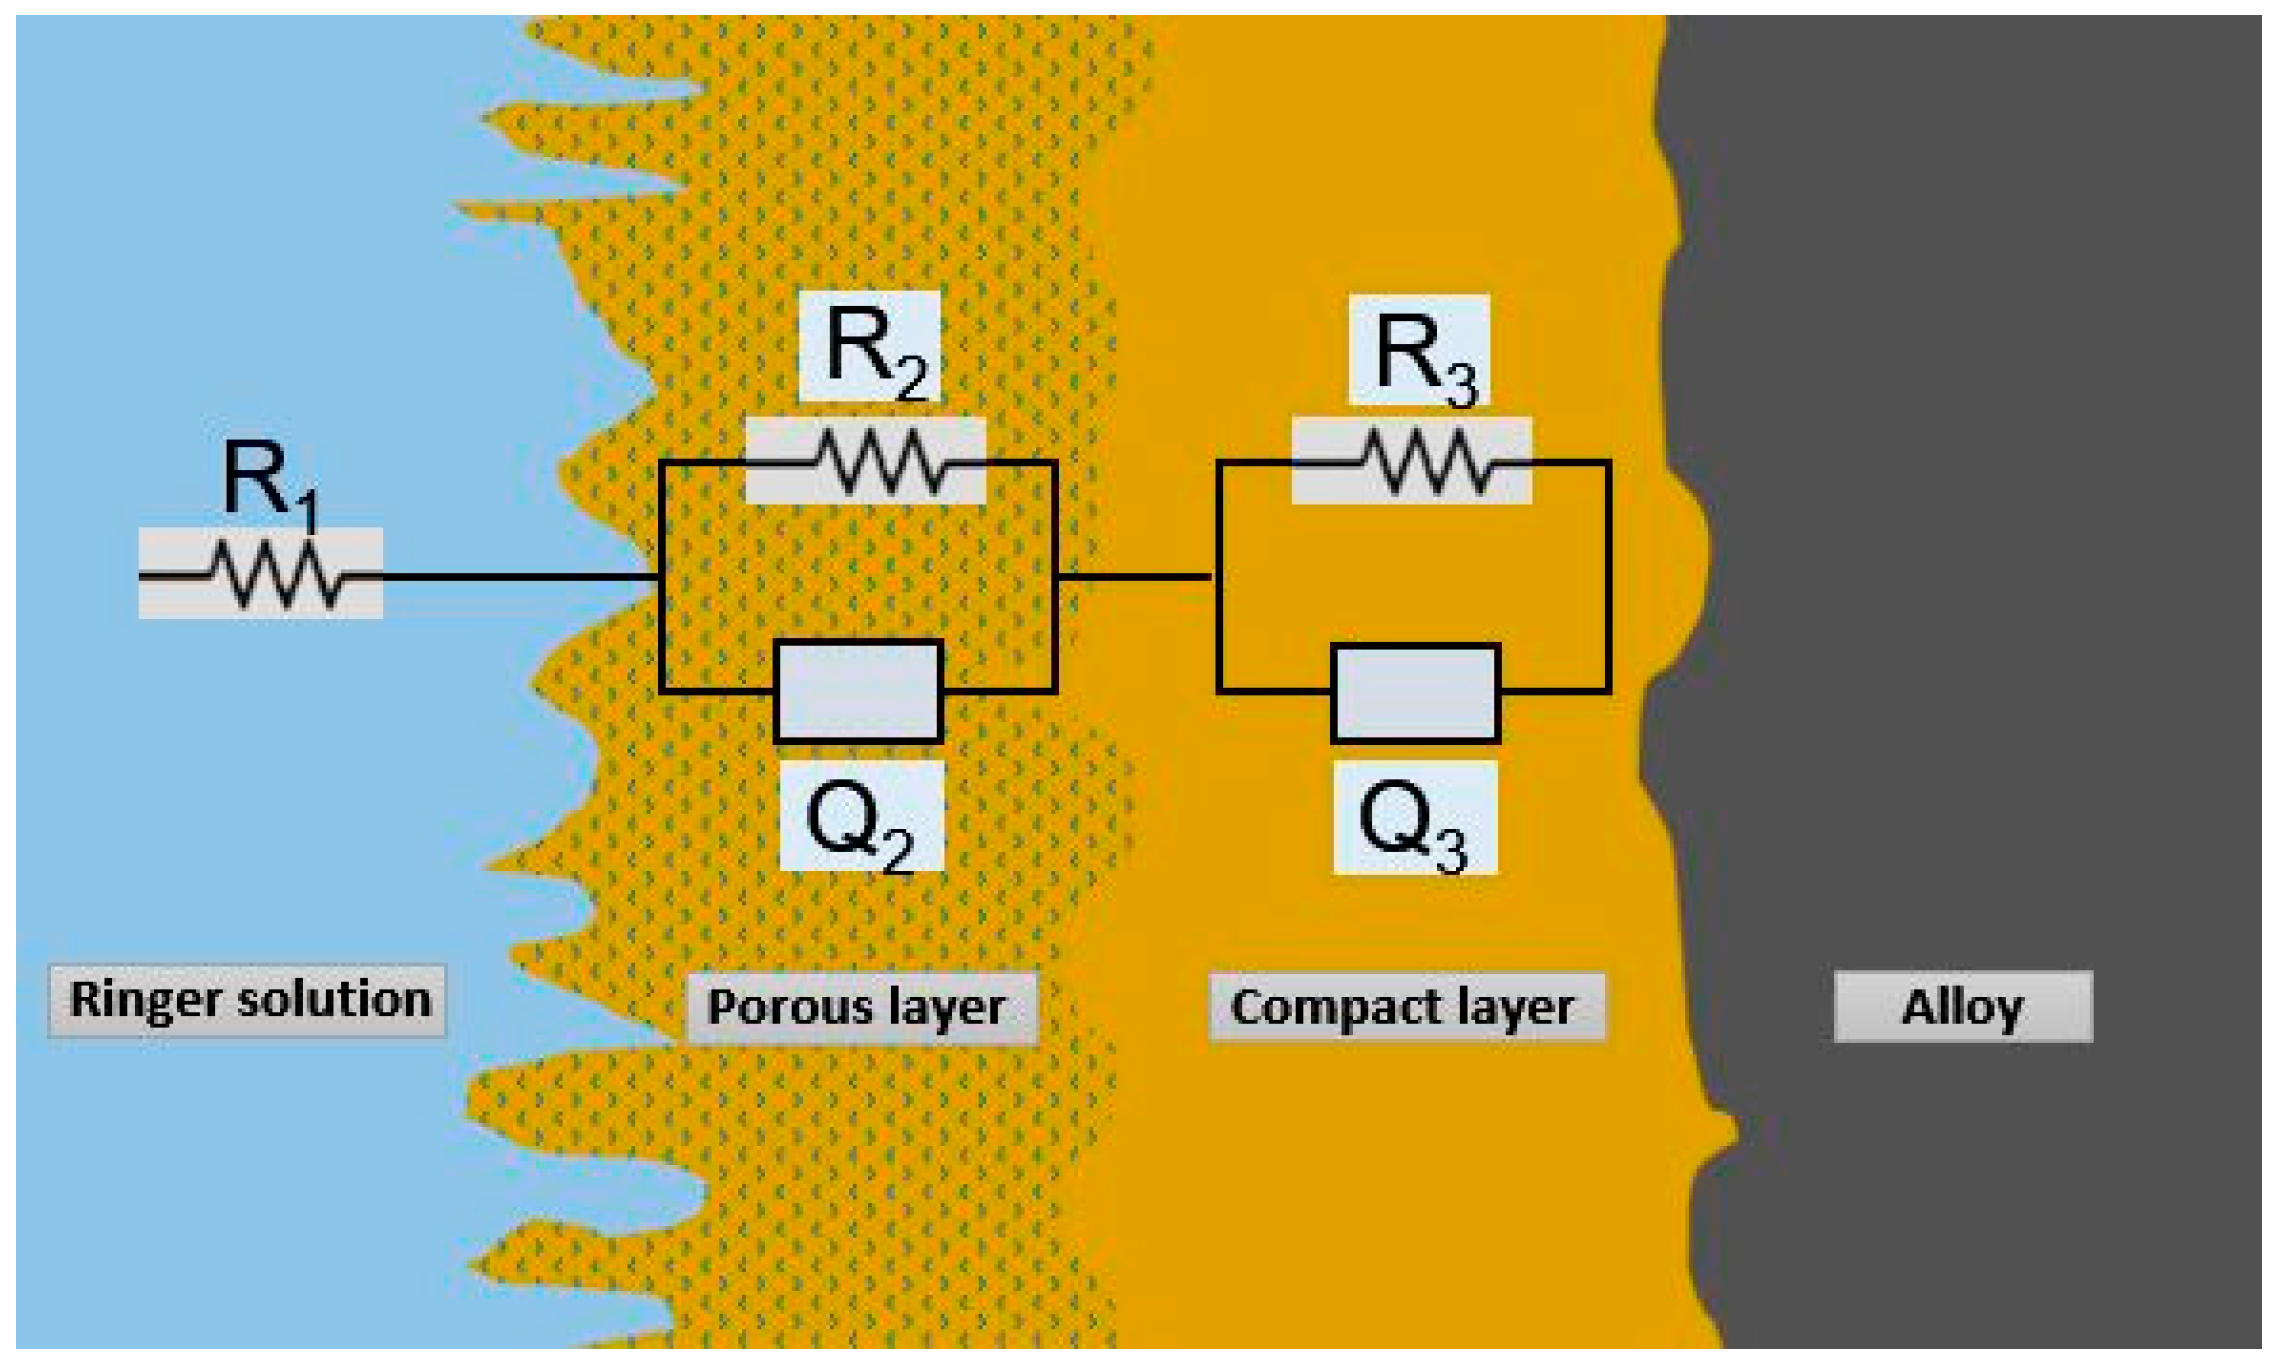
3.2.3. Electrochemical Impedance Spectroscopy (EIS)
3.3. Three-Point Bending Test
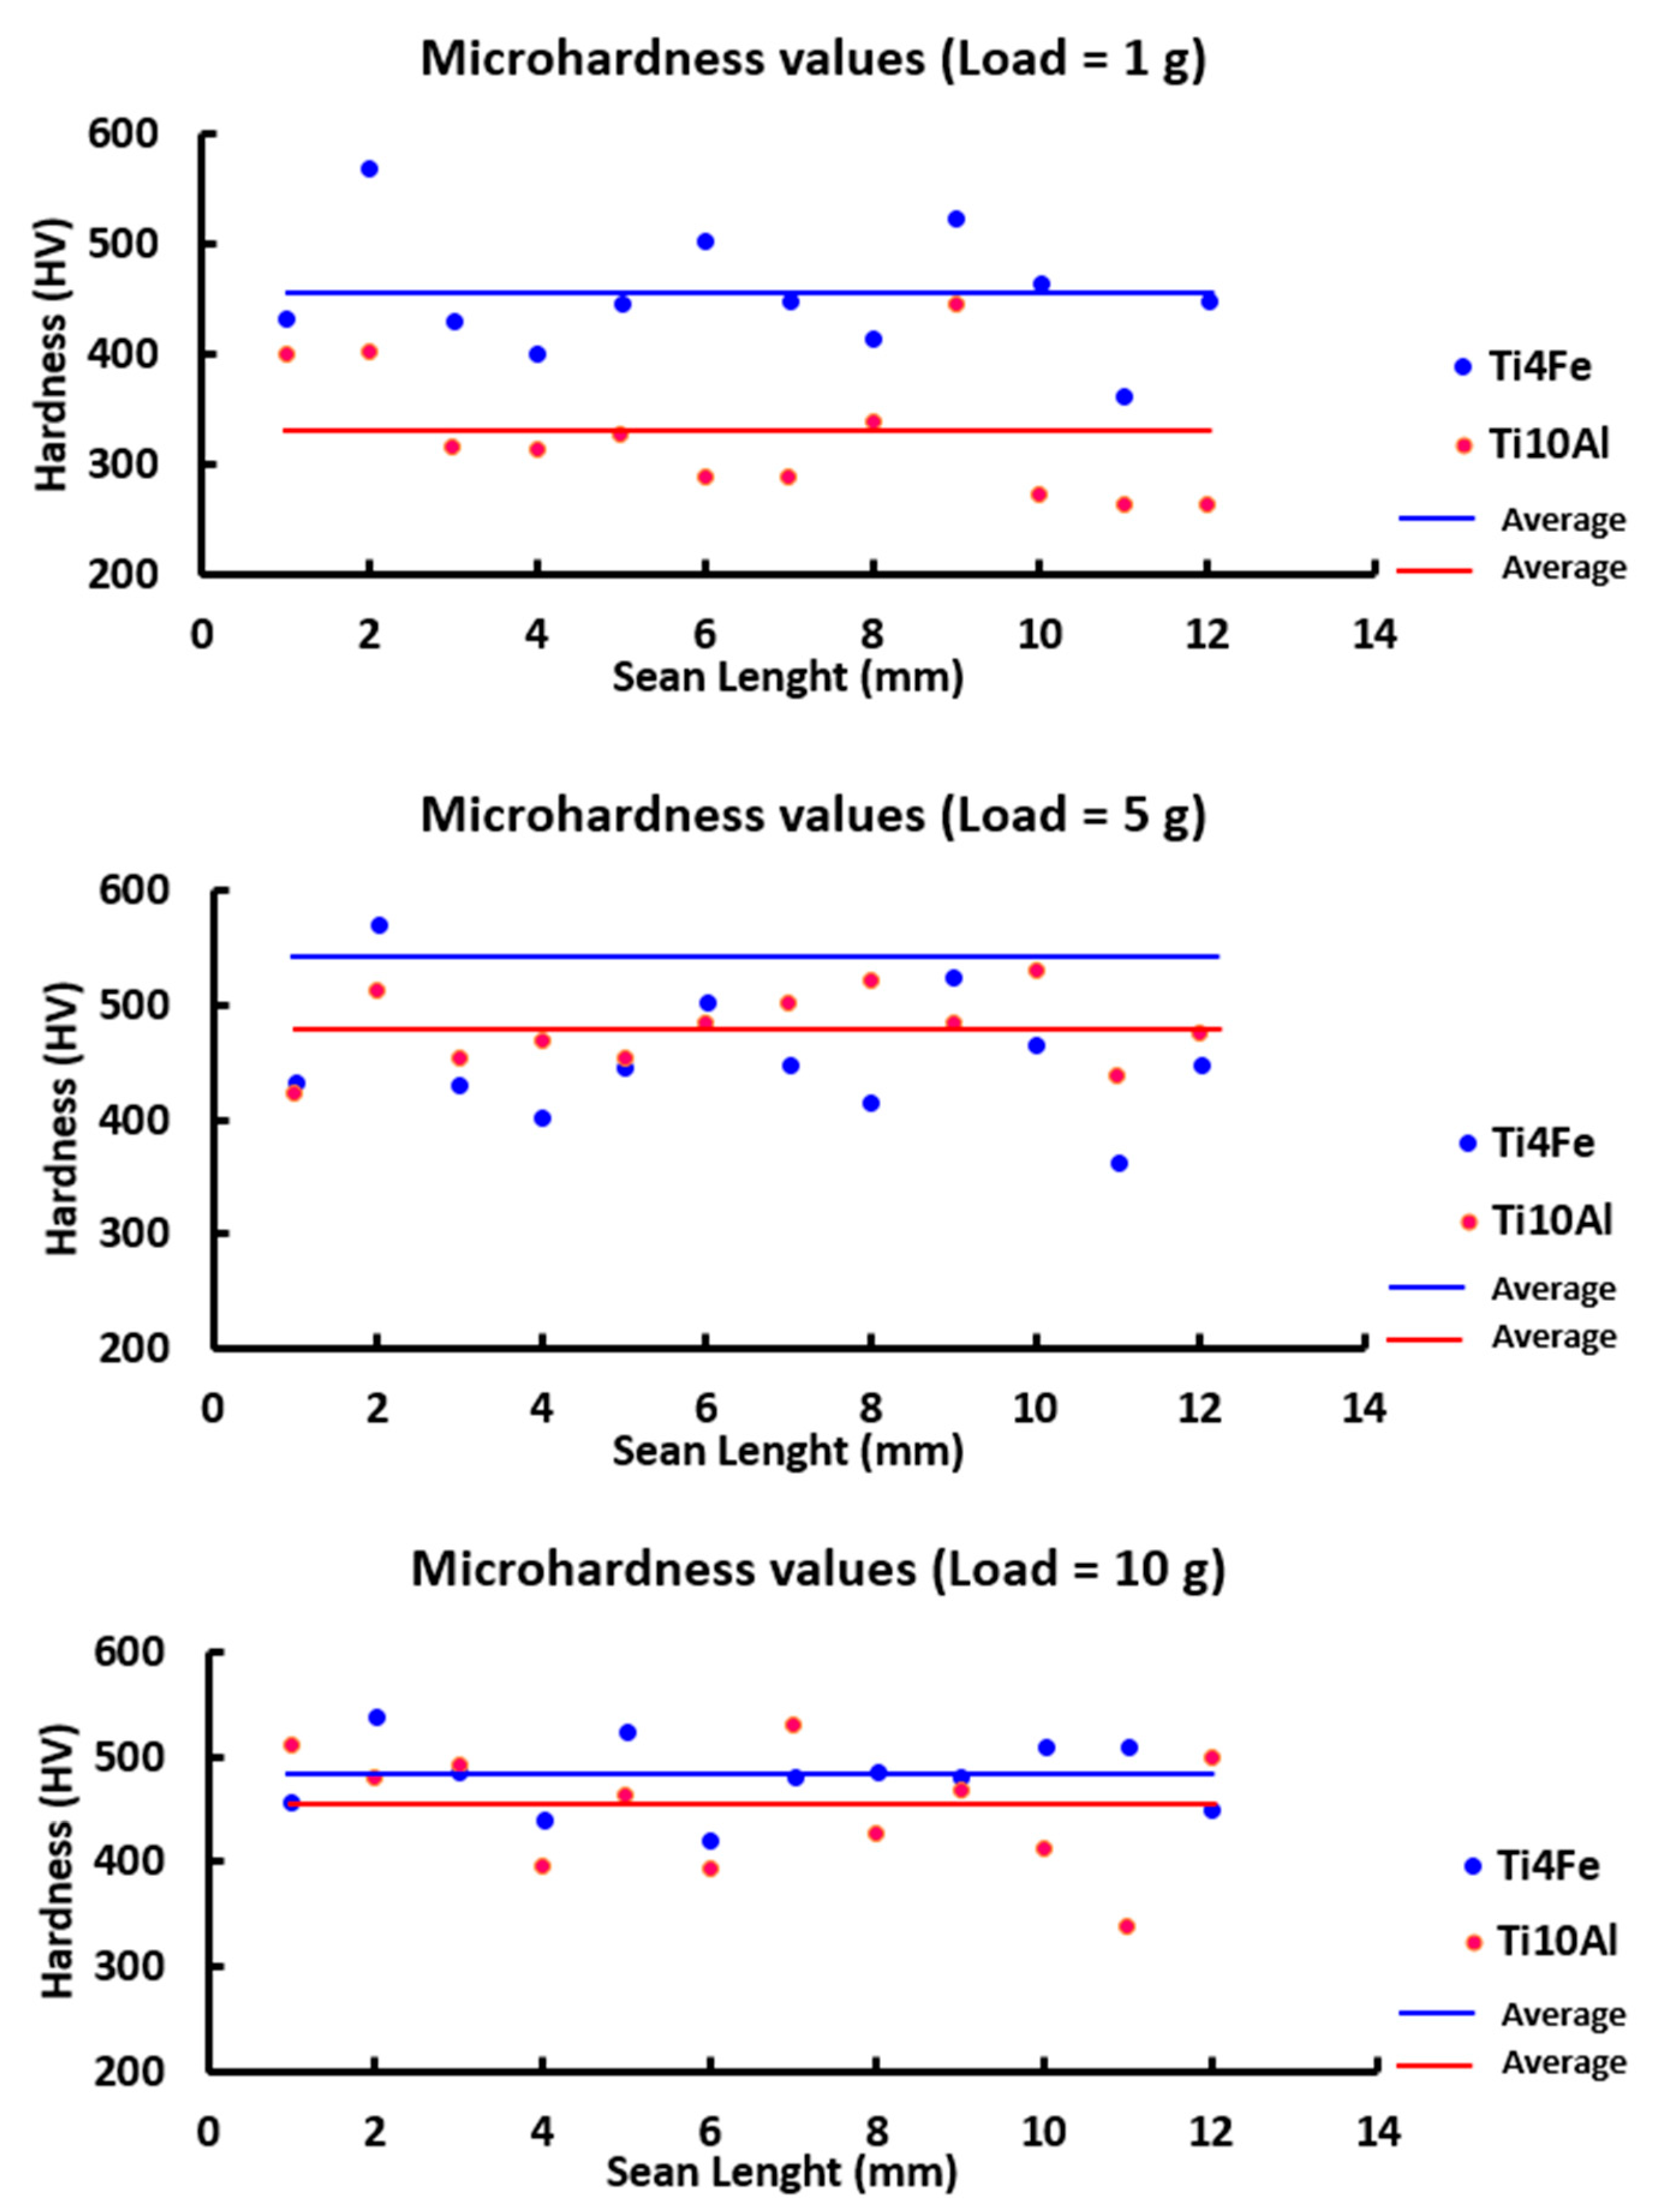
3.4. Microhardness Test
4. Conclusions
- The metallographic test shows an alpha structure for the Ti10Al alloy and a biphasic structure for Ti10Fe.
- The potential of Ti10Al increased during the 24 h of immersion time proving that the surface’s passive coating is thermodynamically resilient under these circumstances. The open circuit potential of Ti4Fe is decreasing in time due to the corrosion process which takes place on the surface of the alloy.
- The AC corrosion resistance measurement (R3) for the Ti4Fe alloy is two orders of magnitude lower than for the Ti10Al alloy as determined by the equivalent circuit simulation, which is also supported by the similar disparity in the corrosion rate values for the two alloys which were determined using the DC method.
- The modulus of elasticity values were fairly close, hovering about 35 GPa, and compared to several commercial alloys, they were lower.
- According to our results, the new alloy Ti10Al demonstrated good mechanical qualities (hardness and elastic modulus) and great corrosion resistance in contrast to commercial alloys.
Author Contributions
Funding
Data Availability Statement
Conflicts of Interest
References
- Bhamra, R.; Hicks, C.; Small, A.; García-Villarreal, E. Value, product delivery strategies and operational performance in the medical technology industry. Int. J. Prod. Econ. 2022, 245, 108399. [Google Scholar] [CrossRef]
- Bandyopadhyay, A.; Mitra, I.; Goodman, S.B.; Kumar, M.; Bose, S. Improving biocompatibility for next generation of metallic implants. Prog. Mater. Sci. 2023, 133, 101053. [Google Scholar] [CrossRef] [PubMed]
- Biswal, T.; BadJena, S.K.; Pradhan, D. Sustainable biomaterials and their applications: A short review. Mater. Today Proc. 2020, 30, 274–282. [Google Scholar] [CrossRef]
- Simorgh, S.; Alasvand, N.; Khodadadi, M.; Ghobadi, F.; Malekzadeh Kebria, M.; Brouki Milan, P.; Kargozar, S.; Baino, F.; Mobasheri, A.; Mozafari, M. Additive manufacturing of bioactive glass biomaterials. Methods 2022, 208, 75–91. [Google Scholar] [CrossRef]
- Niinomi, M.; Nakai, M.; Hieda, J. Development of new metallic alloys for biomedical applications. Acta Biomater. 2012, 8, 3888–3903. [Google Scholar] [CrossRef] [PubMed]
- Zhang, L.C.; Chen, L.Y. A Review on Biomedical Titanium Alloys: Recent Progress and Prospect. Adv. Eng. Mater. 2019, 21, 1801215. [Google Scholar] [CrossRef]
- Popa, M.V.; Vasilescu, E.; Drob, P.; Anghel, M.; Vasilescu, C.; Mirza-Rosca, I.; Lopez, A.S. Anodic passivity of some titanium base alloys in aggressive environments. Mater. Corros. 2002, 53, 51–55. [Google Scholar] [CrossRef]
- Vasilescu, E.; Drob, P.; Popa, M.V.; Anghel, M.; Santana Lopez, A.; Mirza-Rosca, I. Characterisation of anodic oxide films formed on titanium and two ternary titanium alloys in hydrochloric acid solutions. Werkst. Und Korros. 2000, 51, 413–417. [Google Scholar] [CrossRef]
- Kaur, M.; Singh, K. Review on titanium and titanium based alloys as biomaterials for orthopaedic applications. Mater. Sci. Eng. C 2019, 102, 844–862. [Google Scholar] [CrossRef] [PubMed]
- Guerra-Yánez, H.; Florido-Suárez, N.R.; Voiculescu, I.; Mirza-Rosca, J.C. Corrosion behavior of new titanium alloys for medical applications. Mater. Today Proc. 2023, 72, 533–537. [Google Scholar] [CrossRef]
- Wang, H.; Chao, Q.; Chen, H.S.; Chen, Z.B.; Primig, S.; Xu, W.; Ringer, S.P.; Liao, X.Z. Formation of a transition V-rich structure during the α’ to α + β phase transformation process in additively manufactured Ti-6Al-4 V. Acta Mater. 2022, 235, 118104. [Google Scholar] [CrossRef]
- Madeira, S.; Buciumeanu, M.; Nobre, D.; Carvalho, O.; Silva, F.S. Development of a novel hybrid Ti6Al4V–ZrO2 surface with high wear resistance by laser and hot pressing techniques for dental implants. J. Mech. Behav. Biomed. Mater. 2022, 136, 105508. [Google Scholar] [CrossRef]
- Rana, M.; Karmakar, S.; Bandyopadhyay, A.; Roychowdhury, A. Design and manufacturing of patient-specific Ti6Al4V implants with inhomogeneous porosity. J. Mech. Behav. Biomed. Mater. 2023, 143, 105925. [Google Scholar] [CrossRef] [PubMed]
- Eldabah, N.M.; Shoukry, A.; Khair-Eldeen, W.; Kobayashi, S.; Gepreel, M.A.H. Design and characterization of low Young’s modulus Ti-Zr-Nb-based medium entropy alloys assisted by extreme learning machine for biomedical applications. J. Alloys Compd. 2023, 968, 171755. [Google Scholar] [CrossRef]
- Walunj, G.; Desai, J.; Bohara, S.; Contieri, R.; Kothapalli, C.; Ivanov, E.; Borkar, T. Light weight- low modulus biocompatible titanium alloys processed via spark plasma sintering. J. Alloy. Metall. Syst. 2023, 3, 100018. [Google Scholar] [CrossRef]
- Niinomi, M. Recent research and development in metallic materials for biomedical, dental and healthcare products applications. Mater. Sci. Forum 2007, 539–543 Pt 1, 193–200. [Google Scholar] [CrossRef]
- Rosca, J.C.M.; Vasilescu, E.; Drob, P.; Vasilescu, C.; Drob, S.I. Corrosion behaviour in physiological fluids of surface films formed on titanium alloys. Mater. Corros. 2012, 63, 527–533. [Google Scholar] [CrossRef]
- Li, Y.; Pavanram, P.; Bühring, J.; Rütten, S.; Schröder, K.U.; Zhou, J.; Pufe, T.; Wang, L.N.; Zadpoor, A.A.; Jahr, H. Physiomimetic biocompatibility evaluation of directly printed degradable porous iron implants using various cell types. Acta Biomater. 2023, 169, 589–604. [Google Scholar] [CrossRef] [PubMed]
- Hildebrand, H.F.; Hornez, J.C. Biological response and biocompatibility. Met. Biomater. 1998, 265–290. [Google Scholar]
- Ehtemam-Haghighi, S.; Prashanth, K.G.; Attar, H.; Chaubey, A.K.; Cao, G.H.; Zhang, L.C. Evaluation of mechanical and wear properties of TixNb7Fe alloys designed for biomedical applications. Mater. Des. 2016, 111, 592–599. [Google Scholar] [CrossRef]
- Abdelrhman, Y.; Gepreel, M.A.H.; Kobayashi, S.; Okano, S.; Okamoto, T. Biocompatibility of new low-cost (α+β)-type Ti-Mo-Fe alloys for long-term implantation. Mater. Sci. Eng. C 2019, 99, 552–562. [Google Scholar] [CrossRef]
- Sandrock, G. A panoramic overview of hydrogen storage alloys from a gas reaction point of view. J. Alloys Compd. 1999, 293–295, 877–888. [Google Scholar] [CrossRef]
- Sujan, G.K.; Pan, Z.; Li, H.; Liang, D.; Alam, N. An overview on TiFe intermetallic for solid-state hydrogen storage: Microstructure, hydrogenation and fabrication processes. Crit. Rev. Solid State Mater. Sci. 2020, 45, 410–427. [Google Scholar] [CrossRef]
- Khan, L.; Sato, K.; Okuyama, S.; Kobayashi, T.; Ohashi, K.; Hirasaka, K.; Nikawa, T.; Takada, K.; Higashitani, A.; Abiko, K. Ultra-high-purity iron is a novel and very compatible biomaterial. J. Mech. Behav. Biomed. Mater. 2020, 106, 103744. [Google Scholar] [CrossRef]
- ASTM E3-11(2017); Standard Guide for Preparation of Metallographic Specimens. ASTM International: West Conshohocken, PA, USA, 2017.
- ASTM G5-94(2004); Standard Reference Test Method for Making Potentiostatic and Potentiodynamic Anodic. ASTM International: West Conshohocken, PA, USA, 2004; pp. 1–12.
- ASTM G102-89(1999); Standard practice for calculation of corrosion rates and related information from electrochemical measurements. ASTM International: West Conshohocken, PA, USA, 1999; pp. 1–7.
- ISO 16773-1-4:2016; Electrochemical Impedance Spectroscopy (EIS) on Coated and Uncoated Metallic Specimens. ISO: Geneva, Switzerland, 2016.
- ISO 7438:2020; Metallic Materials—Bend Test. ISO: Geneva, Switzerland, 2020.
- ISO 14577-1:2015; Metallic Materials—Instrumented Indentation Test for Hardness and Materials Parameters—Part 1: Test Method. ISO: Geneva, Switzerland, 2015.
- Yan, M.; Xu, W.; Dargusch, M.S.; Tang, H.P.; Brandt, M.; Qian, M. Review of effect of oxygen on room temperature ductility of titanium and titanium alloys. Powder Metall. 2014, 57, 251–257. [Google Scholar] [CrossRef]
- Pourbaix, M.; Zhang, H.; Pourbaix, A. Presentation of an Atlas of chemical and electrochemical equilibria in the presence of a gaseous phase. Mater. Sci. Forum 1997, 251–254, 143–148. [Google Scholar] [CrossRef]
- Gąsior, G.; Szczepański, J.; Radtke, A. Biodegradable Iron-Based Materials—What Was Done and What More Can Be Done? Materials 2021, 14, 3381. [Google Scholar] [CrossRef]
- Muckenthaler, M.U.; Rivella, S.; Hentze, M.W.; Galy, B. A Red Carpet for Iron Metabolism. Cell 2017, 168, 344–361. [Google Scholar] [CrossRef]
- Socorro-Perdomo, P.P.; Florido-Suárez, N.R.; Voiculescu, I.; Mirza-Rosca, J.C. Comparative eis study of alxcocrfeni alloys in ringer’s solution for medical instruments. Metals 2021, 11, 928. [Google Scholar] [CrossRef]
- da Rocha, S.S.; Adabo, G.L.; Henriques, G.E.P.; Nóbilo, M.A. de A. Vickers hardness of cast commercially pure titanium and Ti-6Al-4V alloy submitted to heat treatments. Braz. Dent. J. 2006, 17, 126–129. [Google Scholar] [CrossRef]
- Sandu, A.V.; Baltatu, M.S.; Nabialek, M.; Savin, A.; Vizureanu, P. Characterization and Mechanical Proprieties of New TiMo Alloys Used for Medical Applications. Materials 2019, 12, 2973. [Google Scholar] [CrossRef]


| Sample | Ti (%) | V (%) | Fe (%) | Al (%) |
|---|---|---|---|---|
| Ti4Fe | 93.20 | 0.80 | 4.00 | 2.00 |
| Ti10Al | 89.50 | 0.50 | - | 10.00 |
| Sample | OCP (V) vs. SCE | ||
|---|---|---|---|
| Initial | After 6 h | After 1 Day | |
| Ti4Fe | −0.277 | −0.484 | −0.558 |
| Ti10Al | −0.407 | −0.434 | −0.397 |
| Parameters | Ti4Fe | Ti10Al |
|---|---|---|
| Ecorr (mV vs. Ref) | −418.03 | −385.33 |
| Icorr (µA/cm2) | 2.40 | 1.68 |
| βc (mV/dec) | 301.70 | 377.00 |
| βa (mV/dec) | 292.60 | 447.26 |
| Equivalent weight (g/eq) | 47.80 | 45.80 |
| Density (g/cm3) | 4.62 | 4.33 |
| Surface (cm2) | 0.58 | 0.59 |
| Corrosion rate (mm/year) | 140.2 × 10⁻³ | 98.86 × 10⁻³ |
| Sample | Potential (V) | Maximum Z (Ω) | Maximum θ (Deg) |
|---|---|---|---|
| Ti4Fe | −0.517 | 37,901.75 | 70.01 |
| Ti10Al | 0.010 | 127,471.95 | 63.78 |
| Parameters | Sample | |
|---|---|---|
| Ti4Fe | Ti10Al | |
| R1 (ohm·cm2) | 16.74 | 15.73 |
| Y2 (S·secn/cm2) | 1.38 × 10⁻⁵ | 3.56 × 10⁻⁵ |
| n2 | 0.58 | 0.94 |
| R2 (ohm·cm2) | 30.85 | 691.60 |
| Y3 (S·secn/cm2) | 5.42 × 10⁻⁵ | 5.54 × 10⁻⁵ |
| n3 | 0.81 | 0.68 |
| R3 (ohm·cm2) | 2.27 × 10⁴ | 9.80 × 10⁶ |
| χ2 | 3.78 × 10⁻³ | 7.01 × 10⁻³ |
| Alloy | Sample | F/d (N/mm) | L (mm) | Length (mm) | Width (mm) | Thickness (mm) | E (GPa) |
|---|---|---|---|---|---|---|---|
| Ti4Fe | 1 | 19.88 | 9.10 | 22.53 | 0.92 | 0.45 | 44.67 |
| 2 | 68.10 | 9.10 | 20.28 | 0.83 | 0.68 | 49.16 | |
| 3 | 83.55 | 9.10 | 22.47 | 0.98 | 0.76 | 36.59 | |
| 4 | 11.05 | 9.10 | 22.42 | 0.80 | 0.38 | 47.41 | |
| Average | 44.46 | ||||||
| Deviation | 5.56 | ||||||
| Ti10Al | 1 | 14.94 | 9.10 | 27.30 | 0.66 | 0.49 | 36.25 |
| 2 | 2.26 | 9.10 | 27.33 | 0.41 | 0.31 | 34.83 | |
| 3 | 5.45 | 9.10 | 27.30 | 0.45 | 0.37 | 45.06 | |
| 4 | 9.44 | 9.10 | 12.55 | 0.66 | 0.38 | 49.11 | |
| Average | 41.31 | ||||||
| Deviation | 6.89 | ||||||
| Microhardness Ti4Fe (HV) | Microhardness Ti10Al (HV) | |||||
|---|---|---|---|---|---|---|
| Essay | 1 g | 5 g | 10 g | 1 g | 5 g | 10 g |
| 1 | 433.00 | 541.00 | 458.00 | 401.00 | 423.00 | 511.00 |
| 2 | 570.00 | 512.00 | 539.00 | 402.00 | 512.00 | 480.00 |
| 3 | 431.00 | 530.00 | 486.00 | 317.00 | 453.00 | 492.00 |
| 4 | 402.00 | 511.00 | 441.00 | 315.00 | 468.00 | 397.00 |
| 5 | 447.00 | 445.00 | 524.00 | 328.00 | 453.00 | 463.00 |
| 6 | 503.00 | 551.00 | 421.00 | 289.00 | 484.00 | 393.00 |
| 7 | 449.00 | 572.00 | 480.00 | 289.00 | 502.00 | 531.00 |
| 8 | 416.00 | 582.00 | 486.00 | 338.00 | 521.00 | 426.00 |
| 9 | 525.00 | 560.00 | 480.00 | 447.00 | 485.00 | 469.00 |
| 10 | 466.00 | 618.00 | 511.00 | 272.00 | 531.00 | 412.00 |
| 11 | 362.00 | 511.00 | 511.00 | 264.00 | 438.00 | 338.00 |
| 12 | 449.00 | 569.00 | 449.00 | 264.00 | 476.00 | 498.00 |
| Average | 454.42 | 541.82 | 482.17 | 327.17 | 478.83 | 450.83 |
| Deviation | 56.18 | 44.50 | 34.05 | 60.09 | 33.64 | 57.52 |
| Maximum | 570.00 | 618.00 | 539.00 | 447.00 | 531.00 | 531.00 |
| Minimum | 362 | 445 | 421 | 264 | 423 | 338 |
Disclaimer/Publisher’s Note: The statements, opinions and data contained in all publications are solely those of the individual author(s) and contributor(s) and not of MDPI and/or the editor(s). MDPI and/or the editor(s) disclaim responsibility for any injury to people or property resulting from any ideas, methods, instructions or products referred to in the content. |
© 2023 by the authors. Licensee MDPI, Basel, Switzerland. This article is an open access article distributed under the terms and conditions of the Creative Commons Attribution (CC BY) license (https://creativecommons.org/licenses/by/4.0/).
Share and Cite
Voiculescu, I.; Brito-Garcia, S.J.; González-Díaz, Ó.M.; Mirza-Rosca, J. Mechanical Characteristics and Corrosion Behavior of Two New Titanium Alloys. Metals 2023, 13, 1729. https://doi.org/10.3390/met13101729
Voiculescu I, Brito-Garcia SJ, González-Díaz ÓM, Mirza-Rosca J. Mechanical Characteristics and Corrosion Behavior of Two New Titanium Alloys. Metals. 2023; 13(10):1729. https://doi.org/10.3390/met13101729
Chicago/Turabian StyleVoiculescu, Ionelia, Santiago Jose Brito-Garcia, Óscar M. González-Díaz, and Julia Mirza-Rosca. 2023. "Mechanical Characteristics and Corrosion Behavior of Two New Titanium Alloys" Metals 13, no. 10: 1729. https://doi.org/10.3390/met13101729
APA StyleVoiculescu, I., Brito-Garcia, S. J., González-Díaz, Ó. M., & Mirza-Rosca, J. (2023). Mechanical Characteristics and Corrosion Behavior of Two New Titanium Alloys. Metals, 13(10), 1729. https://doi.org/10.3390/met13101729