Abstract
In microalloyed steels, plastic instabilities often appear which have been found to be associated with changes in the microstructure. In this paper, research was carried out on the influence of the microstructure in different areas of the deformation zone during the formation of Lüders bands in niobium microalloyed steel. Thermography and digital image correlation during static tensile testing were used to research deformation behavior and the area before and during the formation of the Lüders band. Different local values of temperature changes, i.e., stress changes, and strains in the examined areas during the formation of the Lüders band were determined. The highest values of the temperature changes and strains during the formation of the Lüders band were measured in the area of the initial appearance of the Lüders band. In order to clarify the observed changes, a microstructural analysis, using X-ray diffraction, scanning electron and transmission electron microscopy methods, was used. It was established that the observed temperature, i.e., stress, and strain changes are related to changes in the microstructure. The analyses of changes in the microstructure, arrangement and interaction of dislocations with precipitates revealed significant changes in the movement of dislocations and their interaction with fine niobium-containing precipitates during the formation of Lüders bands. The influence of microstructural parameters on the Lüders band formation in niobium microalloyed steel has been established based on this research.
1. Introduction
Generally, the occurrence of Lüders bands in various metallic materials is a problem in the metal forming, e.g., in the bending of steel tubes [1] or during the forming of drawing quality low carbon steel [2]. Therefore, knowledge of the appearance and formation of Lüders bands in different metallic materials is a key point in the research of Lüders bands. The knowledge of the mechanism of Lüders band formation is important, because if the mechanism of the Lüders band is known, it is possible to reduce or even eliminate the occurrence of Lüders bands in the future by determining the cause of their formation. In this way, the formation of a Lüders band, i.e., the appearance of roughness on the steel surface, during the forming of metallic materials could be avoided or at least reduced. Lüders bands are formed in various types of metallic materials, such as low carbon steels [3], aluminum [4], aluminum alloys [5], TRIP steels [6], austenitic steels [7], copper [8], titanium [9], shape-memory alloys [10] and bimetals (e.g., low carbon steel-stainless steel) [11]. In addition to these metallic materials, the appearance and formation of Lüders bands during deformation were observed in niobium microalloyed steels [12].
The stress–strain relationship in different metallic materials is investigated in various ways through stress and strain monitoring by developing different mathematical models [13,14], numerical analysis [15,16] and using different methods, such as thermography and digital image correlation (DIC) [17]. In this way it is possible to monitor and identify different phenomena such as inhomogeneous deformations [18] especially Lüders bands and the Portevin–Le Chatelier effect (PLC) [19]. The residual stress can have positive as well as negative effects on the properties of metallic materials; therefore, the reduction of residual stress and deformations is possible using different techniques [20].
The presence of Lüders bands has been clearly established in previous research using thermography and digital image correlation, since they are formed at one end of the sample and propagated towards the other end. Thermography and digital image correlation are well-known methods for determining the temperature, i.e., stress, and strain distribution during the process of cold deformation [21]. Using these methods it is possible to qualitatively and quantitatively accurately determine the temperature or stress changes and strain values of random points in the deformation zone. This is very important since these methods are suitable for determining the localization of stress and strain at the start and during Lüders band formation. In the study [22], the authors determined, with thermography and digital image correlation, the occurrence of microstrains in the area before determining yield strength. Microstrains are associated with the formation of Lüders bands, since there is a sudden temperature and strain increase at the start of Lüders band formation.
Cottrel and Bilby [23] gave the well-known and general explanation of Lüders band appearance, stating that the Lüders bands are formed due to the presence of obstacles in the form of atmospheres with carbon and nitrogen atoms and their compounds. Recently, the influence of the microstructure has been shown to be one of the key factors which are considered to affect the formation of a Lüders band. In [24], it is stated that the Lüders band is formed in an area with previously introduced notches as a stress concentrators. Research [25,26] shows that the formation of the Lüders band occurs in the area of highest stress concentration, i.e., in the area with a significant accumulation of dislocations. Other research on low carbon steel [27,28] has established higher values of local strains in the area behind the Lüders band front during propagation. The authors in [29] found that Lüders bands are formed in steels with precipitates which represent obstacles to the movement of dislocations. The formation of Lüders bands in niobium microalloyed steels, with precipitates, is shown in the study [12]. The clarification of the mechanism of Lüders band formation has been suggested from various viewpoints in several ways [17,25,30,31].
However, a detailed mechanism of the Lüders band formation in niobium microalloyed steel has not been established because the conducted research has been more focused on determining the influence of different parameters on Lüders band propagation [27]. Therefore, the aim of this study is to determine the mechanism of Lüders band formation and the influence of fine niobium-containing precipitates, as well as the role of niobium, carbon and nitrogen atoms on the formation of Lüders bands.
2. Materials and Methods
The testing of the mechanism of Lüders band formation was performed on a 3 mm thick hot-rolled niobium microalloyed steel strip. The chemical composition of the tested niobium microalloyed steel is shown in Table 1. Static tensile testing was performed on samples with the dimensions of a gauge length of 45 mm and original width of 20 mm, at a stretching rate of 20 mm/min, which corresponds to the strain rate v (0.007 s−1). The static tensile tests were performed using the testing machine WPM EU40 mod (VEB WPM, Markkleeberg, Germany). The loading of the test samples during different stages of Lüders band formation were stopped during static tensile testing.

Table 1.
The chemical composition of niobium microalloyed steel (wt%).
Thermography and digital image correlation tests were simultaneously performed with the static tensile tests. Samples for testing via thermography were prepared by applying the black matte coating Colormatic Lechsys 29141 RAL 9005 (Wolvega, the Netherlands). The emissivity factor of the black matte coating during the thermographic tests was 0.95. The temperature sensitivity of the infrared camera used for the tests was 80 mK. During thermographic tests, image recording was performed with a speed of 50 frames per second, thus ensuring the precise determination of temperature changes. The tests were performed with a VarioCAM®M82910 infrared camera (JENOPTIK, Jena, Germany). The analysis of the obtained results was carried out with the software package IRBIS3 professional (ver. 3.0.0.145). Samples for testing via digital image correlation were prepared by applying white markers Colormatic Lechsys 29141 RAL 9010, (Wolvega, the Netherlands) to the black matte coating. A Blackfly S Color digital camera with 3.2 Mpixel (FLIR, Richmond, BC, Canada) was used during the digital image correlation tests. The MatchID 2D software package (ver. 20.2.2.0) was used to analyze the displacements of randomly applied white markers during deformation. Qualitative and quantitative results of temperature, i.e., stress, and strain distribution during Lüders band formation were obtained via thermography and digital image correlation.
The examination of the microstructure in different areas during Lüders band formation was performed using scanning electron microscopes Tescan VEGA 5136 MM (Tescan Group, a.s., Brno, Czech Republic) and FE-SEM JEOL, JSM 7000F (JEOL Ltd., Tokyo, Japan). Detailed studies of the microstructure were performed with a transmission electron microscope JEOL JEM-2000-FX (JEOL Ltd., Tokyo Japan). Sample preparation consisted of coarse and fine grinding of the samples and electropolishing. Thin foils were obtained by grinding the samples and subjected to electropolishing in the electrolyte with 900 mL of CH3-CH2-OH and 100 mL of HClO4.
X-ray diffraction analysis was performed using the X-ray diffractometer Italstructures APD 2000 (G.N.R. Analytical Instruments Group S.r.l., Novara, Italy) in 2θ Bragg-Brentano geometry with a fixed monochromatic X-ray source. The X-ray source was a water-cooled copper cathode (Cu Kα, λ = 1.541874 Ǻ). The Kα graphite monochromator on the diffracted side of the beam was used.
Vickers hardness tests were performed in the areas on the Lüders front, in front of and behind the Lüders band front. Hardness measurements were carried out with the Vickers hardness testing machine (Mitutoyo, Kawasaki, Japan) Model No. 810-165D (HV10 measurement method).
3. Results and Discussion
In this paper a detailed qualitative and quantitative analysis, via thermography and digital image correlation, was carried out to determine temperature changes and strains at different stages during Lüders band formation.
In order to determine why the Lüders band formation starts at a certain part of the deformation zone, research was conducted on the difference between internal stresses in the area of the Lüders band appearance. The existence of a temperature change, i.e., stress change, was established before the formation of the Lüders band in the area of the later Lüders band formation.
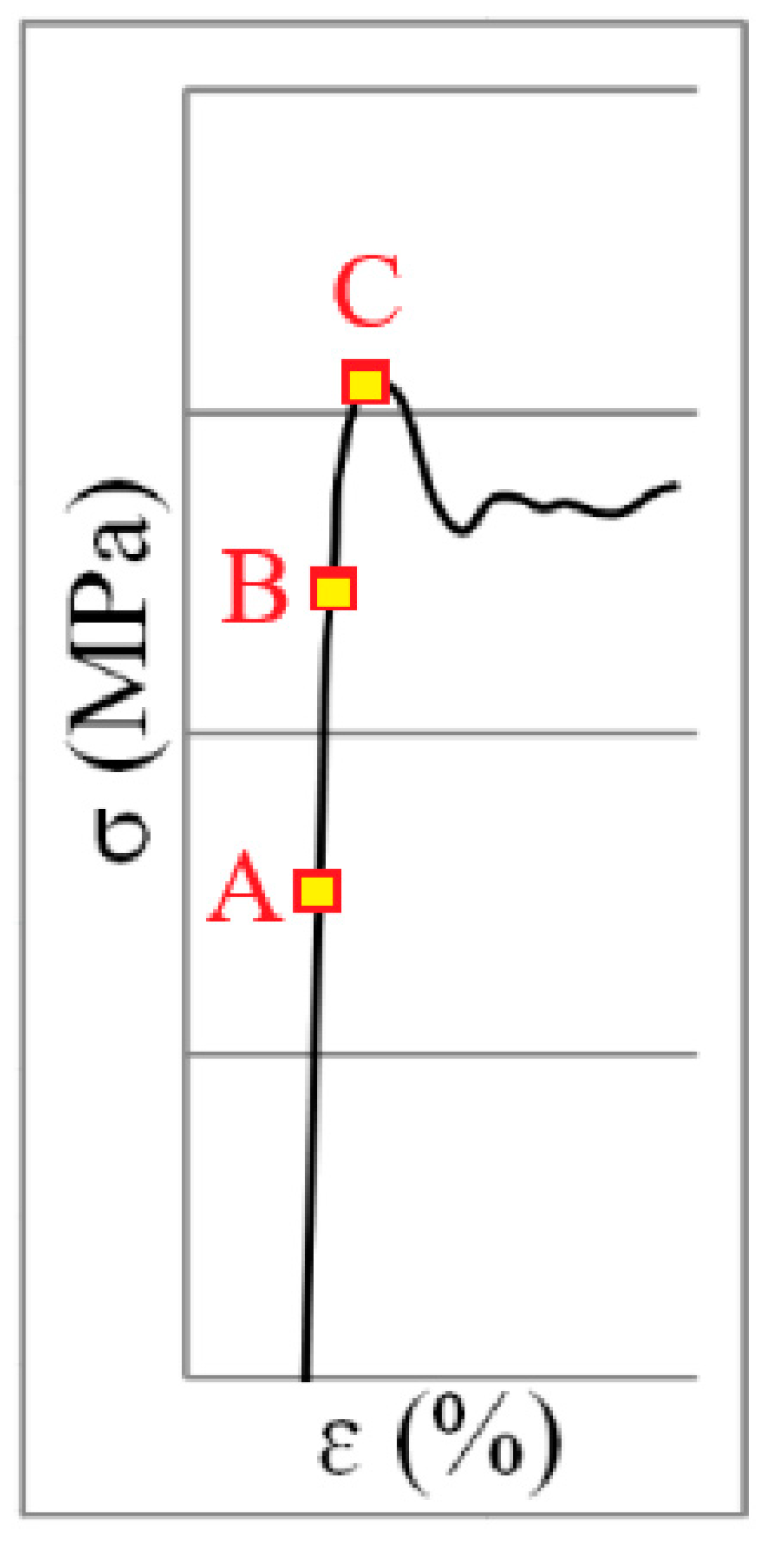
According to the stress–strain diagram in Figure 1, the area before the start of the Lüders band formation (A), the middle of the Lüders band formation (B) and the end of the Lüders band formation (C) refers to the research area of the Lüders band formation process in Figure 2.

Figure 1.
Stress–strain diagram of Lüders band formation.

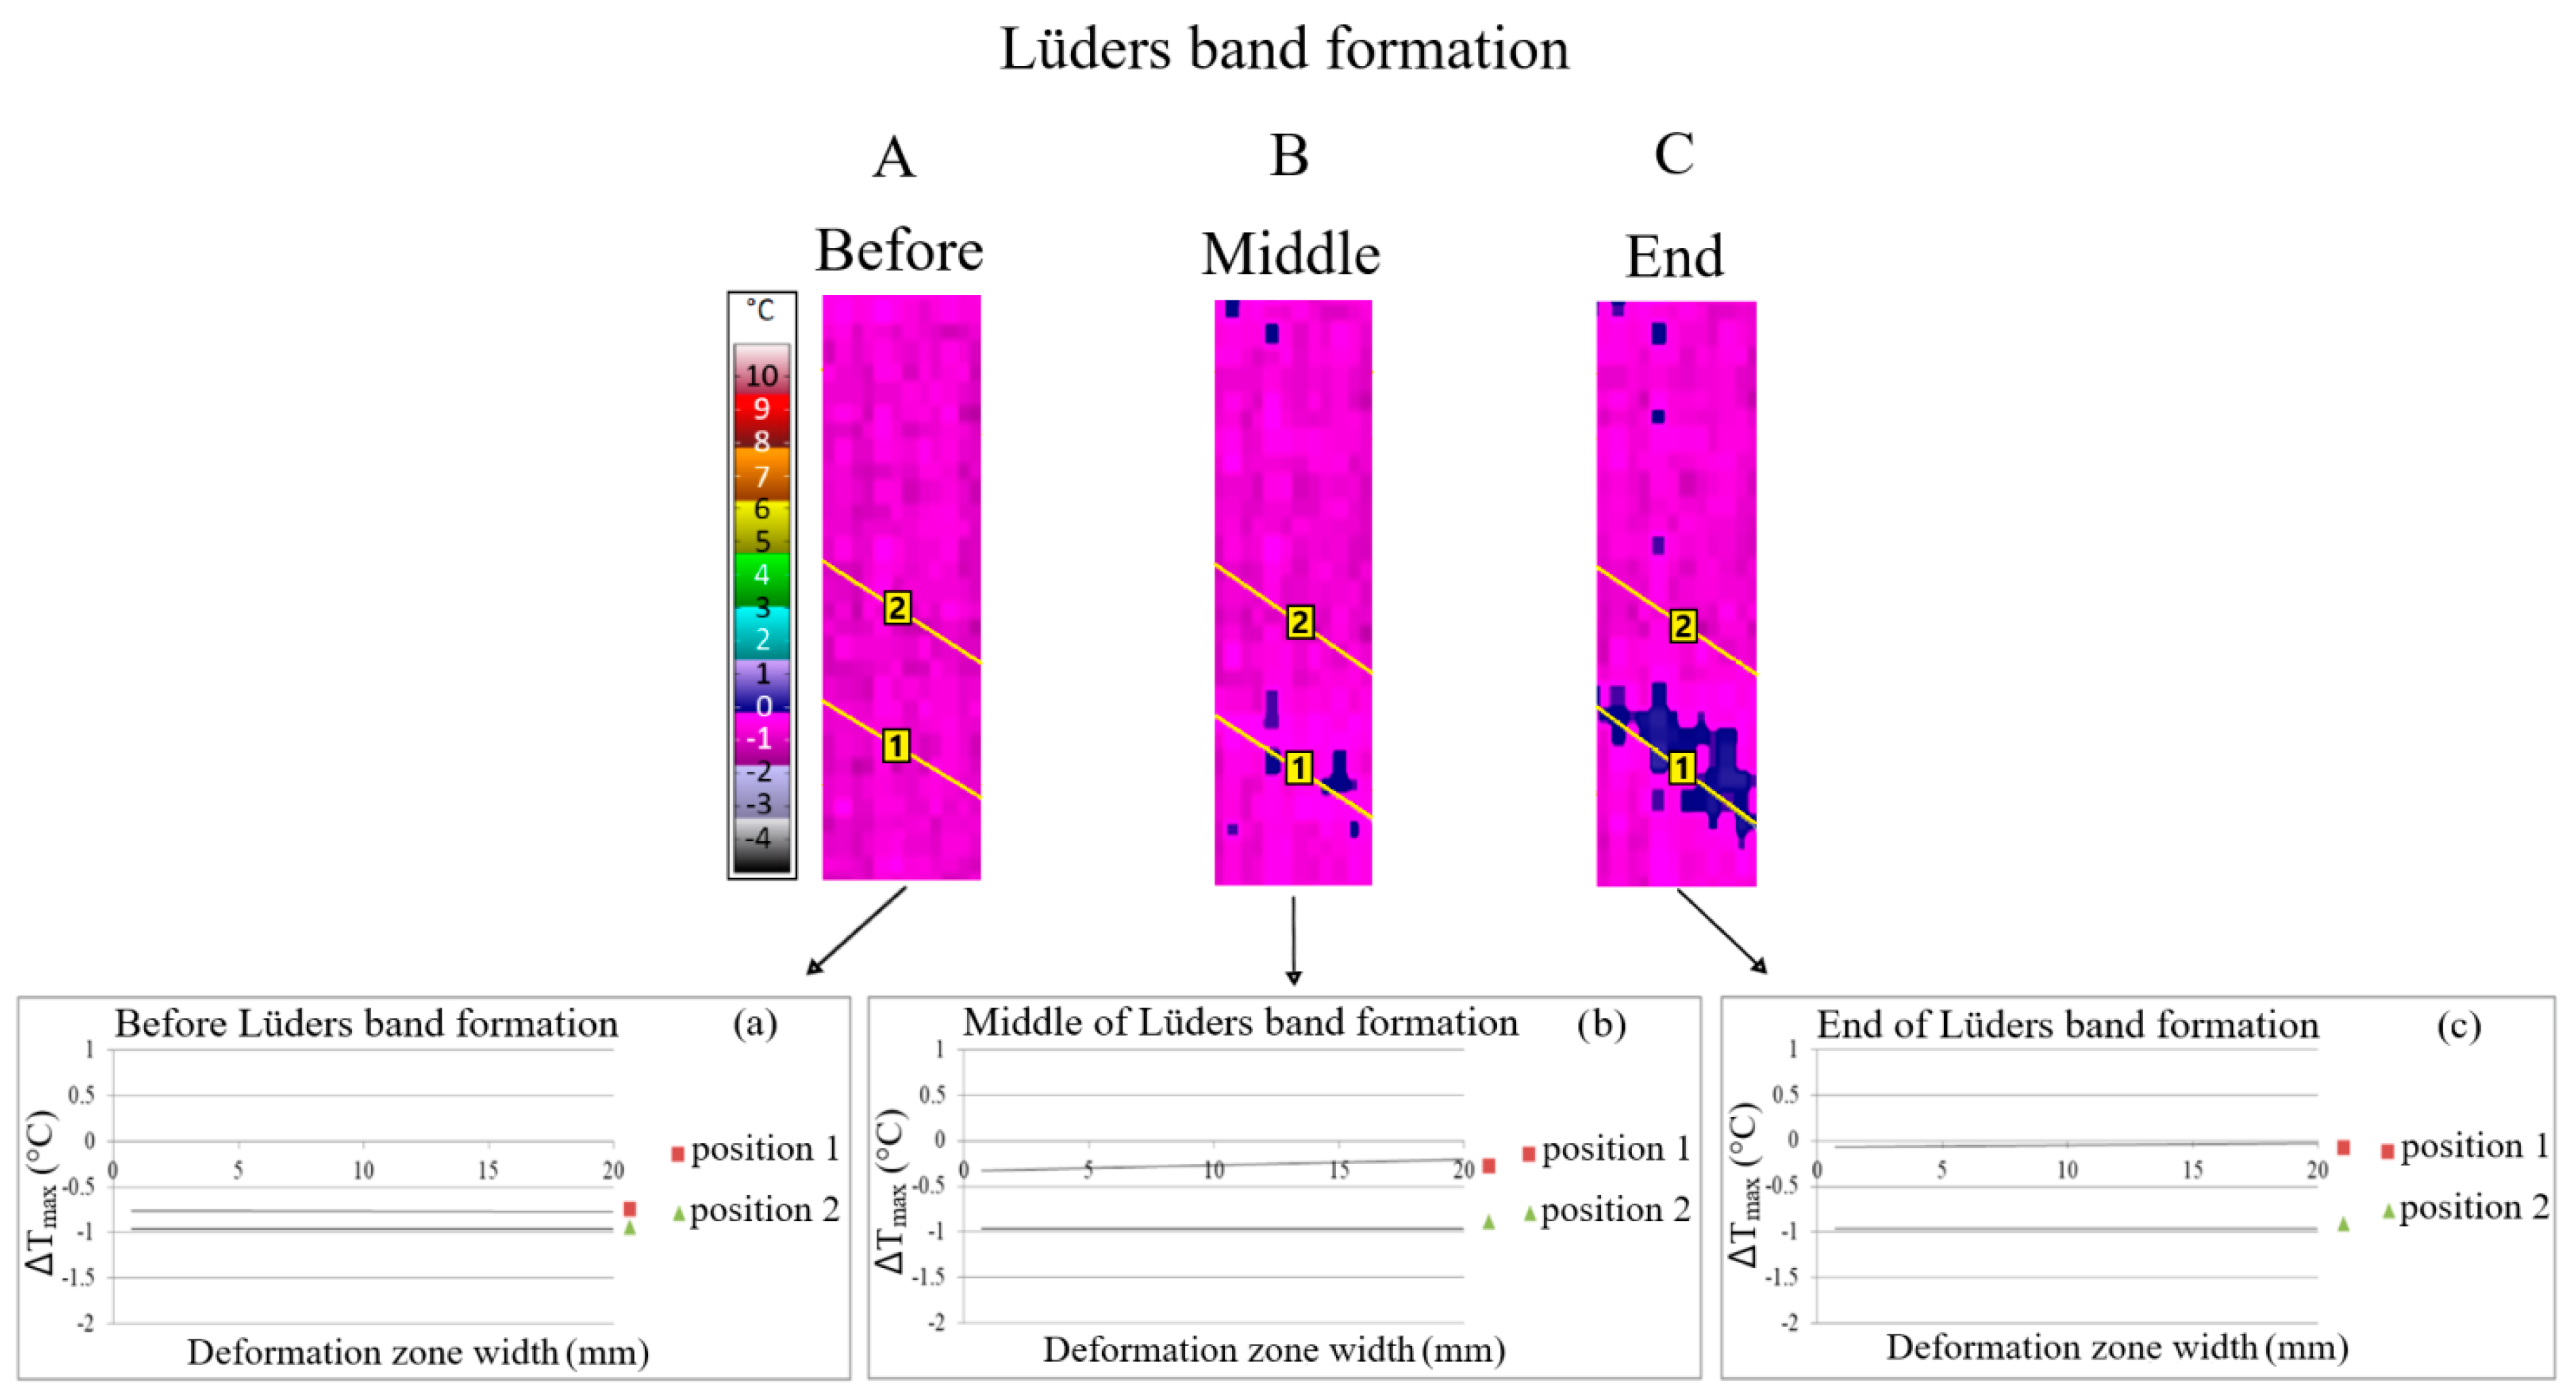
Figure 2.
Qualitative (A–C) and quantitative (a–c) line analysis during Lüders band formation in microalloyed steel with 0.048% Nb.
The results of thermography qualitative line analysis are presented at the moment before the start of the Lüders band formation (A), the middle of the Lüders band formation (B) and at the end of the Lüders band formation (C) (Figure 2). An examination of the line analysis was carried out at position 1, which corresponds to the area of the Lüders band formation, and at position 2, which corresponds to the area in front of the Lüders band front without Lüders band formation. Qualitative line analysis results, obtained via thermography, at the different moments of the Lüders band formation (A–C) are shown in Figure 2. Quantitative line analysis was performed in the same positions of line analysis as the previously mentioned qualitative line analysis. Mean values of maximum temperature changes were obtained via quantitative line analysis (a–c) according to Figure 2. Line analysis was carried out in the area with Lüders band formation (position 1) and in the area without Lüders band formation (position 2).
The obtained results indicate higher values of temperature, i.e., stress, changes in the area of Lüders band formation (position 1 of the line analysis) with regard to the area without Lüders band formation (position 2 of the line analysis, Figure 2). Therefore, Lüders band formation was found to appear in the region of higher stress in the niobium microalloyed steel.
The difference in the values of temperature, i.e., stress, changes between the area with Lüders band formation (position 1 of the line analysis) and without Lüders band formation (position 2 of the line analysis) increase as the Lüders band formation progresses from points a to c on Figure 2.
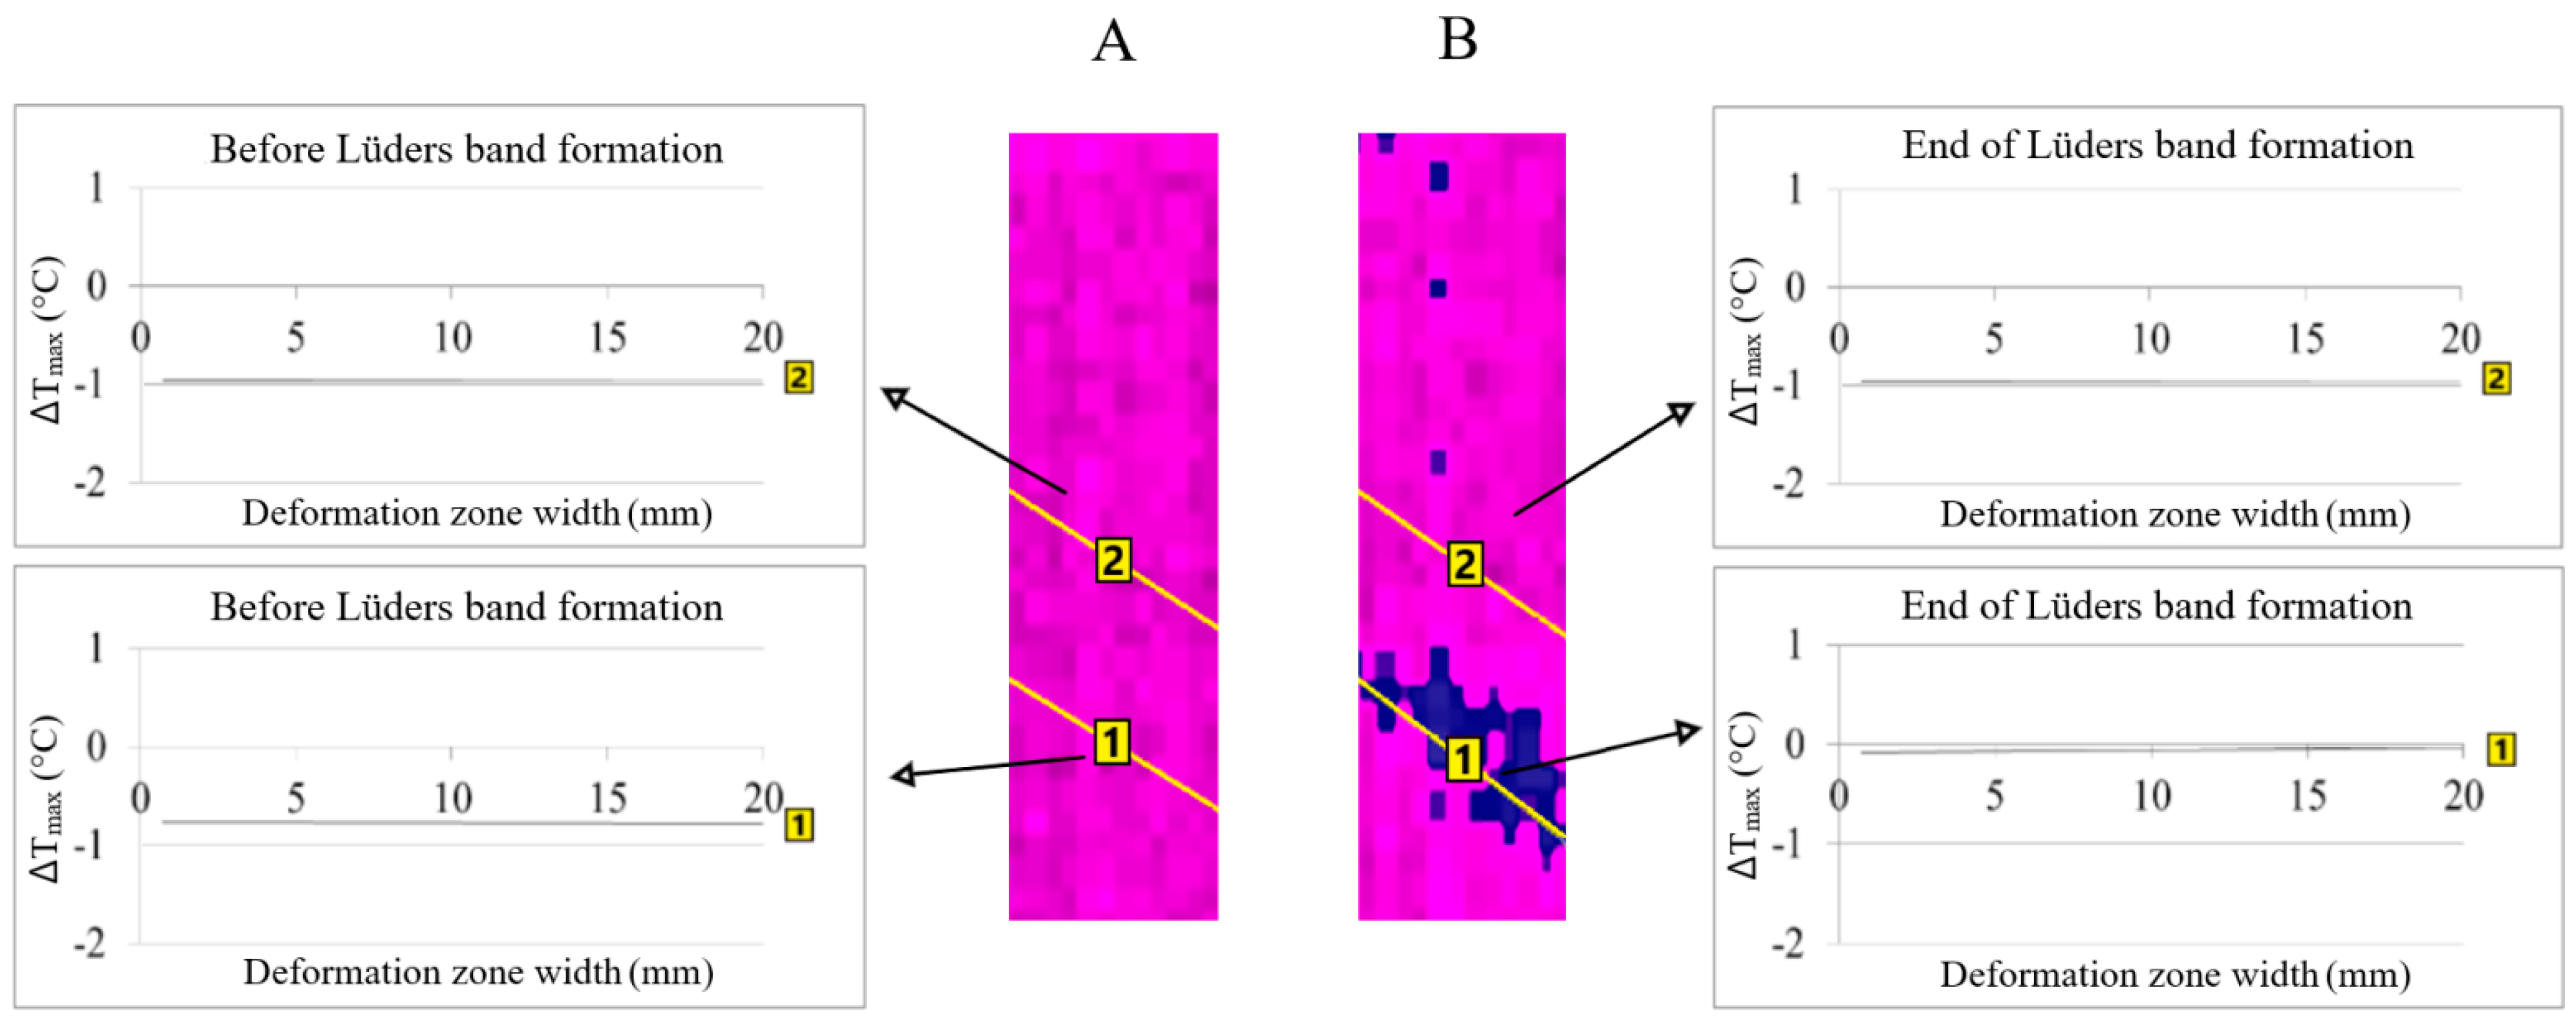
The area of Lüders band formation will be at the point on the sample surface where higher temperature, i.e., stress, changes were found before the Lüders band formation (Figure 3 in position 1A of the line analysis). The formation of the Lüders band in the same line area showed an increase in temperature changes (Figure 3, in position 1B of the line analysis).
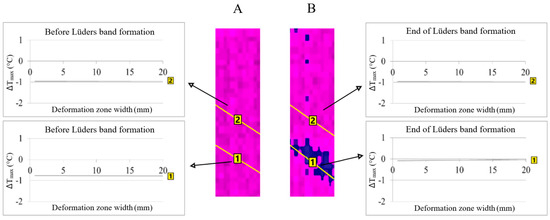
Figure 3.
The area of Lüders band formation in niobium microalloyed steel: (A)—before Lüders band formation and (B)—Lüders band formation.
The value of the temperature changes in position 1A is greater than the values in position 2A at the moment before the formation of the Lüders band (Figure 3). The temperature change values in position 2B remain the same compared to position 2A and the difference in the values of the temperature changes increase in position 1B compared to position 1A after the forming of the Lüders band (Figure 3).
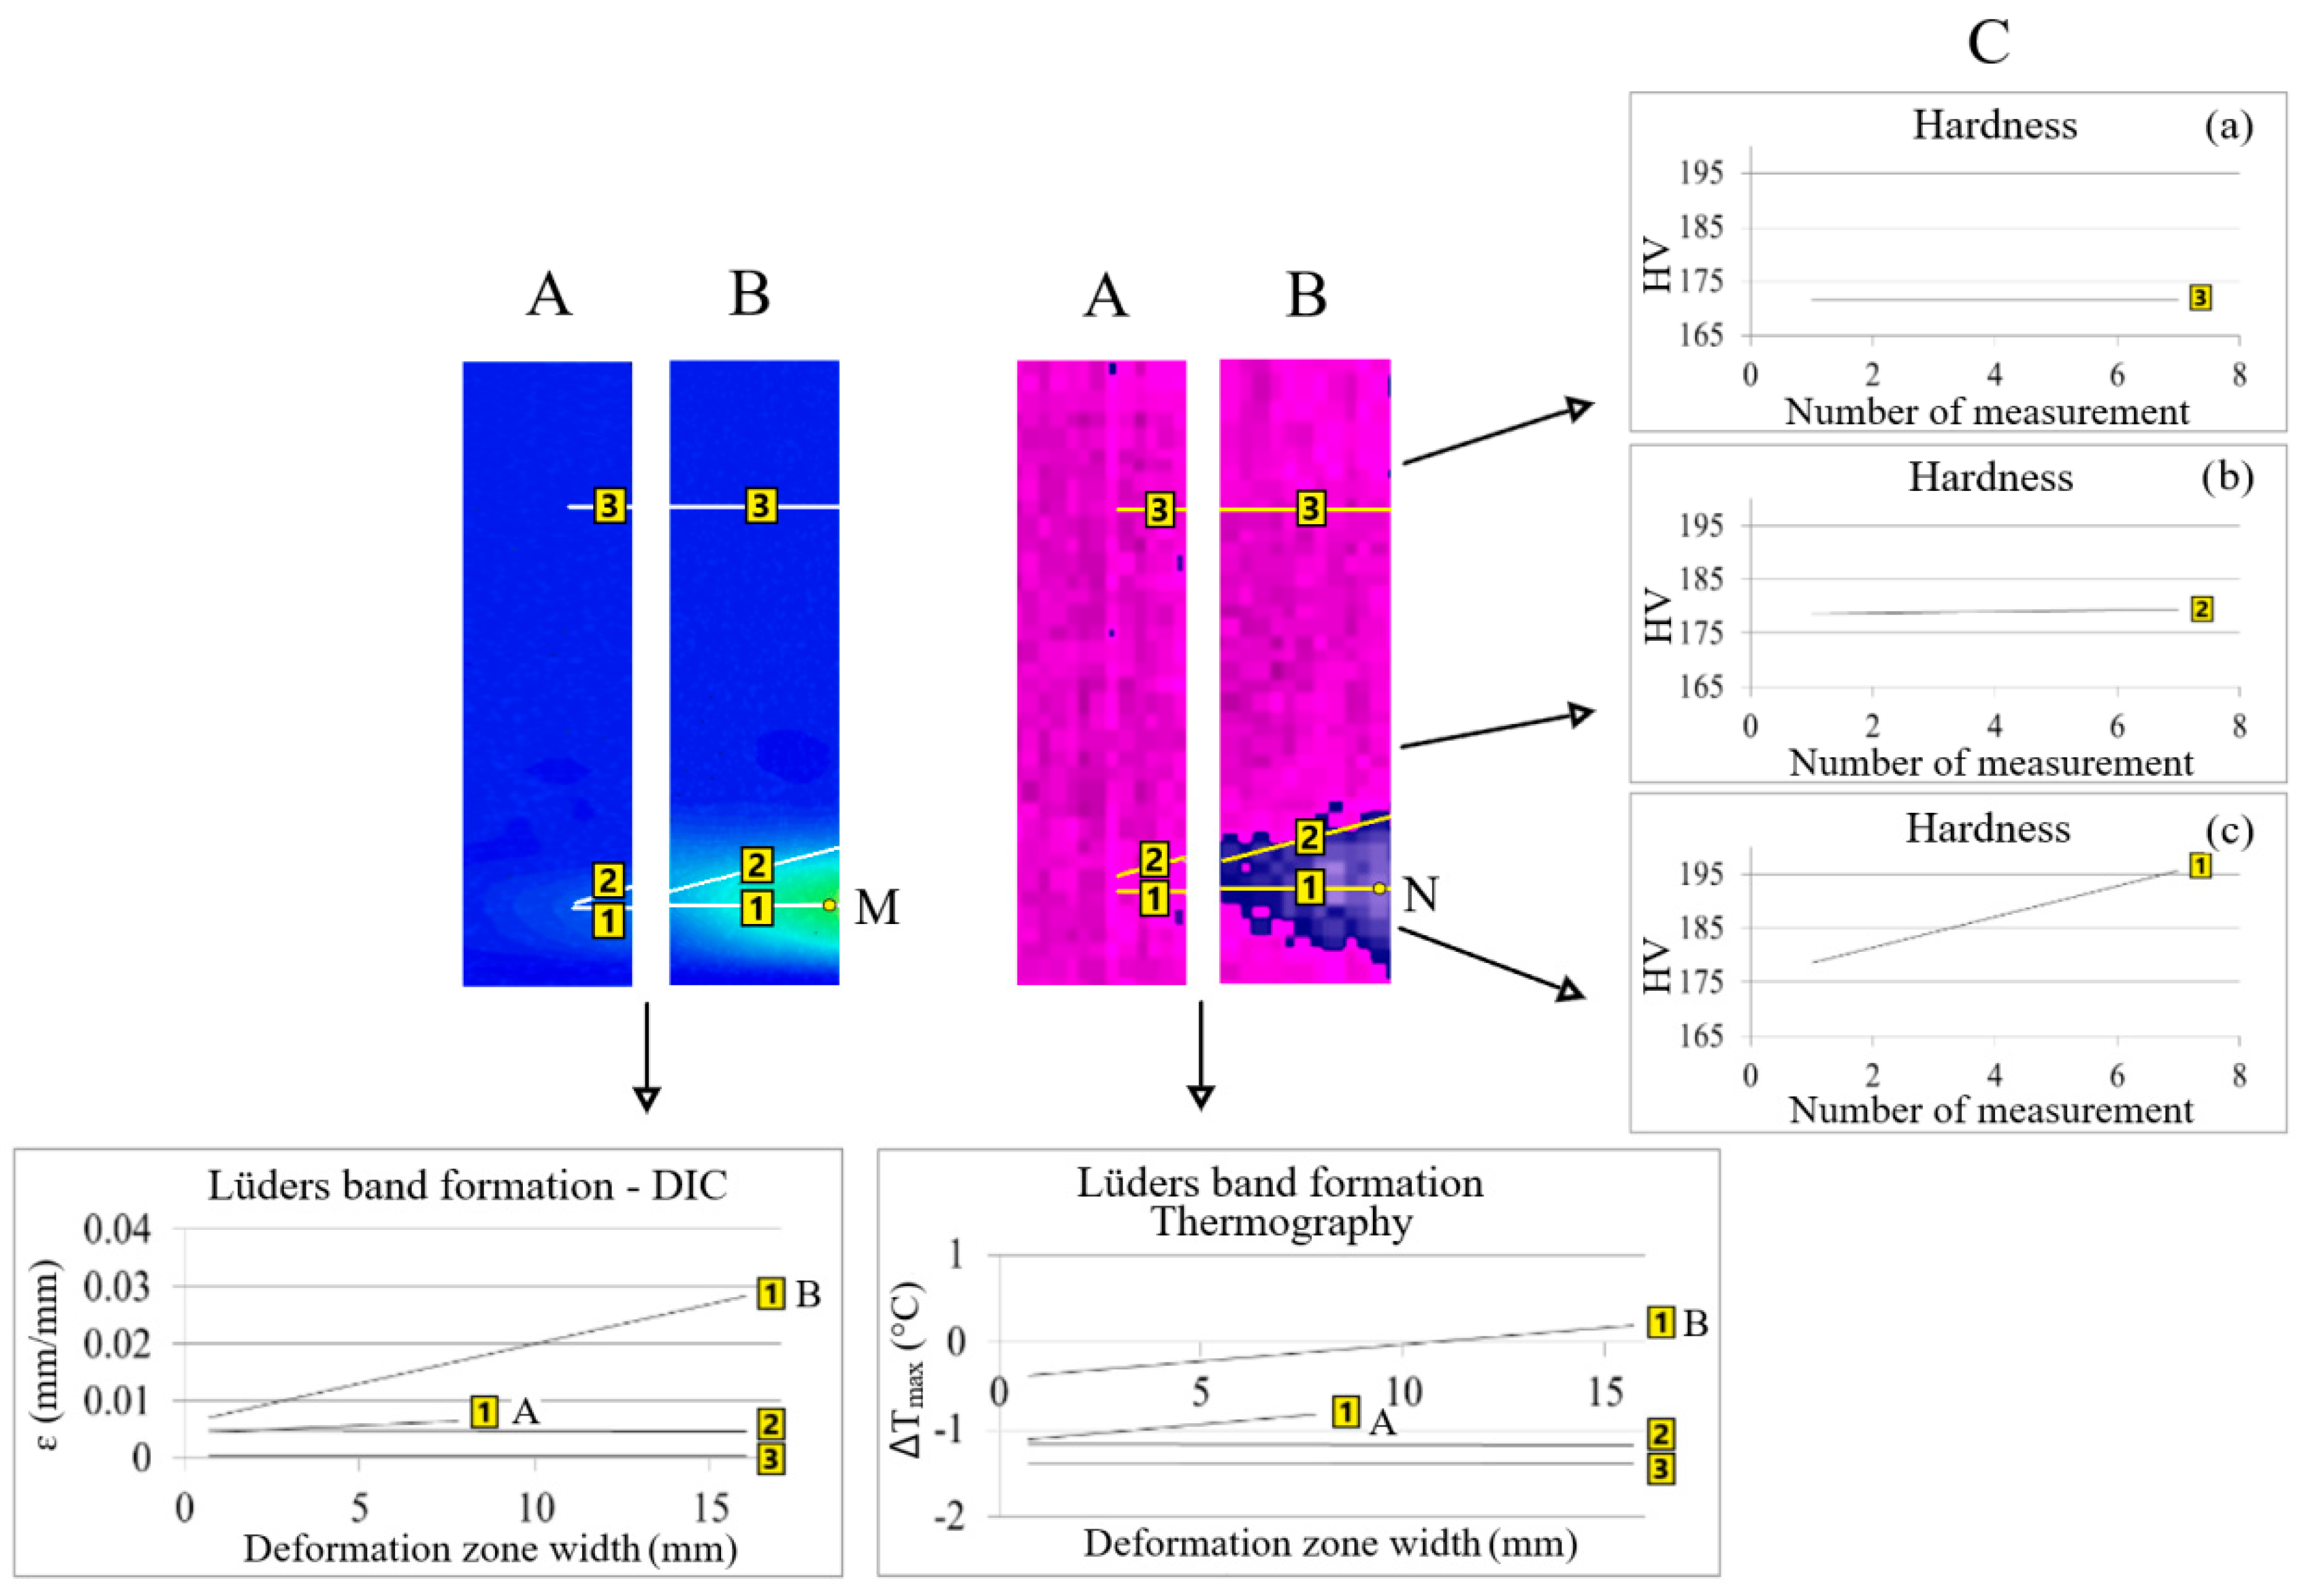
The area of the partially (1A) and fully (1B) formed Lüders band, the position of the partially (2A) and fully (2B) formed Lüders band front and the size of the partial (3A) and full (3B) area in front of the Lüders band front were researched in detail (Figure 4).
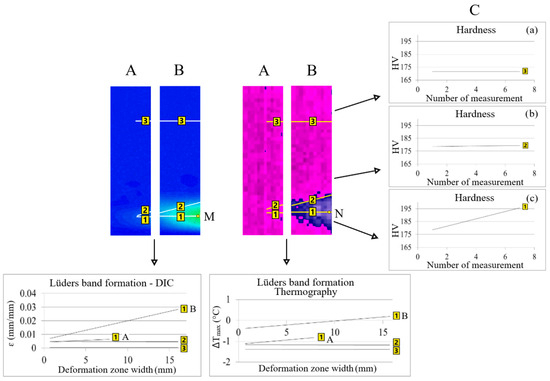
Figure 4.
Comparison of qualitative and quantitative results (A,B) of thermography and digital image correlation with hardness values (C, a–c) during Lüders band formation.
In all of the positions, a detailed qualitative and quantitative line analysis was performed to determine the differences in the values of temperature changes and strains in these areas during Lüders band formation.
Hardness measurements (C) were performed in all positions of line analysis (1–3B) with thermography and digital image correlation at the end of the Lüders band formation (Figure 4).
The comparison of the obtained qualitative and quantitative results of thermography, digital image correlation and hardness measurements in different positions (1–3B) is shown in Figure 4.
It was found that the values of temperature changes, strains and hardness did not change on the Lüders band front (position 2) and in front of the Lüders band front (position 3) from the start of Lüders band formation (A) to the end of Lüders band formation (B) (Figure 4). Higher values of temperature, i.e., stress, changes and strain were found in the area of the formed Lüders band (position 1) because in the area in front of the Lüders band front (position 3) only elastic deformation takes place (Figure 4). The highest hardness values were measured in the area of the formed Lüders band in position 1c on Figure 4.
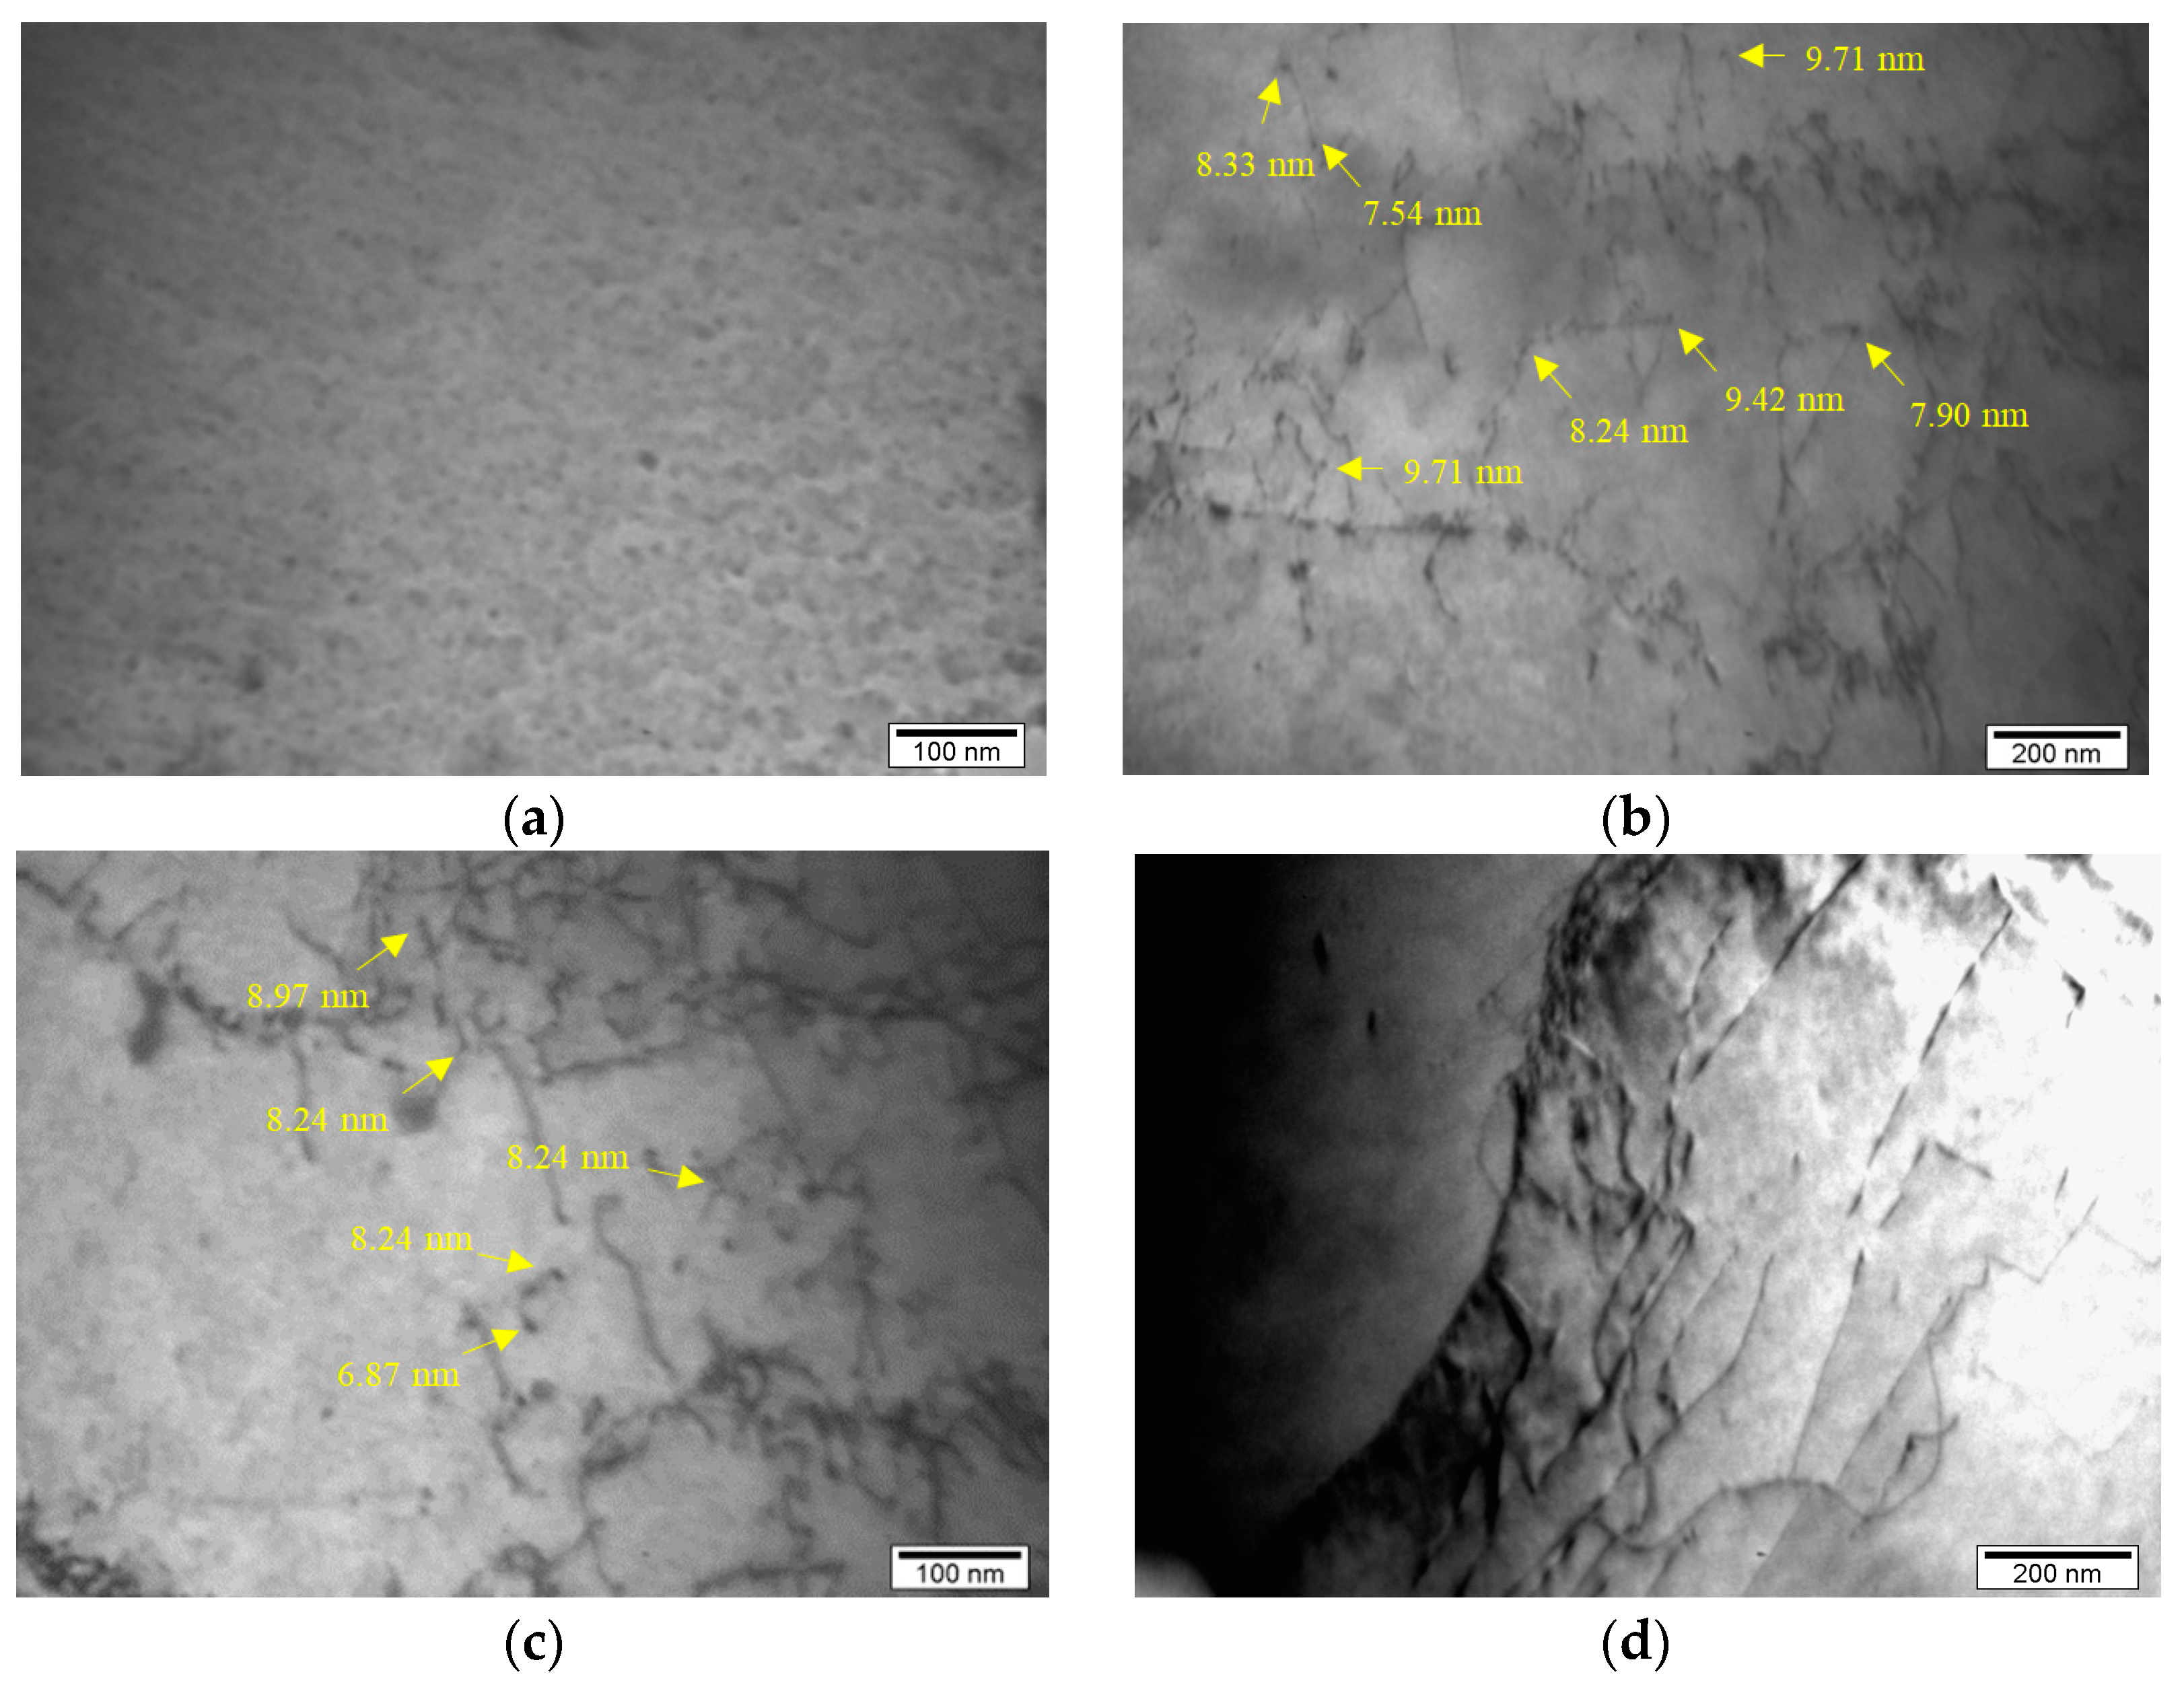
Previous research [32] carried out on the same niobium microalloyed steel, with 0.048 wt% of Nb, established that there are certain types of precipitates such as carbides, nitrides and carbonitrides and the presence of these types of precipitates was determined via electrochemical isolation, atomic absorption spectrophotometry and transmission electron microscopy. The presence of fine niobium precipitates in the form of niobium carbides, nitrides and carbonitrides and their interaction with dislocations is presented in this paper and shown via detailed transmission electron microanalysis in Figure 5. There are different sizes of niobium precipitates but the presence of a large number of fine niobium precipitates up to 10 nm in size was determined (Figure 5b,c).
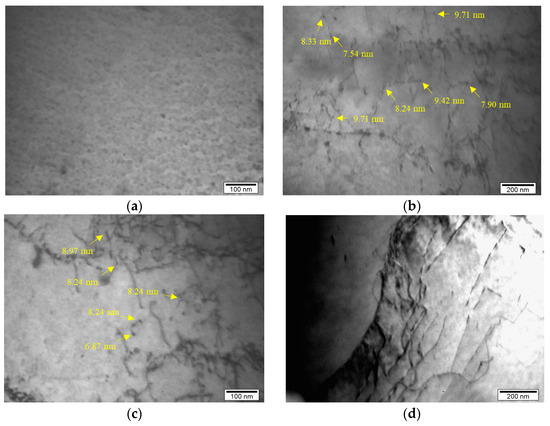
Figure 5.
Microstructure of the analyzed steel: (a) fine niobium precipitates, (b,c) interaction between fine niobium precipitates with size up to 10 nm and dislocations, (d) interaction between fine niobium precipitates and dislocations on the grain boundary.
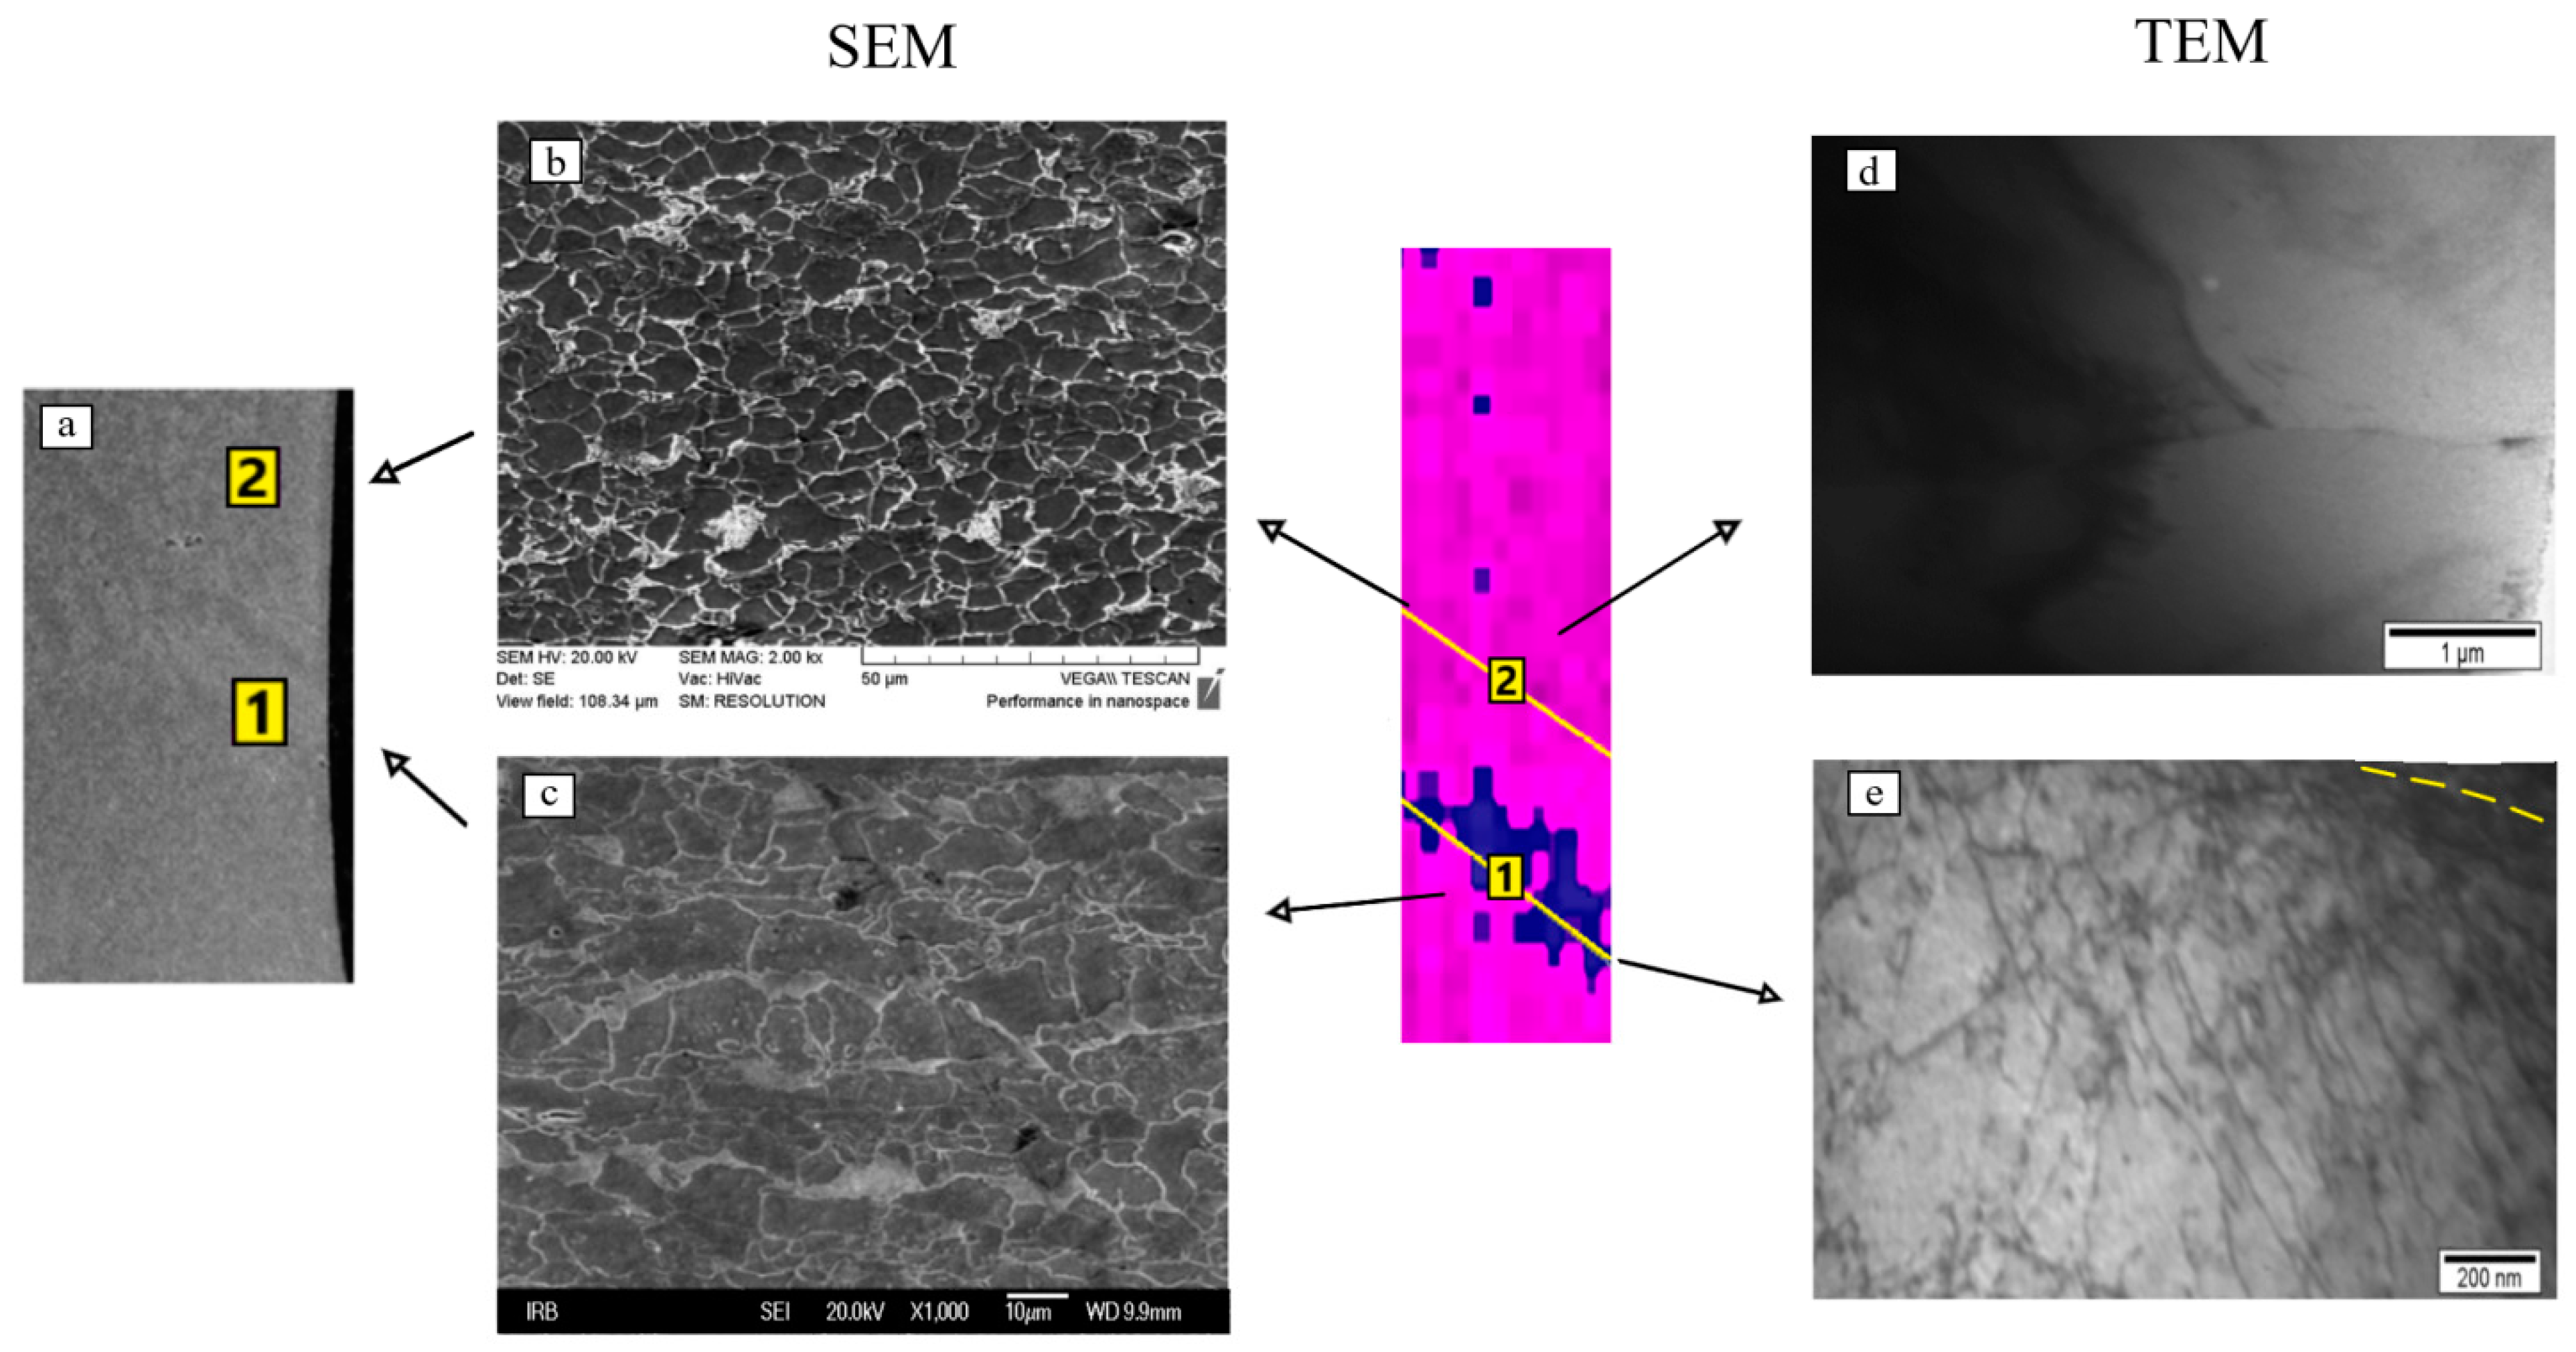
The same method revealed a significant difference in the dislocation density in the area of the Lüders band formation (position 1) in relation to the area where the elastic deformation takes place (position 2, Figure 6).

Figure 6.
Comparison of the results of microstructure tests on the scanning electron microscope (a–c) and transmission electron microscope (d,e) with the area of Lüders band formation.
X-ray diffraction was used to determine non-linear deformation in areas with and without a Lüders band using the Halder-Wagner method. The results of the analysis of diffraction line broadening and the determination of the non-linear deformation on the Gaussian profile of the diffraction line using the Halder-Wagner method are given in Table 2.
Table 2.
X-ray diffraction results of non-linear deformation in the areas with and without Lüders band.
The obtained values of non-linear deformations in the areas with and without a Lüders band indicate that there is a difference in the deformation values (Table 2). Therefore, X-ray diffraction showed that there is a greater non-linear distortion of the crystal lattice in the area with the presence of a Lüders band.
Since the area without a Lüders band is still an area of elastic deformation, there are no greater number of dislocations in this area, see Figure 6d. From the initial point of the Lüders band formation, it continues to form further across the width of the tested sample. There is a gradual increase in the temperature, i.e., stress, changes and strain values as the Lüders band is formed in position 1 from point A to B on Figure 4. At the different stages of the Lüders band formation, the highest values of temperature changes (N) and strains (M) behind the Lüders band front occur in the area of the initial appearance of the Lüders band (Figure 4). This is associated with the increased dislocation density, number of precipitates and free niobium atoms in this area.
In the area of the initial Lüders band formation (position 1B points M and N on Figure 4), there is the highest accumulation of dislocations and their interaction with fine niobium precipitates during Lüders band formation. The interaction between dislocations and fine precipitates leads to higher values of temperature, i.e., stress, changes while their release of dislocations leads to higher local strain values. The evidence of this behavior in niobium microalloyed steel during the formation of the Lüders band are the hardness values on Figure 4a–c. A continuous increase in the measured hardness values is clearly shown from the newly formed (position 1C on the left side) to the initially formed Lüders band (position 1C on the right side) area of the formed Lüders band (Figure 4).
In the region of elastic deformation, there is an increase in the distance between the niobium, nitrogen and carbon atoms. Previous research has established [32,33] that all the niobium atoms are not bound in carbides, nitrides and carbonitrides. Therefore, the distance between atoms of niobium, nitrogen and carbon that are not bound in the precipitates increases with the deformation degree. Then, lattice distortion begins because niobium atoms [34] are larger in diameter than carbon and nitrogen atoms. The movement of niobium atoms will trigger dislocations, i.e., slip lines will form, and thus the Lüders band formation begins.
Fine niobium precipitates and niobium, carbon and nitrogen atoms, located around niobium-containing precipitates, contribute to increased lattice distortion in this deformation area. There is a higher concentration of fine niobium precipitates and atoms. The presence of higher concentrations of niobium, carbon and nitrogen atoms near the precipitates can be assumed according to previous research [35] because they bind into larger precipitates via the subsequent heating of the test steel at higher temperatures. As niobium, carbon and nitrogen atoms are located near the precipitates, it is concluded that in the area, with the increased concentration of precipitates and their interaction with dislocations, Lüders band formation will start (Figure 6e).
The accumulation of dislocations and their interaction with fine deformation-induced niobium-containing precipitates at the grain boundary, proven via transmission electron microanalysis, cause a stress concentration at the grain boundary (Figure 5d and Figure 6e). In this way, a source of new dislocations in the adjacent grain will be created. The source of the new dislocations in the adjacent grain will interact with the fine deformation-induced niobium precipitates and niobium, carbon, and nitrogen atoms and will propagate throughout the entire grain. The widening of the gliding stress to adjacent grains begins an increase in the local stress concentration during inhomogeneous deformation (Figure 2, Figure 3 and Figure 4). The increased local stress concentration is caused by a great number of dislocations and their interaction with fine deformation-induced niobium precipitates at the grain boundary (Figure 5d and Figure 6e). At that point, the stress concentration is large enough to transfer sliding through the entire adjacent grain. Therefore, the deformation will propagate at a higher rate through grains with a favorable orientation (Figure 6e). In these grains, inhomogeneous deformation will be created with regard to other grains that have a less favorable orientation and where inhomogeneous deformation has not yet begun [25]. This is confirmed with the results obtained via scanning electron microscopy (Figure 6b,c in positions 1 and 2).
Certain areas with a favorable grain orientation for the beginning of the inhomogeneous deformation deform at a higher rate and form the Lüders band front in relation to the rest of the examined areas (Figure 6b,c). In the area with more favorable grain orientation, the formation of the Lüders bands is shown by the higher grain orientation with the results of scanning electron microscopy and the results of X-ray diffraction of the greater crystal lattice distortion in the area with the Lüders band (Figure 6 and Table 2).
The grains are oriented in a favorable direction to continue the propagation of inhomogeneous deformation, i.e., the Lüders band, during the interaction of dislocations with fine deformation-induced niobium precipitates. In the area behind the Lüders band front by several grains, the same direction of dislocations was determined (Figure 6e). The mechanism of inhomogeneous deformation propagation is confirmed through the results of the X-ray diffraction, since distortion of the crystal lattice is determined in the area with the Lüders band (Table 2).
The higher values of temperature changes, strains, hardness and distortion of the crystal lattice in the area behind and on the Lüders band front confirm this mechanism of the Lüders band formation compared to the area without inhomogeneous deformation (Figure 4 and Figure 6, Table 2).
The results of the increased temperature, i.e., stress, changes in the area on (position 2) and behind the Lüders band front (position 1) correspond to the area of interaction between dislocations and fine deformation-induced niobium precipitates in the form of niobium carbides, nitrides and carbonitrides (Figure 4B and Figure 5b). This is confirmed by higher hardness values (Figure 4C(b,c)), and distortion of the crystal lattice (Table 2), in the area on and behind the Lüders band front compared to the area without the Lüders band (position 3 on Figure 4). The increased concentration of niobium, carbon and nitrogen atoms on the grain boundary will cause increased strain values. The increased strain values were determined using digital image correlation in the area on (position 2) and behind the Lüders band front (position 1) in relation to the area without the Lüders band (position 3, Figure 4). The interaction of atoms and precipitates with dislocations leads to the release of dislocations by reaching sufficient energy during deformation. Therefore, the interaction between dislocations, fine deformation-induced precipitates, atoms of niobium, carbon and nitrogen and release of dislocations by reaching sufficient energy was established as the cause of Lüders band formation. There is an alternating increase and decrease in the stress values due to the pinning and release of dislocations from the fine niobium precipitates and niobium, carbon and nitrogen atoms during Lüders band formation in niobium microalloyed steel.
4. Conclusions
The influence of microstructural parameters on Lüders band formation is established in niobium microalloyed steel. The microstructure has been shown to be a factor that has a significant influence on Lüders band formation in niobium microalloyed steels. The mechanism of the Lüders band formation is closely related to the beginning of the motion of dislocations stopped by fine niobium precipitates and niobium, carbon and nitrogen atoms. The motion of niobium, carbon and nitrogen atoms has been found to influence the appearance of slip lines that initiate Lüders band formation.
This research proved that Lüders bands appear in the areas of the deformation zone with the highest stresses associated with an increased concentration of fine precipitates and their interaction with dislocations. The presence of fine niobium precipitates has been shown to be a key factor of the Lüders band formation in niobium microalloyed steels. The size and composition of niobium precipitates have an influence on Lüders band formation. An influence on Lüders band formation will have to have only fine deformation-induced niobium precipitates in the form of niobium carbides, nitrides and carbonitrides, up to 10 nm in size, located at a distance sufficient to stop the motion of dislocations.
Author Contributions
Conceptualization, S.R.; methodology, S.R.; software, T.B. and T.R.; investigation, T.B., M.M. (Marijan Marciuš) and M.M. (Miloš Matvija); writing—original draft preparation, T.B.; writing—review and editing, I.S., T.R. and T.B.; funding acquisition, I.S. All authors have read and agreed to the published version of the manuscript.
Funding
This research has been financially supported by the Croatian Science Foundation under project number IP-2016-06-1270 (Principal Investigator: Stoja Rešković).
Data Availability Statement
The data presented in this study are available in this article.
Conflicts of Interest
The authors declare no conflict of interest.
References
- Hallai, J.F.; Kyriakides, S. On the effect of Lüders bands on the bending of steel tubes. Part I: Experiments. Int. J. Solids Struct. 2011, 48, 3275–3284. [Google Scholar] [CrossRef]
- Zhou, T.; Zurob, H.; Zhang, P.; Kuuskman, K.; Cho, S.H.; Burella, D. Control of edge breaks during cold mill processing of commercial and drawing quality low-carbon steels. Ironmak. Steelmak. 2019, 46, 656–662. [Google Scholar] [CrossRef]
- Tsuchida, N.; Tomota, Y.; Nagai, K.; Fukaura, K. A simple relationship between Lüders elongation and work-hardening rate at lower yield stress. Scr. Mater. 2006, 54, 57–60. [Google Scholar] [CrossRef]
- Kamikawa, N.; Huang, X.; Tsuji, N.; Hansen, N. Strengthening mechanisms in nanostructured high-purity aluminium deformed to high strain and annealed. Acta Mater. 2009, 57, 4198–4208. [Google Scholar] [CrossRef]
- Coër, J.; Manach, P.Y.; Laurent, H.; Oliveira, M.C.; Menezes, L.F. Piobert-Lüders plateau and Portevin-Le Chatelier effect in an Al-Mg alloy in simple shear. Mech. Res. Commun. 2013, 48, 1–7. [Google Scholar] [CrossRef]
- Emadoddin, E.; Akbarzadeh, A.; Daneshi, G.H. Correlation between Luder strain and retained austenite in TRIP-assisted cold rolled steel sheets. Mat. Sci. Eng. A 2007, 447, 174–179. [Google Scholar] [CrossRef]
- Saha, R.; Ueji, R.; Tsuji, N. Fully recrystallized nanostructure fabricated without severe plastic deformation in high-Mn austenitic steel. Scr. Mater. 2013, 68, 813–816. [Google Scholar] [CrossRef]
- An, H.; Wu, S.; Zhang, Z.; Figueiredo, R.B.; Gao, N.; Langdon, T.G. Enhanced strength–ductility synergy in nanostructured Cu and Cu–Al alloys processed by high-pressure torsion and subsequent annealing. Scr. Mater. 2012, 66, 227–230. [Google Scholar] [CrossRef]
- Li, Z.; Fu, L.; Fu, B.; Shan, A. Yield point elongation in fine-grained titanium. Mater. Lett. 2013, 96, 1–4. [Google Scholar] [CrossRef]
- Zheng, L.; He, Y.; Moumni, Z. Luders-like band motion and fatigue life of pseudoelastic polycrystalline NiTi shape memory alloy. Scr. Mater. 2016, 123, 46–50. [Google Scholar] [CrossRef]
- Barannikova, S.; Li, Y. Kinetics of deformation bands in a low-carbon steel—Stainless steel bimetal. Metalurgija 2021, 60, 59–62. [Google Scholar] [CrossRef]
- Torkamani, H.; Raygan, S.; Garcia Mateo, C.; Rassizadehghani, J.; Palizdar, Y.; San-Martin, D. Tensile Behavior of Normalized Low Carbon Nb-microalloyed Steel in the Presence of Rare Earth Elements. Mat. Sci. Eng. A 2019, 749, 56–64. [Google Scholar] [CrossRef]
- Zhang, J.; Zeng, F.; Ma, H. Structural Stability Analysis of Steel Tubular Scaffold with Couplers Based on Direct Analysis Method. Teh. Vjesn. 2022, 29, 408–414. [Google Scholar]
- Cumin, J.; Novoselović, D.; Samardžić, M.; Samardžić, I. Statistical analysis of different mathematical models for stress-strain curves of AISI 321 stainless steel. Metalurgija 2023, 62, 391–393. [Google Scholar]
- Dziubińska, A.; Surdacki, P. Numerical Analysis of the New Forming Process of the Aircraft Bracket Forging Made of AZ91 Alloy at Different Rates of Deformation. Teh. Vjesn. 2022, 29, 634–640. [Google Scholar]
- Romanova, V.; Balokhonov, R.; Zinovieva, O. Mesoscale deformation-induced surface phenomena in loaded polycrystals. FU Mech. Eng. 2021, 19, 187–198. [Google Scholar] [CrossRef]
- Qiu, H.; Inoue, T.; Ueji, R. In-Situ Observation of Lüders Band Formation in Hot-Rolled Steel via Digital Image Correlation. Metals 2020, 10, 530. [Google Scholar] [CrossRef]
- Spišák, E.; Majerníková, J.; Kaščák, Ľ.; Slota, J. Influence of plastic deformation inhomogeneity on corrosion resistance of tin plates. Metalurgija 2021, 60, 67–70. [Google Scholar]
- Danilov, V.I.; Orlova, D.V.; Gorbatenko, V.V.; Danilova, L.V. Effect of Temperature on the Kinetics of Localized Plasticity Autowaves in Lüders Deformation. Metals 2023, 13, 773. [Google Scholar] [CrossRef]
- Samardzic, I.; Vuherer, T.; Maric, D.; Konjatic, P. Influence of vibrations on residual stresses distribution in welded joints. Metalurgija 2015, 54, 527–530. [Google Scholar]
- Brlić, T.; Rešković, S.; Jurković, Z.; Janeš, G. Mathematical modeling of influence parameters during formation and propagation of the Lüders bands. FU Mech. Eng. 2020, 18, 595–610. [Google Scholar] [CrossRef]
- Srinivasan, N.; Narayanaswamy, R.; Venkatraman, B. Advanced imaging for early prediction and characterization of zone of Lüders band nucleation associated with pre-yield microstrain. Mat. Sci. Eng. A 2013, 561, 203–211. [Google Scholar]
- Cottrell, H.; Bilby, B.A. Dislocation Theory of Yielding and Strain Ageing of Iron. Proc. Phys. Soc. A 1949, 62, 49–62. [Google Scholar] [CrossRef]
- Beardsmore, D.W.; Quinta da Fonseca, J.; Romero, J.; English, C.A.; Ortner, S.R.; Sharples, J.; Sherry, A.H.; Wilkes, M.A. Study of Lüders phenomena in reactor pressure vessel steels. Mat. Sci. Eng. A 2013, 588, 151–166. [Google Scholar] [CrossRef]
- Barišić, B. Analiza Pojave Lüdersovih Traka u Procesu Izrade Proizvoda iz Tankostjenog Lima. Ph.D. Thesis, University of Rijeka, Rijeka, Croatia, 2005. [Google Scholar]
- Qiu, H.; Inoue, T.; Ueji, R. Experimental measurement of the variables of Lüders deformation in hot-rolled steel via digital image correlation. Mater. Sci. Eng. A 2020, 790, 139756. [Google Scholar] [CrossRef]
- Polukhina, O.N.; Vichuzhanin, D.I.; Khotinov, V.A.; Schapov, G.V.; Farber, V.M. Luders Deformation Mechanisms on Yield Point in X80 Grade Pipeline with Ultrafine Structure. In Proceedings of the XIX International Scientific-Technical Conference “The Ural School-Seminar of Metal Scientists-Young Researchers”, Yekaterinburg, Russia, 19–23 November 2018; KnE Engineering: Yekaterinburg, Russia, 2019. [Google Scholar]
- Qiu, H.; Ueji, R.; Inoue, T. Yield-Point Phenomenon and Plastic Bands in Ferrite-Pearlite Steels. Materials 2022, 16, 195. [Google Scholar] [CrossRef]
- Hickey, J.L.R.; Rouland, S.; Britton, T.B. Heterogeneous local plastic deformation of interstitial free steel revealed using in-situ tensile testing and high angular resolution electron backscatter diffraction. arXiv 2018, arXiv:1807.02017. [Google Scholar]
- Hultgren, A. The Morphology of Lüders Deformation in Polycristals. Scand. J. Metall. 1972, 1, 17–22. [Google Scholar]
- Gao, S.; Bai, Y.; Zheng, R.; Tian, Y.; Mao, W.; Shibata, A.; Tsuji, N. Mechanism of huge Lüders-type deformation in ultrafine grained austenitic stainless steel. Scr. Mater. 2019, 159, 28–32. [Google Scholar] [CrossRef]
- Rešković, S.; Slokar Benić, L.; Lovrenić-Jugović, M. The Interdependence of the Degree of Precipitation and Dislocation Density during the Thermomechanical Treatment of Microalloyed Niobium Steel. Metals 2020, 10, 294. [Google Scholar] [CrossRef]
- Brlić, T.; Rešković, S.; Jandrlić, I. Influence of Niobium Content on Strain Amount in Lüders Bands in Niobium Microalloyed Steel. Met. Mater. Int. 2020, 26, 179–187. [Google Scholar] [CrossRef]
- Yu, Q.; Wang, Z.; Liu, X.; Wang, G. Effect of microcontent Nb in solution on the strength of low carbon steels. Mat. Sci. Eng. A 2004, 379, 384–390. [Google Scholar] [CrossRef]
- Slokar Benić, L.; Jandrlić, I.; Rešković, S. Effect of subsequent heating on the microstructure and mechanical properties of Nb microalloyed steel. In Proceedings of the 18th International Foundrymen Conference, Coexistence of Material Science and Sustainable Technology in Economic Growth, Sisak, Croatia, 15–17 May 2019; pp. 180–187. [Google Scholar]
Disclaimer/Publisher’s Note: The statements, opinions and data contained in all publications are solely those of the individual author(s) and contributor(s) and not of MDPI and/or the editor(s). MDPI and/or the editor(s) disclaim responsibility for any injury to people or property resulting from any ideas, methods, instructions or products referred to in the content. |
© 2023 by the authors. Licensee MDPI, Basel, Switzerland. This article is an open access article distributed under the terms and conditions of the Creative Commons Attribution (CC BY) license (https://creativecommons.org/licenses/by/4.0/).