Article

Application of Ferromagnetic Microwires as Temperature Sensors in Measurements of Thermal Conductivity

1
College of New Materials and Nanotechnologies, National University of Science and Technology «MISiS», Moscow 119049, Russia
2
Pushkov Institute of Terrestrial Magnetism, Ionosphere and Radio Wave Propagation, Russian Academy of Sciences (IZMIRAN), Troitsk, Moscow 108840, Russia
*
Author to whom correspondence should be addressed.
Metals 2023, 13(1), 109; https://doi.org/10.3390/met13010109
Submission received: 30 November 2022 / Revised: 27 December 2022 / Accepted: 30 December 2022 / Published: 4 January 2023

Abstract

:
A method for the determination of the thermal conductivity of polymer composite materials by using Co-based ferromagnetic microwires is proposed. Microwire segments were integrated into the samples of studied materials during their manufacture and used as current microheaters and resistance thermometers. As a representative material, we used a material based on nitrile butadiene rubber filled with hexagonal boron nitride after its low-temperature carbonization and a significant increase in thermal conductivity. The thermal conductivity values of composite samples determined during experiments varied from 1.0 W/(m·K) to 1.8 W/(m·K) depending on the percentage of boron nitride. The thermal conductivity values obtained are in good agreement with the estimates obtained by the standard laser flash method.

1. Introduction

Amorphous ferromagnetic microwires have been fabricated and actively studied in the last three decades [1,2,3,4,5]. Outstanding soft magnetic properties stipulated by their amorphous structure and small sizes make them suitable for a number of applications [6,7,8]. Usually, as-cast microwires are unable to be applied directly, and thermal treatment techniques are used to improve their characteristics. Among them, the Joule annealing method has been widely used. A proper Joule heating current amplitude can effectively improve the soft magnetic properties of the microwires [9,10,11]. It was demonstrated that Co-rich amorphous microwires can be used to create a number of miniature sensors for measuring mechanical stresses, magnetic fields, temperature, etc. [12,13,14,15] Currently, ferromagnetic microwires are also used as fillers in multifunctional composite materials with electromagnetic functions [16,17,18,19].
In addition, microwires are characterized by non-standard electrical properties. Recently, it was shown [20,21,22] that the electrical resistance of a microwire can change irreversibly upon Joule annealing to the temperature of their crystallization and that these changes can serve as an indicator of the microwire state. In their amorphous state, microwires also possess a high resistivity. A fully crystallized microwire is characterized by a linear temperature dependence of the resistance R(T) and a high value of the temperature coefficient of resistance (TCR). These properties make it possible to use microwires in amorphous and crystallized states as microheaters and resistance thermometers if they are integrated into modern multifunctional composite materials.
Polymer and composite materials are widely used in modern electronic technology as a material for printed circuit boards and various basic parts due to their low values of specific volumetric electrical conductivity, which for polymers is in the range of 10−11–10−16 1/Ohm·m, as a rule. An increase in the packing density of elements in microcircuits, the general miniaturization of electronic devices, and the increase in their power lead to increased heat release and heating of both microcircuits and body structures. The low thermal conductivity of 0.16–0.4 W/mK inherent in polymeric materials does not allow efficient removal of the heat to the external environment, which leads to overheating of electronic devices [23]. The resulting high temperatures can lead to failure of semiconductor components themselves or even to the destruction of polymer components as a result of thermal and thermal-oxidative degradation processes occurring in polymer materials. Therefore, it is desirable to develop polymer composite materials that would simultaneously have low electrical conductivity and high thermal conductivity. Such materials can be obtained by using heat-conducting ceramics with low electrical conductivity as a heat-conducting functional filler, such as boron nitride (BN). The thermal conductivity of a composite material depends on a large number of factors. Along with the values of the thermal conductivity of the filler, it is influenced by the size of the filler particles, the particle size distribution, the degree of filling, etc. [24,25,26].
In this work, a method for determining the thermal conductivity of composite materials using microheaters and temperature sensors based on Co-rich microwires integrated into composites is proposed. As an object of study, we have chosen a material based on nitrile butadiene rubber filled with hexagonal boron nitride after its low-temperature carbonization and a significant increase in thermal conductivity.

2. Experimental Details

2.1. Ferromagnetic Microwires
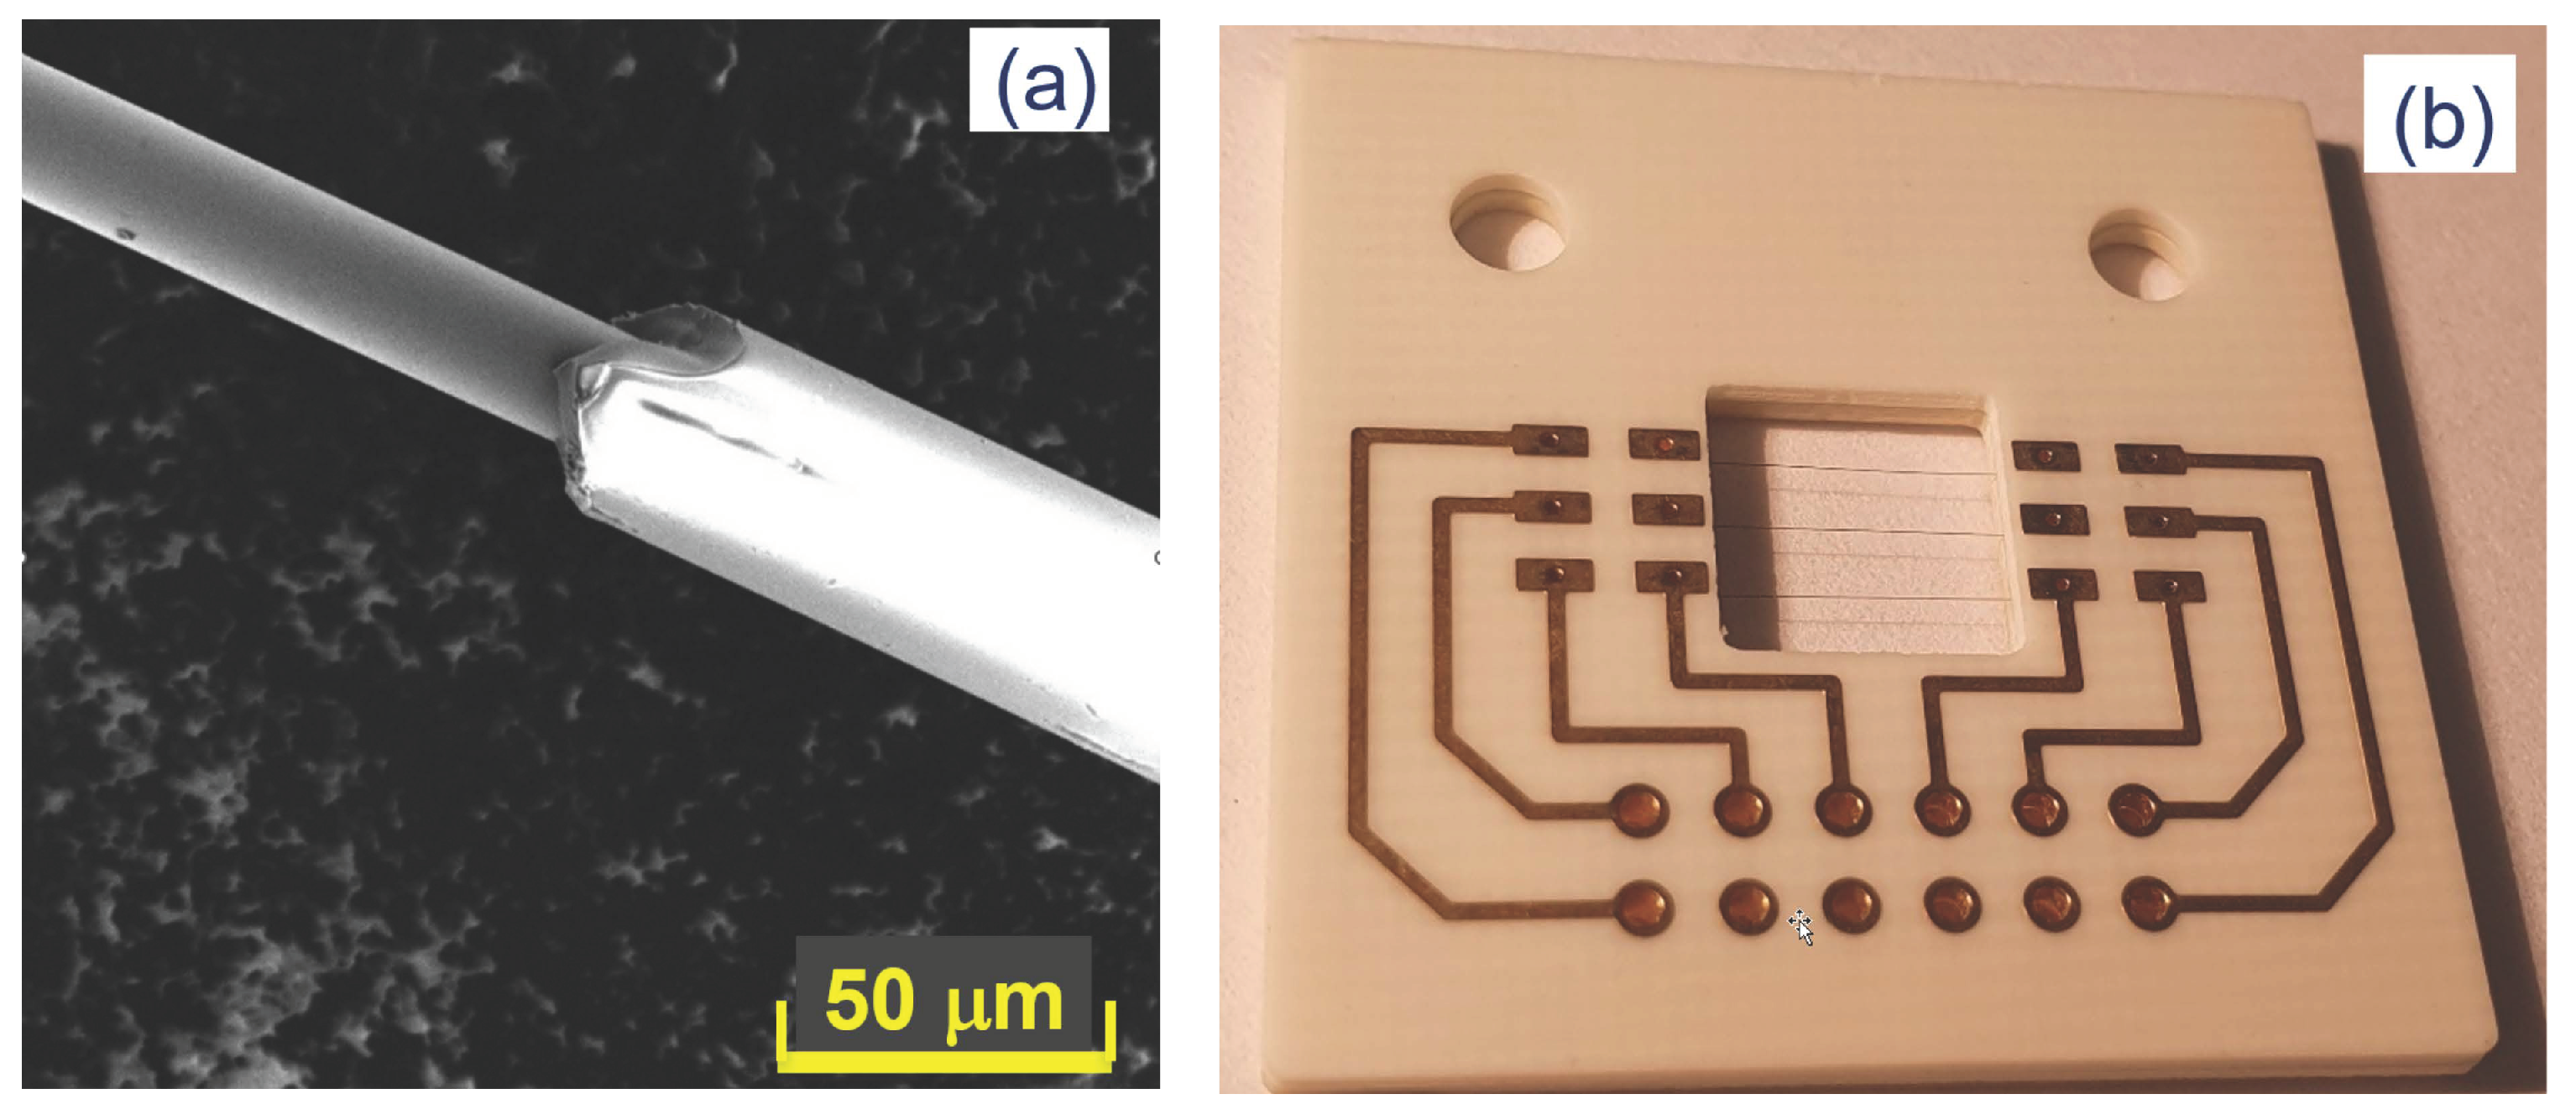
Glass-coated amorphous ferromagnetic microwires of Co73Fe4Si12B11 composition with a metal core diameter of 18.8 µm and a total diameter of 33.5 µm, fabricated by the Taylor–Ulitovsky method, were used. These microwires are characterized by high resistivity in the initial amorphous state. The microwire’s scanning electron microscope (SEM) image is shown in Figure 1a. By the differential scanning calorimetry (DSC) analysis, it was found that after heat treatment above a temperature of 600 °C, the microwires undergo a transition to the crystalline state. The crystallization process begins at a temperature of 476 °C and proceeds in two stages. After crystallization, the microwire’s resistivity decreases by almost 40%.
To solve the tasks set in the work, we used a long microwire, from which we cut out segments 12–13 mm long. To ensure reliable electrical contact, the glass shell was removed from the ends of each segment. The prepared microwire samples were soldered on a special printed circuit board (PCB), which later served as a mold in the manufacture of a composite sample.
The PCBs were made of heat-resistant glass-fiber laminate Rogers 4003 with a thickness of 1 mm. In the central part of each printed circuit board, a window was made for a composite sample with a size of 8 × 8 mm. Three prepared segments of microwire were soldered to the corresponding connecting pads placed at a distance of 2 mm from each other in the center of the window, where the composite sample will be formed. After soldering the segments of the microwires, the second board was soldered to this board from above, and a double board of the “sandwich” type with embedded microwires was formed (see Figure 1b). The system of connecting tracks on the PCBs provided a four-point contact for each microwire and the ability to connect external electrical devices via a 12-pin connector.
Figure 1. (a) SEM image of a microwire; (b) a special PCB with soldered segments of microwires.
Metals 13 00109 g001
Before the stage of manufacturing composite samples, the outermost microwires of the board were subjected to a special heat treatment with direct current (Joule heating) to obtain a crystallized state. As an example, the dependence of the resistance of one of the segments of the microwire on the applied power during Joule heating is shown in Figure 2.
This curve corresponds to the transition of the sample from the amorphous state (upper branch) to the crystalline state (lower branch). During repeated annealings of the crystallized microwire, its resistance completely repeats the course of the lower branch of the curve in Figure 2. The insert in Figure 2 shows the dependence of changes in the resistance of the microwire on temperature in the amorphous and crystalline states, obtained by heating the board in an oven. It follows from the presented data that the microwire TCR in the crystallized state is almost an order of magnitude higher (αc = 1.3 × 10⁻³ 1/°C) compared to that in the initial amorphous state (αa = 1.7 × 10⁻⁴ 1/°C).
Thus, a set of three microwires with the required electrical properties was formed inside the mold for preparing samples of composite materials. The central microwire was used in further experiments as a miniature high-resistance heater. A given amount of thermal power is released by this heater when a direct current flows through it, and the two outermost microwires were used as resistance thermometers. They were characterized by a high TCR (αc = 1.3 × 10⁻³ 1/°C) and were used for measurements of local temperatures during all our experiments.

2.2. Model for Determining the Coefficient of Thermal Conductivity Using Microwires

Consider an infinite flat layer of thickness 2h, which is perpendicular to the z axis (−hzh) whose upper surface borders on a heat insulator, and the lower surface has good contact with a region with infinitely high thermal conductivity. Suppose that inside the flat layer there is an infinitely thin conductor with resistance R, a direct current I flows along the y axis, which ensures the release of heat of power w per unit length. Let us consider the temperature distribution in this layer. The density of the divergent heat flux is equal to j ( x , z ) = λ T ( x , z ) , where λ is a coefficient of thermal conductivity, and T is a gradient of temperature. On the upper surface (with a heat insulator), the boundary condition for the heat flux is j z ( x , h ) = 0 . On the lower surface bordering on infinitely high thermal conductivity, temperature T is equal room temperature T0. In this case, the temperature distribution inside the flat layer is determined by the stationary heat conduction equation:
λ Δ T 1 = w δ ( r )
with boundary conditions:
T 1 ( x , h ) = 0 ; T 1 ( x , h ) z = 0 .
Here, Δ is a Laplace operator, T1 is additional temperature to room temperature T0, w is power per unit length, δ r is two-dimensional delta-function. In an infinite space, the solution to Equation (1) with zero heat flux at infinity would be the function T 1 ( x , z ) = w 2 π λ ln 1 x 2 + z 2 . Note that the temperature is a potential of the heat flow field; therefore, one can use the electrostatic analogy and ensure the fulfillment of conditions (2) by introducing an infinite sequence of fictitious heat sources of power w n = s n w . s n = ± 1 at the points x = 0 and z n = 2 n h , n = ± 1 , ± 2 , . That is, the solution to Equation (1) in our case can be presented as a sign-alternating series:
T 1 x , z = w f x , z 2 π λ ; f x , z = ln 1 x 2 + z 2 + n = 1 s k ln 1 x 2 + z n 2
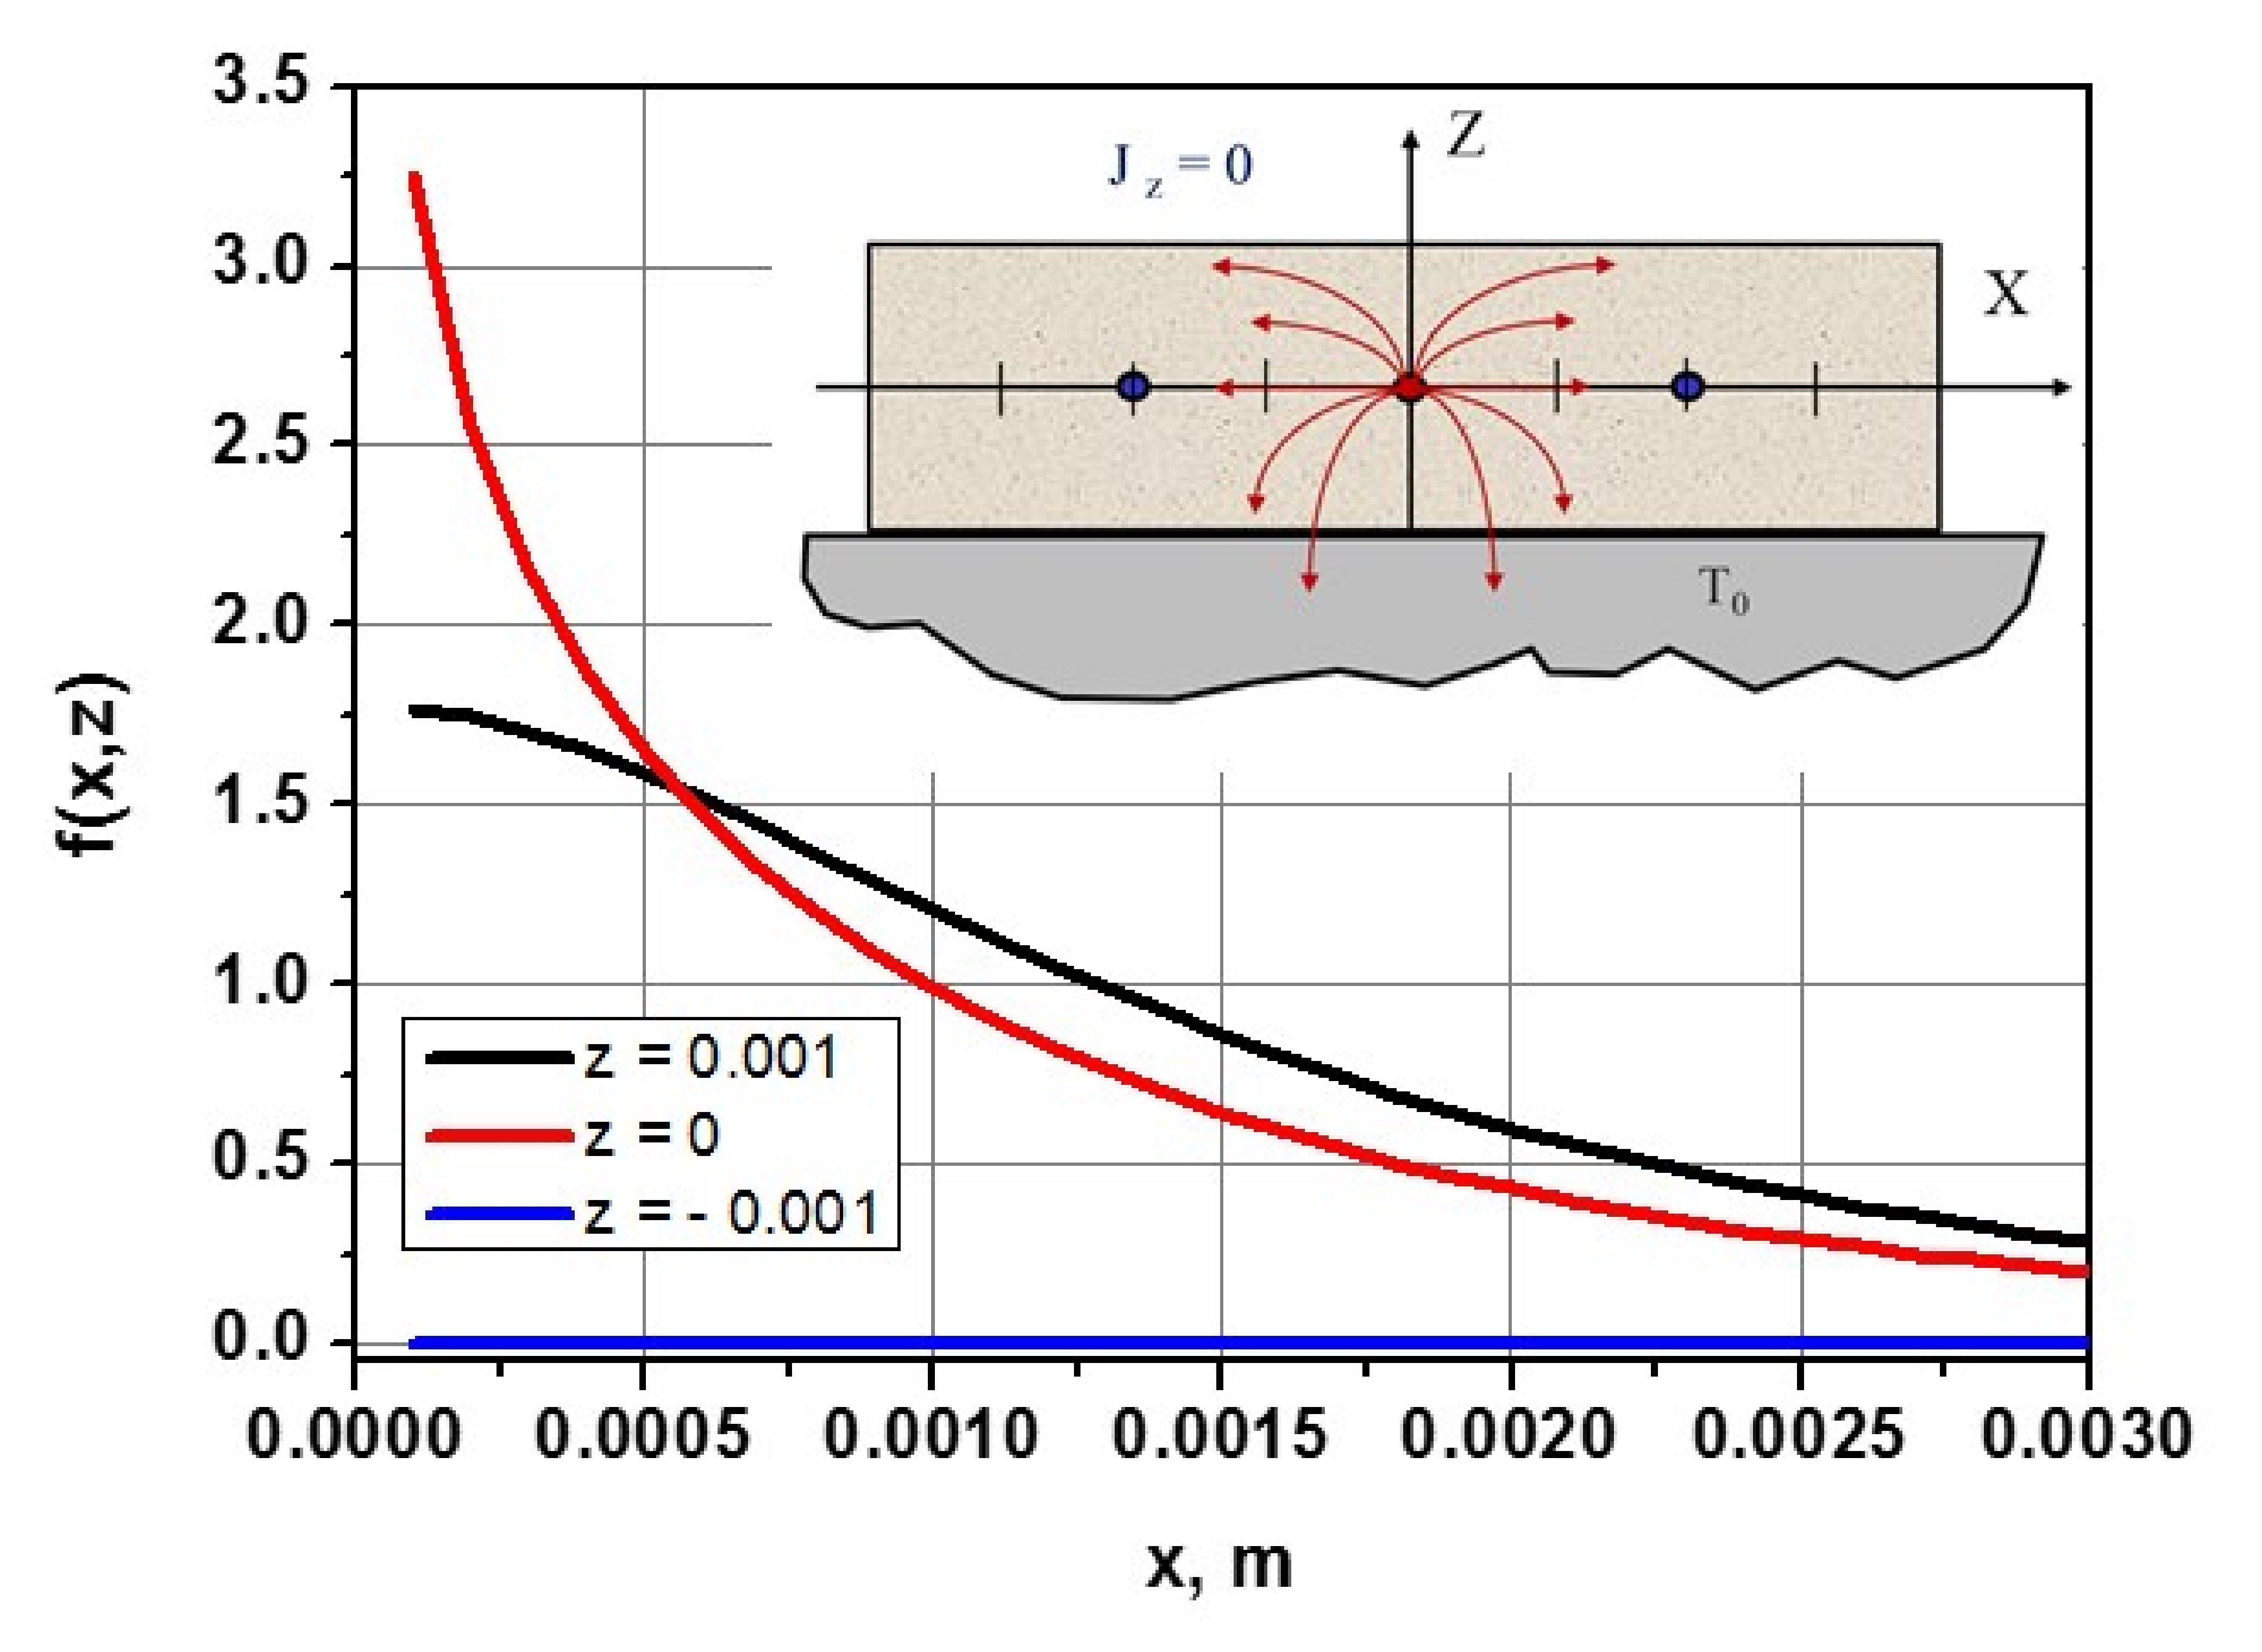
This series is convergent since it breaks into the sum of a sign-alternating series with infinitely decreasing terms. The series convergence is slow, and an accurate enough solution in the current region requires a rather large number of terms in Equation (3) f f N = n = 1 n = 1 2 N . Thus, the first of the boundary conditions in Equation (2) is satisfied with a relative accuracy of 0.04% when 108 terms (N = 54) are taken into account in the sum of Equation (3), and the second one is satisfied only with an accuracy of 3%. To be specific, let us consider a layer with a thickness of 2h = 2 mm and the region |x| ≤ 4 mm. Figure 3 shows the dependence of the function f(x, z) on the x coordinate for three values of z.
These theoretical results obtained for an infinite layer can be used for a sample of finite width. To assess the accuracy of the proposed approach for a sample with width x = ±L and height z = ±h, we calculated the ratio of the heat flux leaving through the side surface to the flux through the horizontal boundary x = −h: δ 1 = h h f x L , z d z / 0 L f z x , h d x . Here, fx (fz) denotes the derivative of the function f with respect to x (z). In our measurements described below, L = 4 mm and h = 1 mm, and the ratio is less than 3%.
The calculated values of the function f(x,z) can be used to determine the coefficient of thermal conductivity λ. Indeed, it follows from Formula (3) that λ = w f x 0 , z 0 2 π T x 0 , z 0 T 0 , where w is the thermal power per unit length at the point x = 0; z = 0; T(x0, z0) is the temperature measured at some point of observation (in our case, x0 = 0.002; z0 = 0), and the value f(x0, z0) is calculated at the same point with the required accuracy (f(x0, z0) ≅ 0.43).

2.3. Samples for Measuring the Thermal Conductivity of Composite Materials

The possibility of using our method for determining the thermal conductivity coefficient λ of composite materials was tested next. Composite samples were prepared in the form of parallelepipeds 8 × 8 × 2 mm3 in size. As described in Section 2.1, three segments of amorphous ferromagnetic microwires were introduced into each sample during its preparation, one of which was used as a heating element, and the other two served as resistance thermometers. The inset in Figure 3 shows a schematic cross-section of a composite sample 8 × 2 mm2, where the central point with arrows (red) is the point of thermal power release and the edge points (blue) are temperature measurement points.
Samples of composite materials produced from an elastomeric matrix with different filler contents were made without microwires and with embedded segments of microwires. The matrix material was nitrile butadiene rubber grade BNKS-18 AMN TU 38.30313-2006 (Synthetic rubber plant, Krasnoyarsk, Russia), with a mass fraction of acrylonitrile of 17–20 wt%. Mooney’s viscosity, MML 1 + 4 (100 °C), for this elastomer was 42–45 units, with an ash content of 0.4 mass%. Hexagonal boron nitride of grade B (Urals Scientific Research Institute of Chemistry, Joint Stock Company “Urals scientific research institute of chemicals with experiment plant” (JSC “Unichim & Ep”, Yekaterinburg, Russia) was used as a filler, which contains more than 98 mass% of BN and has a graphitization index of 1.80–2.50.
According to the SEM data, the particles are in the form of flakes with a thickness of 0.05 to 3 µm (Figure 4a), and approximately 7% of the particles are less than 1 µm in size. Distributions of filler particles by size were determined using a Fritsch Analysette-22 Nanotech laser diffraction particle size analyzer in accordance with ISO 24235:2007 ceramic composites. The determination of particle size distribution of ceramic powders by the laser diffraction method is shown in Figure 4b. The distribution parameters are characterized by the following values: d10 = 1.597 µm, d50 = 6.561 µm, d90 = 12.306 µm.
The bulk density of BN was 0.311 g/cm3, and the tapped density, determined on a tap density analyzer (Quantachrome Instruments, Boynton Beach, Florida, FL, USA) according to the ISO 787-11 method, was 0.355 g/cm3. Before being introduced into the elastomeric mixture, boron nitride was dried at a temperature of 115 °C for 6 h.
Dicumyl peroxide ((C6H5C(CH3)2O)2, CAS Number 80-43-3, Aldrich 329541, purity of 98.0 mass%, melting point of 38 °C, Sigma-Aldrich Corp., St. Louis, MO, USA) was used as a vulcanizing agent.
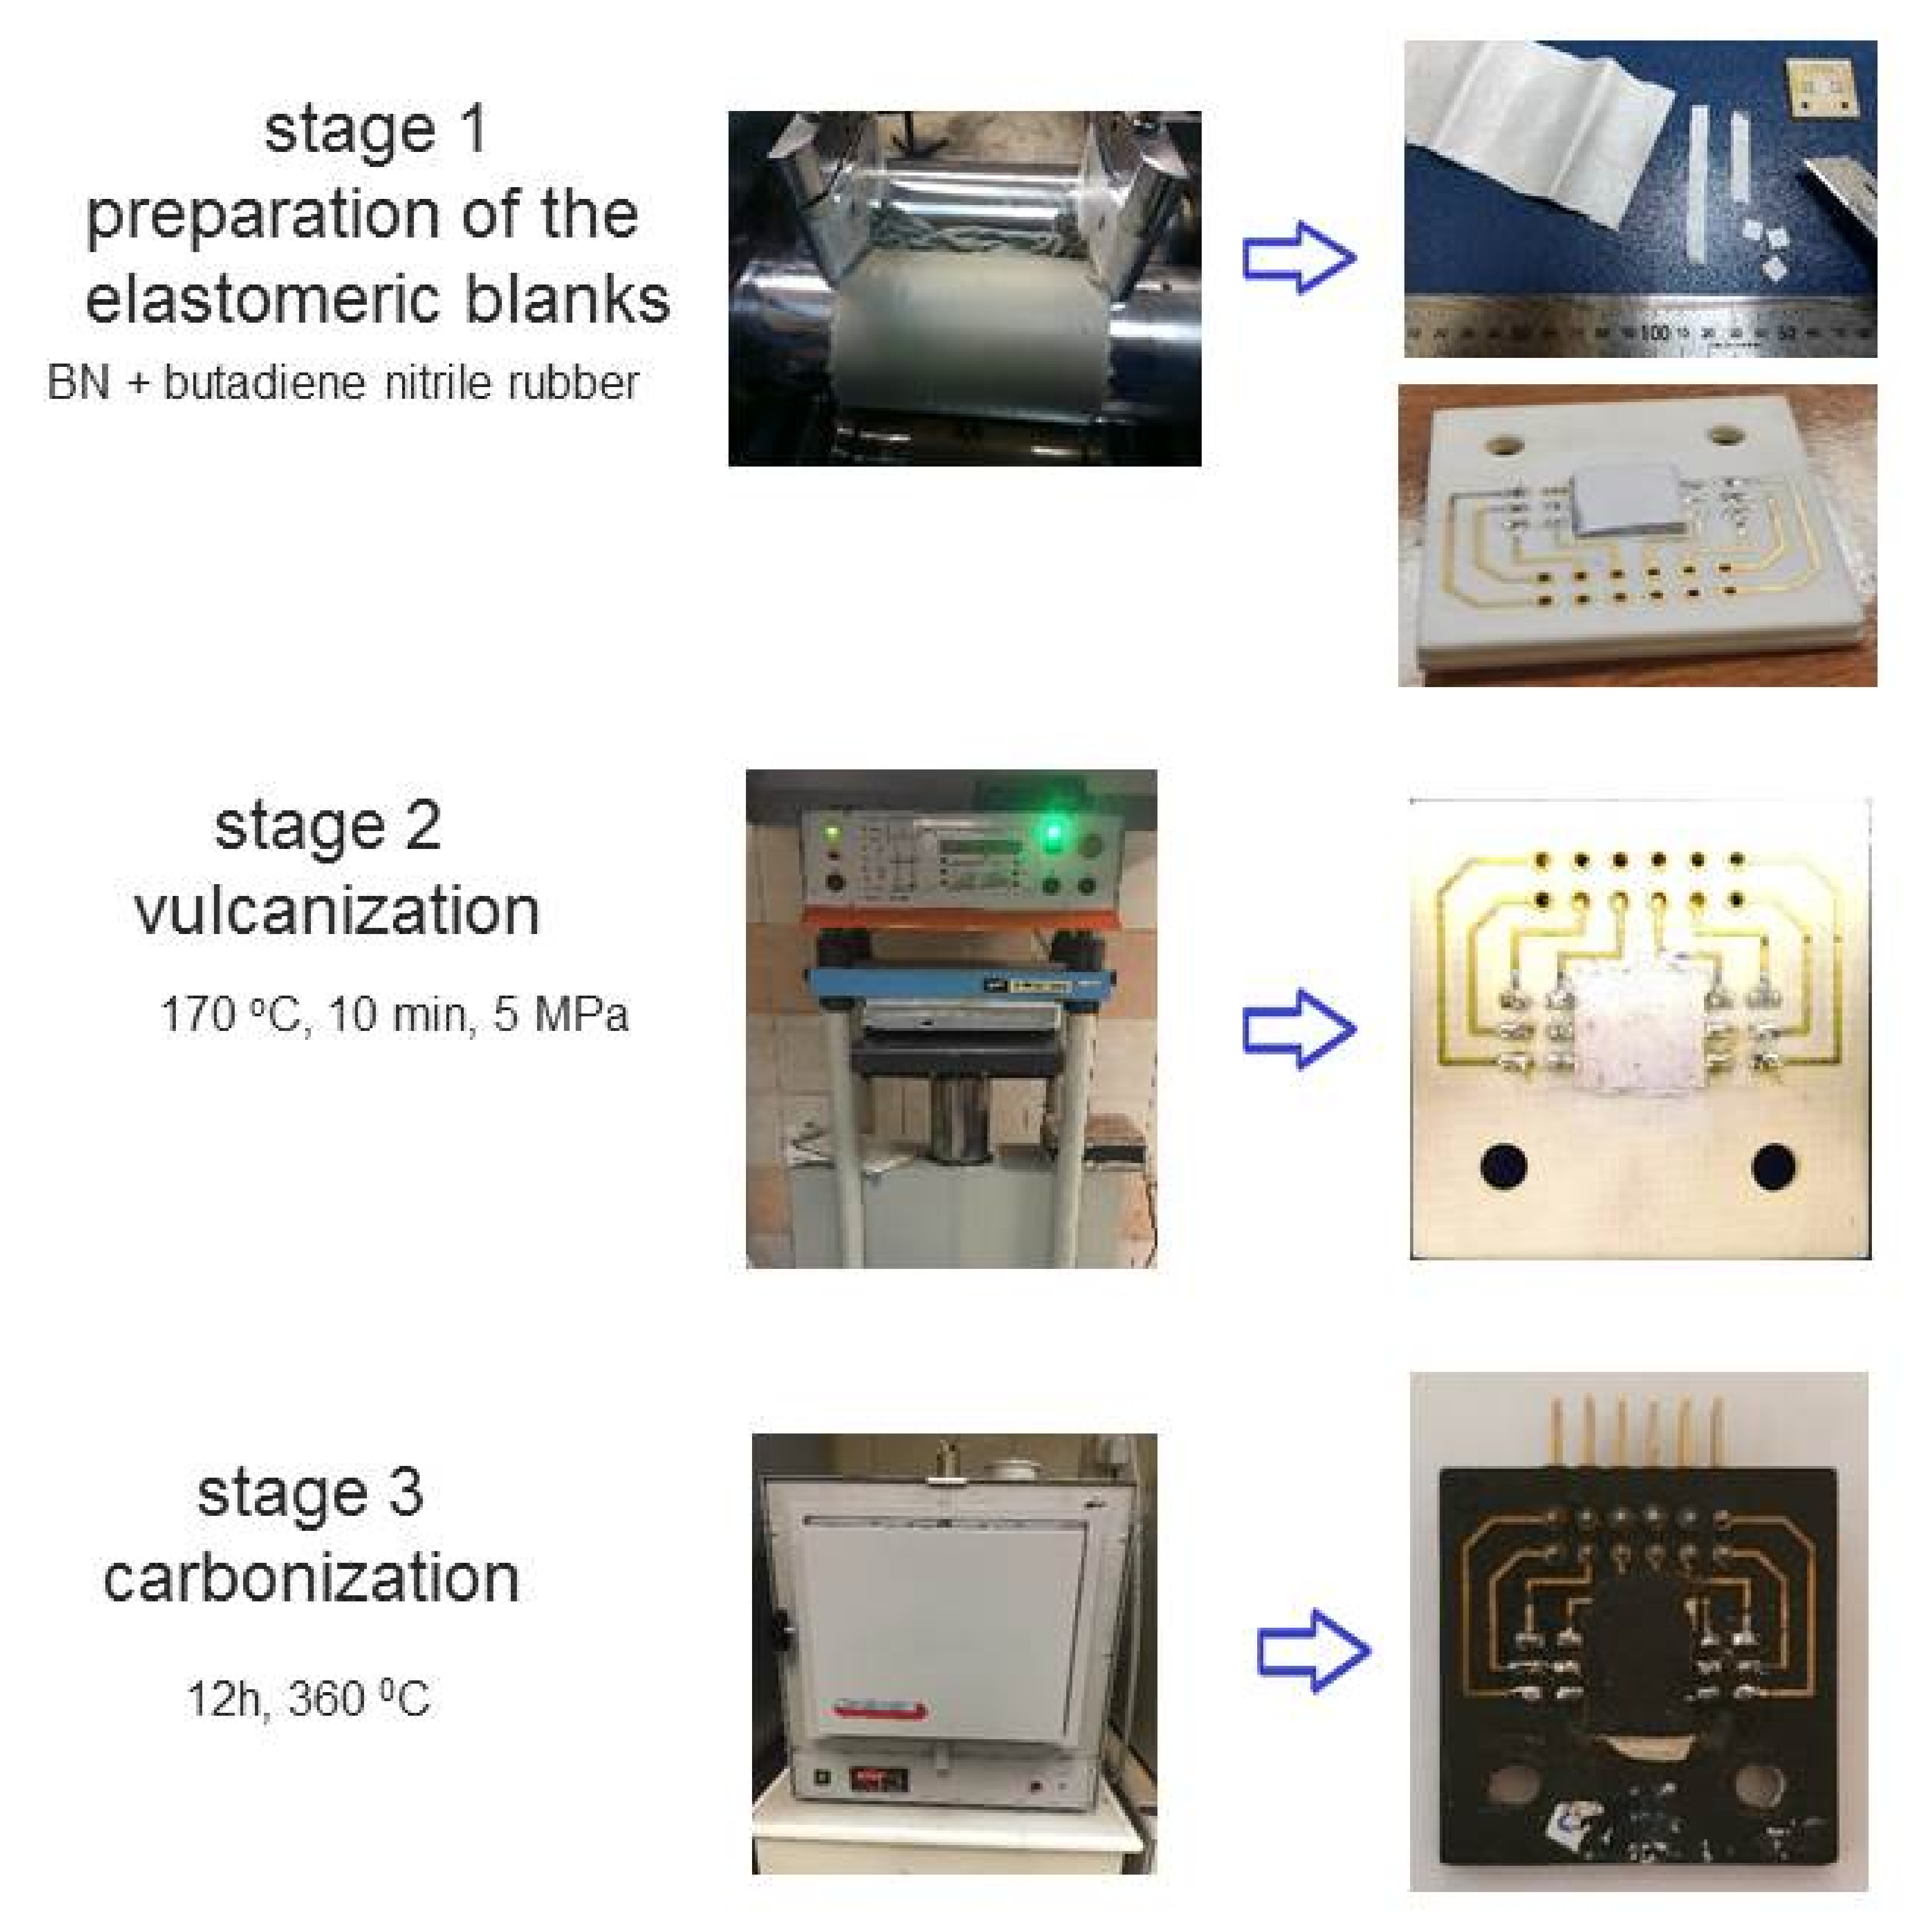
The process of manufacturing composite material samples consisted of three stages. At the first stage, the initial highly filled elastomeric mixture was prepared by using laboratory rubber mixing rollers BL-6175-A (Dongguan Baopin Precision Instrument Co., Ltd., Guangdong, China) with a ratio of the angular velocities of the rolls of 1:1.25 and the temperatures of the front roll of 30 °C and the rear roll of 35 °C. The mixing and homogenization time was 30 min. Sample blanks were prepared from the resulting elastomeric mixture, including samples with embedded microwires that were 8 × 8 mm in size and 2 mm thick.
At the second stage, the obtained blanks were vulcanized in steel tooling using a TESAR AVPM-904 hydraulic press (Tesar-Ingeneering Ltd., Saratov, Russia). Vulcanization of elastomeric compounds was carried out at 170 °C for 10 min with an applied pressure of 5.0 MPa.
At the third stage, low-temperature carbonization was carried out in a PM-16M muffle furnace (Electropribor LLC, Saint Petersburg, Russia) to yield the final product. Heating from room temperature to a final temperature of 360 °C was carried out for 12 h in an argon atmosphere. To assess the influence of the hexagonal BN content on the thermophysical characteristics of composite materials subjected to low-temperature carbonization, samples were prepared containing 40.48, 55.56, and 63.64 wt% mass parts of the filler per 100 mass parts of the elastomeric binder. The process steps for manufacturing composite samples with embedded microwires are shown in Figure 5.

3. Results and Discussion

3.1. Determination of the Thermal Conductivity Coefficient Using Microwires
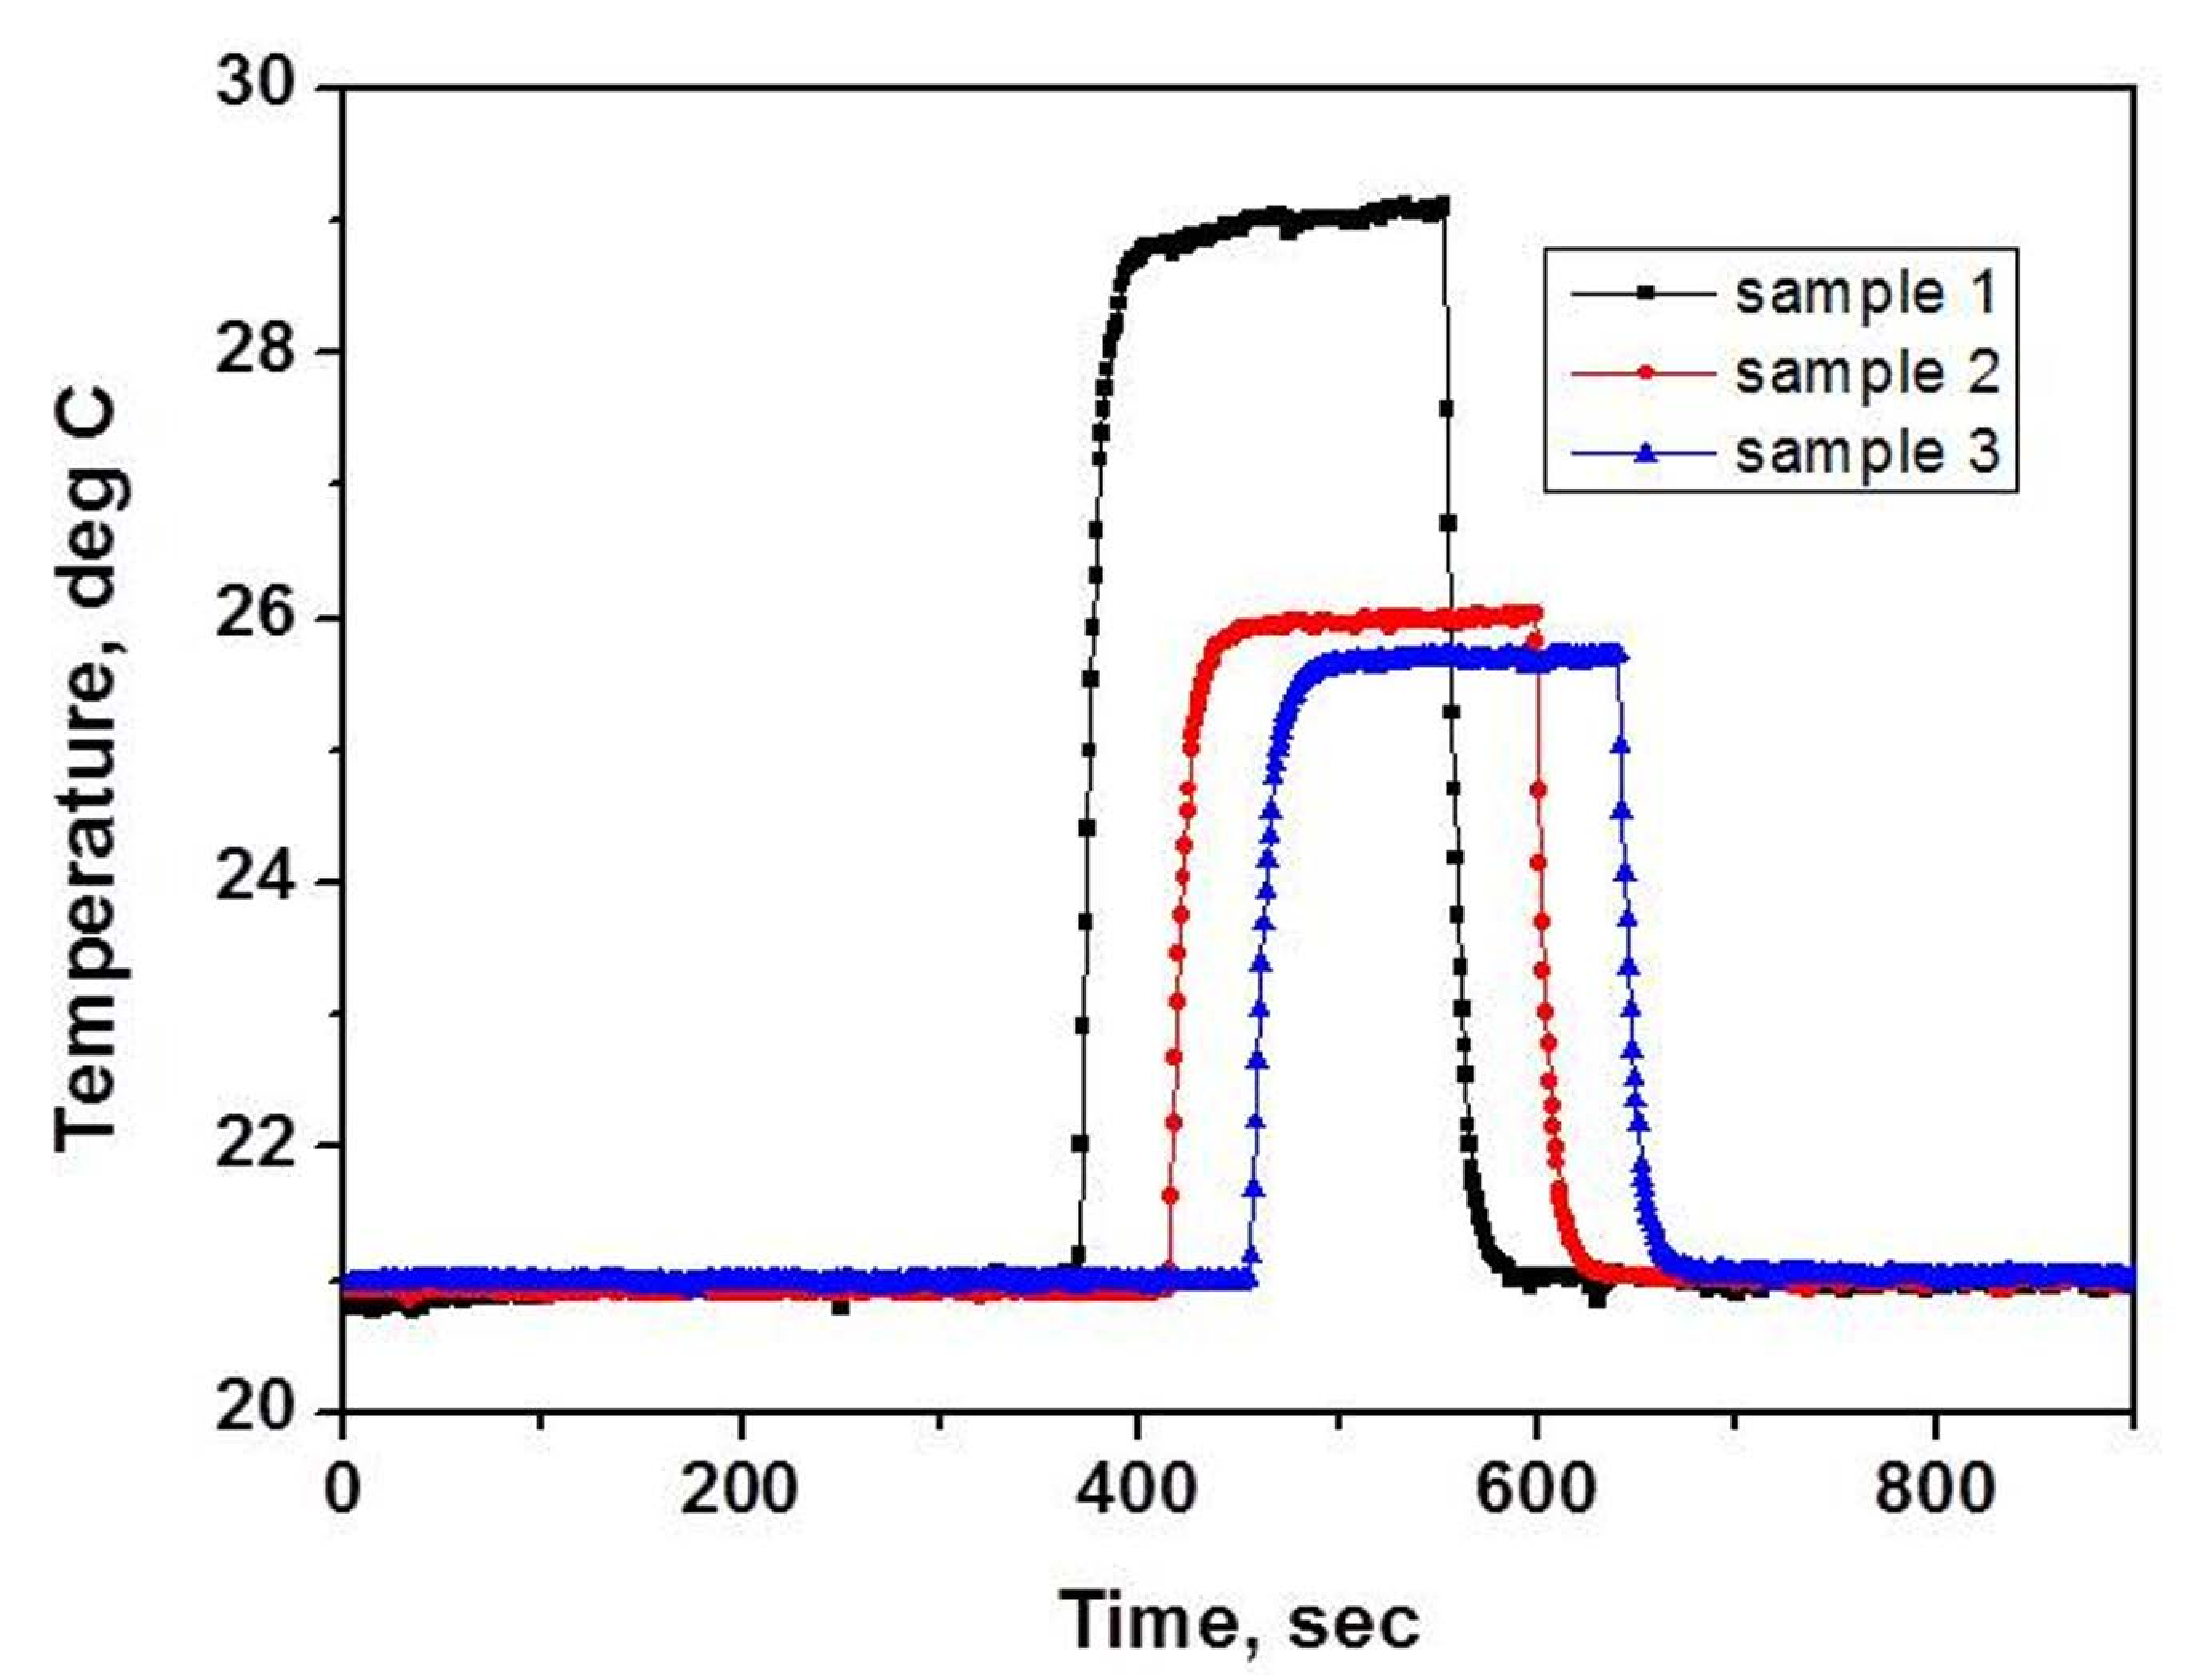
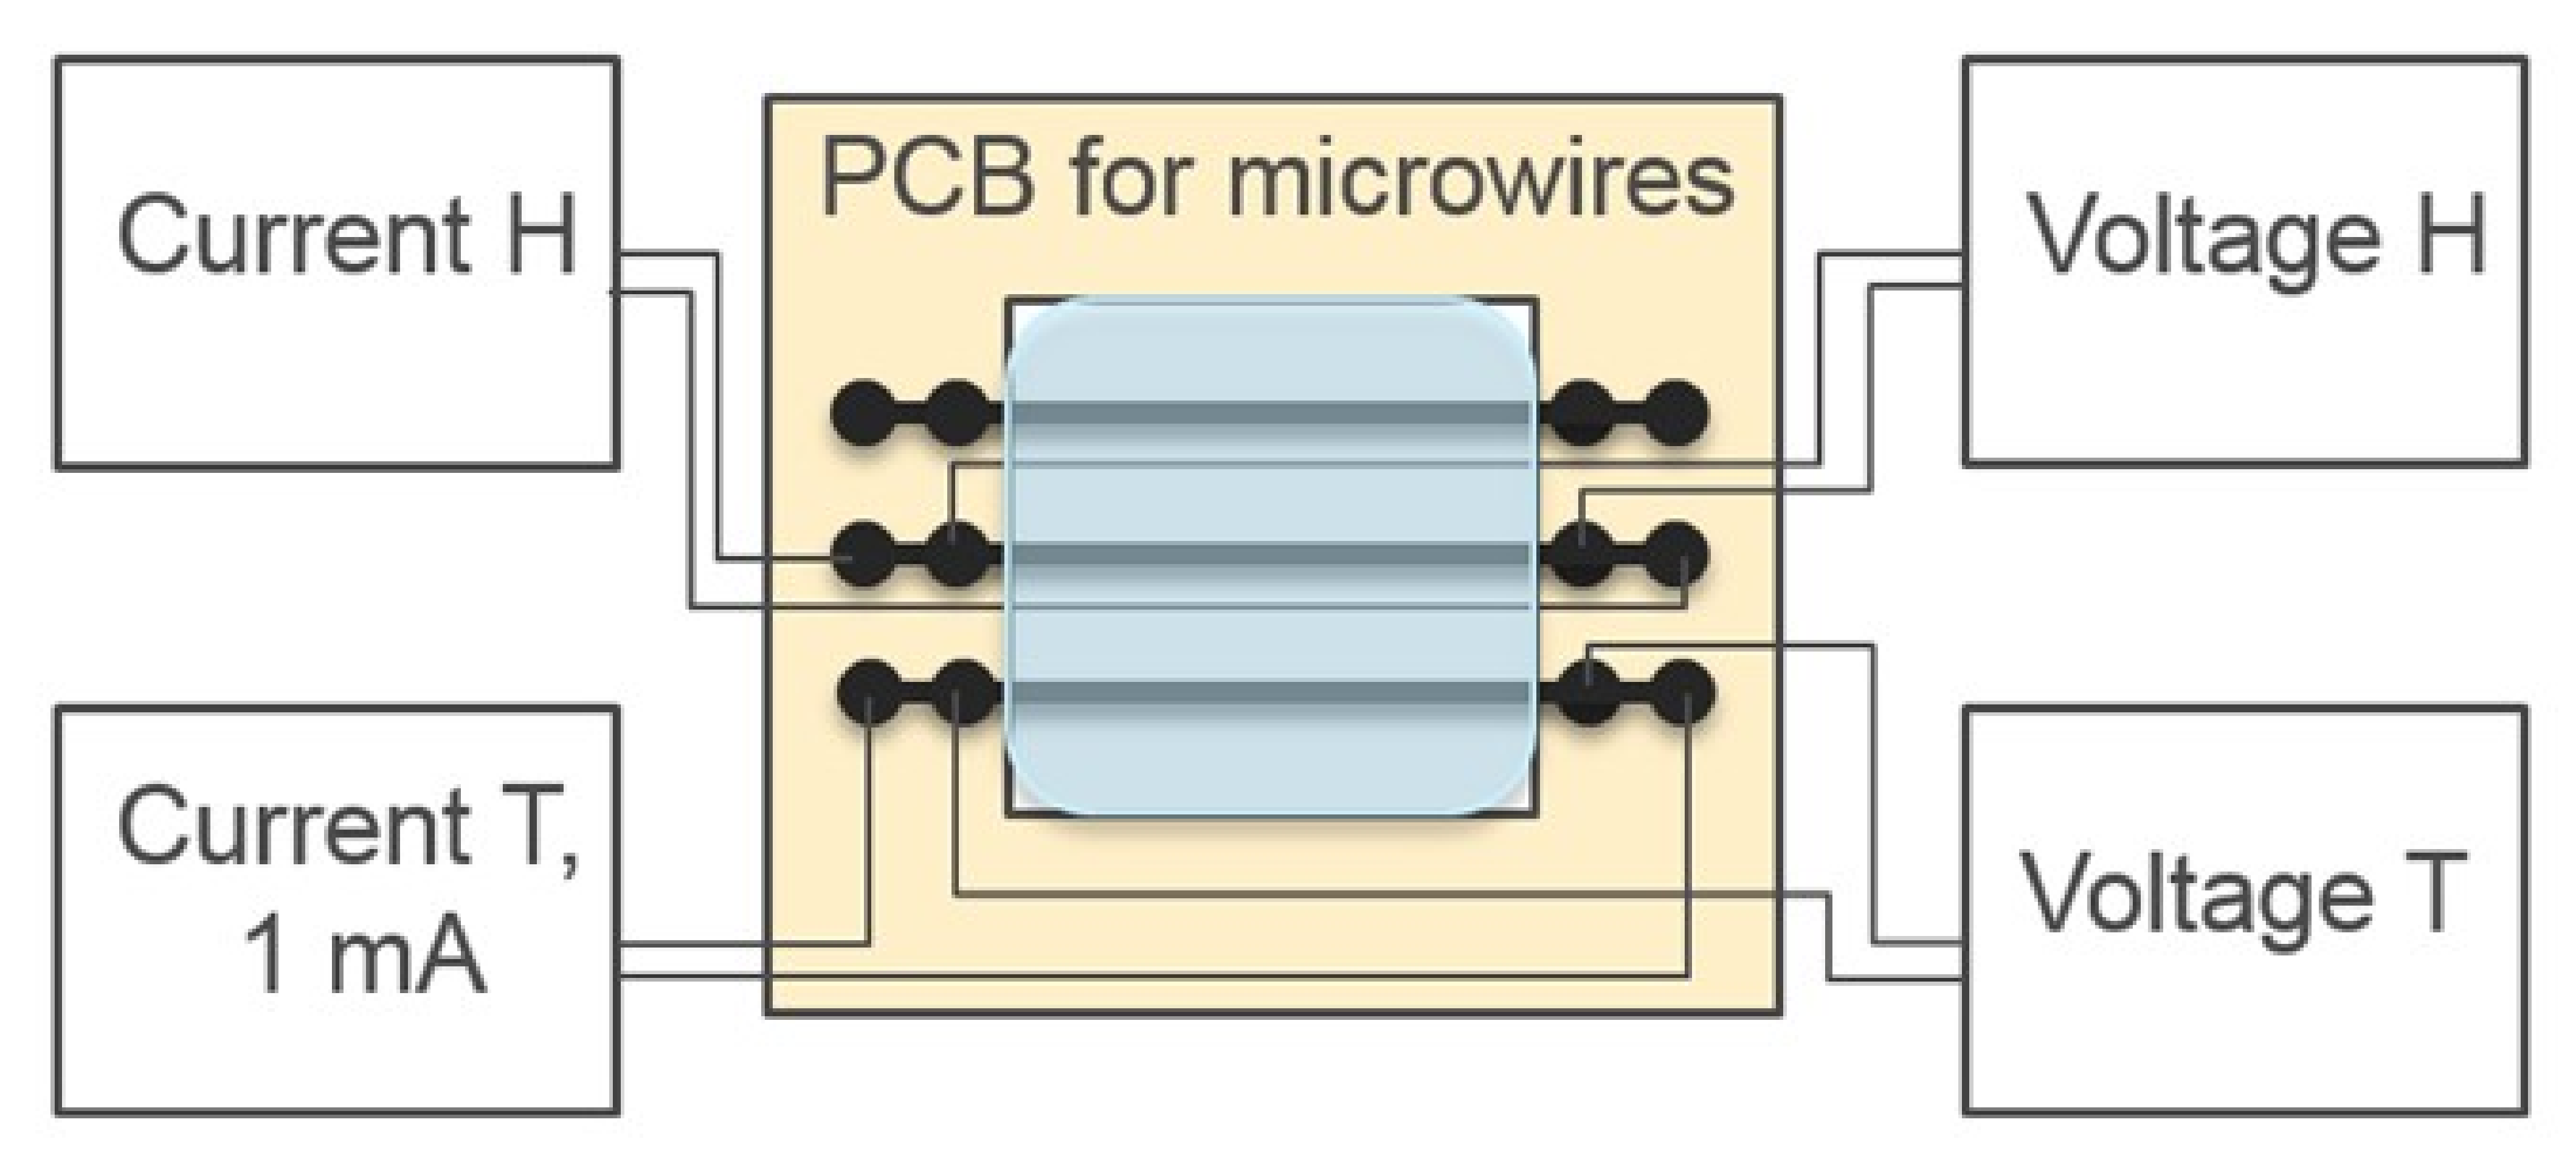
To measure the thermal conductivity coefficient using the proposed method, three samples of a composite material with different BN contents were made. During measurements, each fabricated board with a sample was attached to a powerful copper heatsink. To ensure good thermal contact with the heatsink, a layer of thermal paste was applied to the place where the sample was attached. A schematic diagram of the microwire connection during measurements is shown in Figure 6.
A current source I and a voltmeter V were connected to the contact pads of the central microwire (microheater), which was 8 mm long. One of the outermost microwires was used as a resistance thermometer with a known TCR. Its resistance, which depends on temperature, was measured using a four-point circuit at a fixed operating current of 1 mA. The temperature calibration of the microwire (thermometer) was carried out in advance by measuring the voltage at its contacts at various preset temperatures in the furnace.
The measurements and determination of the thermal conductivity coefficient value were performed in the following sequence. After placing the sample on the heatsink, a current of 1 mA was supplied to the microwire-thermometer; the voltage recording at its output began and continued throughout the entire measurement process. In approximately 300–400 s after the recording started, a source of direct current was connected to the heater microwire, which supplied the heating current with an amplitude of 140 mA, and the voltage at its contacts was measured. The current passed for ~200 s and was then turned off. After turning off the heating current, the recording of the voltage on the microwire continued for about 200–300 s, and the measurement was stopped. In the course of measurements, the voltage on the microwire heater and the microwire thermometer was recorded as a function of time. Figure 7 shows examples of the time dependences of the preset power and temperature obtained after the corresponding calibration.
These data were used to determine the thermal power supplied to the sample and the corresponding equilibrium temperature at the microwire-thermometer location point with coordinates x0 = 0.002; z0 = 0 (see Figure 3), and the value f(x0, z0) is calculated at the same point with the required accuracy (f(x0, z0) ≅ 0.43). Next, the thermal conductivity values of the samples were calculated using Equation (3).
Figure 7. Examples of time dependences of the temperature for three samples, obtained after appropriate calibrations.
Metals 13 00109 g007
The results of both measurements and calculations are summarized in Table 1. According to our estimates, the error in the computed values of the thermal conductivity coefficients was approximately ± 0.1 W/m·K.

3.2. Determination of the Thermal Conductivity of a Composite Material by the Laser Flash Method

A comparison of the values obtained for the thermal conductivity coefficients of similar samples without microwires was carried out by the laser flash method. In the latter method, an indirect estimate of the thermal conductivity of a material is found after measurements of thermal diffusivity, density, and heat capacity by Laser flash analysis (LFA), hydrostatic weighing, and performing DSC analysis.
The determination of the sample thermal diffusivity in the temperature ranges of 25 to 300 °C was carried out by the flash method in accordance with the ASTME1461-07 Standard Test Method for Thermal Diffusivity using a NETZSCH LFA447 NanoFlash setup (NETZSCH-Gerätebau GmbH, Selb, Germany). The study was carried out on cylindrical samples with a diameter of 12.7 mm and a thickness of 1.0–1.5 mm.
Experimental determination of the specific heat Cp of composite materials for the range from 25 to 300 °C was carried out by using a differential scanning calorimeter, the NETZSCH DSC 204 Phoenix F1 (NETZSCH-Gerätebau GmbH, Selb, Germany), in accordance with ISO 11357-4:2014 Plastics—Differential scanning calorimetry (DSC)—Part 4: Determination of specific heat capacity.
The determination of the density ρ of carbonized samples was carried out by hydrostatic weighing in distilled water and ethanol according to ISO 1183-1:2019 Plastics—Methods for determining the density of non-cellular plastics using an AND GR 202 analytical balance (AND, Tsukuba, Japan) equipped with a hydrostatic weighing attachment AD-1653.
Before testing, the samples were conditioned in accordance with ISO 291:2008 Plastics—Standard atmospheres for conditioning and testing at a standard atmosphere of 23/50 for 88 h.
As a reference standard for determining thermal conductivity, a standard sample, sapphire, was used in our work. The tests were carried out on samples with a diameter of 5 mm and a weight of 24–25 mg in a protective argon atmosphere.
The thermal conductivity coefficient for a given temperature was calculated according to the formula:
λ = a ( t ) ρ C p ( t )
where a(t) is the value of thermal diffusivity at temperature t in m2/s, ρ is the material density in kg/m3, and Cp(t) is the specific heat capacity in J/kg·K. The obtained values of thermal conductivity coefficients are presented in Table 1.
The thermal conductivity values obtained with embedded microwires show good agreement with comparative data. The deviation of the thermal conductivity results from the comparison data did not exceed 0.1 W/m·K. This deviation may be due to methodological measurement errors and the different porosities of the samples.
These results demonstrate the possibility of using current heaters and resistance temperature sensors based on microwires for evaluating the efficiency of heat dissipation and for the control of thermal conditions in polymer composite dielectric materials. The integration of several microwires directly into a polymer composite material makes it possible not only to measure its temperature but also to determine the rate of heat propagation in the dielectric and its thermal conductivity. A composite material based on nitrile-butadiene rubber filled with hexagonal BN was used as the test object of our study. This material was subjected to low-temperature carbonization, during which its structure and properties were changed significantly.
The suitability of the proposed technique was confirmed by comparing the obtained estimates of thermal conductivity with the results of measurements by the LFA method. The measured values of thermal conductivity using microwires differed from the obtained reference values by no more than 0.1 W/m·K. The comparison has shown a similar dependence of thermal conductivity on the degree of filling with BN particles. The main advantage of this technique lies in its simplicity and rapid determination of the thermal conductivity coefficient while maintaining the required accuracy.
Under the influence of heat, the polymer material can undergo irreversible changes in its physical and chemical properties. During aging, cracks can develop in the material, strength characteristics can significantly decrease, and the material can become embrittled. The nature of these changes varies widely depending on the type of material and the environment in which it is used. To control the temperature change during the operation of the product made from the polymer composite material to track the processes of its thermal degradation at the manufacturing stage, microwires can be introduced into the polymer components of PCBs and case structures as sensors. Their use will allow, if necessary, to correct the operating modes of the electrical system in order to reduce the temperature as well as detect the possibility of failures due to changes in the thermal conductivity of the product.

4. Conclusions

In this paper, a new method for the determination of the thermal conductivity coefficient of polymer composite materials by using Co-based ferromagnetic microwires is proposed. The fundamental point of the method is the use of ultrathin heaters and thermometers that do not change the temperature field in the sample. The main conclusions are as follows:
(1)
The temperature distribution in a flat heat-conducting layer of a material, which contains an infinitely thin source of thermal power, has been obtained. A method for determining the thermal conductivity of a material layer using thin microwires as heaters and thermometers is proposed.
(2)
Current microheaters and resistance thermometers were made on the basis of segments of Co-rich microwires. A technique for embedding several microwires into the polymer composite test material has been developed.
(3)
The thermal conductivity values obtained during the experiments are in good agreement with comparative data. These results demonstrate the possibility of using microwires as microsensors to evaluate the efficiency of heat removal and control the thermal regime in polymer composite dielectric materials.

Author Contributions

Conceptualization—S.G.; Methodology—S.G. and A.S. (Andrey Stepashkin); software—Y.G., V.O. and V.P.; Validation—M.C. and A.S. (Andrey Stepashkin); Formal Analysis—Y.G. and V.P.; Technology—V.M. Investigation—A.S. (Aida Sarakueva) and V.O.; Writing Original Draft Preparation A.S. (Andrey Stepashkin) and M.C.; Editing—S.G.; Visualization—A.S. (Aida Sarakueva) and V.M.; Supervision—S.G.; Project administration—M.C. All authors have read and agreed to the published version of the manuscript.

Funding

This work was supported by the Ministry of Science and Higher Education of Russia in the frame of state assignment no. 075-00268-20-02 dated 3 December 2020, state program of basic research “For the long-term development and ensuring the competitiveness of society and the state” (47 GP) on the base of the universities, the plan of basic scientific research no. 718/20 dated 3 June 2020, project no. 0718-2020-0036.

Institutional Review Board Statement

Not applicable.

Informed Consent Statement

Not applicable.

Data Availability Statement

Not applicable.

Conflicts of Interest

The authors declare no conflict of interest. The funders had no role in the design of the study; in the collection, analyses, or interpretation of data; in the writing of the manuscript, or in the decision to publish the result.

References

  1. Kraus, L.; Knobel, M.; Kane, S.N.; Chiriac, H. Influence of Joule heating on magnetostriction and giant magnetoimpedance effect in a glass covered CoFeSiB microwire. J. Appl. Phys. 1999, 85, 5435. [Google Scholar] [CrossRef]
  2. Chiriac, H.; Ovari, T.A. Amorphous glass-covered magnetic wires: Preparation, properties, applications. Prog. Mater. Sci. 1996, 40, 333–407. [Google Scholar] [CrossRef]
  3. Zhukova, V.; Chizhik, A.; Zhukov, A.; Torcunov, A.; Larin, V.; Gonzalez, J. Optimization of giant magnetoimpedance in Co-rich amorphous microwires. IEEE Trans. Magn. 2002, 38, 3090–3092. [Google Scholar] [CrossRef]
  4. Phan, M.H.; Peng, H.X. Giant magnetoimpedance materials: Fundamentals and applications. Prog. Mater. Sci. 2008, 53, 323–420. [Google Scholar] [CrossRef]
  5. Larin, V.S.; Torcunov, A.V.; Zhukov, A.; Gonzalez, J.; Vazquez, M.; Panina, L. Preparation and Properties of Glass-coated Microwires. J. Magn. Magn. Mater. 2002, 249, 39–45. [Google Scholar] [CrossRef]
  6. Vazquez, M.; Chiriac, H.; Zhukov, A.; Panina, L.; Uchiyama, T. On the state-of-the art in magnetic microwires and expected trends for scientific and technological studies. Phys. Stat. Sol. A 2011, 208, 493–501. [Google Scholar] [CrossRef]
  7. Gudoshnikov, S.; Usov, N.; Palvanov, P.; Ljubimov, B.; Serebryakova, O.; Gorbunov, S.; Zhukov, A.; Zhukova, V. Evaluation of use of magnetically bistable microwires for magnetic labels. Phys. Stat. Sol. A 2011, 208, 526–529. [Google Scholar] [CrossRef]
  8. Alam, J.; Yudanov, N.; Podgornaya, S.; Panina, L.; Nematov, M. High-frequency magnetoimpedance (mi) and stress-mi in amorphous microwires with different anisotropies. Nanomaterials 2021, 11, 1208. [Google Scholar] [CrossRef]
  9. Gudoshnikov, S.A.; Odintsov, V.I.; Liubimov BYa Menshov, S.A.; Popova, A.V. Correlation of electrical and magnetic properties of Co-rich amorphous ferromagnetic microwires after DC Joule heating treatment. J. Alloys Compd. 2020, 845, 156220. [Google Scholar] [CrossRef]
  10. Chen, D.; Liu, J.; Zhang, L.; Shen, H.; Sun, J. Large Linear Giant Magneto-Impedance Response of Microwire Annealed under Liquid Medium for Potential Sensor Applications. Metals 2022, 12, 1926. [Google Scholar] [CrossRef]
  11. Wang, C.; Cao, G.; Liu, J.; Zhang, Y.; Liu, R.; Wang, F.; Zhang, M.; Wang, L.; Zhang, B. Direct Current Annealing Modulated Ordered Structure to Optimize Tensile Mechanical Properties of Co-Based Amorphous Metallic Microwires. Metals 2022, 12, 1427. [Google Scholar] [CrossRef]
  12. Mohri, K.; Uchiyama, T.; Shen, L.P.; Cai, C.M.; Panina, L.V. Amorphous wire and CMOS IC-based sensitive micro magnetic sensors (MI sensor and SI sensor) for intelligent measurements and controls. J. Magn. Magn. Mater. 2002, 249, 351–356. [Google Scholar] [CrossRef]
  13. Nematov, M.G.; Baraban, I.; Yudanov, N.A.; Rodionova, V.; Qin, F.X.; Peng, H.X.; Panina, L.V. Evolution of the magnetic anisotropy and magnetostriction in Co-based amorphous alloys microwires due to current annealing and stress-sensory applications. J. Alloys Compd. 2020, 837, 155584. [Google Scholar] [CrossRef]
  14. Moya, A.; Archilla, D.; Navarro, E.; Hernando, A.; Marin, P. Scattering of Microwaves by a Passive Array Antenna Based on Amorphous Ferromagnetic Microwires for Wireless Sensors with Biomedical Applications. Sensors 2019, 19, 3060. [Google Scholar] [CrossRef] [PubMed] [Green Version]
  15. Archilla, D.; Lopez-Sanchez, J.; Hernando, A.; Navarro, E.; Marin, P. Boosting the Tunable Microwave Scattering Signature of Sensing Array Platforms Consisting of Amorphous Ferromagnetic Fe2.25Co72.75Si10B15 Microwires and Its Amplification by Intercalating Cu Microwires. Nanomaterial 2021, 11, 920. [Google Scholar] [CrossRef] [PubMed]
  16. Qin, F.X.; Peng, H.X. Ferromagnetic microwires enabled multifunctional composite materials. Prog. Mater. Sci. 2013, 58, 183–259. [Google Scholar] [CrossRef]
  17. Qin, F.X.; Peng, H.X.; Chen, Z.; Wang, H.; Zhang, J.W.; Hilton, G. Optimization of microwire/glass-fibre reinforced polymer composites for wind turbine application. J. Appl. Phys. A 2013, 113, 537–542. [Google Scholar] [CrossRef]
  18. Luo, Y.; Peng, H.X.; Qin, F.X.; Ipatov, M.; Zhukova, V.; Zhukov, A.; Gonzalez, J. Metacomposite characteristics and their influential factors of polymer composites containing orthogonal ferromagnetic microwire arrays. J. Appl. Phys. A 2014, 115, 173909. [Google Scholar] [CrossRef] [Green Version]
  19. Birame Gueye, P.G.; Lopez-Sanchez, J.; Navarro, E.; Serrano, A.; Marin, P. Control of the Length of Fe73.5Si13.5Nb3Cu1B9 Microwires to Be Used for Magnetic and Microwave Absorbing Purposes. ACS Appl. Mater. Interfaces 2020, 12, 15644–15656. [Google Scholar] [CrossRef]
  20. Popova, A.V.; Odintsov, V.I.; Menshov, S.A.; Kostitsyna, E.V.; Tarasov, V.P.; Zhukova, V.; Zhukov, A.; Gudoshnikov, S.A. Continuous control of a resistance in Co-rich amorphous ferromagnetic microwires during DC Joule heating. Intermetallics 2018, 99, 39–43. [Google Scholar] [CrossRef]
  21. Gudoshnikov, S.A.; Odintsov, V.I.; Liubimov, B.Y.; Menshov, S.A.; Churukanova, M.N.; Kaloshkin, S.D.; Elmanov, G.N. Method for evaluating the temperature of amorphous ferromagnetic microwires under Joule heating. Measurement 2021, 182, 109783. [Google Scholar] [CrossRef]
  22. Gudoshnikov, S.A.; Mashera, V.S.; Tarasov, V.P.; Odintsov, V.I.; Popova, A.V.; Menshov, S.A.; Liubimov, B.Y.; Grebenshchikov, Y.B. Influence of joule heating on electrical resistivity in Co-rich amorphous microwires. Mater. Sci. Eng. B 2021, 271, 115310. [Google Scholar] [CrossRef]
  23. Mehra, N. Thermal transport in polymeric materials and across composite interfaces. Appl. Mater. Today 2018, 12, 92–130. [Google Scholar] [CrossRef]
  24. Yang, X. A review on thermally conductive polymeric composites: Classification, measurement, model and equations, mechanism and fabrication methods. Adv. Comp. Hybrid Mater. 2018, 1, 207–230. [Google Scholar] [CrossRef]
  25. Mehra, N. Engineering molecular interaction in polymeric hybrids: Effect of thermal linker and polymer chain structure on thermal conduction. Compos. B Eng. 2019, 166, 509–515. [Google Scholar] [CrossRef]
  26. Haggenmueller, R. Single wall carbon nanotube/polyethylene nanocomposites: Thermal and electrical conductivity. Macromolecules 2007, 40, 2417–2421. [Google Scholar] [CrossRef]
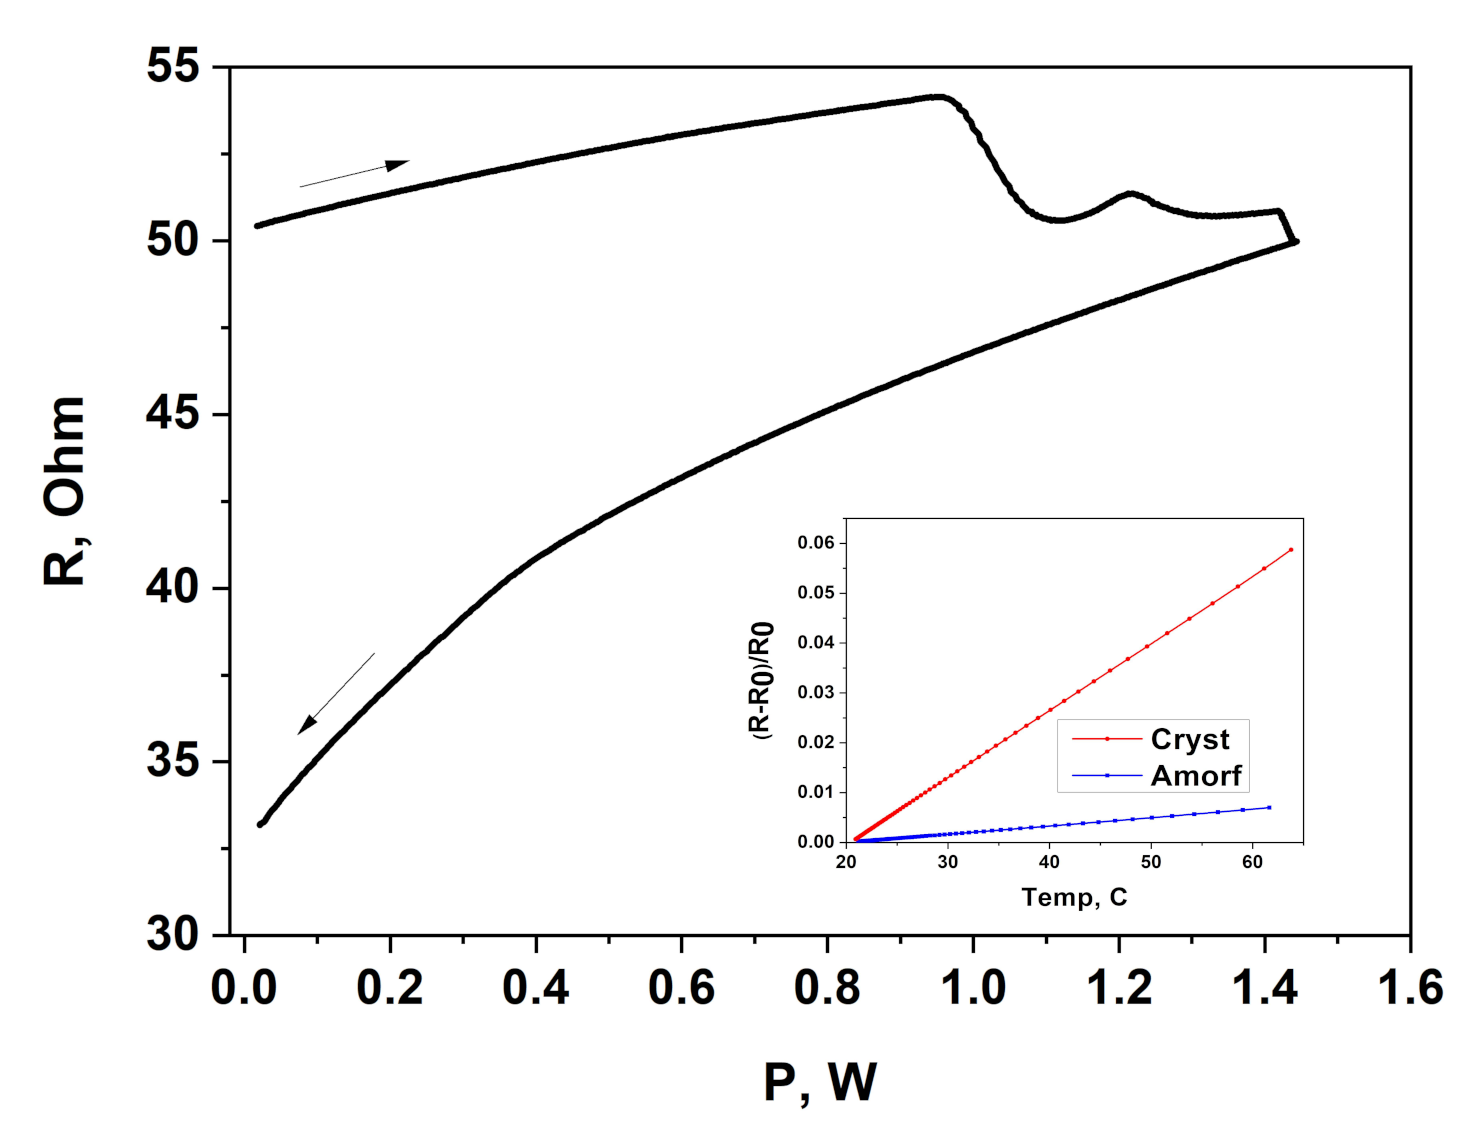
Figure 2. Dependence of the resistance of a microwire segment on the applied power during Joule heating. The insert shows the dependence of relative changes in the microwire resistance on temperature in both amorphous (blue curve) and crystalline (red curve) states.
Metals 13 00109 g002
Figure 3. Calculated values of the function f(x, z) in Equation (3) at different z values. Inset shows a schematic cross-section of a composite sample, where the central point with arrows (red) is the point of thermal power release and the edge points (blue) are temperature measurement points.
Metals 13 00109 g003
Figure 4. (a) The SEM image of BN; (b) determination of particle size distribution of ceramic powders NB by laser diffraction method.
Metals 13 00109 g004
Figure 5. A scheme for obtaining the composite samples.
Metals 13 00109 g005
Figure 6. The scheme of the electrical control during our measurements of thermal conductivity.
Metals 13 00109 g006
Table 1. The main characteristics of the samples.
Sample123
BN content, wt%40.4855.5663.64
Microheater resistance, Ohm48.549.250.1
Power per unit length, w118120.5123
Thermometer resistance, Ohm34.332.132.8
TxT0, °C7.85.04.7
The thermal conductivity coefficient obtained by microwires, W/(m·K)1.051.651.80
The thermal conductivity coefficient obtained by LFA method, W/(m·K)1.081.711.87
Disclaimer/Publisher’s Note: The statements, opinions and data contained in all publications are solely those of the individual author(s) and contributor(s) and not of MDPI and/or the editor(s). MDPI and/or the editor(s) disclaim responsibility for any injury to people or property resulting from any ideas, methods, instructions or products referred to in the content.