Article

Corrosion Induced Morphology Evolution in Stressed Solids

1
State Key Laboratory for Strength and Vibration of Mechanical Structures, Department of Engineering Mechanics, School of Aerospace Engineering, Xi’an Jiaotong University, Xi’an 710049, China
2
China Institute of Atomic Energy, Beijing 102413, China
*
Author to whom correspondence should be addressed.
Metals 2023, 13(1), 108; https://doi.org/10.3390/met13010108
Submission received: 13 December 2022 / Revised: 25 December 2022 / Accepted: 27 December 2022 / Published: 4 January 2023
(This article belongs to the Section Corrosion and Protection)

Abstract

:
Corrosion morphology is a key factor that influences the reliability and service life of a structure. As most structures service under stress corrosion, there is a great need to understand the effect of stress on the formation conditions of different morphologies. This paper introduces a numerical method to simulate the evolution of surface morphologies. The results indicate that a corroded surface will become rougher and sharper with an increase in stress, and as a consequence, the corrosion morphology will transfer from a flatter surface to a pit and then a crevice. The critical stress values for different morphologies (crevice, pit, and a flatter surface) were captured. Among the three morphologies, the flatter surface and pit maintain a fixed shape, also known as stable morphology. As stress exceeds a critical value, crevices are generated, and the morphology evolution becomes unstable. On the basis of the simulation results, the influence of morphology on the service life of the structure was evaluated. The corrosion velocity of a rough surface exceeds that of a flat surface, and this reduces the service life of the structure more significantly. With a rise in applied stress, the acceleration of corrosion presents a quadratically increasing relationship with applied stress.

1. Introduction

Most metallic structures bear mechanical loads and corrosion simultaneously during service, which will lead to stress corrosion. Stress corrosion is more intensive than the simple superposition of mechanical damage and electrochemical corrosion [1,2,3]. Along with stress corrosion, different morphologies, rough or flat, will appear; these have different influences on the reliability and integrity of the structure. Rough surface morphology, such as pits, crevices, and cracks [4,5,6,7,8], increases the corrosion rate [9,10,11,12] and shorten the failure time of the structure [13]. On the contrary, flat surface morphology may improve the reliability and service life of the structure. Since corrosion morphology is a key factor in influencing the service life of a structure, the conditions of its formation must be understood.
Stress has a great influence on the evolution of corrosion morphology. When stress intensity is at a high level, the corresponding stress corrosion cracking (SCC) has been widely researched by experiments [14,15,16,17] or simulations [3,18,19], and under corrosion and tensile loading, a thin, nanoporous layer may form on the alloy, which provides a nucleation location for SCC [20,21]. When the stress intensity factor is below the threshold of stress corrosion cracking, stress corrosion is still a key factor influencing the long-term service life of the structure. In this case, morphology is only changed by the dissolution process of the surface atoms [16]. Stress can increase the corrosion dissolution rate by increasing the activation energy of metals [22,23]. The stress concentration can lead to the breakdown of the passive film in certain areas, and this induces the corresponding localized dissolution [24]. Moreover, an undulated surface leads to the nonuniform distribution of stress and an uneven corrosion process. Crevices, pits, and flatter surfaces are common corrosion morphologies [25]. Once crevices form on the surface, the mass transfer process is restricted in the narrow crevice, and the corrosion products are detained between the adjacent surfaces, which can lead to severe localized corrosion in the crevice [6,26,27]. Apart from crevices, corrosion pits can accelerate the failure of a structure by perforation [24]. As the surface becomes flatter during the corrosion, the reliability of the structure can sometimes be increased. Thus, it is of great importance to understand the effect of stress on the formation conditions of different corrosion morphologies.
In order to investigate the effect of stress on corrosion morphology, plenty of experiments have been conducted. Zhu et al. investigated the stress effect on the crevice corrosion of the 304 stainless steel in a 3.5 wt.% NaCl solution. The result showed that applied stress could assist the corrosion and cause more damage in the crevice on the 304 stainless steel [4]. Li et al. researched the corrosion behavior of 13Cr stainless steel under stress and crevices in a 3.5 wt.% NaCl solution. It was found that the propagation of crevice corrosion is promoted by increments in the applied stress [28]. Ma et al. investigated the pit corrosion behavior of A537 steel under cyclic stress. The result showed that the growth rate of the pits increased under a mechanical load compared with the no-stress condition [29].
Apart from experiments, numerical methods have been developed to simulate the evolution process of corrosion morphology and provide insights for further research [30]. Jafarzadeh et al. simulated the evolution process of crevice corrosion damage in Nickel alloy 625 using the peridynamic method, which matched well with the experimental results [31]. Duddu et al. developed a new extended finite element method to track the evolution process of corrosion pits and crevices [32]. Fan et al. simulated the evolution process of corrosion morphology under different mechanical loads and reported that stress had a great influence on corrosion morphology [30]. An initial sine wave surface was corroded into pits and crevices with mechanical loading; the surface became flatter and smoother via uniform corrosion under no stress [30].
As mentioned above, lots of experiments and simulations have been carried out to investigate the effects of stress on corrosion morphology. However, the stress effect on formation conditions for crevices, pits, and flatter surfaces, is rarely studied, and the influence of morphology on corrosion velocity has not been revealed. When the critical stress values for corrosion crevices, pits, and flatter surfaces are acquired for a certain corrosion condition, this could help to control the appearance of rough morphologies by decreasing the load to under the critical value. In addition, as corrosion morphology is acquired under different loads, it could be used to analyze the influence of morphology on the remaining life of the structure, which will be beneficial to the structure’s reliability.
The purpose of this work is to reveal the correspondence between mechanical load and corrosion morphology to understand the critical stress values of corrosion crevices, pits, and flatter surfaces and analyze the influence of corrosion morphologies on the service life of a structure. In order to achieve these goals, this paper simulated the morphology evolution of undulated surfaces under different stresses via a numerical method. Furthermore, the different evolution patterns of the corrosion morphologies are discussed. Then, the influence of the corrosion morphology on the service life of the structure was evaluated.

2. Stress Corrosion Model

2.1. Morphology Evolution

Metallic structures are often faced with air, water, or other kinds of fluids. This work focuses on the influence of corrosive fluids on surface morphology. Although polishing is almost an inevitable process when structures are produced, the machined surface isn’t totally flat on a mesoscopic scale. Figure 1 shows a 3D model of the metal substrate with a rough surface. A 3D Cartesian coordinate system is built at the reference plane. At time t , the surface height can be given as y ( x , z , t ) , which represents the distance between the surface and the reference plane at position ( x , z ) . In a corrosive environment, the material on the surface will always be oxidized and dissolve in the corrosive fluid. The surface height function y ( x , z , t ) will decrease due to dissolution processes over time, with some local areas decreasing faster than others because of the combined effect of the mechanical load and corrosive environment.
Consider that corrosion direction is normal to the surface and inward to the structure; the corrosion rate v is set to point toward the substrate. The relationship between the decreasing rate of the surface height y ˙ ( x , z , t ) and corrosion rate v is as follows [33].
y ˙ ( x , z , t ) = v 1 + | y ( x , y , t ) | 2
where = i / x + j / z , i , and j are the orthonormal vectors. The part in the square root is determined by the current morphology. Therefore, only the corrosion rate v is unknown in Equation (1). Once y ˙ ( x , z , t ) is acquired at any time, the evolution process of the surface morphology can be simulated.

2.2. Corrosion Kinetics

According to E. Gutman’s work, corrosive exposure combined with mechanical loading will cause stress-assisted corrosion [22]. In such cases, the surface material will be ionized and dissolve into the corrosive fluid. Because the driving force of the molecular motion is the chemical potential, the electrochemical potential μ s e of the stressed material is given as [22]
μ s e = μ 0 + R T ln ( a 0 ) + σ m V m + z F φ = μ 0 + R T ln ( a s e )
where μ 0 is standard chemical potential, R is the gas constant, T is the temperature, a 0 is the activity of the reactant, σ m is the mean stress, V m is the molar volume, z is the valence of the reactant, F is Faraday constant, φ represents the electrical potential of the system, and a s e is called mechano-electrochemical activity. Therein, a s e is described as
a s e = a 0 exp ( σ m V m + z F φ R T )
The corrosion process of the metal is always dominated by the electrochemical reaction, which is subject to electrochemical polarization. As the electrical potential changes from an equilibrium state φ e to φ with the variation Δ φ = φ e φ , the change in the electrical potential in the metal is α Δ φ , and the change of the metal ions is β Δ φ , where α and β are transfer coefficients, and α + β = 1 [22]. Therefore, the mechano-electrochemical activity of the stressed metal polarized by the amount of Δ φ is rewritten as
a s e = a 0 exp ( σ m V m + α z F Δ φ R T )
where a corresponds to σ m = 0 and Δ φ = 0 . The mechano-electrochemical activity of the metal ions is expressed as [22]
a ¯ s e = a e exp ( β z F Δ φ R T )
where a e corresponds to Δ φ = 0 .
Because the mass action law is applied to calculate the dissolution flux of the metal substrate, the mass flux J can be given as [22]
J = k 1 i a i k 2 j a j
where k 1 is the constant of the forward reaction rate, i are the indices of the reactants, k 2 is the constant of reverse reaction rate, j are the indices of the reaction products, and a i and a j are the activity of reactants and products, respectively.
It is worth noting that the concentration of the reaction products in the corrosive fluid could influence the reaction rate and activity, with the corrosion process then dominated by the diffusion process of the reaction products. However, when a corrosive fluid is running on the surface, the concentration of the reaction products will become uniform via the flow. Most structures, such as the pipes of heat exchangers, marine gas pipelines, and gas turbines, are faced with such conditions. Furthermore, the flowing fluid can peel off the protective oxide film on the surface, which can expose the fresh metal to the corrosive fluid. For simplicity, we assume the corrosion process only contains the electrochemical dissolution of the pure metal, the reactant is a stressed metal, and the reaction product is the metal ion. Combining Equations (4)–(6), the mass flux of the corroded metal is given as
J = k 1 a s e k 2 a ¯ s e
Then, based on electrochemical theory and Equation (7), the corrosion current density i c o r r is written as
i c o r r = z F J = z F [ k 1 a 0 exp ( σ m V m + α z F Δ φ R T ) k 2 a e exp ( β z F Δ φ R T ) ]
In order to get the stress effect on corrosion velocity, other parameters should be kept as constants; then, Equation (8) is rewritten as
i c o r r = i a exp ( σ m V m R T ) i c
where i a is the anodic current density of unstressed electrode, and i c is the cathodic current density of reverse reaction. This equation gives the net current of the corrosion system. However, the reverse reaction means the reduction of the metal ions, which is quite rare during the corrosion process. As a consequence, k 2 is much smaller than k 1 , which makes the cathodic current density i c almost have no influence on corrosion current density i c o r r . Thus, we rewrite Equation (8) as
i c o r r = i a exp ( σ m V R T )
Combined with the Faraday’s law, the corrosion rate of the metal surface is given as
v = M z F ρ i c o r r = i a M z F ρ exp ( σ m V R T )
where M is the molar mass, and ρ is the density of the reactant. If the stress state is the only variable during the corrosion process, the corrosion rate is a function of the mean stress. When the mean stress is positive, the corrosion rate will become larger than that of the unstressed state. On the contrary, the compressive stress will decrease the corrosion rate, and Equation (11) shows that the corrosion rate v is of exponential dependence on the mean stress σ m . The stress corrosion model built with such an exponential relationship is widely used [3,34,35], and is based on the electrochemical theory. However, there are other kinds of corrosion models based on experiments, among which the linear model is widely used for kinds of metals [1,36,37]. Thus, the first-order Taylor series expansion without high-order terms is used for Equation (11), and the linear relationship between corrosion rate v and mean stress σ m is as follows
v = f ( σ m ) = f ( 0 ) + f ( 0 ) σ m = v 0 + k c σ m
where v 0 is the initial corrosion rate of the unstressed material, k c is the constant depended on the corrosion system. According to Vasudevan’s work, the corrosion rate is strongly dependent under tensile stress while weakly dependent under compressive stress [37]. The Equation (12) is rewritten as
v = v 0   at   σ m = 0
v = v 0 + a σ m   at   σ m > 0
v = v 0 + b σ m   at   σ m < 0
where the coefficients of the corrosion rate a and b can be experimentally determined, which depend on the material-medium systems, and tensile slope a could be 10 times higher than compressive slope b . This linear model could coincide with Vasudevan’s experiment and represents the tension-compression asymmetry of the material, which is in accord with the mesoscopic properties. It is noteworthy that the stress level should be in the elastic region to meet the safety design of the structures. Thus, the stress will not exceed the yield stress [37].

2.3. Mechanical Governing Equations

The stresses are assumed to be within the elastic region. Thus, with the assumption of small deformation, the constitutive equations are given as
ε x = 1 E [ σ x ν ( σ y + σ z ) ] , τ x y = 2 ( 1 + ν ) E γ x y ε y = 1 E [ σ y ν ( σ x + σ z ) ] , τ y z = 2 ( 1 + ν ) E γ y z ε z = 1 E [ σ z ν ( σ x + σ y ) ] , τ z x = 2 ( 1 + ν ) E γ z x
where E is the elastic modulus, ν is the Poisson’s ratio, ε x , ε y , ε z , γ x y , γ y z and γ z x are the strain components, σ x , σ y , σ z , τ x y , τ y z and τ z x are the stress components, and the equilibrium equations are given as
σ x x + τ x y y + τ x z z = 0 σ y y + τ x y x + τ y z z = 0 σ z z + τ z x x + τ y z y = 0
When combining the boundary conditions, the stress state can be acquired by the finite element method (FEM), and the mean stress are
σ m = σ x + σ y + σ z 3
On the basis of stress corrosion kinetics, the corrosion velocity, which is normal and inward to the surface can, be calculated by the mean stress.

3. Numerical Method

The evolving process of the surface morphology can be regarded as a typical moving boundary problem, in which the reconstruction of the geometry is combined with quasistatic stress equilibrium. So, the geometry remeshing, together with the finite element method, is used to simulate the corrosion process. However, as the surface profile changes during the corrosion, the profile function F ( x , y , z ) = 0 will vary with time, and it is almost impossible to get the mapping relationship between F ( x , y , z ) = 0 and time t . Thus, the surface profile is discretized into the surface nodes to capture the surface movement. In this case, the morphology evolution is tracked by the movement of the surface nodes.
For most of the arbitrary surface morphologies, there is no explicit function to illustrate the surface profile. In order to construct the geometric model in the FEM, the surface profile should be discretized into a group of surface nodes and their positions recorded ( x i , y i , z i ) . Atomic force microscope (AFM) and scanning electron microscopy (SEM) can be used to record the surface node positions by scanning the surface on the sample [9,38]. For certain regular surfaces for which the initial profile function F ( x , y , z ) = 0 is known, the sampling can be achieved by recording a series of nodes ( x i , y i , z i ) which meet the condition F ( x i , y i , z i ) = 0 . It is worth noting that the density of the sampling points should be increased where the curvature is large in order to avoid distortion. As a result, the surface profile can be represented by a series of discrete nodes.
Then the surface nodes are used for interpolation to construct the surface. There are lots of interpolation methods, such as linear interpolation, cubic interpolation, and spline interpolation. In order to get the normal vectors, the first-order partial derivative of the profile function must be continuous along the surface. Thus, the biquadratic spline interpolation is selected (continuity of the second-order partial derivative is not required). For biquadratic spline interpolation, the first step is to mesh the surface by the surface nodes, and the rectangle mesh is used as a sample. As shown in Figure 2, the surface nodes are described as P i j ( x i j , y i j , z i j ) , i , j = 1 , 2 , 3 ( x i j , y i j , and z i j represent the coordinates of the node on x , y , and z axis), then four rectangles R k l ( k , l = 1 , 2 ) are formed. For each rectangle, a complete quadratic function is used to interpolate the surface, as follows:
F k l ( x , y , z ) = z ( x 2 x 1 ) ( a 11 a 12 a 13 a 21 a 22 a 23 a 31 a 32 a 33 ) ( y 2 y 1 )
where F k l ( x , y , z ) is the profile function for rectangles R k l ( k , l = 1 , 2 ) , and matrix ( a m n ) are nine undetermined coefficients. For this sample, there are 9 × 4 = 36 coefficients to be determined. First of all, each rectangle R k l ( k , l = 1 , 2 ) has four nodes P i j ( i = k , k + 1 ; j = l , l + 1 ) that must meet F k l ( x i j , y i j , z i j ) = 0 ; then, the 4 × 4 = 16 equations can be established for all the rectangles. As the first-order partial derivative is continuous, the first partial derivative of the nodes which are on the boundaries of two rectangles must be continuous, as follows:
F k l ( x k , l + 1 , y k , l + 1 , z k , l + 1 ) x = F k , l + 1 ( x k , l + 1 , y k , l + 1 , z k , l + 1 ) x , ( k = 1 , 2 ; l = 1 ) F k l ( x k + 1 , l + 1 , y k + 1 , l + 1 , z k + 1 , l + 1 ) x = F k , l + 1 ( x k + 1 , l + 1 , y k + 1 , l + 1 , z k + 1 , l + 1 ) x , ( k = 1 , 2 ; l = 1 ) F k l ( x k + 1 , l , y k + 1 , l , z k + 1 , l ) y = F k + 1 , l ( x k + 1 , l , y k + 1 , l , z k + 1 , l ) y , ( k = 1 ; l = 1 , 2 ) F k l ( x k + 1 , l + 1 , y k + 1 , l + 1 , z k + 1 , l + 1 ) y = F k + 1 , l ( x k + 1 , l + 1 , y k + 1 , l + 1 , z k + 1 , l + 1 ) y , ( k = 1 ; l = 1 , 2 )
Based on Equation (20), the other 8 equations could be formed. As for the 8 boundary nodes P i j ( i 2   when   j = 2 ) , the boundary condition is as follows:
2 F k l ( x i j , y i j , z i j ) x y = 0 , ( k , l = 1 , 2 ;   i 2   when   j = 2 )
This boundary condition can give the other 12 equations. In the end, all the undetermined coefficients can be acquired by the solution of the equation set. In this way, the profile function F ( x , y , z ) = 0 can be acquired at each rectangular region of interpolation. For a real surface sampling, much more surface nodes would be created, and the mesh geometries may not be rectangles anymore. For this case, other methods have been established to construct the equation set, like Equations (20) and (21); then, the profile function can be acquired by solving the equation set [39].
As the surface profile function is acquired, the geometric model can be established for the FEM. According to the classic theory for the FEM [40], the stress state can be acquired by Equations (16) and (17) and the boundary conditions. It is worth noting that interpolation transforms the discrete nodes into a continuous surface, but meshing is used for the geometric model in the FEM; therefore, the surface nodes are given as the mesh nodes on the surface at the end. At time t, the distribution of stress along the surface is provided by the FEM; then, the corrosion rate can be calculated by Equations (13)–(15), and the normal vector n i ( n x i , n y i , n z i ) of each surface nodes is calculated by
n x i = F ( x i , y i , z i ) x n y i = F ( x i , y i , z i ) y n z i = F ( x i , y i , z i ) z
where n x i , n y i , and n z i are the normal vector components along the x , y , and z axis of i t h surface node. ( x i , y i , z i ) is the position of i t h surface node.
When combined with the normal vectors calculated by Equation (22) along the surface, the new position of the surface nodes after the time interval Δ t is calculated by
x i ( t + Δ t ) = x i ( t ) + v i n x i Δ t ( n x i ) 2 + ( n y i ) 2 + ( n z i ) 2
y i ( t + Δ t ) = y i ( t ) + v i n y i Δ t ( n x i ) 2 + ( n y i ) 2 + ( n z i ) 2
z i ( t + Δ t ) = z i ( t ) + v i n z i Δ t ( n x i ) 2 + ( n y i ) 2 + ( n z i ) 2
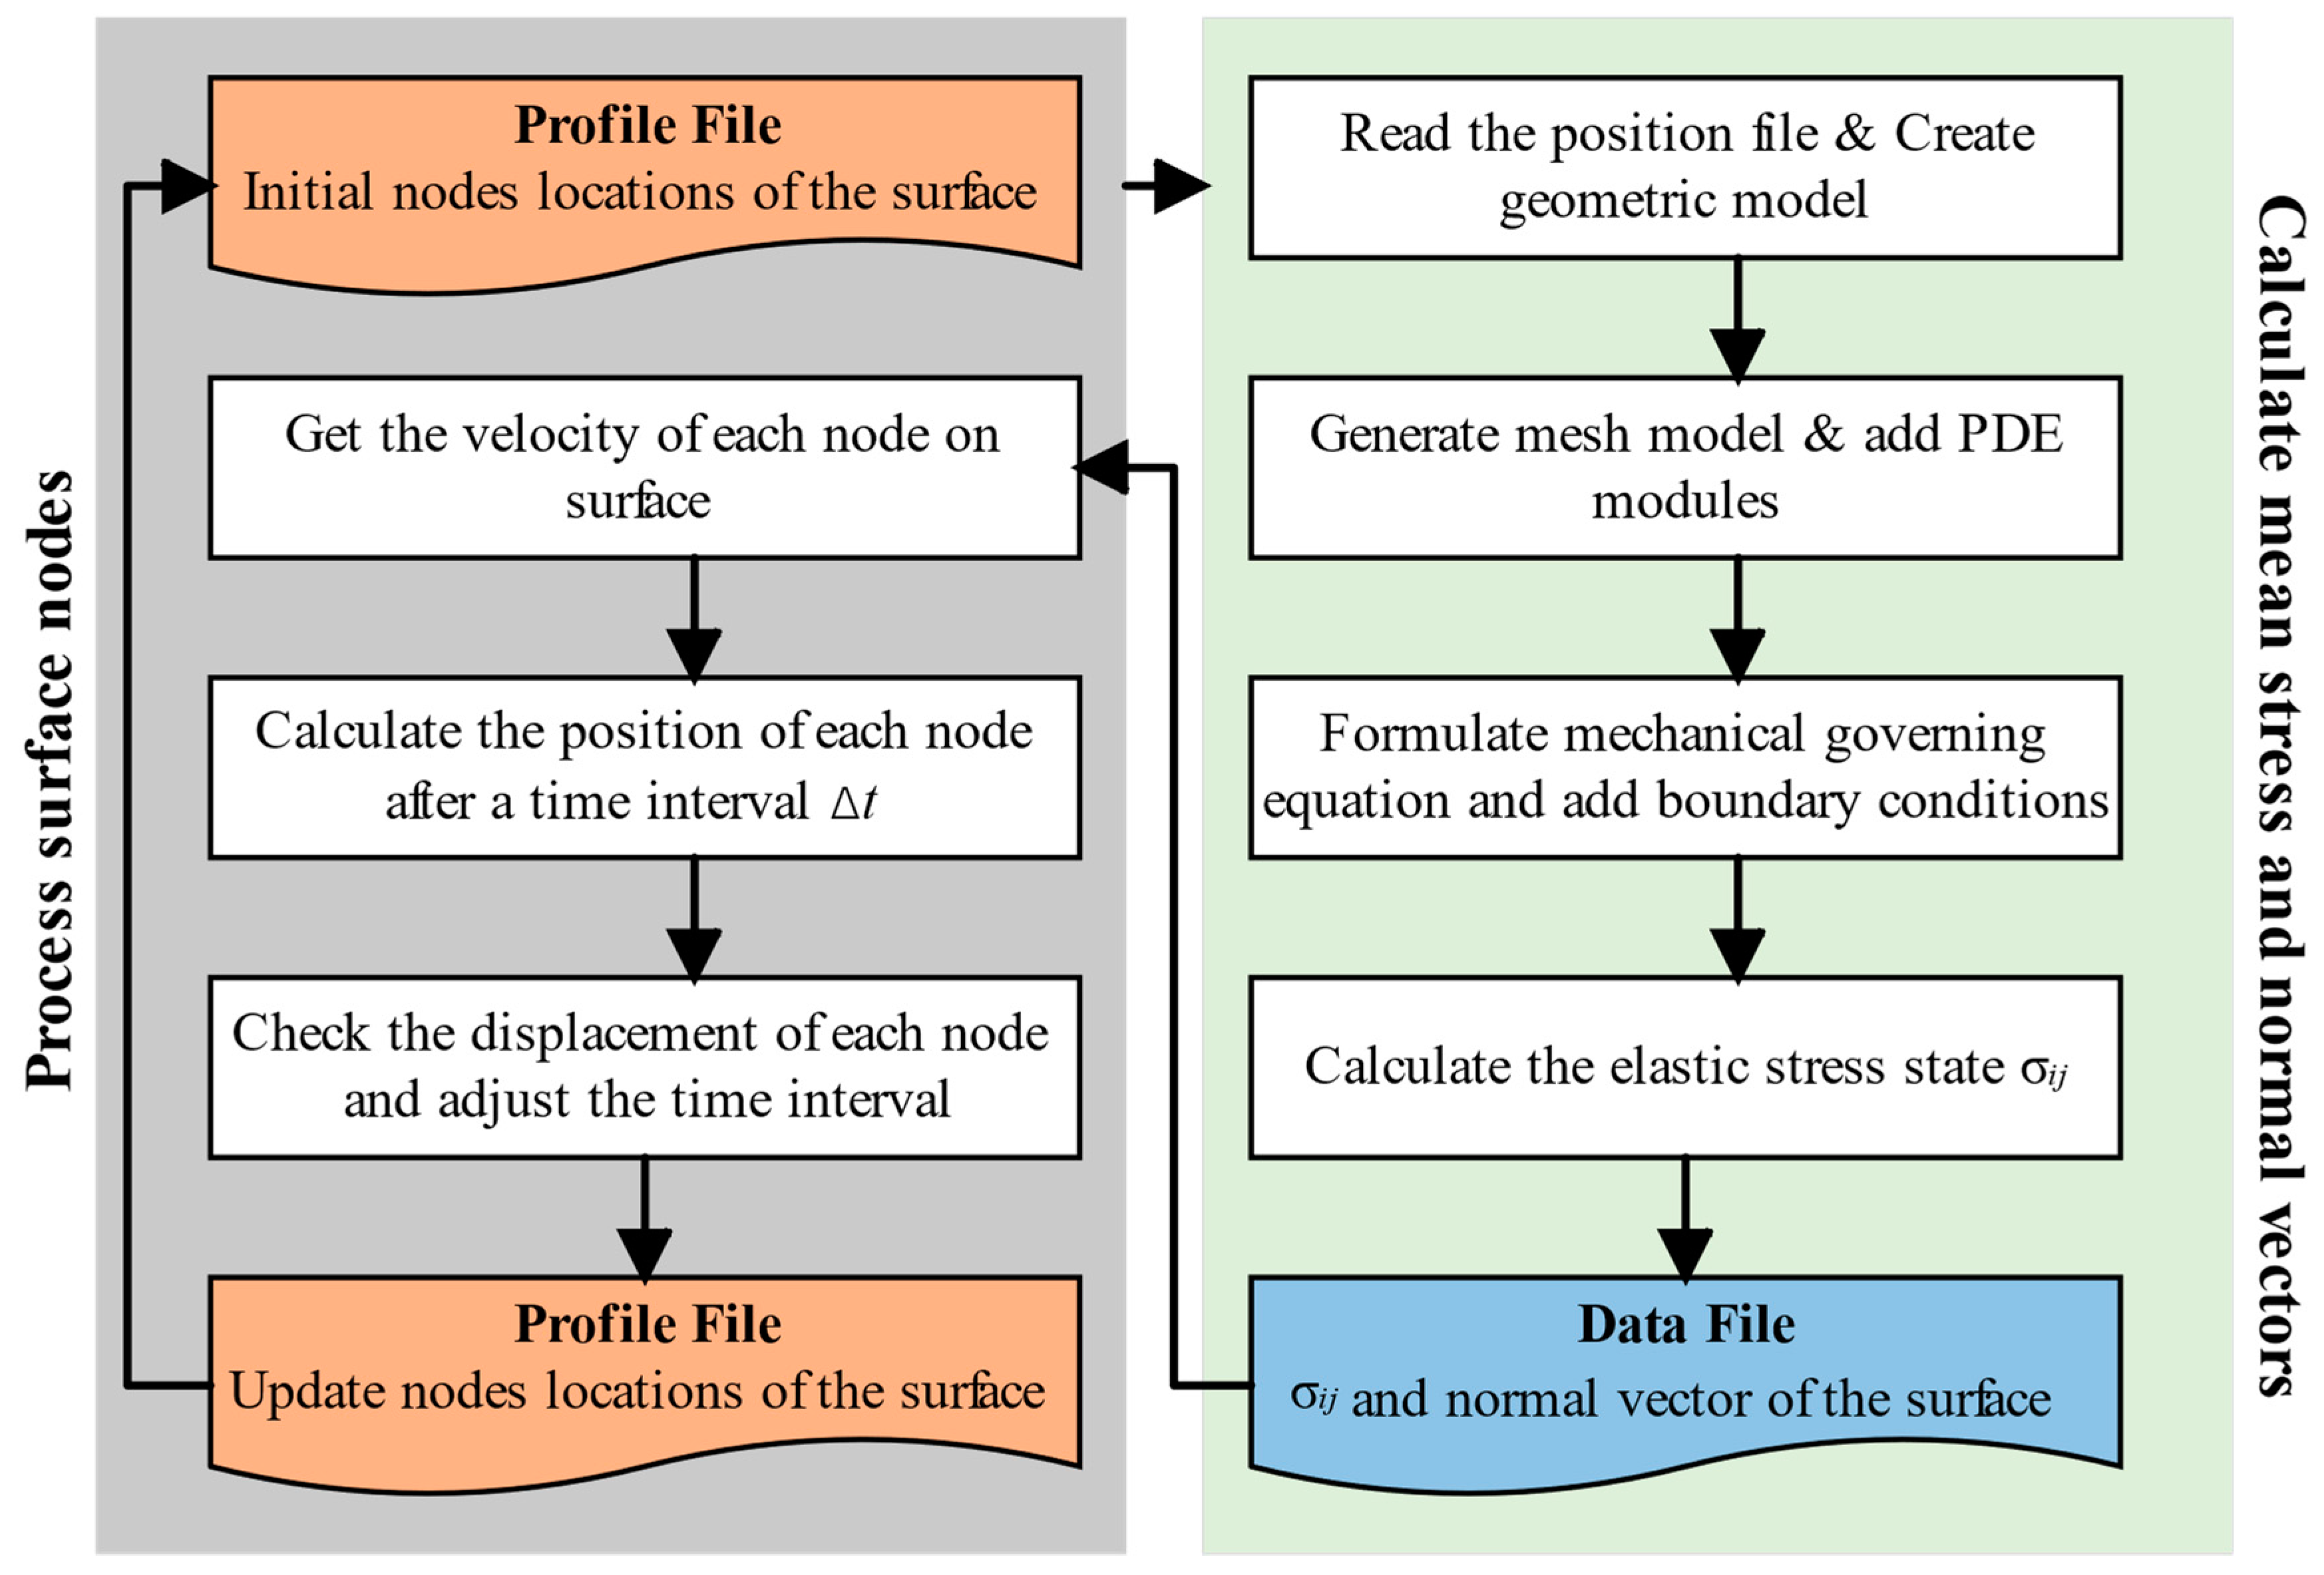
where x i ( t ) , y i ( t ) , and z i ( t ) define the position of i t h surface node as a function of time t , Δ t is the time interval, and v i is the corrosion rate of i t h surface node. Then, the new positions of the surface nodes after the movement are located, and the new surface profile can be captured. The movement of the surface nodes represents the evolution of the surface morphology because of dissolution corrosion, which is achieved by surface tracking and geometry remeshing. With this method, the evolution process of the surface morphology could be simulated by repeating the procedure mentioned above, which is shown in Figure 3.
In the finite element method, the surface moving is represented by position changes in the surface nodes. In order to avoid that corrosion depth of the surface from being overlarge due to the stress concentration, which will eventually result in a numerical problem, the time interval Δ t is limited by a maximum corrosion depth in each computational step [41]. The maximum corrosion depth used in this study is a half that of the side length of the smallest element.
This evolution process creates plenty of new surfaces, and the mesh has to be totally rearranged at every time increment. In order to capture the change in morphology, interpolation is used to form the surface profile by the nodes. As the morphology of the surface is constructed, meshing will be employed for the body geometry. Thus, the finite element formulation is prepared to obtain the stress state. After that, the stress state and the normal vectors of the surface nodes (at present) will be used to update the surface profile after a tiny time interval: Δ t . In this way, the surface evolution process can be simulated by repeating this procedure. In this paper, MATLAB software was employed to preprocess the data, and COMSOL was used to carry out the FEM. The workflow chart of the numerical simulation is shown in Figure 4, and the detailed description is as follows:
(1)
Generate the initial positions of the surface nodes at the beginning of the corrosion;
(2)
Construct the surface by interpolation, then generate a mesh model and calculate the stress state via the FEM;
(3)
Outputs the elastic stress state and normal vector of each surface element in a data file;
(4)
Calculates the velocity of each surface nodal point by Equations (13)–(15). Then, the new position information of each node after Δt is obtained by Equations (23)–(25);
(5)
Checks the corrosion depth of each node and adjusts the time interval Δt when the maximum of the depths exceeds the critical length. Then, it stores the new surface nodes and updates the positions of the surface nodes;
(6)
Go back to step (2) and repeat.
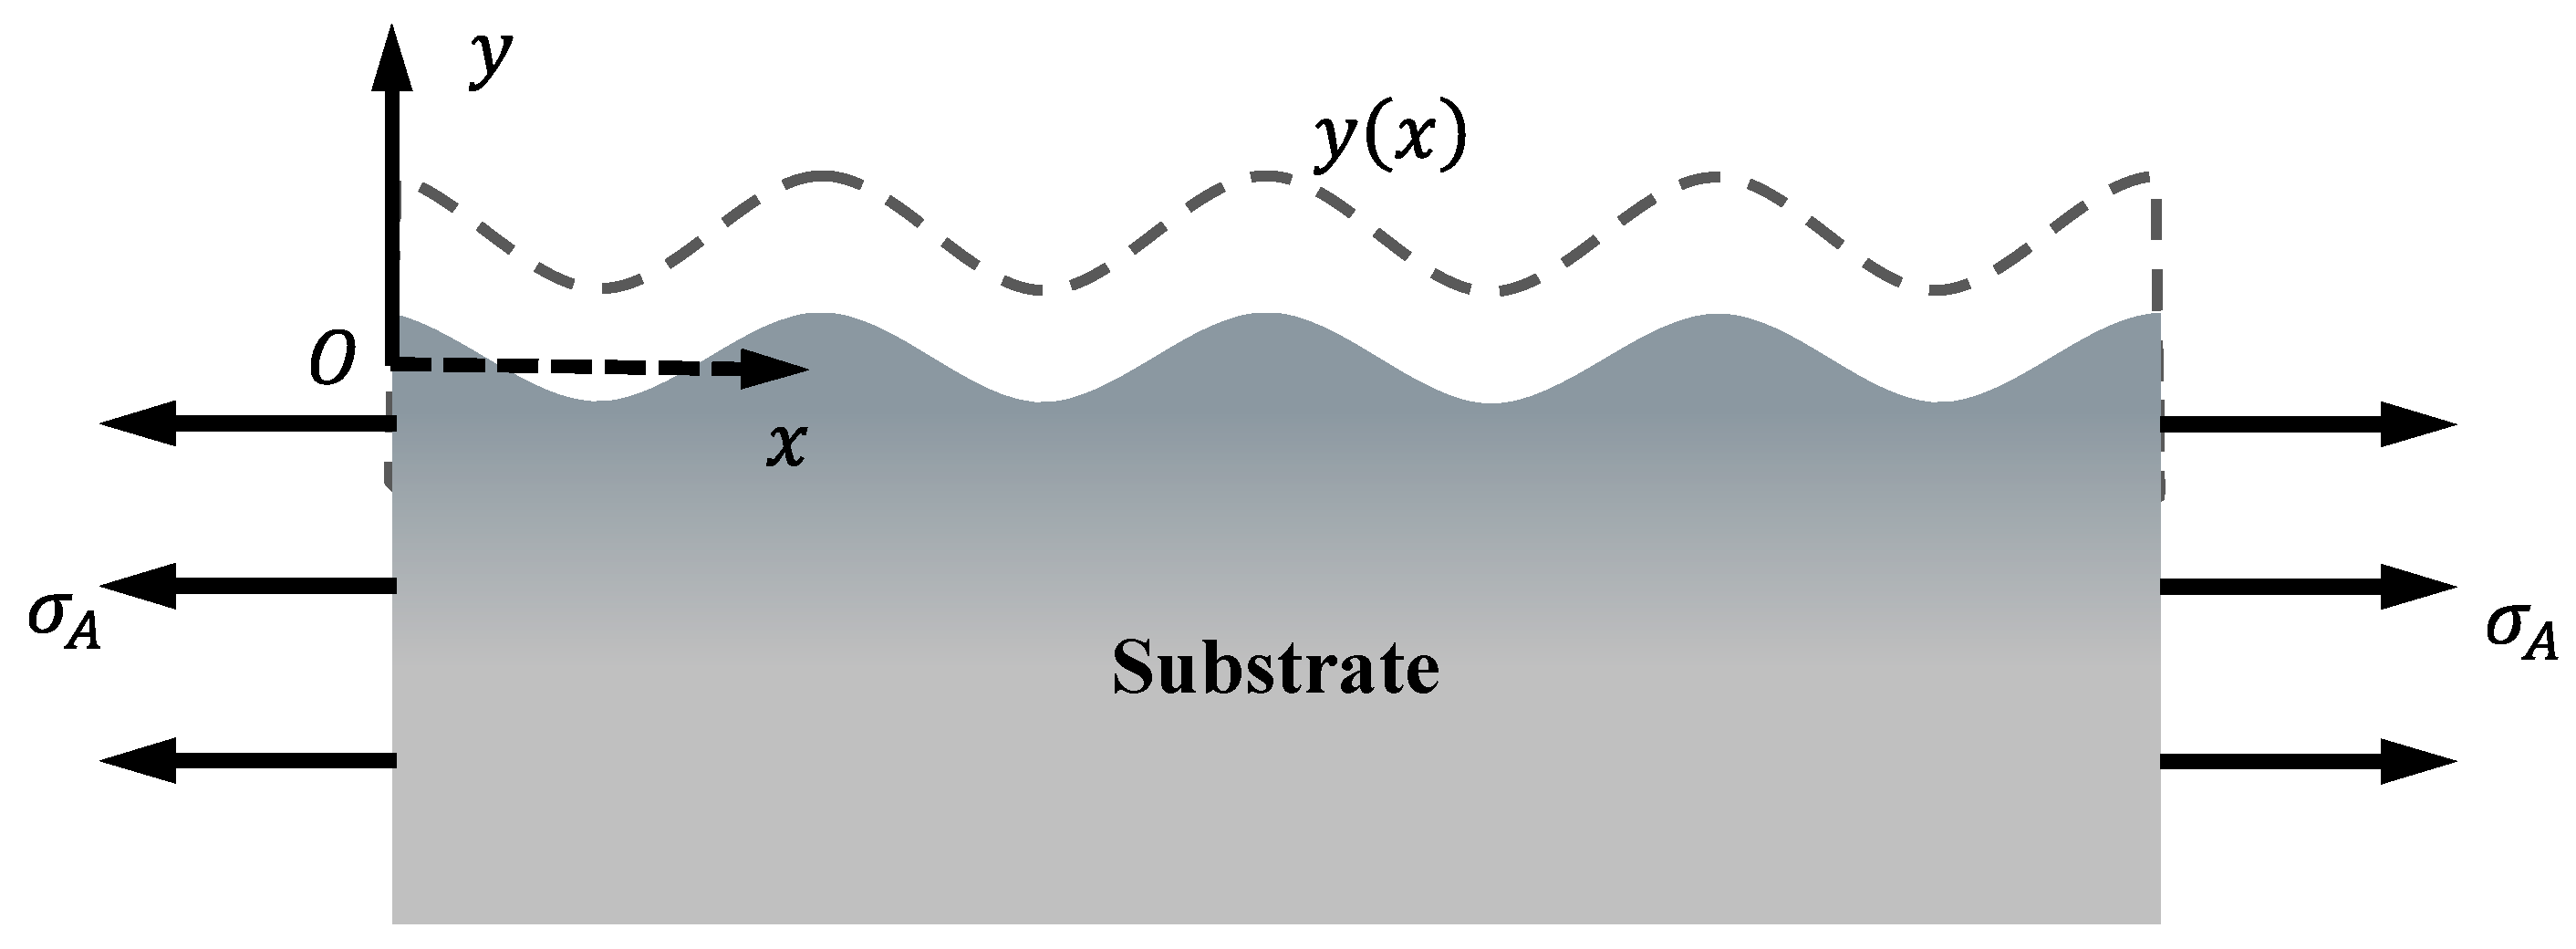
In this paper, a 2D corrosion problem is investigated. Consider a semi-infinite elastic body with a slightly undulated surface under a tensile load. The surface morphology can be regarded as a sinusoidal wave, which is shown in Figure 5. So, the profile of the rough surface, y ( x ) , is described as
y ( x ) = A cos ( 2 π x λ )
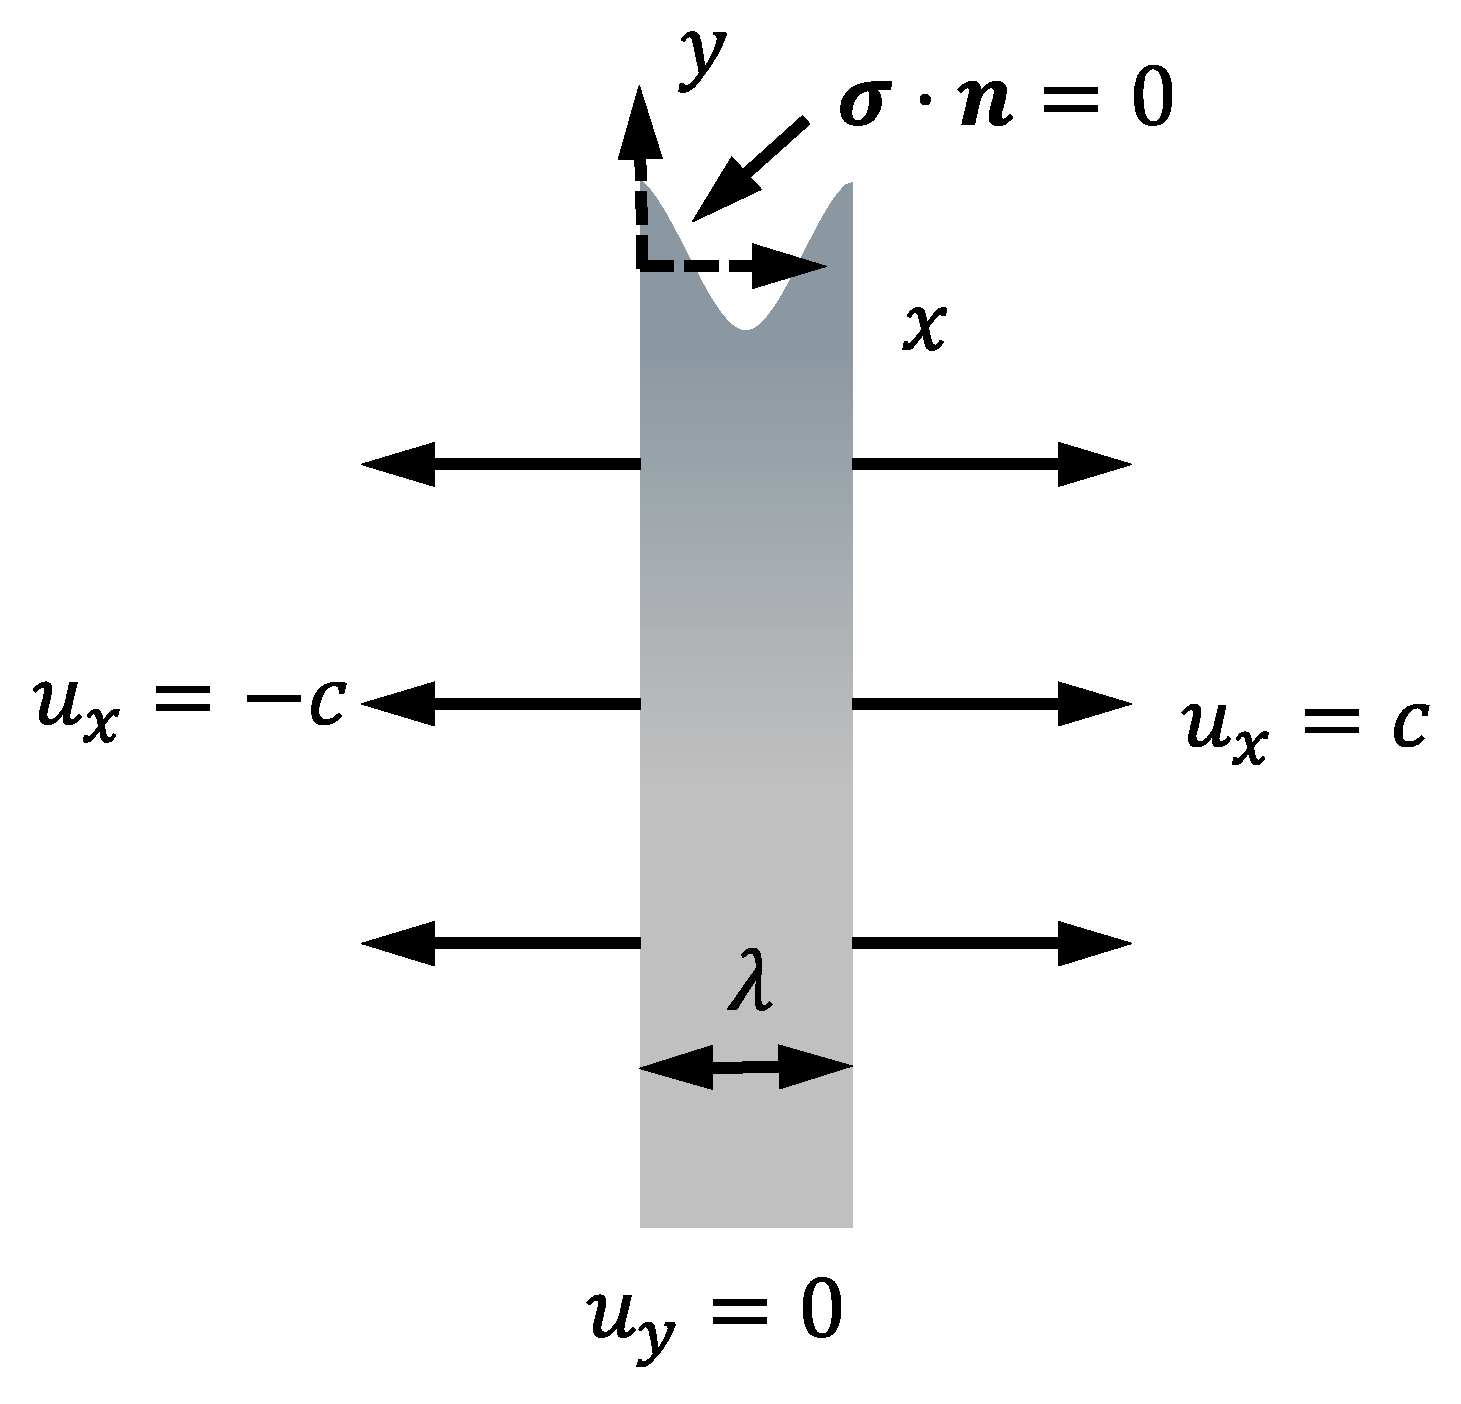
where A is the amplitude and λ is the wavelength. Thus, the change in amplitude A with time t could represent the surface morphology evolution under corrosion. When A / λ 1 , the analytical solution of the stress state of the semi-infinite elastic body with a sinusoidal surface is accessible. However, as the corrosion progresses, the surface is not a sinusoidal wave anymore. So, the analytical solution is not acquirable [41,42]. The numerical solution is another way to simulate the evolution of the surface by FEM combined with a moving boundary strategy.
According to the periodicity of the surface, the stress state and the evolution of the surface are the periodicities along the x-direction. The model region within a wavelength is selected, as shown in Figure 6. Because the stress state is gradually becoming invariant as the depth from the surface increases, the bottom boundary of the geometric model is set at y = y min 10 λ , where y min is the ordinate of the lowest point on the surface. The vertical displacement u y is given as zero at the bottom boundary. For the left and the right boundaries, a uniform displacement c of the horizontal direction is fixed. This displacement is converted by the applied stress σ A in order to keep the boundaries vertical, which is given as c = σ A λ / 2 E . When considering that the pressure on the surface is quite low compared to the applied load, we assume that the surface is traction free.
Within the assumption of small deformation and plane strain state, the constitutive equations are given as
σ x = E ( 1 ν ) ( 1 + ν ) ( 1 2 ν ) [ ε x + ν ( 1 ν ) ε y ] σ y = E ( 1 ν ) ( 1 + ν ) ( 1 2 ν ) [ ε y + ν ( 1 ν ) ε x ] σ z = E ν ( 1 + ν ) ( 1 2 ν ) [ ε x + ε y ] τ x y = E 2 ( 1 + ν ) γ x y
According to the plane strain state, the equilibrium equations are as follows:
σ x x + τ x y y = 0 σ y y + τ x y x = 0
When combining the boundary conditions, the stress state can be acquired by FEM. The evolution of the surface morphology can be simulated by the method mentioned above.
In order to simplify the calculation procedure, the normalized coordinate system and time are used as
x * = x / λ
y * = y / λ
t * = t v 0 / λ
where x * and y * are the normalized coordinates, and t * is the normalized time. By this transformation, the surface profile (Equation (26)) is rewritten as
y * = A * cos ( 2 π x * )
where A * = A / λ is defined as the morphology factor, which represents the fluctuating degree of the initial surface. In the original coordinate system, the corrosion depth u c at any time interval is given as
u c = v Δ t
When combining Equations (1)–(3) and (31), the normalized corrosion depth u c * is given as
u c * = u c / λ = v * Δ t * = { Δ t * σ m = 0 ( 1 + a σ m / v 0 ) Δ t * σ m > 0 ( 1 + b σ m / v 0 ) Δ t * σ m < 0
where v * is the normalized corrosion rate. Because of the normalization, the geometry model is simplified within the region 0 x * 1 , which can save the cost of the calculation when the wavelength λ is quite large.
In this paper, 2D interpolation is used to form the surface curve, and a triangular mesh is employed in the FEM. In this way, the movement of the surface nodes can be calculated by Equations (22)–(25) (ignoring the components of the z axis). In order to improve the surface-tracking accuracy, the elements distributed on the surface should be quite tiny, and the biggest size of the surface elements was set as 0.001 in this work. As a result, the time interval Δ t * should be reduced when the corrosion depth u r * exceeds 0.0005 . Based on Vasudevan’s experiment [37], a / v 0 is taken as 2 × 10 8 , and b / a is taken as 0.1 in this paper. As the load on the boundaries are the displacement boundary conditions converted by the stress boundary condition, the stress state is not related to the elastic modulus E . Furthermore, we set the passion ratio as ν = 0.29 and the modulus as E = 200 GPa in this paper.
With this method, the evolution processes of the surface morphology were simulated with different initial morphology factors A * and applied stresses σ A . The simulation procedure is shown in Figure 7.

4. Simulation Results and Discussions

In this section, the evolution patterns of the surface morphology are discussed. Although corrosion crevices and pits are common corrosion morphologies, there are no specific criteria to distinguish them by their geometric shapes. Thus, two parameters: surface roughness and the stress concentration factor, were used to differentiate them. As surface morphology evolves due to stress-assisted corrosion, the surface roughness R a and the stress concentration factor (SCF) K T change simultaneously [10,30,41]. Both R a and K T are related to surface morphology, but they represent the different characters of the surface. R a represents the degree of the undulations of the surface, and the formula for our model can be written as
R a = 0 1 | y * y m * | d x *
where y m * is the vertical coordinate of the midcourt line of the surface profile. The midcourt line is a horizontal line; the enclosed area between midcourt line and the surface profile is divided equally into the upper half and lower half by the midcourt line. The stress concentration factor can be calculated by
K T = σ m σ m f l a t
where σ m is the mean stress along the surface, and σ m f l a t is the mean stress on the condition that the surface is flat and under the same applied stress. K T represents the degree of the stress concentration, and K T > 1 means that local stress is larger than the applied stress because of the surface morphology. Because corrosion velocity is accelerated by the mean stress, K T also represents the degree of the localized corrosion acceleration due to the surface undulations. A bigger K T will induce more severe corrosion acceleration in local areas, which reduces the service life of the structures in the corrosion environment. However, those morphologies with the same roughness do not always have the same stress concentrations because the sharpness of the stress concentration area is always different. Generally, R a and K T can represent the degree of the undulations and the smoothness of the surface morphology, which are employed to prescribe the criteria for the evolution patterns of the surface morphology.
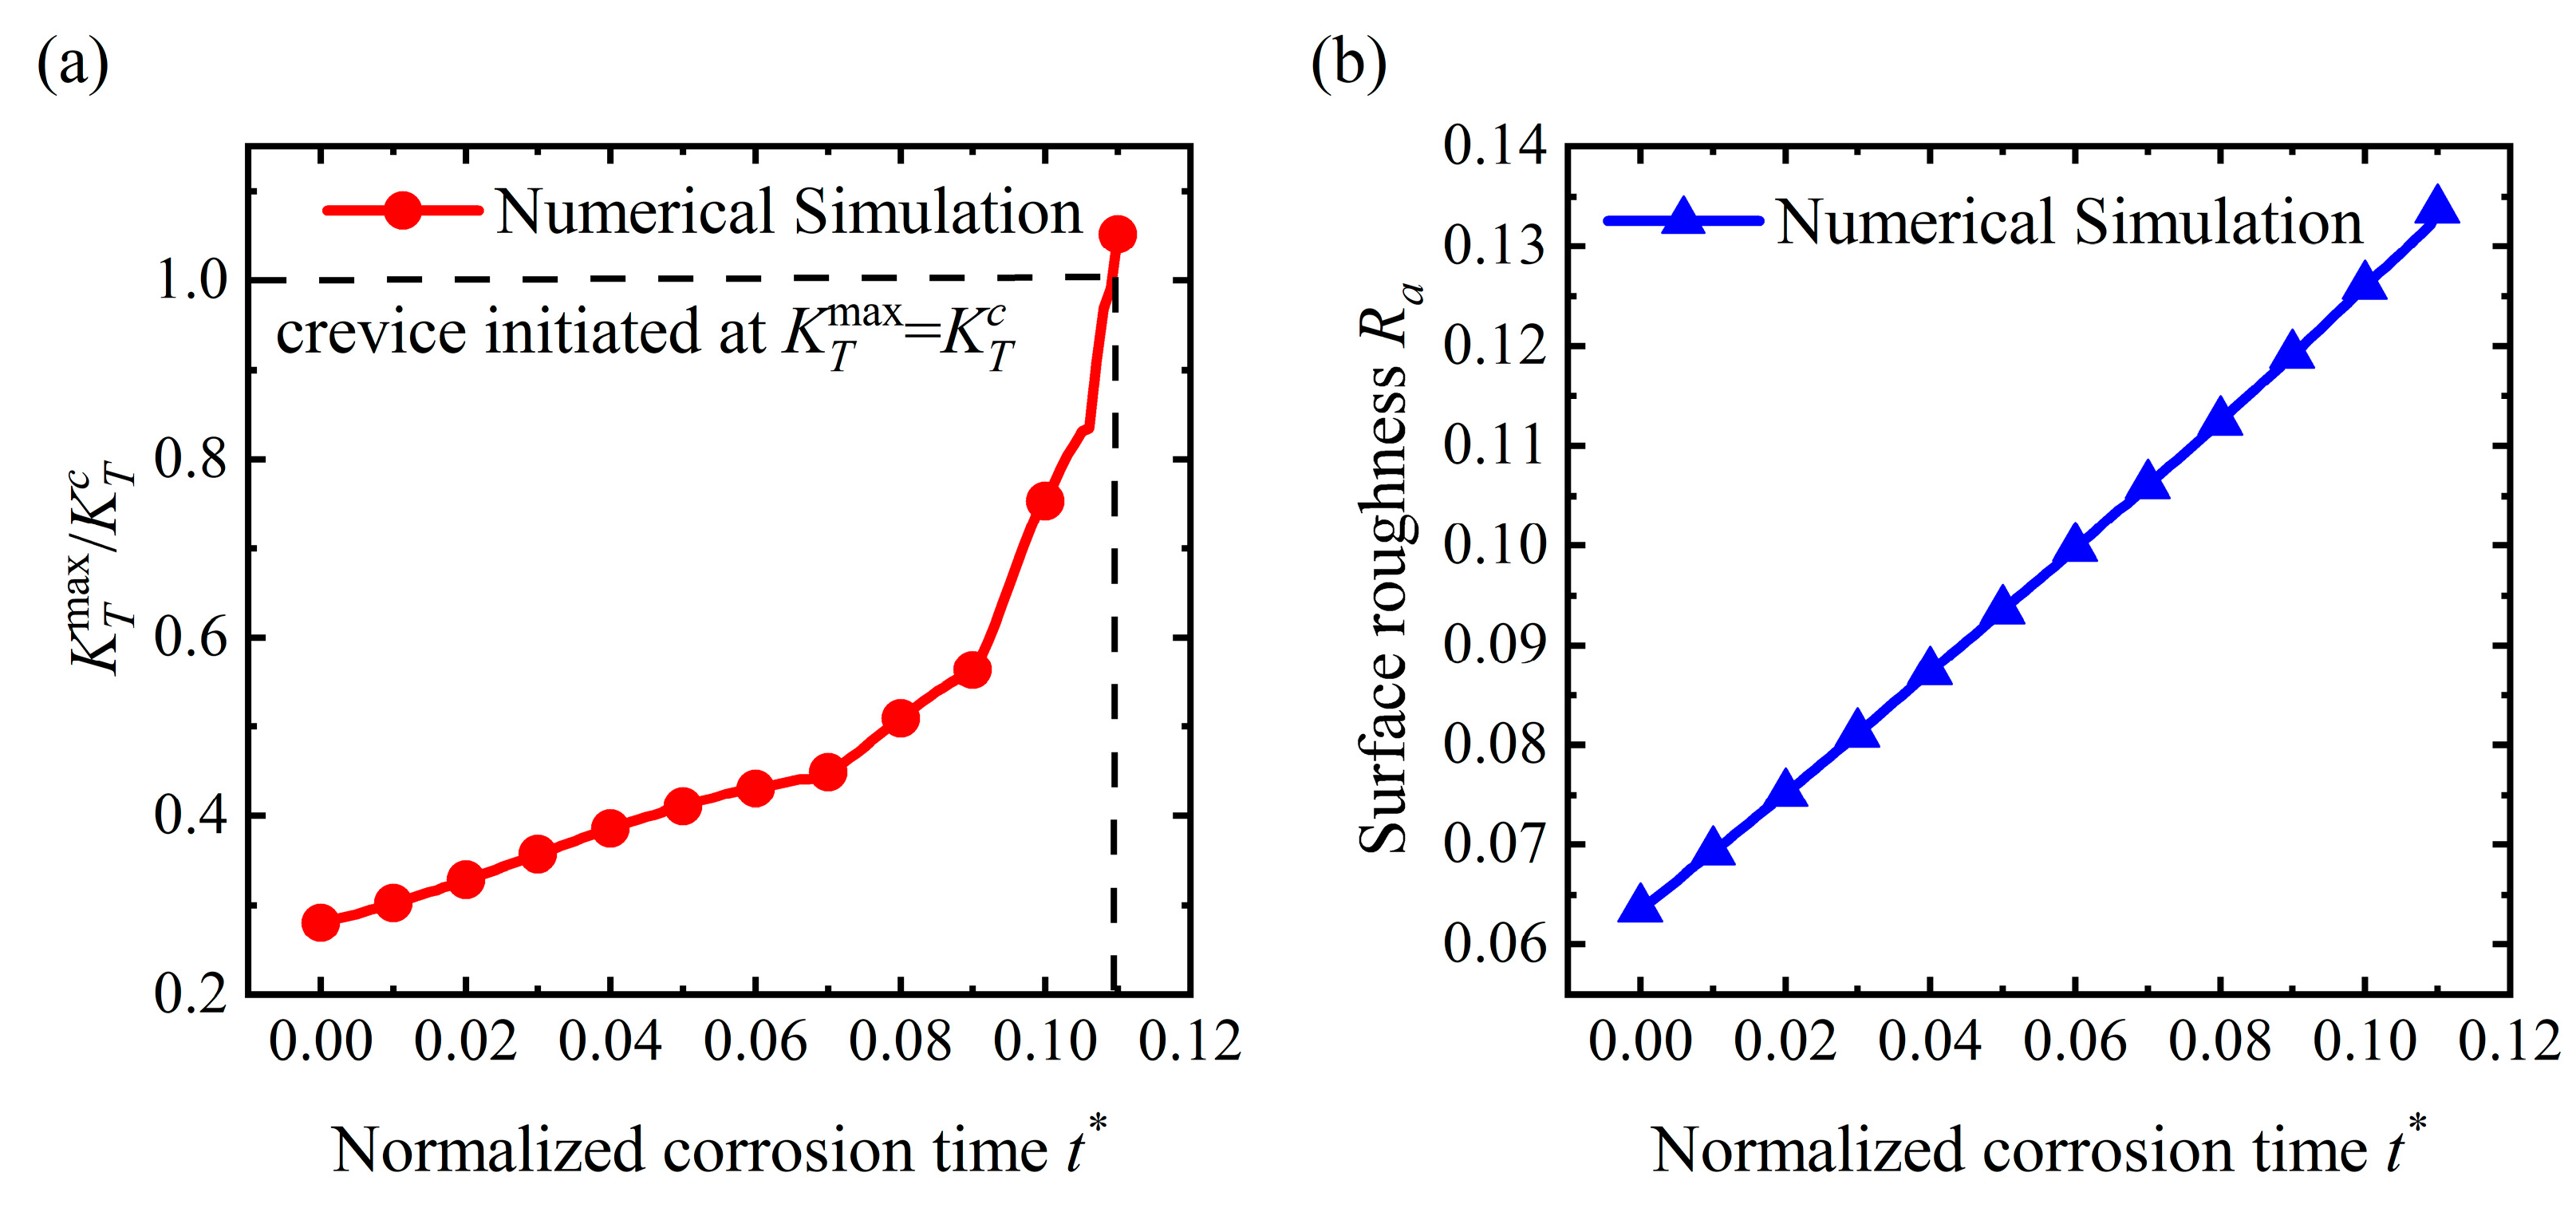
Due to the undulation of the surface, the initial surface roughness R a 0 > 0 and the stress concentration factor K T 0 > 1 at the beginning of the corrosion process. R a and K T are changing as the morphology evolution proceeding. Therefore, the evolution patterns are distinguished by the variations in R a and K T . If K T is quite large in some area, it means that the local stress is much higher than the applied stress, which could cause severe localized corrosion acceleration. This severe stress concentration always occurs when a crevice generates on the surface, which will lead to a dangerous form of corrosion: crevice corrosion. Under crevice corrosion, the corrosion rate of the crevice front is greatly accelerated [26], and the service life of the structure will decrease seriously. However, stress corrosion theory is not suitable for this situation, and crevice propagation does not concern this paper. Thus, we assume that crevices will initiate when the maximal SCF K T max exceeds a critical value, K T c , which can be determined by the experiment ( K T c = 8 is taken in this work). Therefore, K T max K T c is taken as the criteria for crevice initiation. If no crevice is generated during the corrosion process, the evolution of the morphology will come to a steady state at the end [43]. At a steady state, the surface morphology is corroded uniformly in the vertical direction, with an unchanged geometrical shape. In this case, R a , K T max , and the vertical corrosion velocity vy will remain invariant in the steady state. Apart from the crevice initiation pattern, the rest of the evolution patterns are also divided into two types based on the value of R a in the steady state. If R a > R a 0 , it means the surface becomes rougher than the initial morphology, and we regard this as a result of the pits formed on the surface. On the contrary, the surface becomes flatter when R a < R a 0 . Based on these criteria, the evolution patterns of the surface morphology are classified into three types:
  • Crevice pattern: K T max K T c
  • Pit pattern: K T max < K T c and R a > R a 0
  • Flattening pattern: K T max < K T c and R a < R a 0

4.1. Crevice Pattern

Figure 8a shows the surface profile at different time t * as A * = 0.1 and σ A = 100   MPa . As the tensile stress accelerates the corrosion rate, corrosion velocity is distributed unevenly on the surface. The stress is concentrated in the valley of the surface; thus, the corrosion velocity of this area is larger than the others, as shown in Figure 8b. When the applied stress is large, the difference in the corrosion rate between the valley and the peak becomes quite huge. Then, the degree of the undulations increases, which could lead to a bigger difference in the corrosion rate. Under such a mechanism, the surface becomes more undulating and generates a tiny pit at the valley. As shown in Figure 8b, the stress is mainly concentrated in the pit area, which leads to a huge increase in the corrosion rate when the corrosion rate of other areas almost equals the unstressed state. As the pit extends and becomes narrow, the maximal SCF K T max finally exceeds the critical value, which is shown in Figure 9a. In this case, the pit turns into a crevice. The change in roughness during the corrosion process is shown in Figure 9b. It shows that surface roughness increases during the corrosion process. Although a rougher surface is created in this pattern, the crevice is more dangerous to the structure.
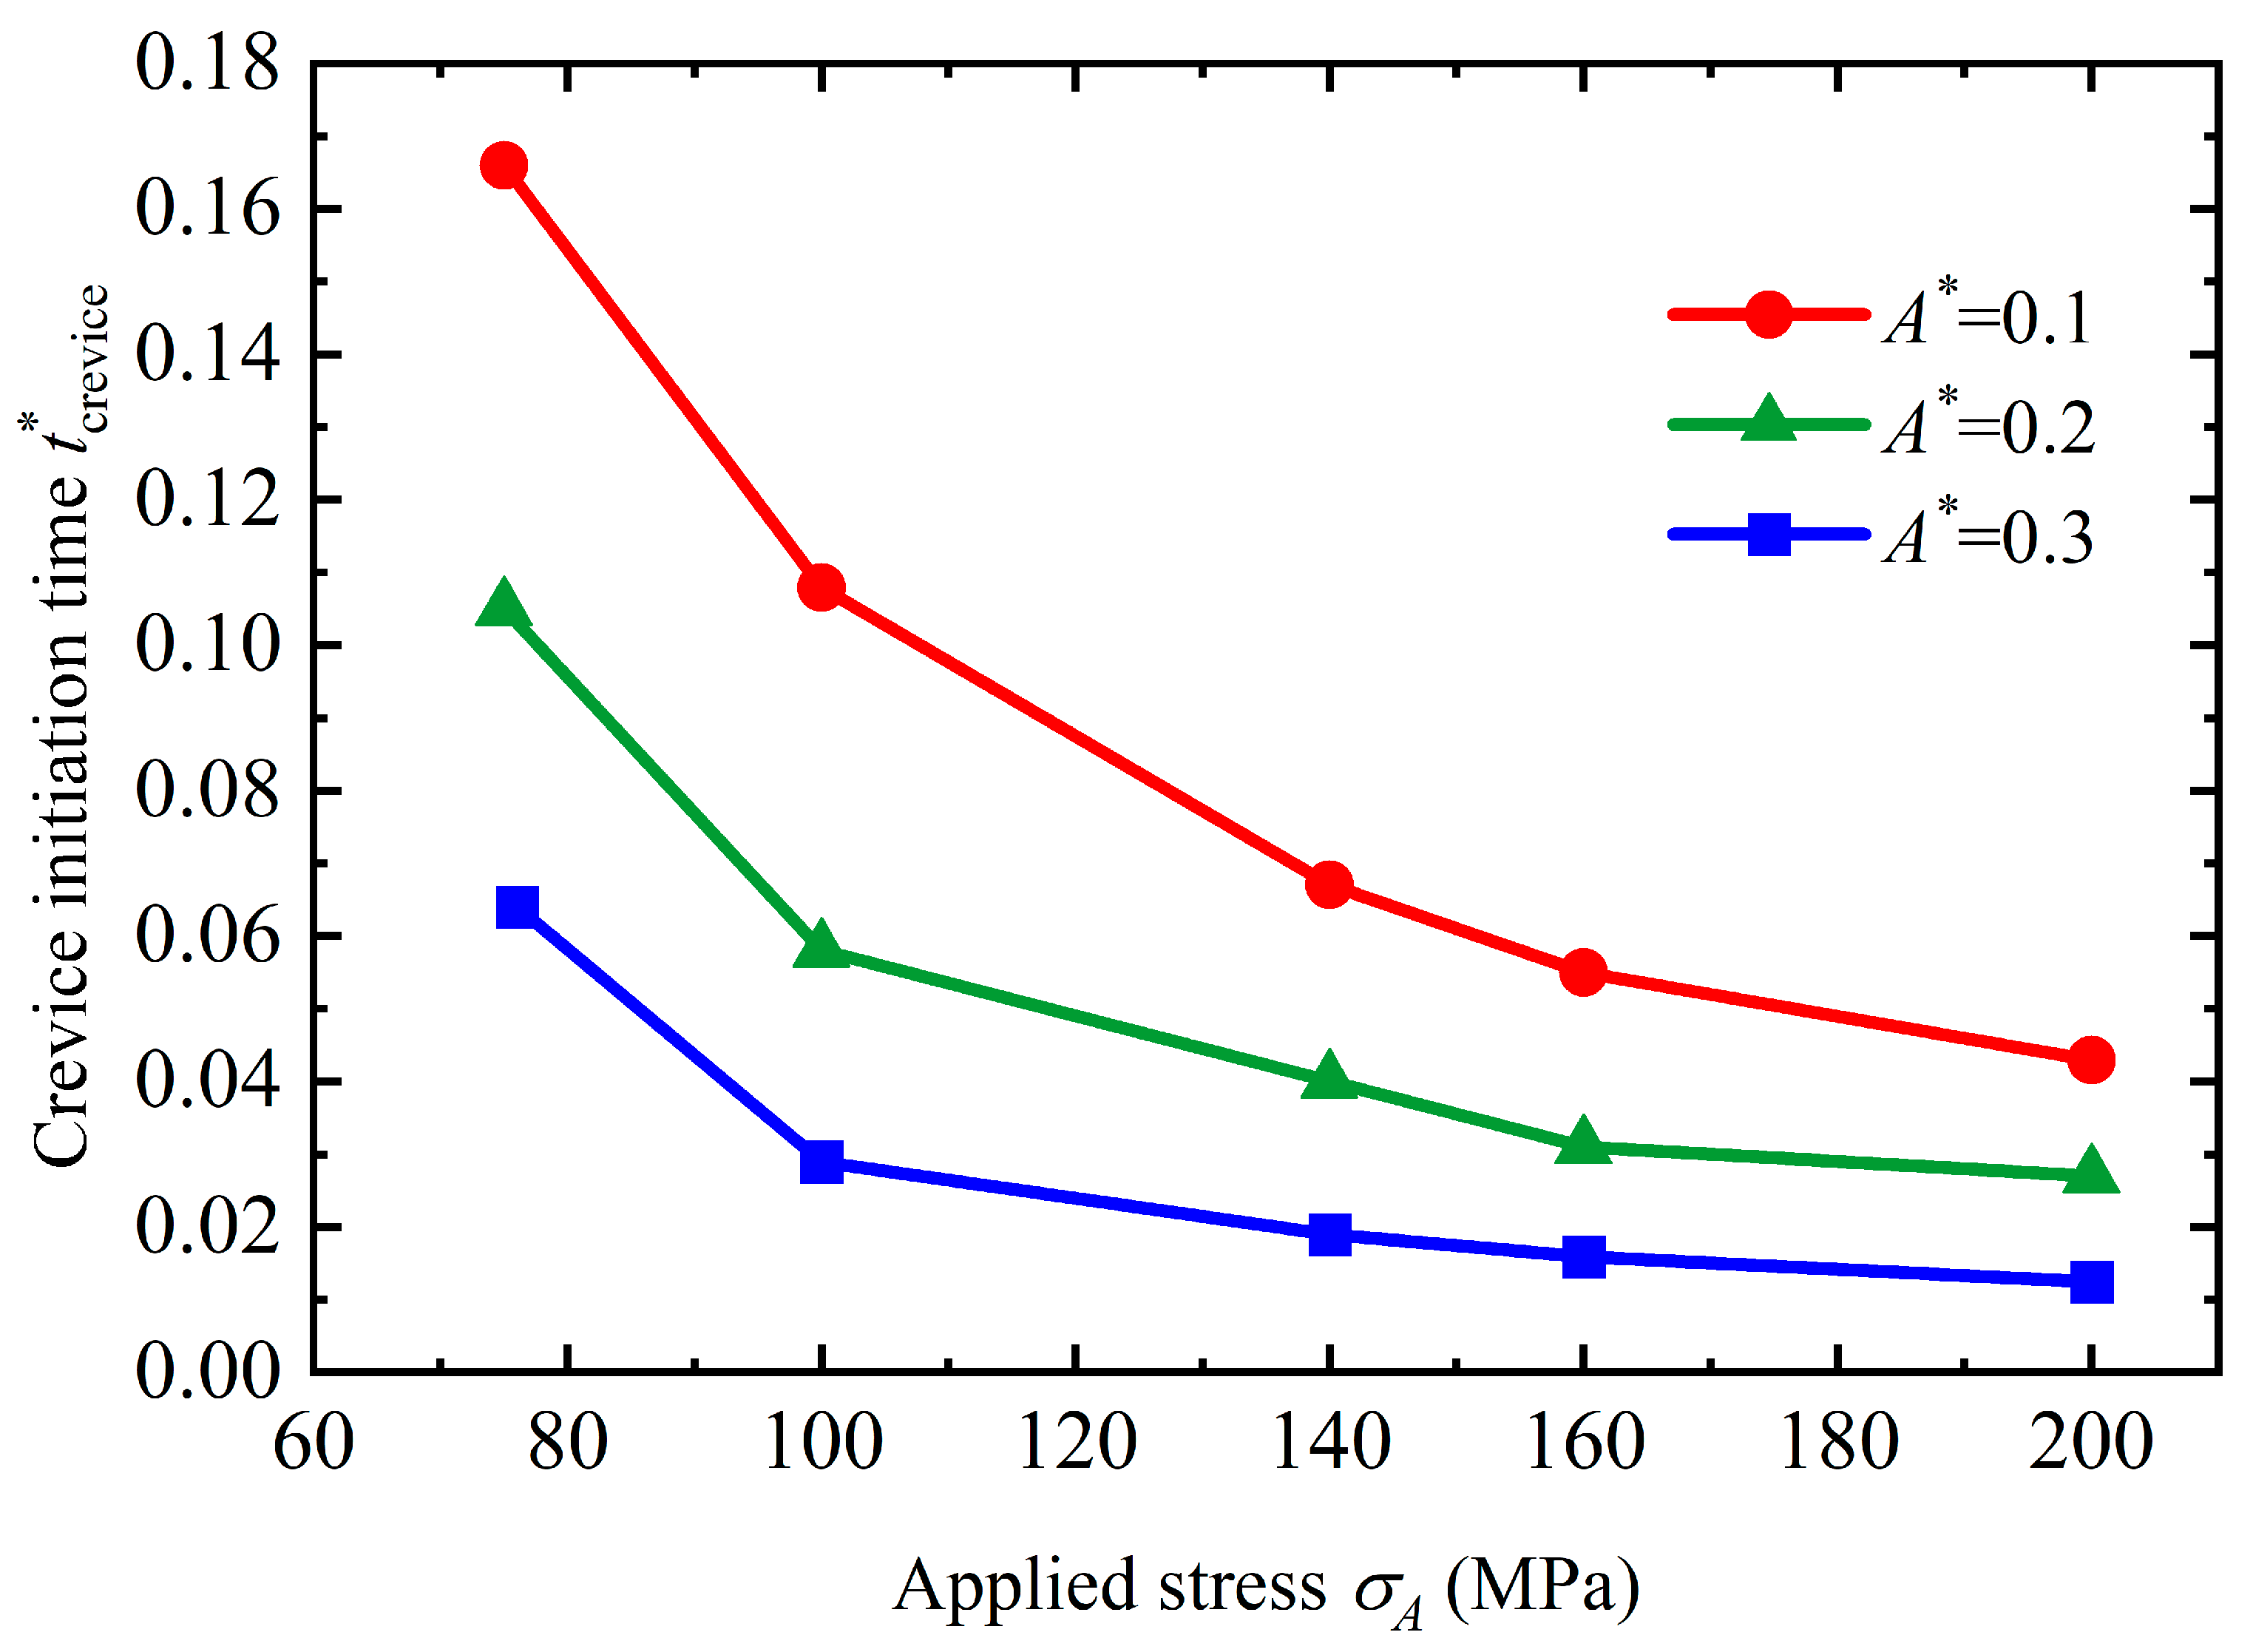
In this case, the crevice tends to initiate at the surface, which could induce crevice corrosion and decrease the service life of the structure. This pattern is the most destructive when compared with the others because crevice morphology can cause serious localized corrosion which is also insidious. For an undulated surface, the crevice is bound to occur as long as the applied stress exceeds a critical value σ A c r e v i c e . As a consequence, the surface will undergo the unstable evolution once the crevice is formed when applied stress exceeds σ A c r e v i c e , which was also reported by Fan’s work [30]. The σ A c r e v i c e is determined by the material properties, corrosion environment, and the surface morphology. With the parameters that we set in Section 3, the simulation result shows that σ A c r e v i c e = 72 MPa when A * = 0.1 . Thus, although the applied load cannot make the structure fracture immediately, the combination of corrosion and stress could make the failure happen gradually. The increasing applied stress could reduce the initiation time t c r e v i c e * of crevice generation, which is shown in Figure 10. Initiation time t c r e v i c e * is defined as the time when K T max = K T c . This result matches well with Kamaya’s experiments [44,45]. t c r e v i c e * also decreases as A * increases. This is because a bigger A * will lead to a larger initial K T max and it is easy to exceed the critical value K T c for crevice initiation when the initial K T max is large enough.

4.2. Pit Pattern

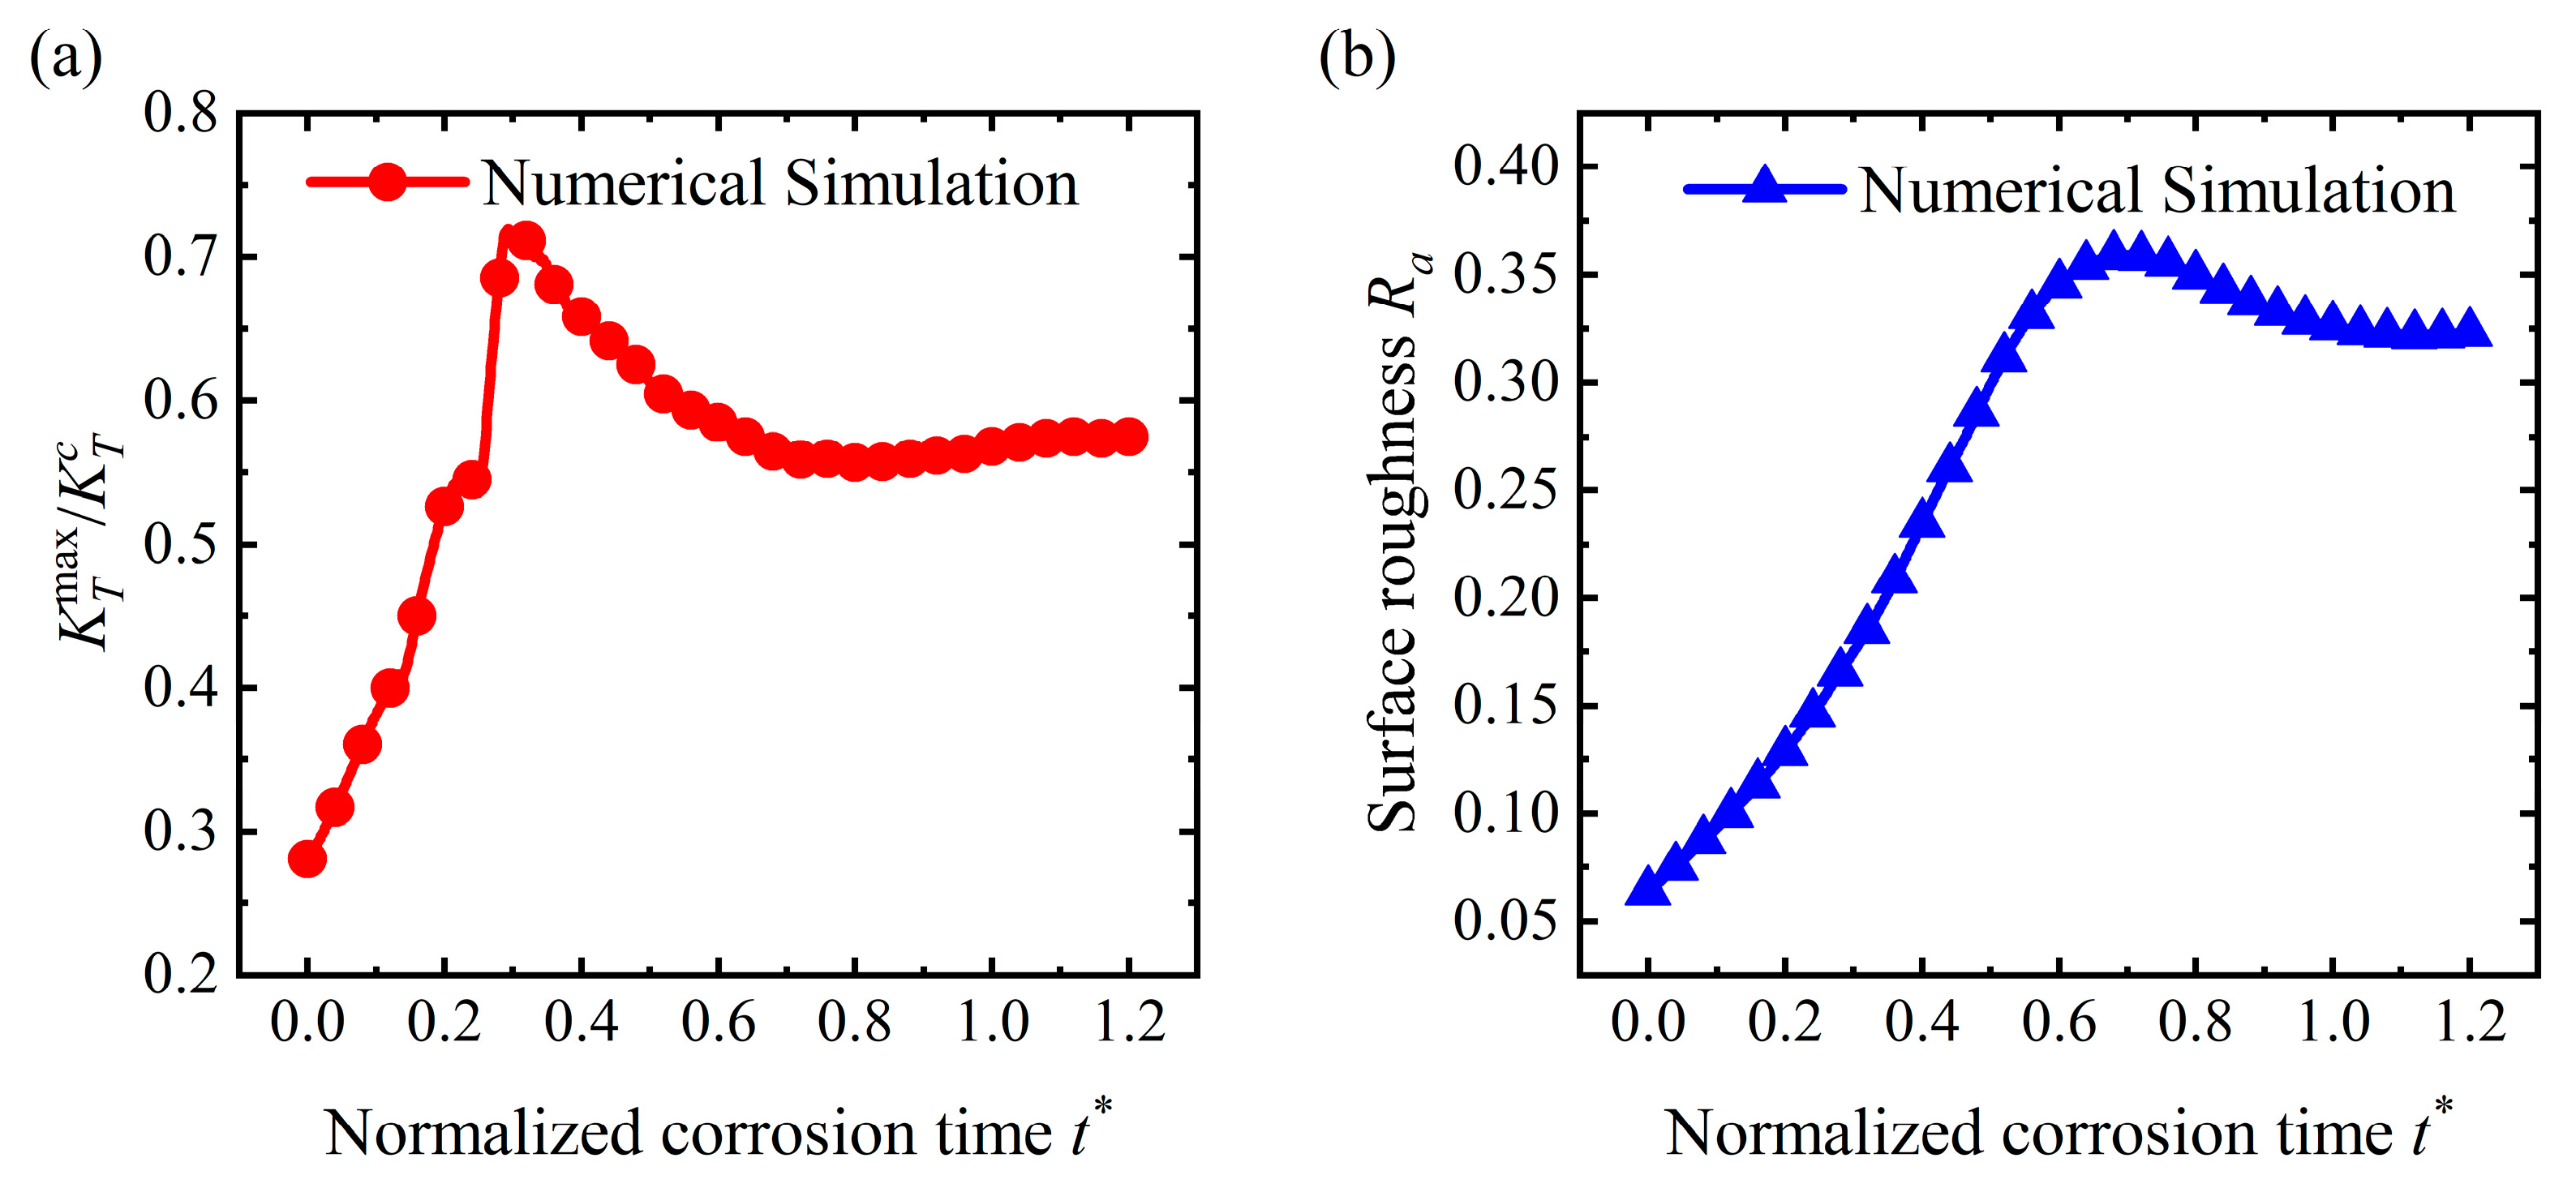
As the applied stress does not exceed σ A c r e v i c e , the crevice will not appear during the corrosion process. When the vertical corrosion velocity v y equals the constant of the surface, the surface morphology is subject to uniform corrosion with a fixed shape. If the roughness under a steady state is greater than the initial roughness, a corrosion pit is formed on the surface. Figure 11a shows the surface profile at different time t * when A * = 0.1 and σ A = 50 MPa . Based on a mechanism similar to the crevice initiation pattern, the stress concentration in the valley induces the local acceleration of the corrosion rate (which is shown in Figure 11b). But the maximal SCF K T max never exceeds K T c , as shown in Figure 12a. Finally, the surface becomes rougher than the initial state, which is shown in Figure 12b, and the pit forms on the surface. R a and K T max almost remain steady after t * = 0.8 , which is the beginning of the steady state. As shown in Figure 12a, although a crevice is not generated, the K T max becomes larger than the initial state, which means that the acceleration of the corrosion rate is increased at the pit tip.
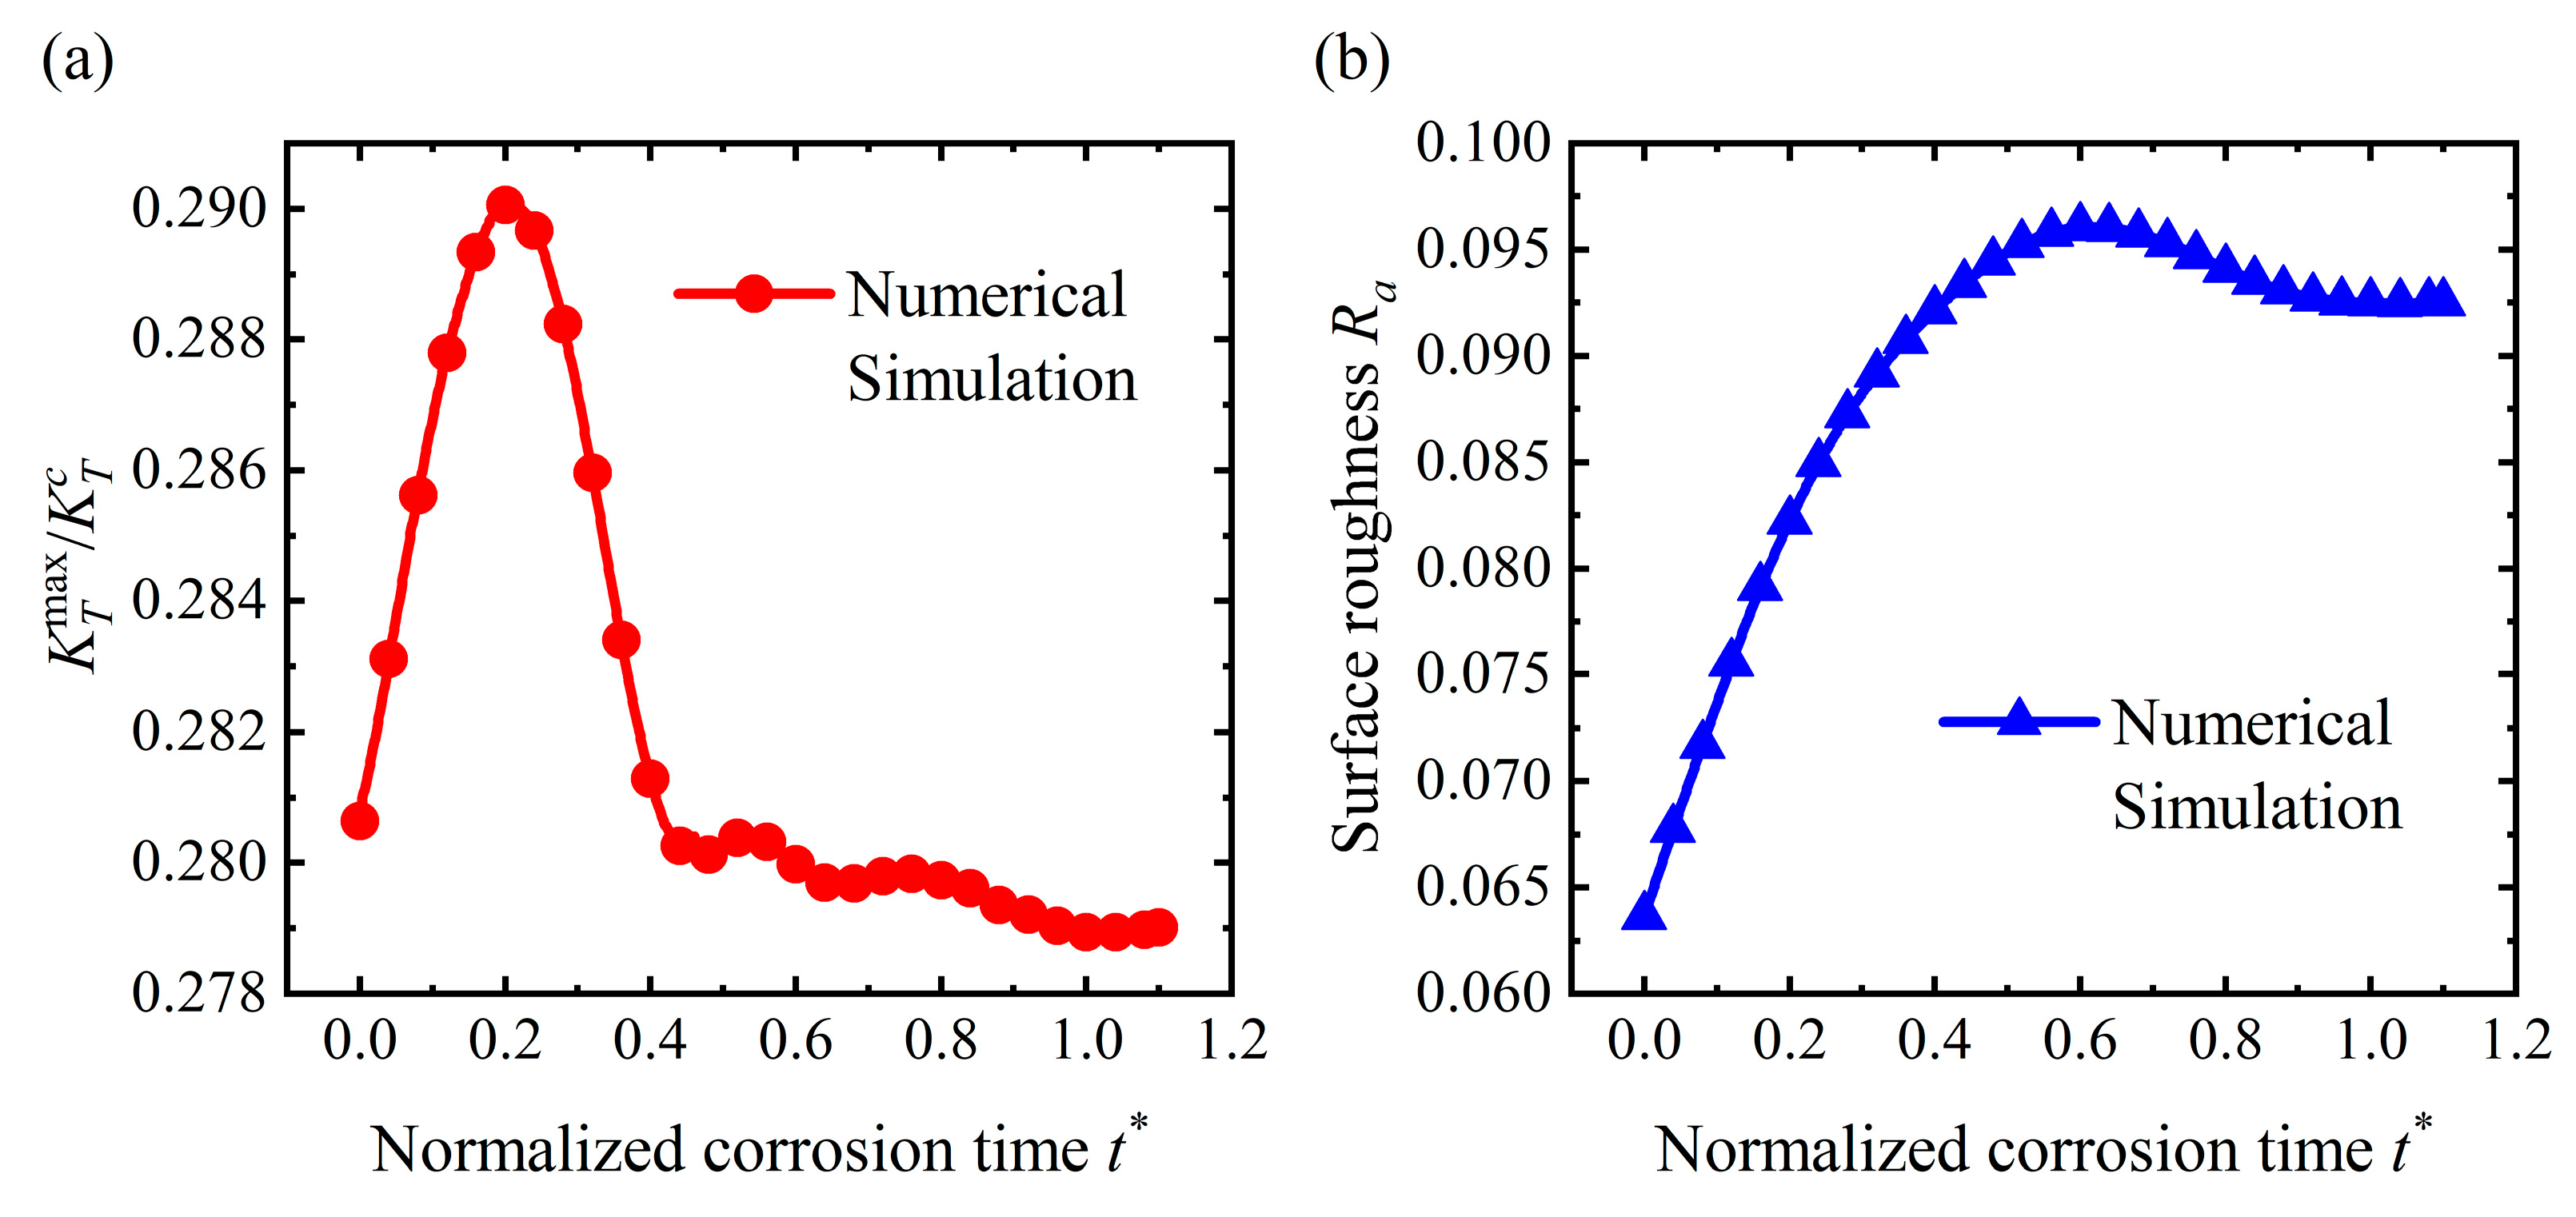
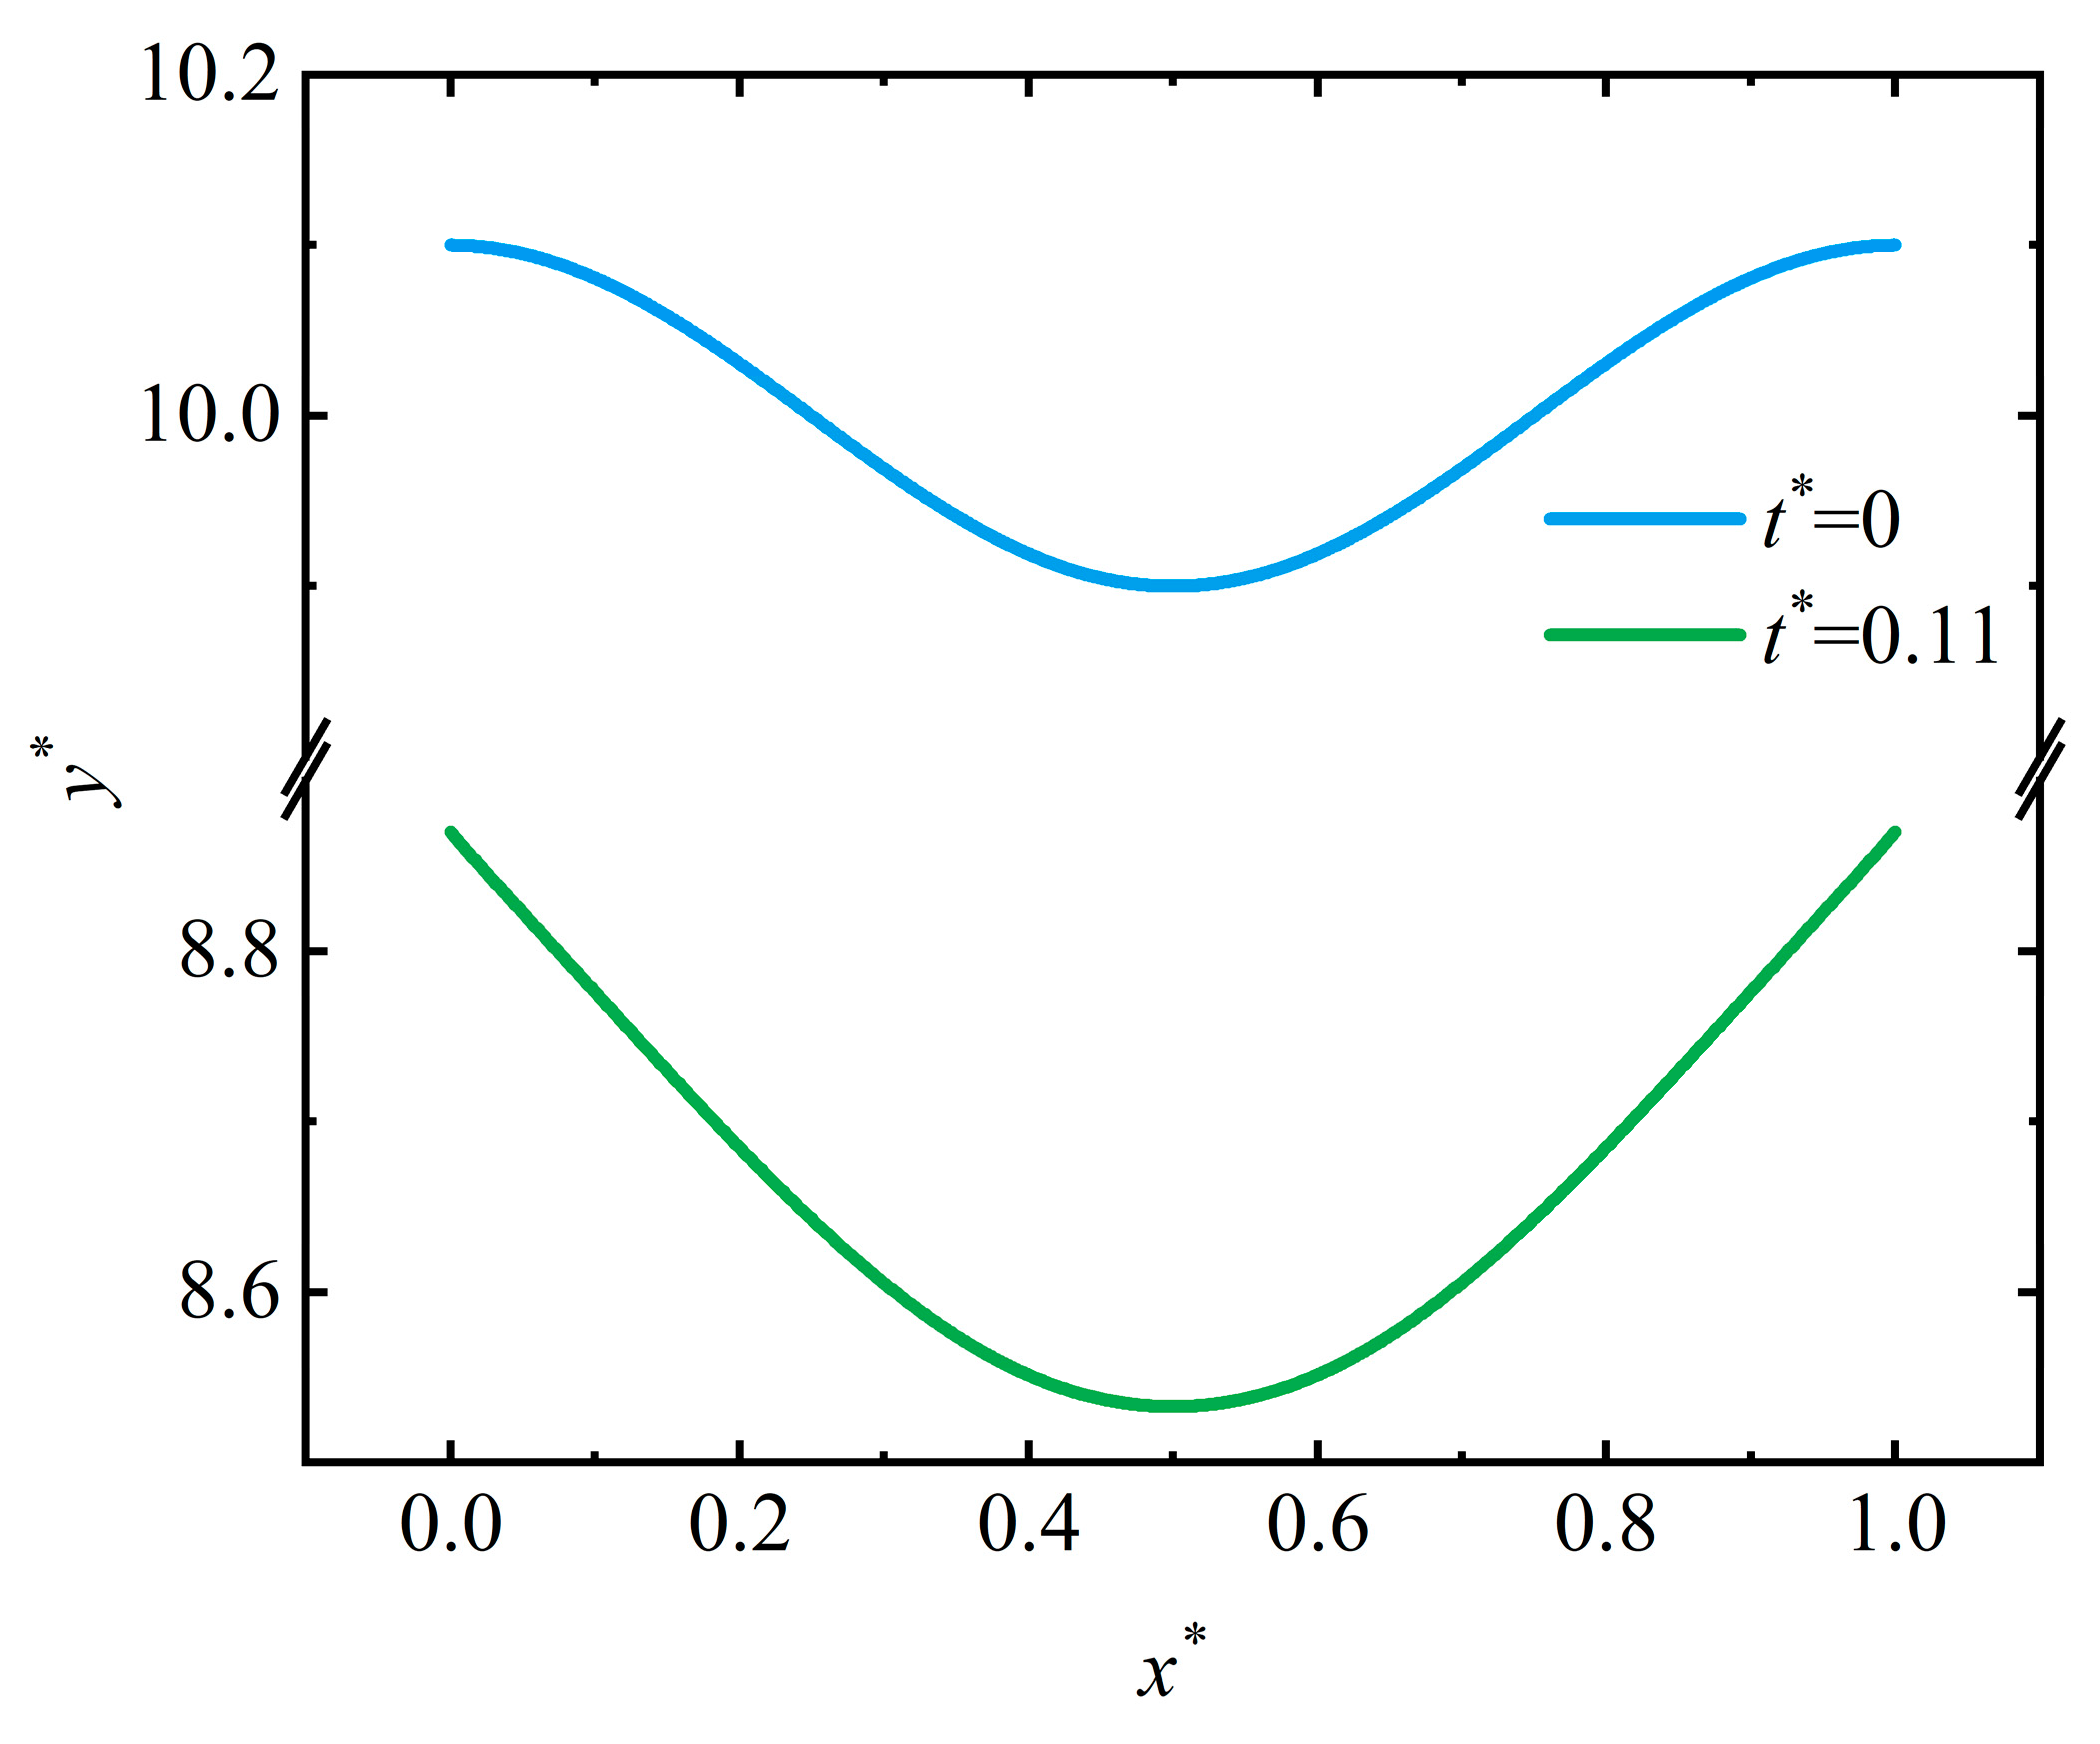
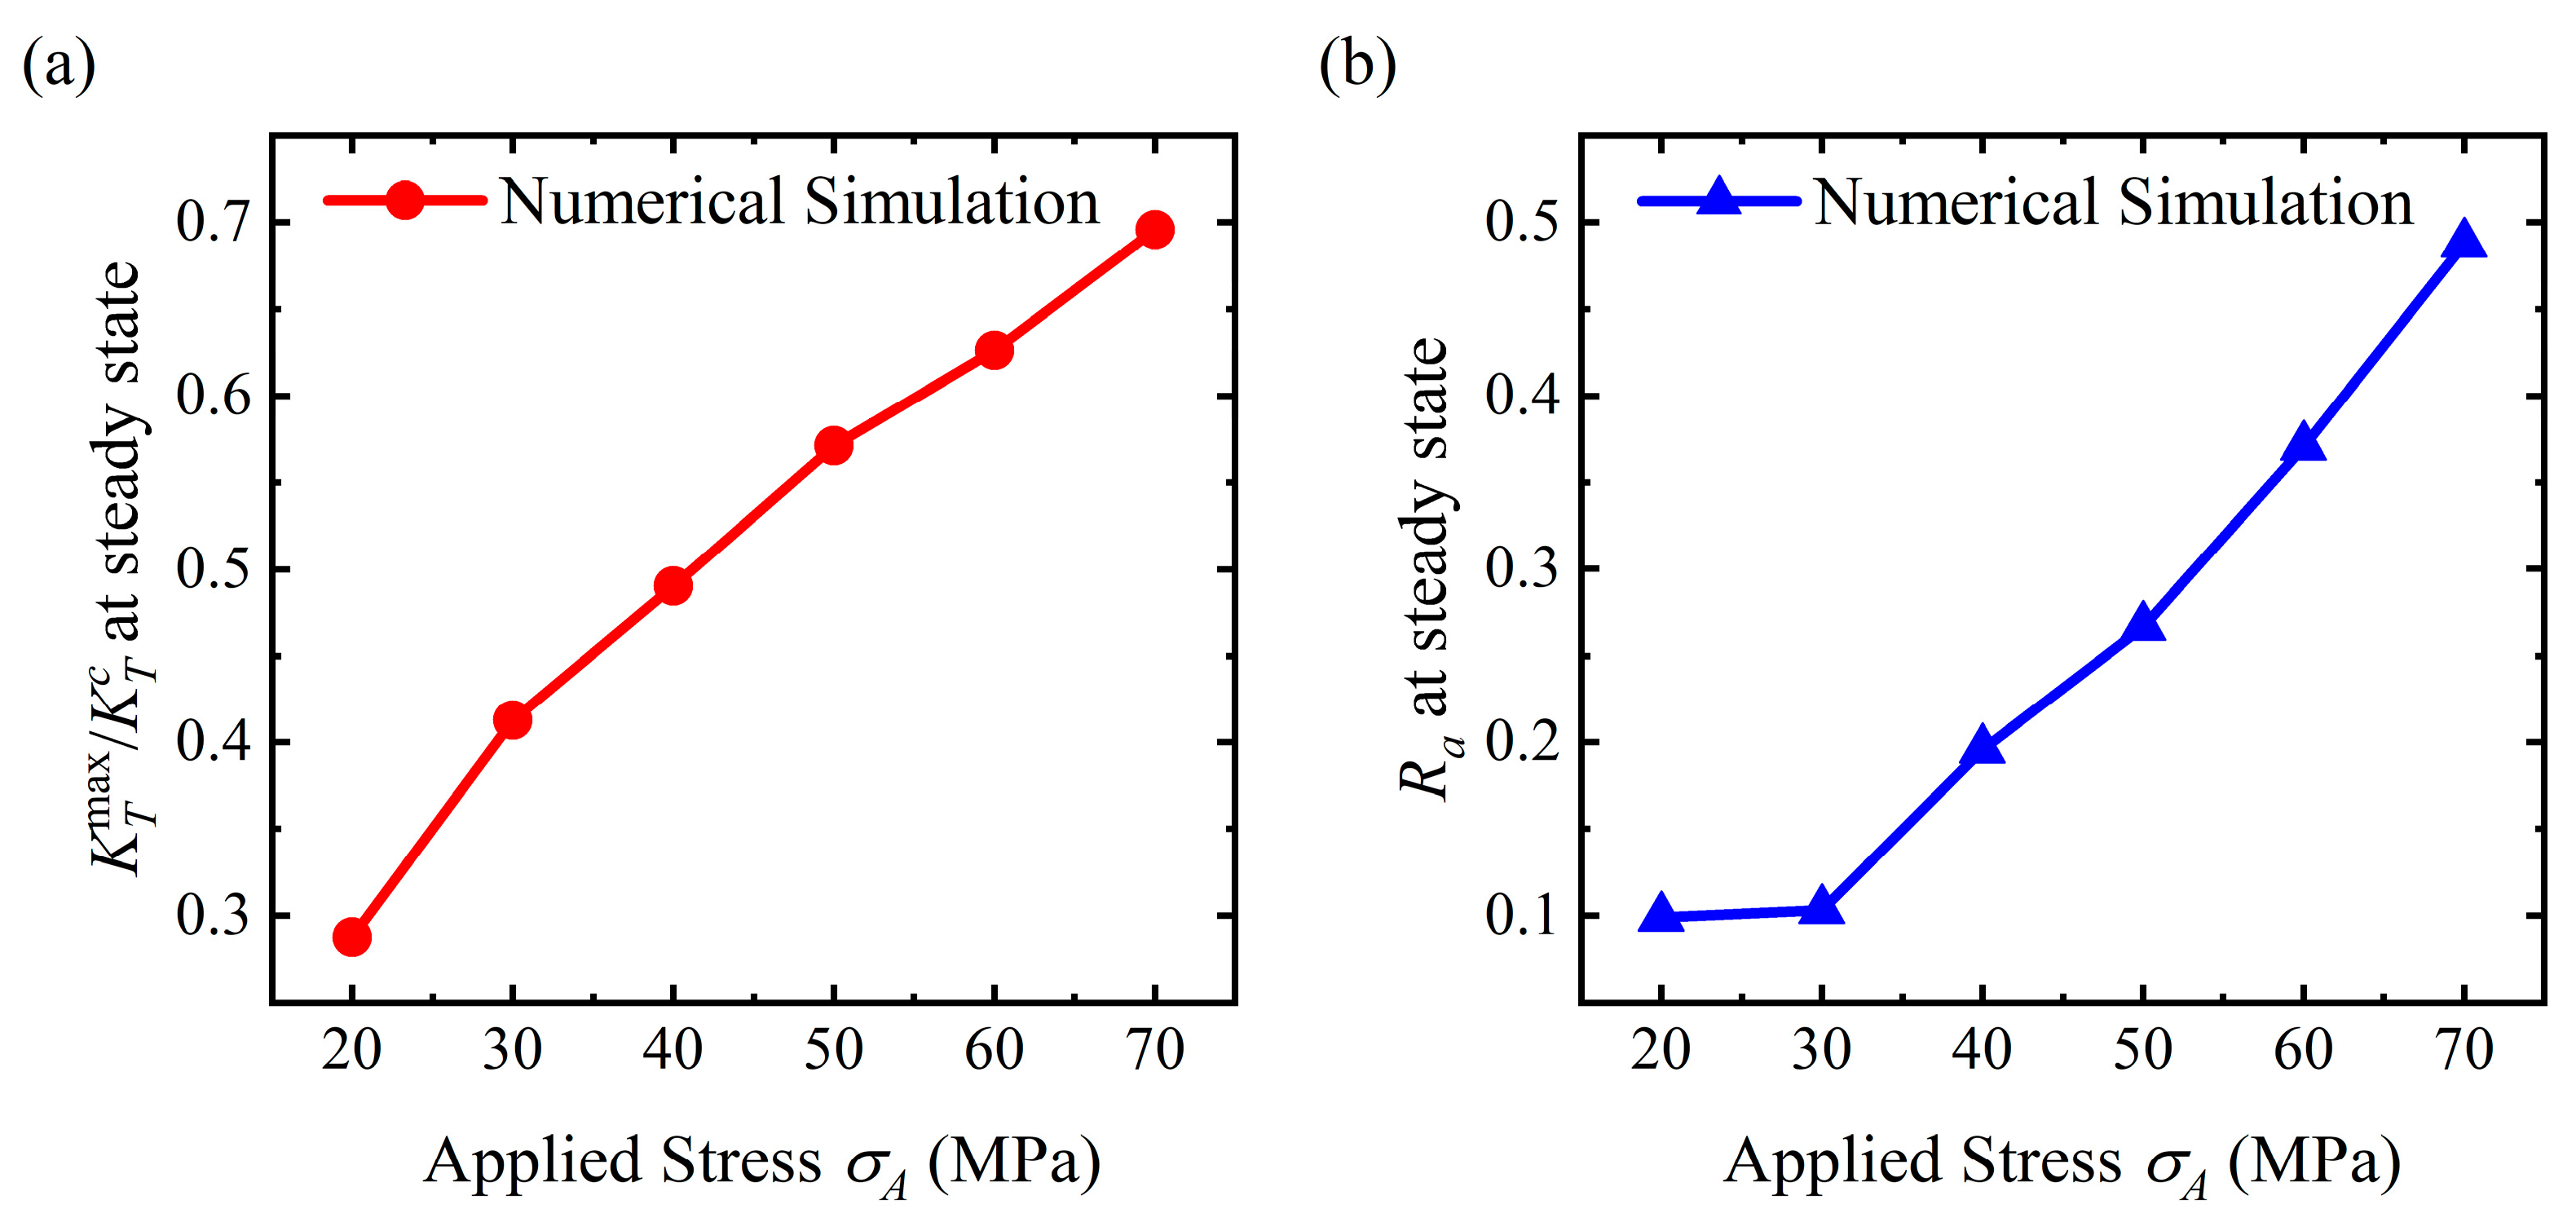
However, not all pit formation patterns will increase the K T max under a steady state. As shown in Figure 13, R a > R a 0 when A * = 0.1 and σ A = 19 MPa , but K T max becomes smaller than the initial state. Figure 14 shows the surface profile at different times when A * = 0.1 and σ A = 19 MPa . As the surface became a little rougher, the bottom of the valley became blunter than the initial state. In this case, the stress concentration gradually relaxes. This result shows that the pit formation pattern may decrease the acceleration of the corrosion rate at the pit tip by relaxing the stress concentration. For a fixed A * , R a and K T max under a steady state are determined by the applied stress σ A . As shown in Figure 15, R a and K T max under a steady state decrease with a reduction in the applied stress σ A (when A * = 0.1 ). A lower σ A can reduce the difference in the corrosion rate between the different surface zones, which makes the corrosion depth more evenly distributed on the surface with each time increment: Δ t * . As a result, roughness under a steady state becomes smaller with a lower σ A , which also reduces the K T max . When the applied stress is under a critical value, σ A p i t , the surface roughness under a steady state will be less than that of the initial state, which means that a corrosion pit will not be generated on the surface. Similar to σ A c r e v i c e , σ A p i t is determined by the material properties, corrosion environment, and the surface morphology. σ A p i t = 14 MPa when A * = 0.1 under the corrosion parameters mentioned above.

4.3. Flattening Pattern

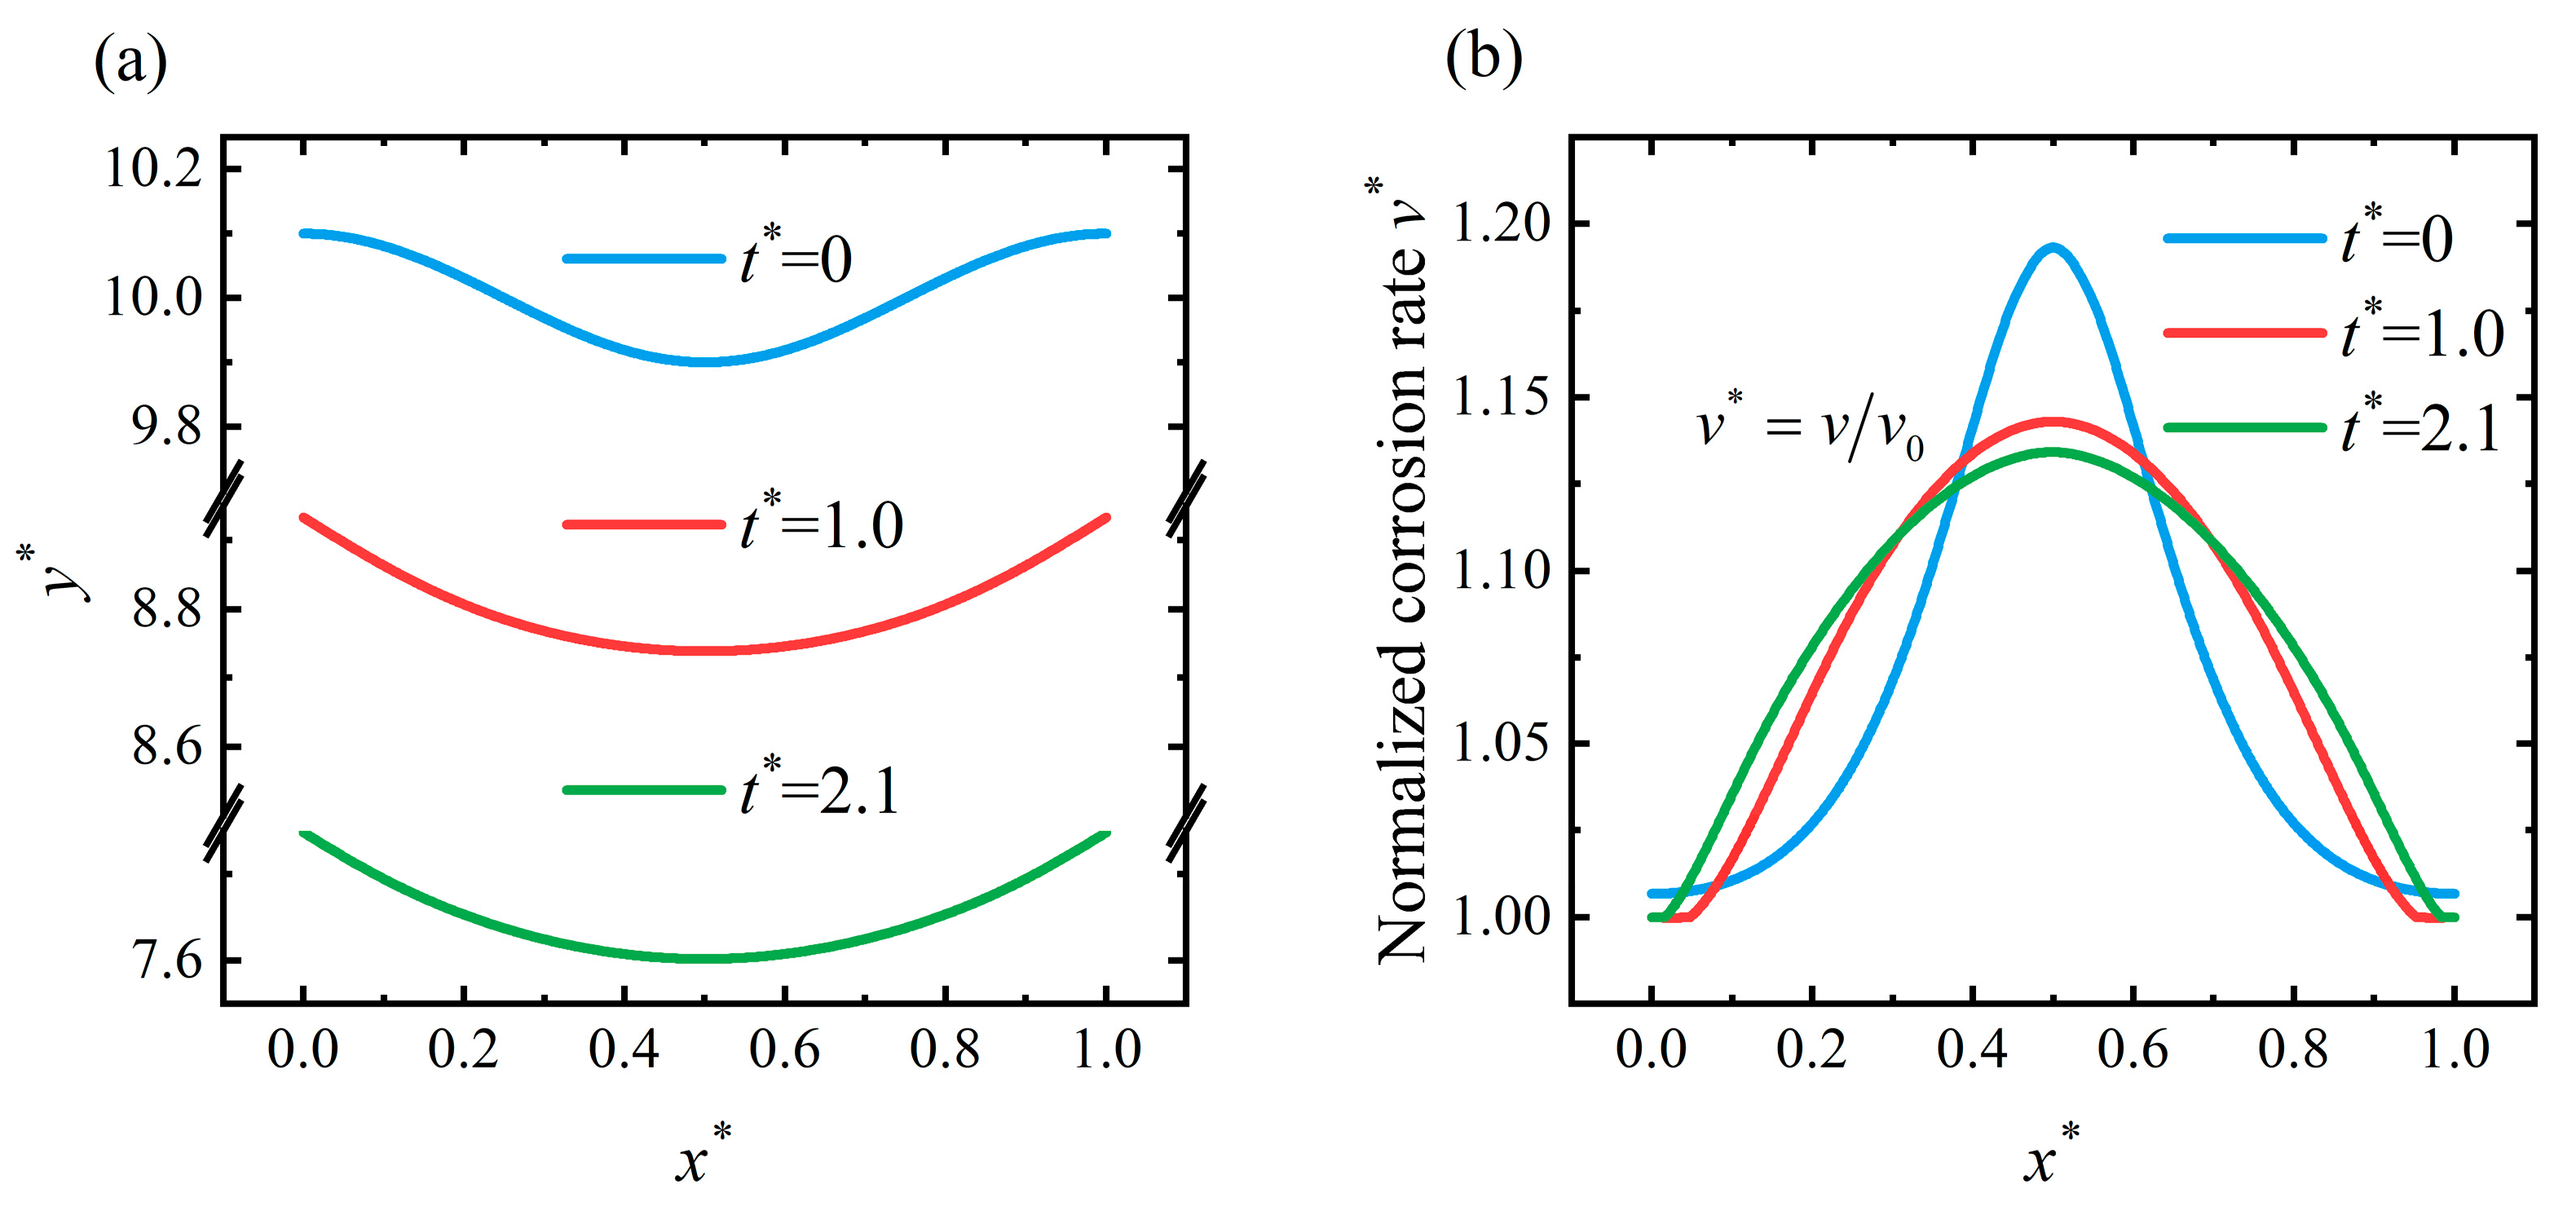
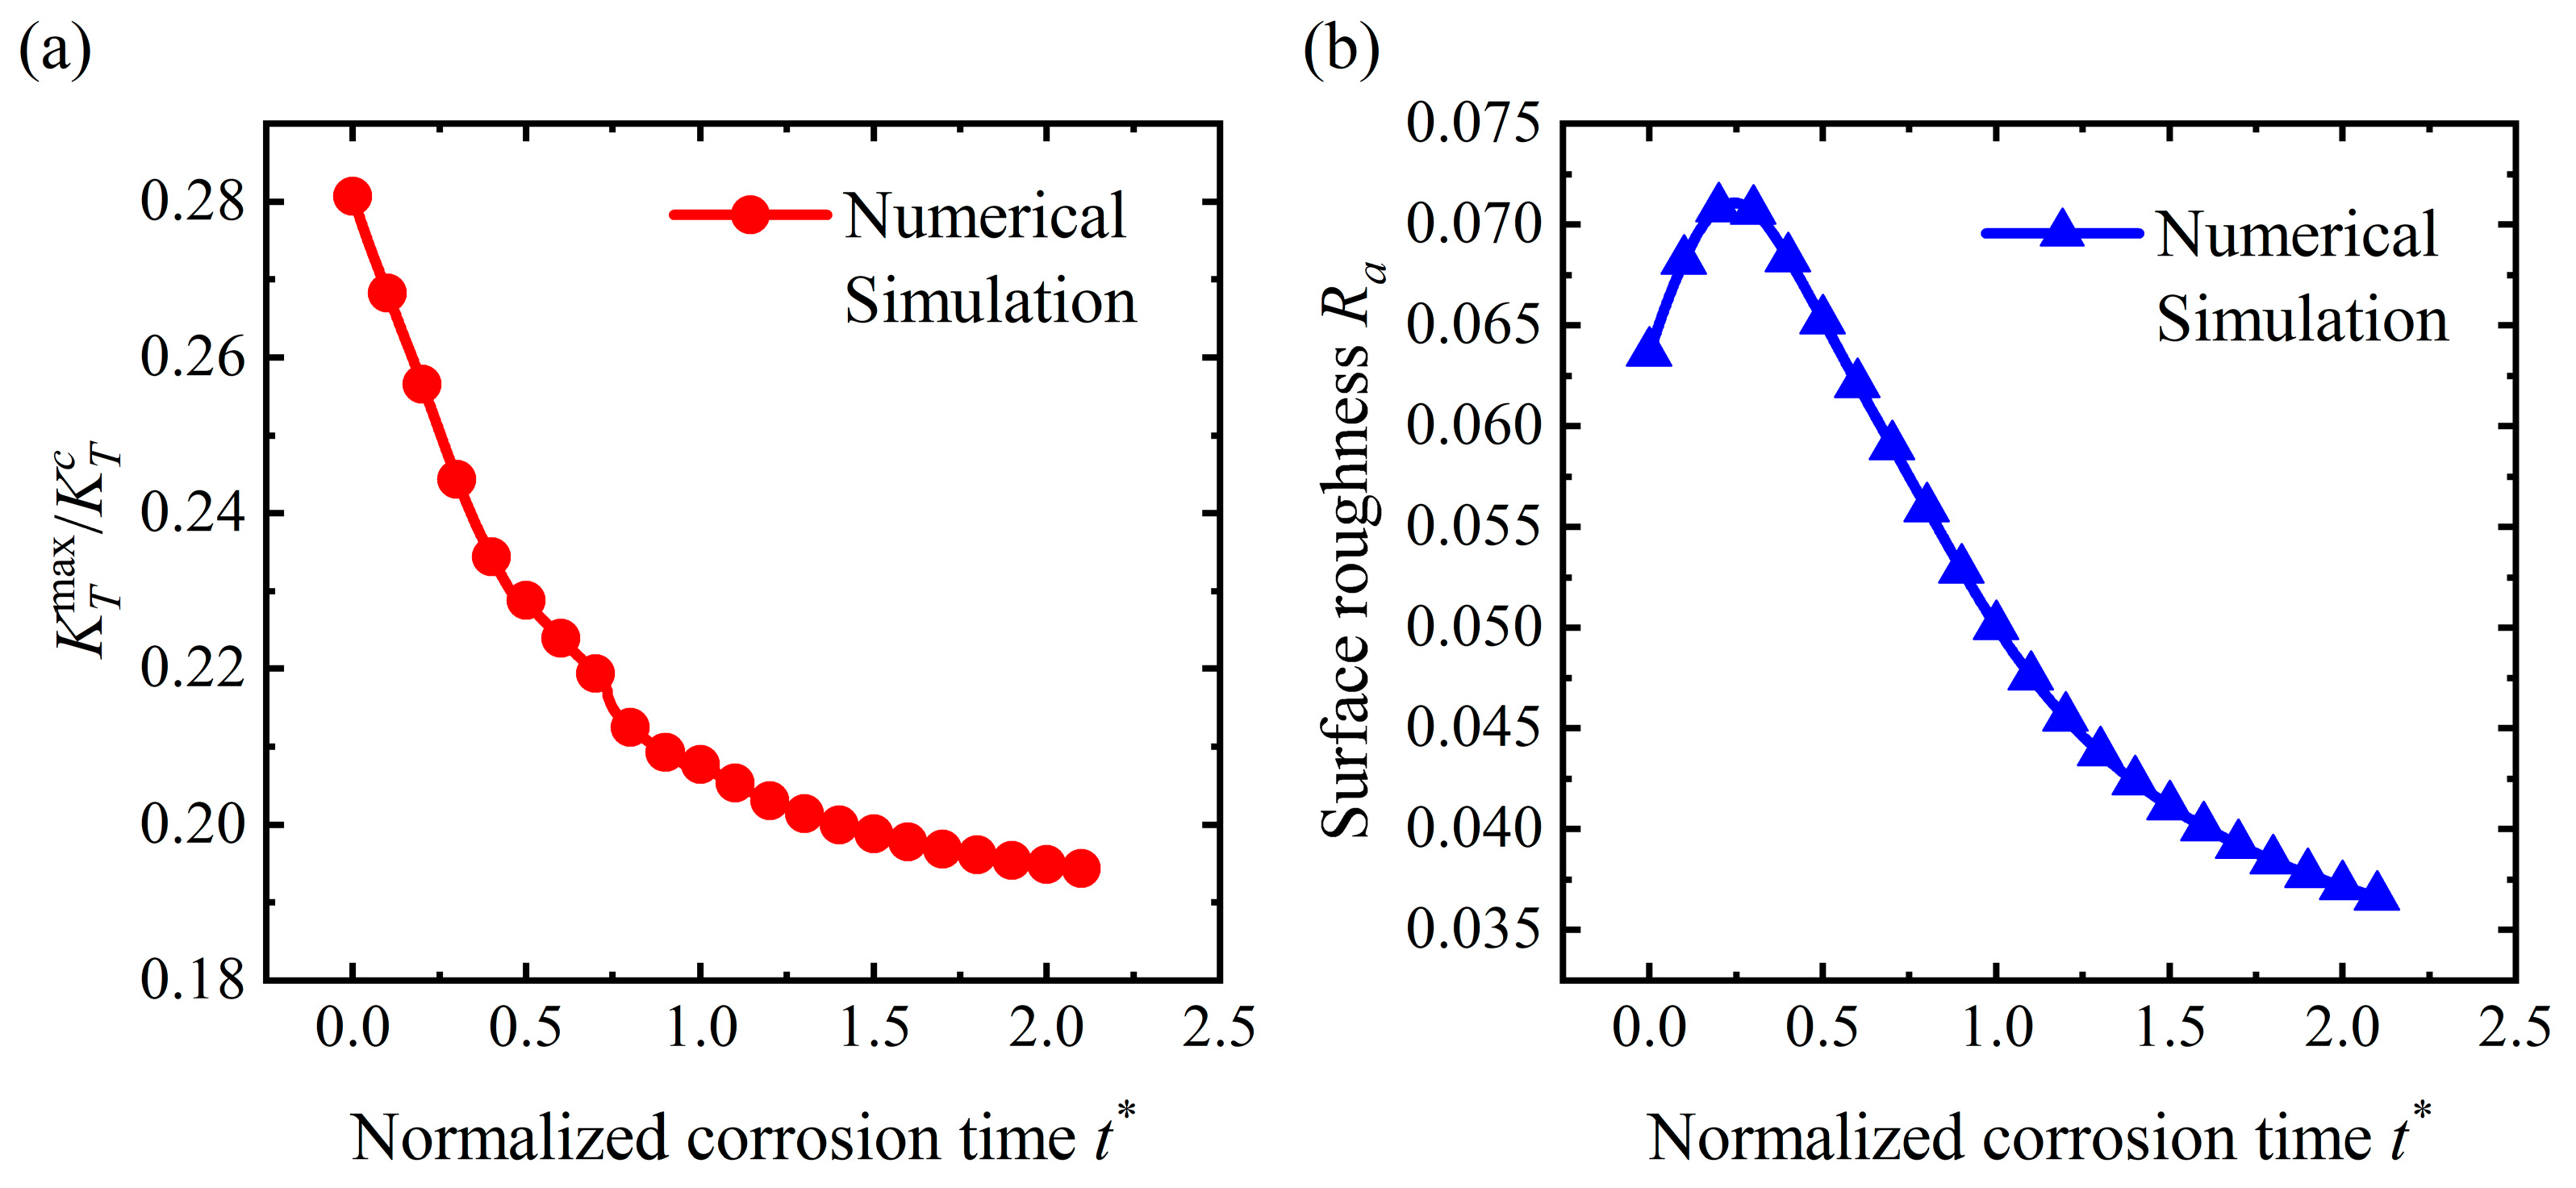
As the roughness under a steady state becomes smaller than that of the initial state, the surface becomes flatter compared with the initial morphology. Figure 16a shows the surface profile at different times t * when A * = 0.1 and σ A = 10 MPa . When the applied stress is quite small, the corrosion rate will change slightly along the surface, as shown in Figure 16b. In this case, the corrosion process is similar to uniform corrosion without stress, and the rough surface will become flatter during the dissolution process. This phenomenon was also reported by Fan’s work [30] and Li’s experiment [10]. But the applied stress still has an effect on corrosion rate; the steady state of the flattening pattern cannot reach absolute flatness unless σ A = 0 . Figure 17a,b shows the variation in R a and K T max , respectively. As the surface becomes flat and smooth, the stress concentration relaxes.
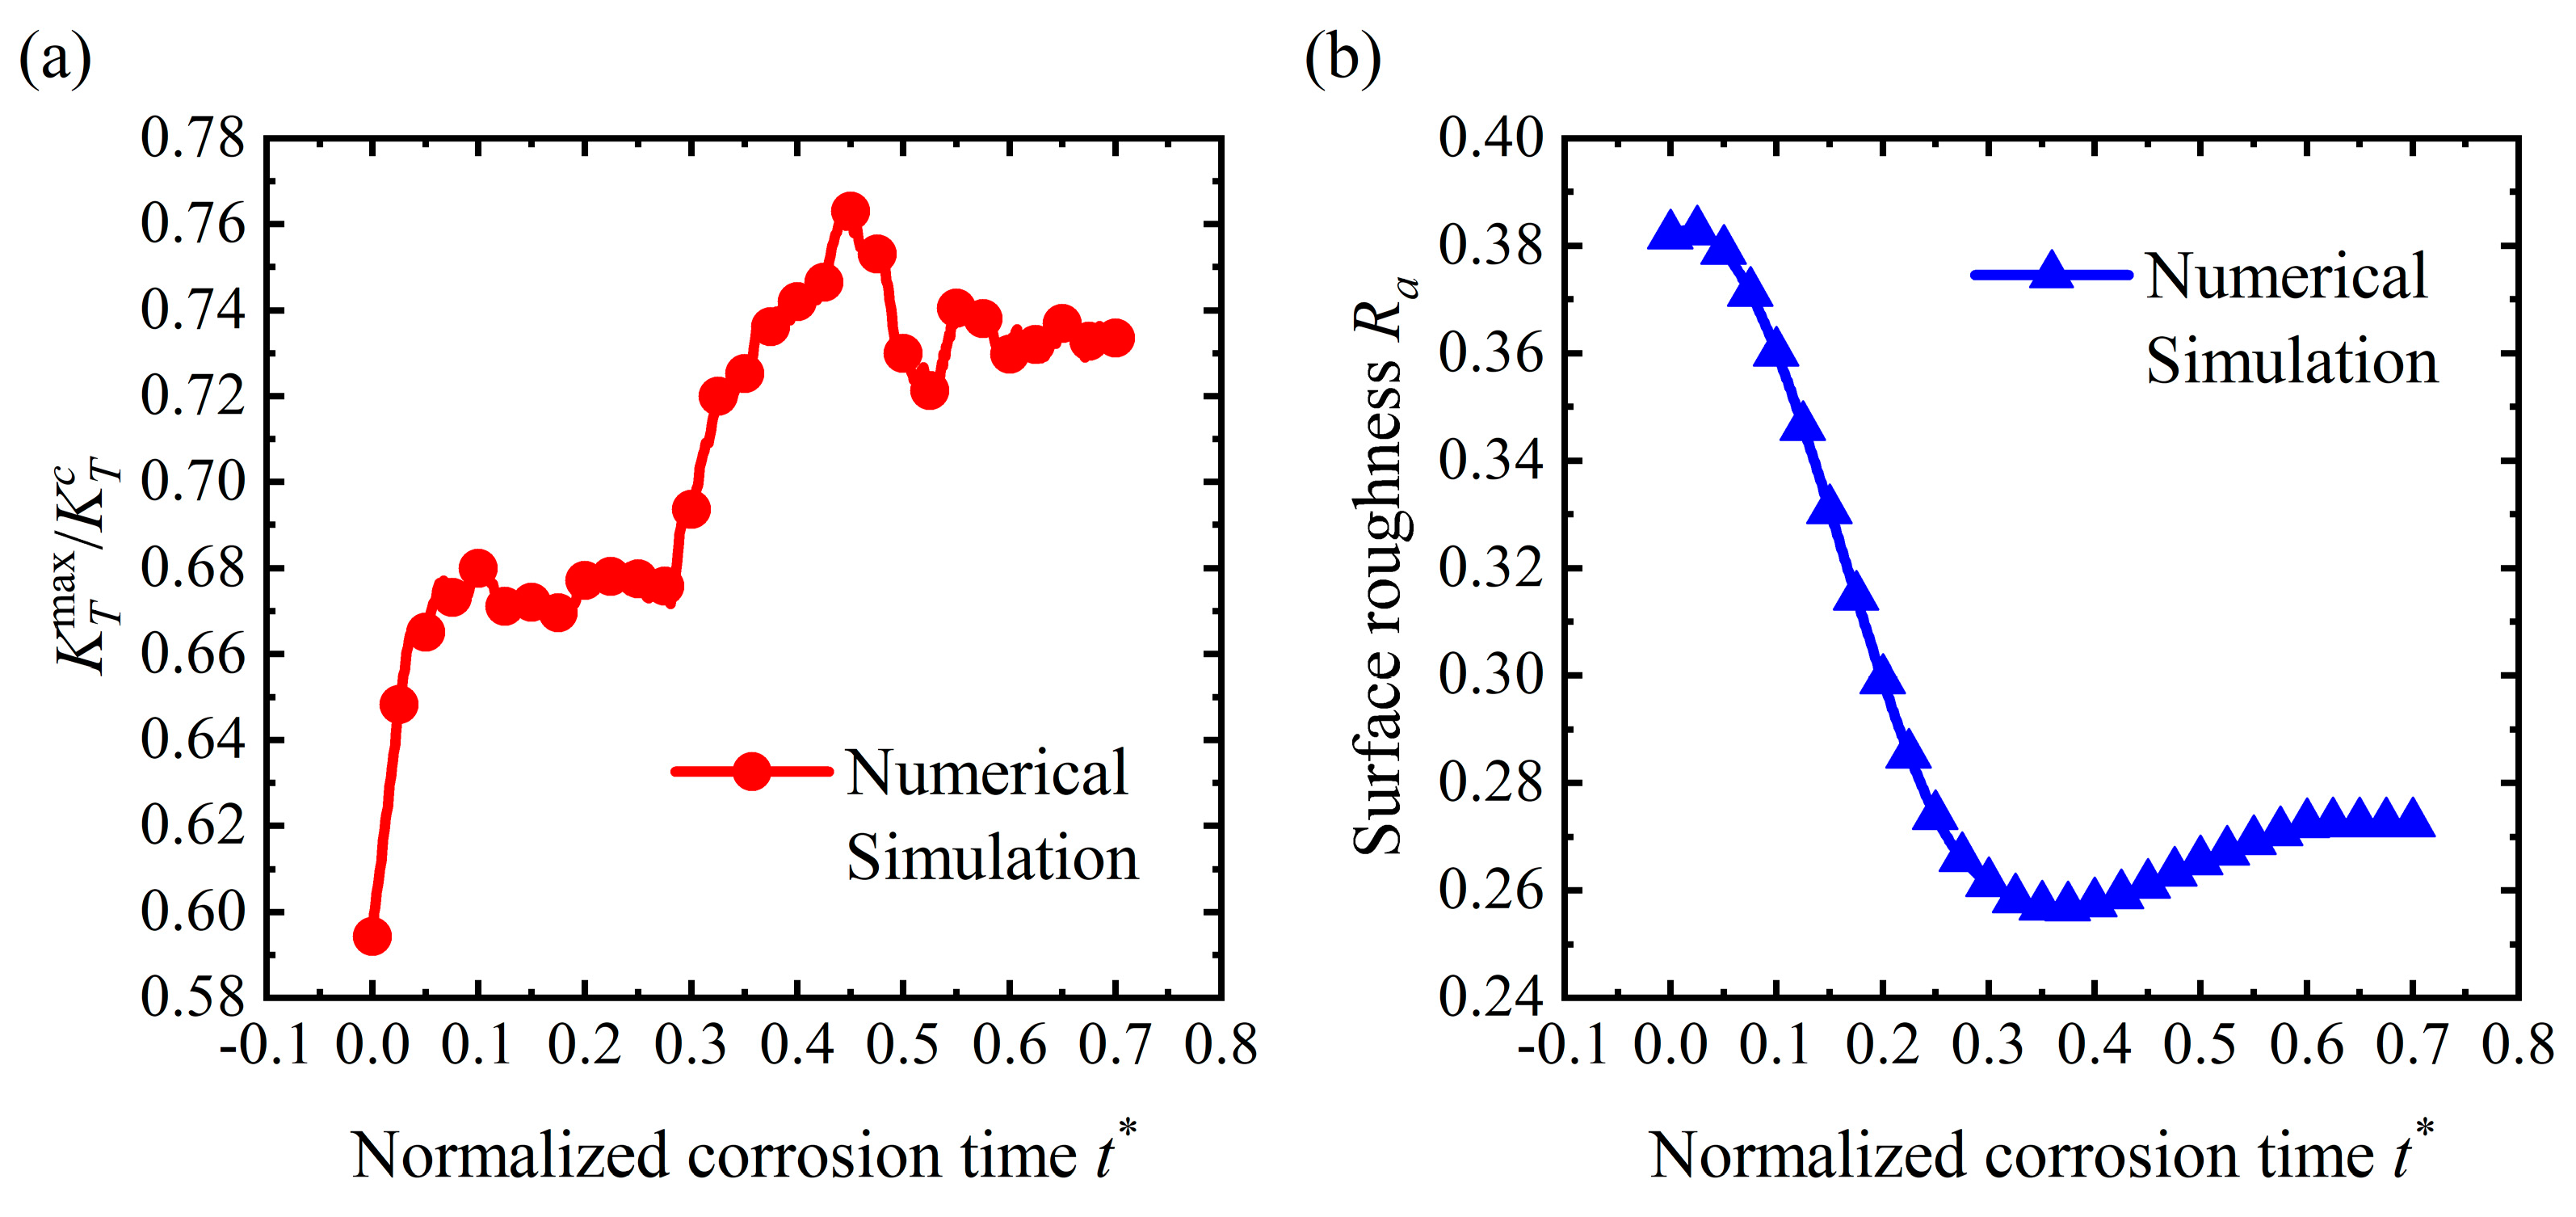
However, a reduction in R a does not mean K T max has to decrease. As shown in Figure 18, R a < R a 0 when A * = 0.6 and σ A = 30 MPa , but K T max had increased more than the initial state. Stress concentration is also affected by the geometric shape of the surface. As a result, K T max increases when the valley of the surface becomes sharp, as shown in Figure 19. In other words, a flatter surface may be detrimental to the structure when K T max is larger than that of the initial state.

4.4. Discussion

The formation processes of the corrosion morphologies: (crevice, pit, and flat surface) were observed under different applied stresses. Under a low mechanical load, the surface will become smoother and flatter, which was also found by other works [10,30]. The appearance of pits and crevices under stress corrosion was also reported by other simulations [2]. Thus, our method is capable of simulating the evolution process of corrosion morphologies, and the simulation results are valid.
With this method, the evolution pattern can be acquired when the initial σ A and A * are given. Among the three patterns, the crevice pattern is the most destructive to the structures because the crevice corrosion rate is much larger than that of uniform corrosion. As a result, the service life of the structure will decrease dramatically. Crevice morphology is difficult to detect, which could cause insidious corrosion failure. As for the pit pattern and the flat pattern, the surface morphology is unchanged under a steady state. The simulations showed that R a and K T max under a steady state are in positive correlation with the applied stress σ A when A * is fixed.
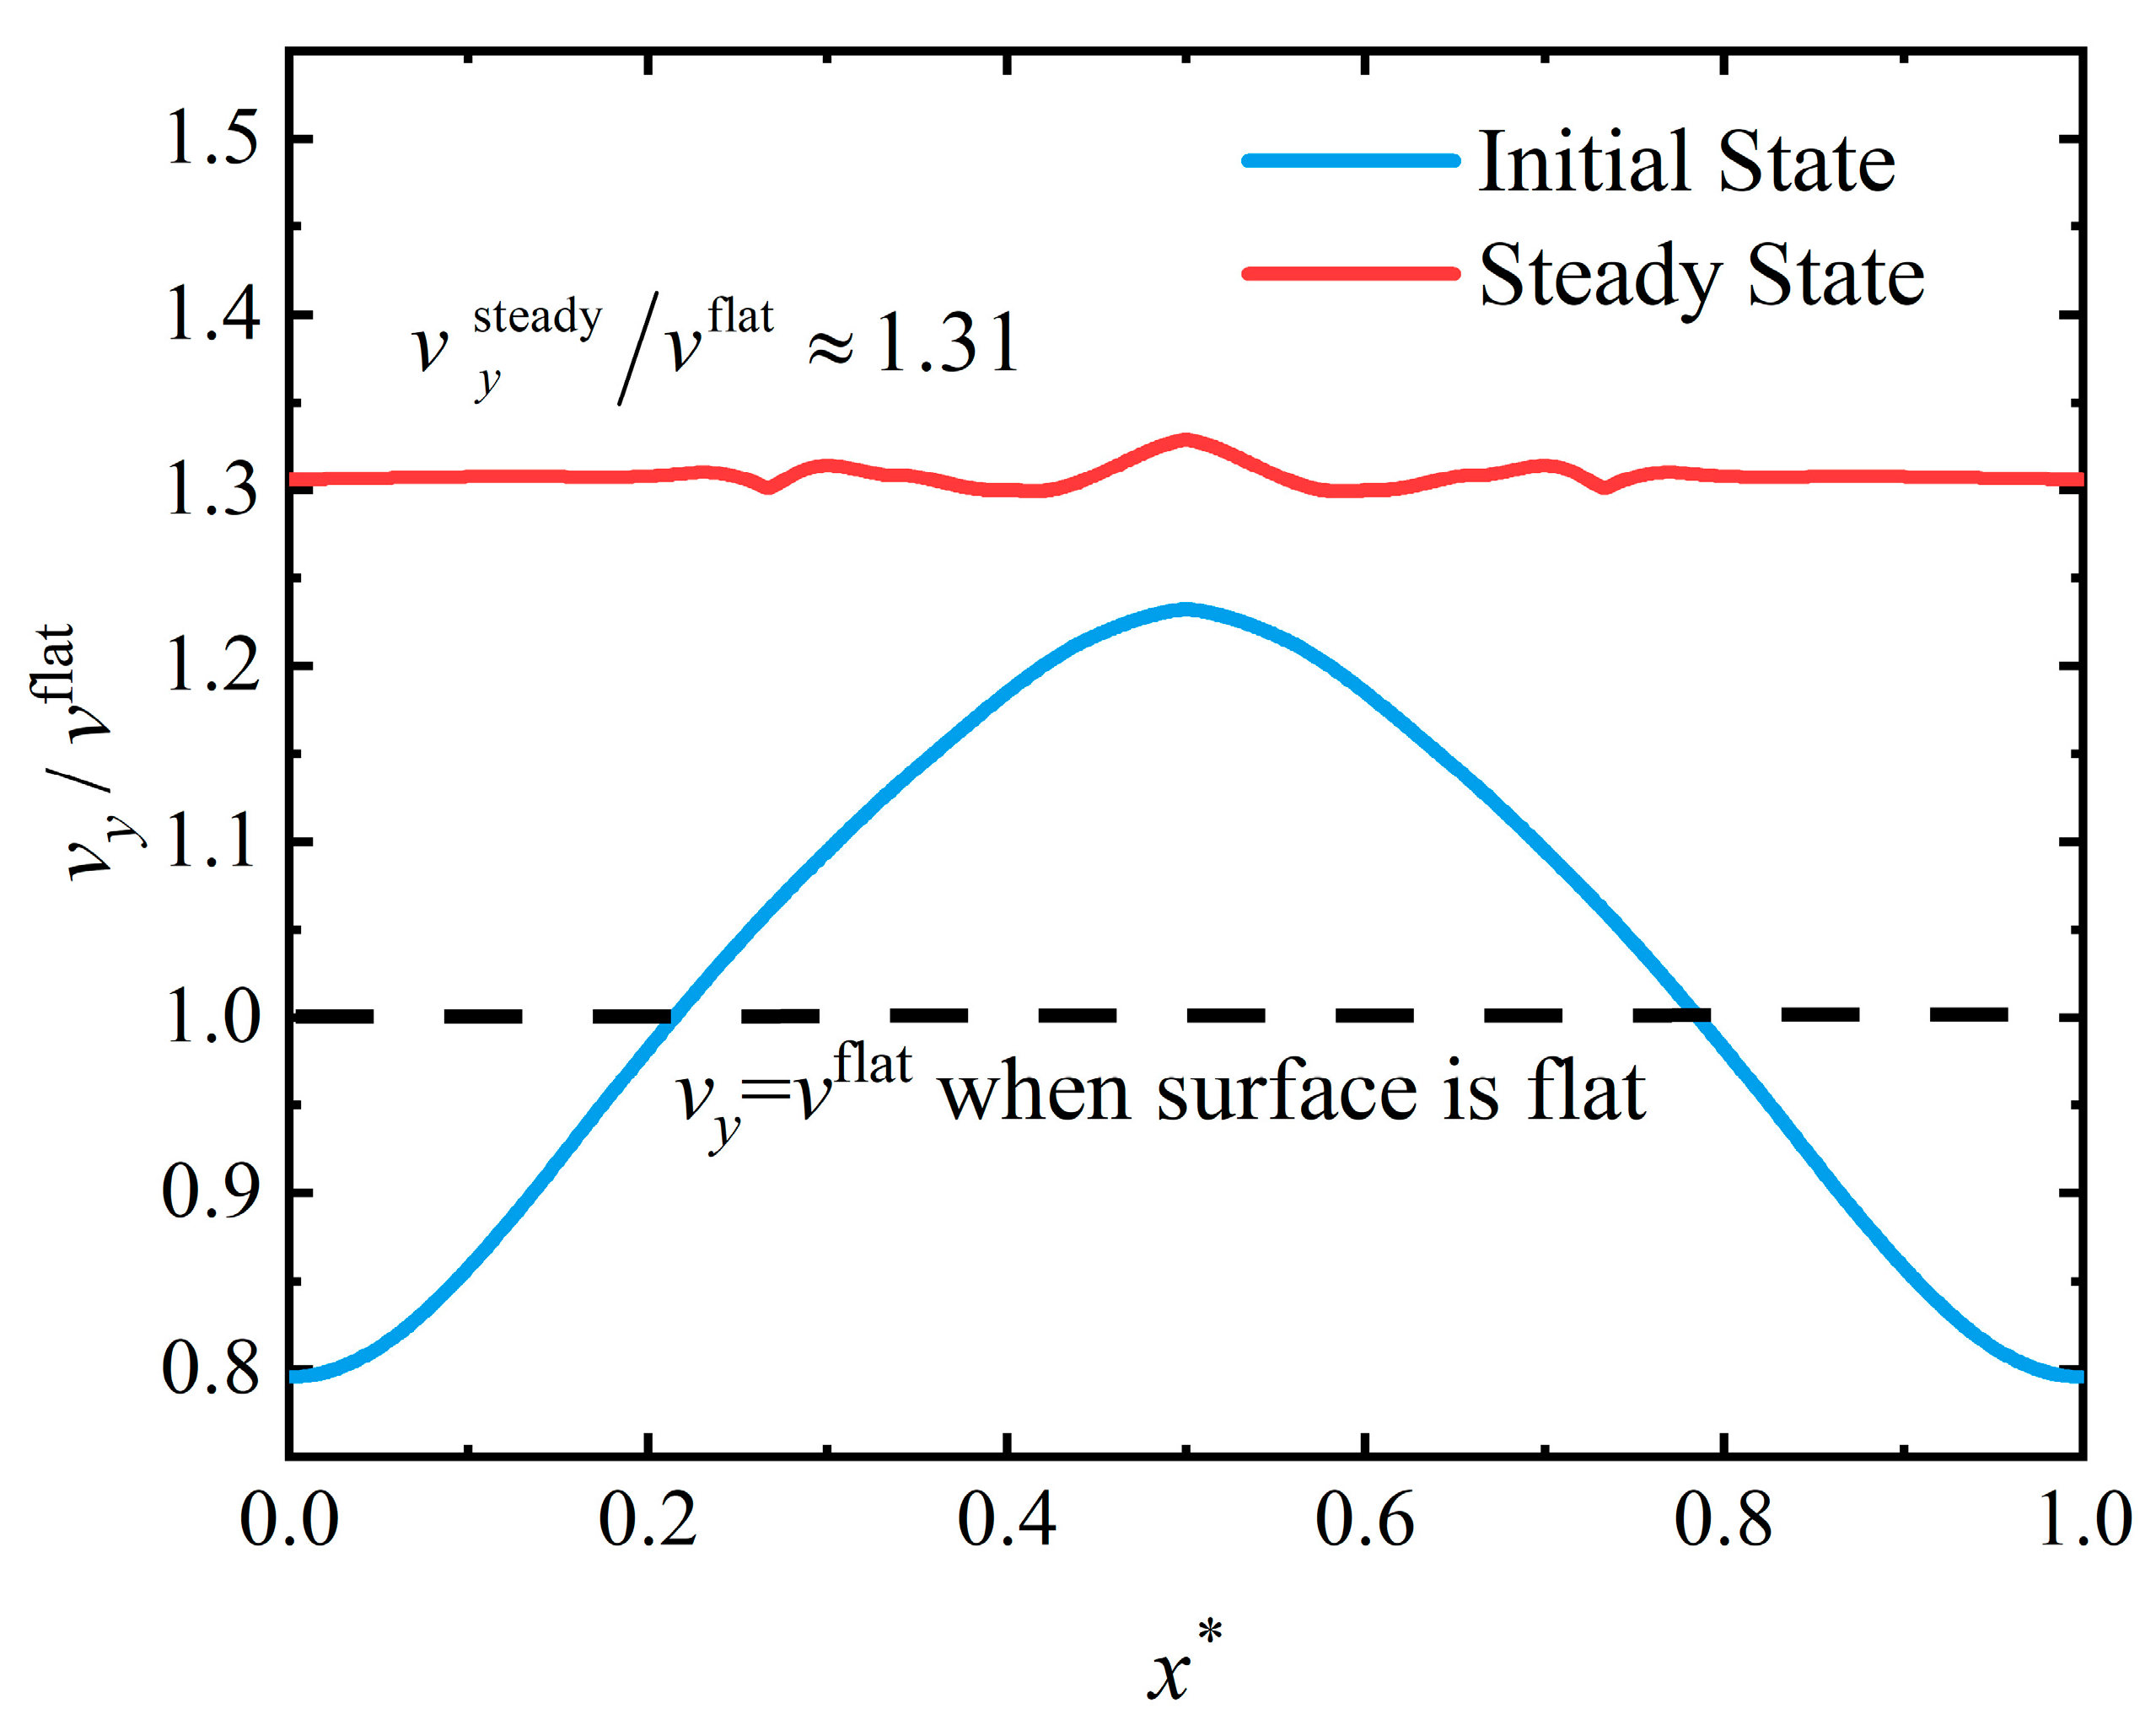
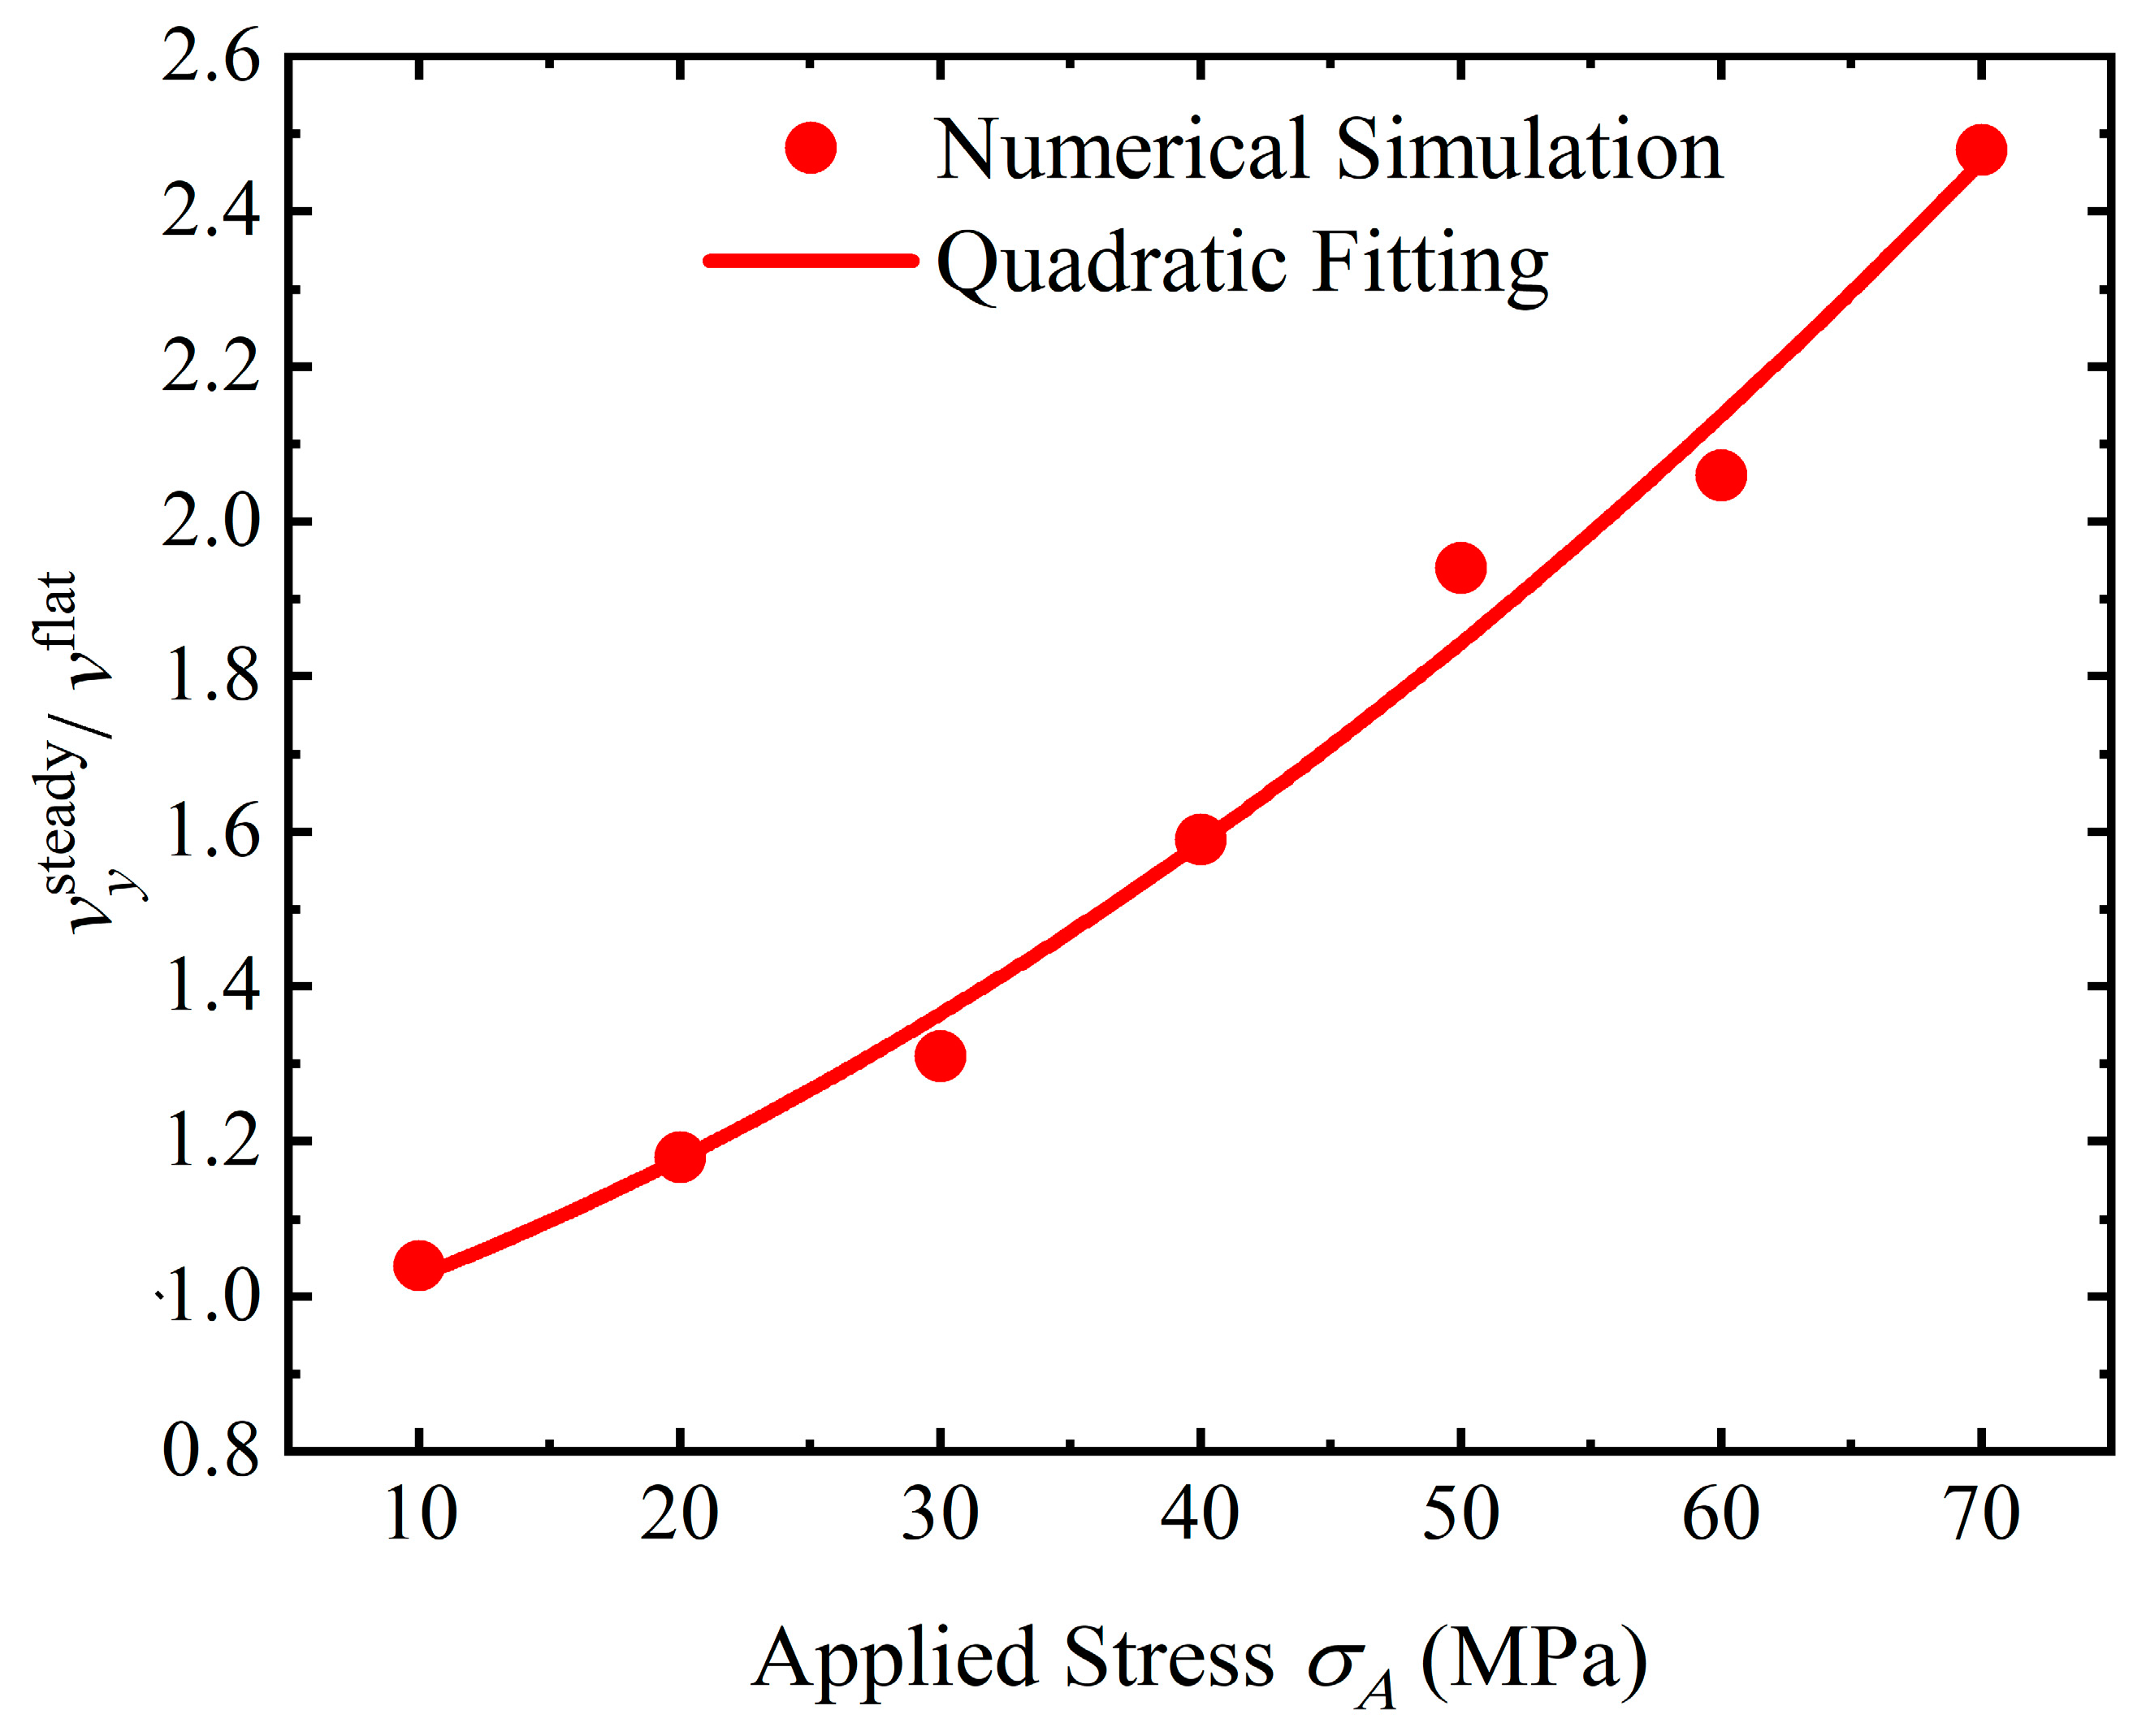
Once a steady state is reached, the vertical corrosion velocity v y is invariant along the surface, and v y also represents the thinning velocity of the structure. As a result, the service life of the structure is determined by v y under a steady state, which can be written as v y s t e a d y . For a stressed substrate with a flat surface, the corrosion rate v y f l a t is a constant along the surface. Thus, v y s t e a d y / v f l a t under the same load represents the corrosion acceleration ratio due to surface undulations. Figure 20 shows the distribution of the v y / v f l a t (when A * = 0.1 and σ A = 30 MPa ) along the surface under the initial and steady states. Due to the surface undulations, v y under the steady state is bigger than the corrosion velocity of the flat surface v f l a t . Therefore, the service life of the structure is reduced because of the surface undulations. As the v y equals v y s t e a d y along the surface under a steady state, v y s t e a d y / v f l a t represents the steady corrosion acceleration ratio of the corrosion morphology of a flat surface. With a rise in σ A , v y s t e a d y / v f l a t increases, and the quadratic fit is used to describe the relationship between the acceleration ratio and applied stress, as shown in Figure 21. With a fine correlation coefficient R 2 = 0.99 , the acceleration ratio and applied stress represent a quadratic function relationship: y = 1.77 × 10 4 x 2 + 9.77 × 10 3 x + 0.911 . This is because a different σ A makes different surface morphologies under a steady state, which leads to a different v y s t e a d y / v f l a t in the end. When A * = 0.1 and σ A = 50 MPa , v y s t e a d y / v f l a t = 1.94 , which means that the service life will half due to the surface undulations. In this case, the undulated surface will increase the corrosion rate when compared with the flat surface when under the same load, σ A .

5. Conclusions

In this paper, we investigated the effect of stress on the formation of morphologies and analyzed the influence of morphology on the service life of the structure using a numerical method. With the plane strain assumption, the corrosion morphology evolution of a 2D model with a sinusoidal surface was simulated. The critical values for the formation of different morphologies were acquired through the simulation results. Here are the main findings:
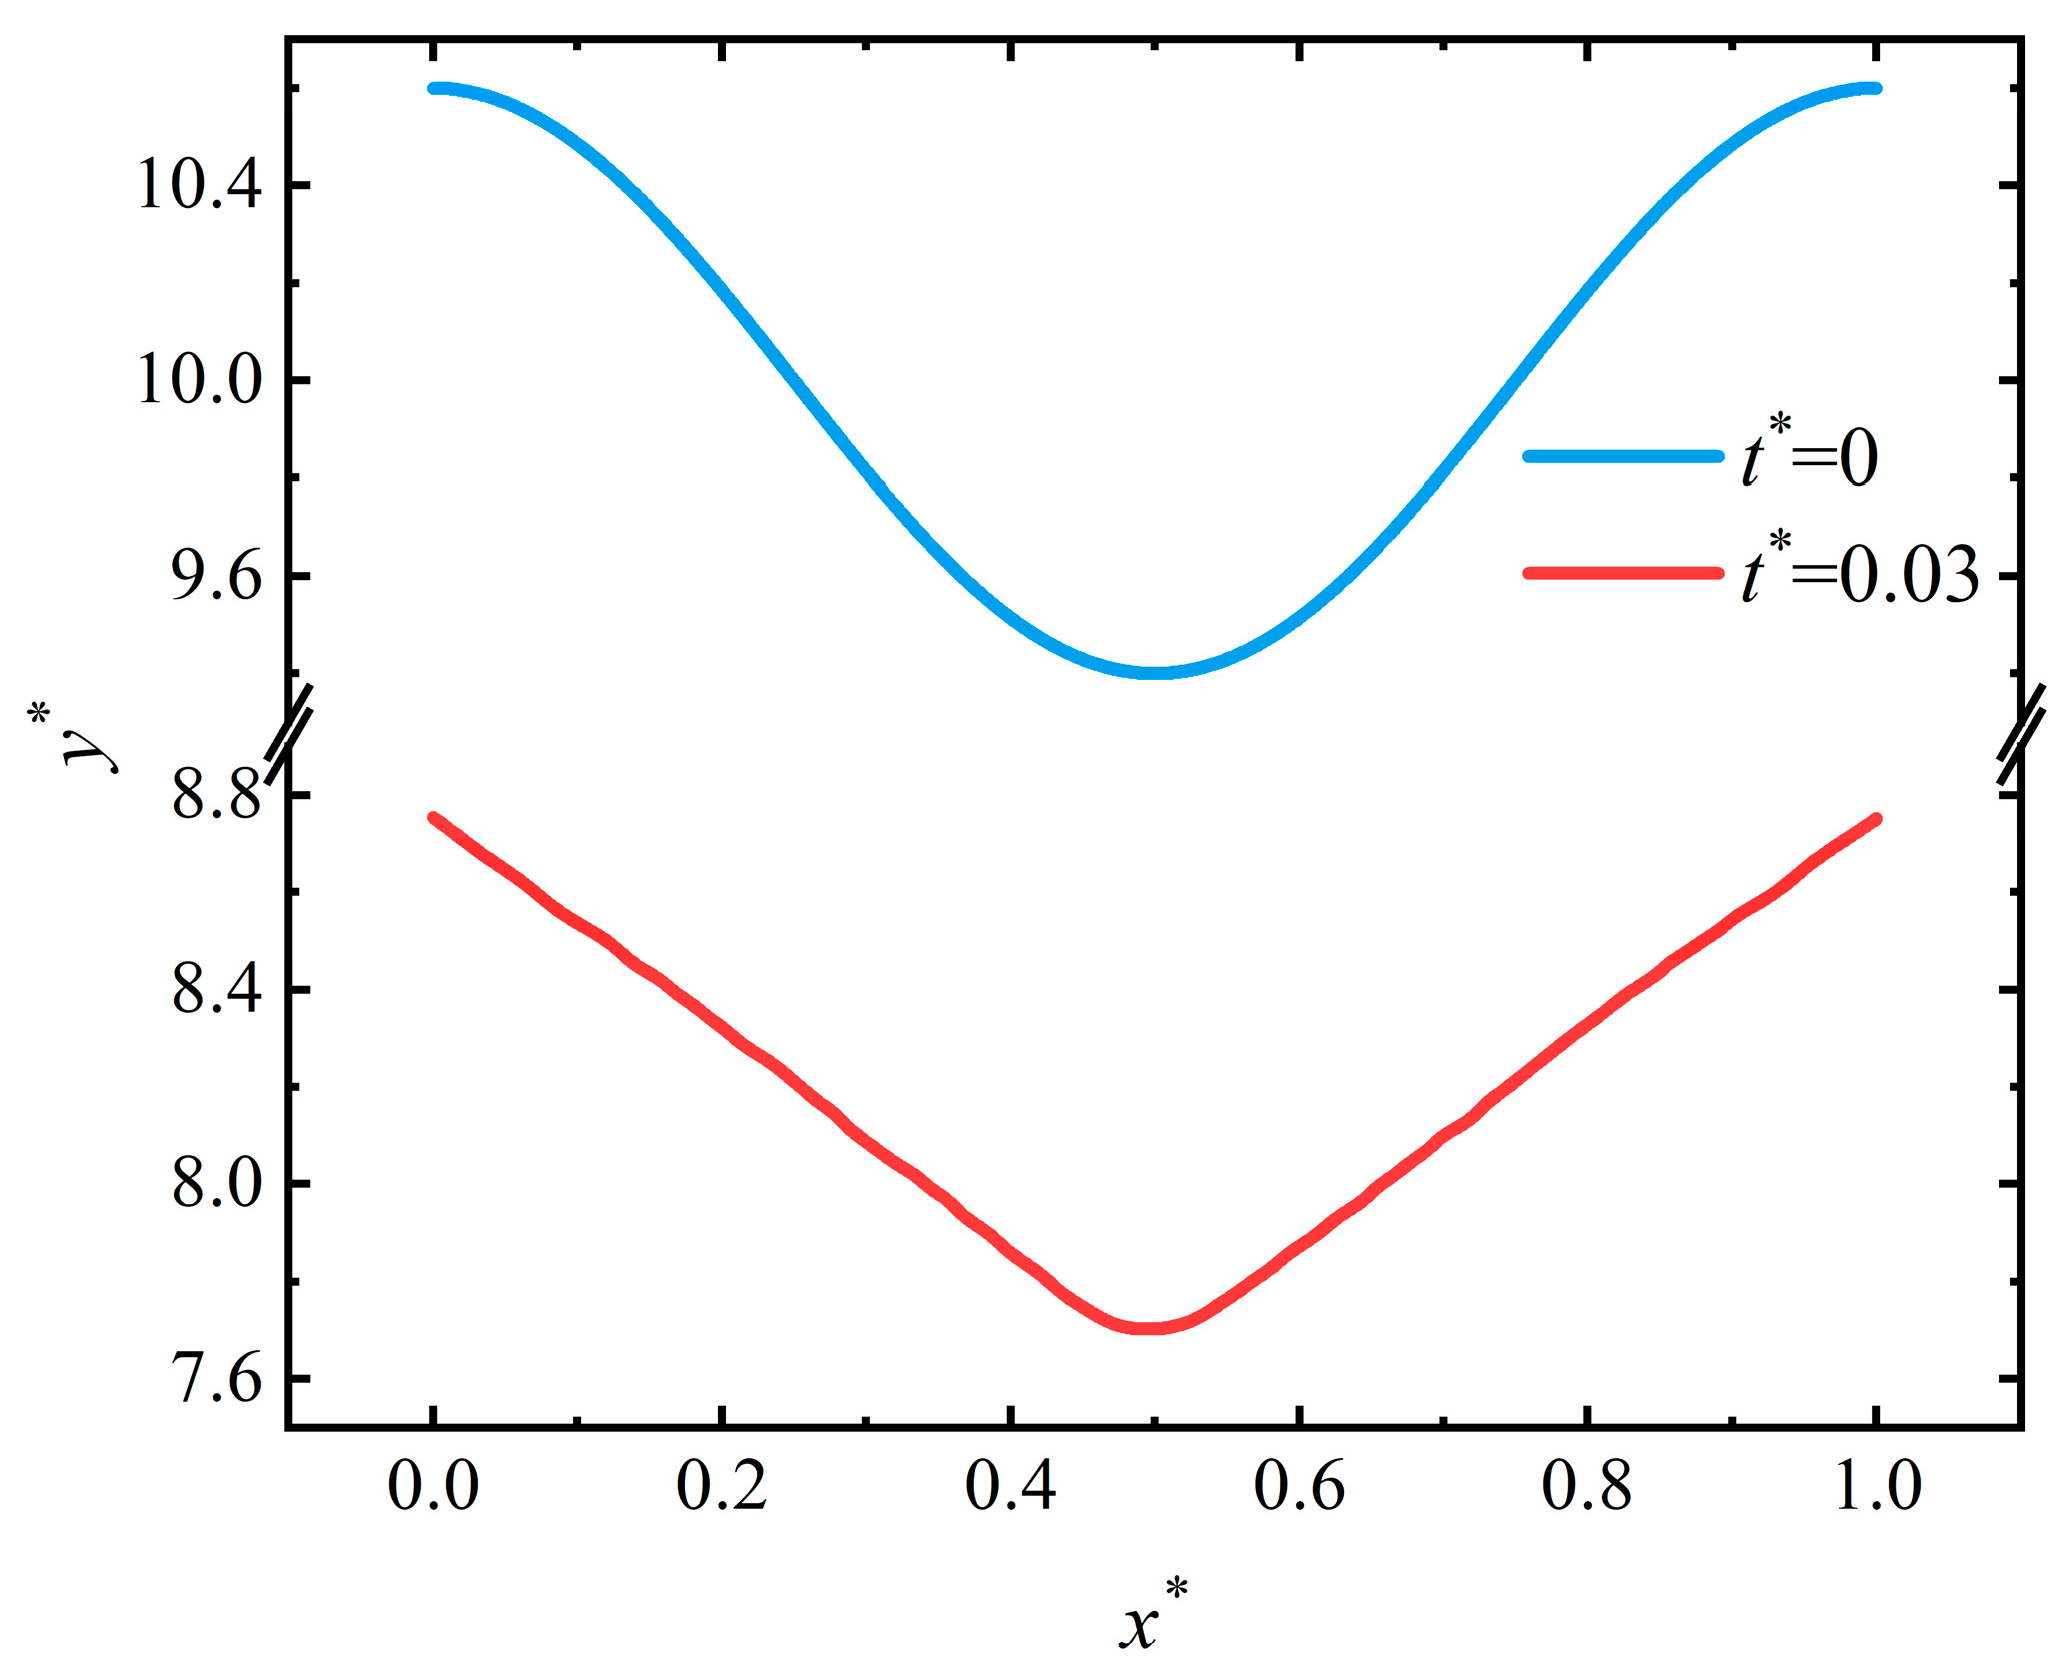
  • Stress could dominate the surface morphology evolution during corrosion. As stress increases, the corrosion morphology will transfer from a flat surface to a pit and then a crevice. The flatter surface and the corrosion pit are stable morphologies that will maintain a fixed shape. Once the stress exceeds the critical value for a crevice pattern, unstable crevices are generated on the surface;
  • For the stable corrosion morphology, surface roughness and maximum stress concentration under a steady state increase with an increase in the applied stress. When the applied stress exceeds the critical value for the pit pattern, the surface will become rougher than the initial state, i.e., a pit pattern. When the applied stress is below the critical value for pit patterning, the surface will become flatter during the corrosion process, i.e., the flattening pattern;
  • Stress can magnify the influence of morphologies on the service life of the structure. Once a crevice is generated on the surface, the service life will reduce dramatically. The initiation time for crevice generation is reduced as the applied stress rises. As a pit or flatter surface is formed, the service life of the structure is reduced when compared with the flat surface. Corrosion acceleration due to surface morphology presents a quadratically increasing relationship with a rise in the applied stress. In general, stress can reduce the service life of the structure with a rough surface by forming corrosion morphologies and increasing the dissolution rate.
Future work will include investigating the effect of stress on the formation of 3D corrosion morphologies. Additionally, material microstructures, such as grain size, can influence morphology evolution, which should be taken into consideration for many materials.

Author Contributions

Conceptualization, Z.D. and W.Z.; funding acquisition B.L.; investigation Z.D., P.J. and X.L.; methodology, Z.D., B.L. and W.Z.; software, Z.D. and M.H.; writing-original draft Z.D.; writing-review & editing M.H., P.J. and W.Z. All authors have read and agreed to the published version of the manuscript.

Funding

This work is supported by the National Natural Science Foundation of China or by NSFC (Grant Nos. U21B2058, 11972025, 11772246) National Science and Technology Major Project (2019-VII-0007-0147), by the Innovative Scientific Program of CNNC (J202107006-025), in part by Program for New Century Excellent Talents in University NCET-13-0466, in part by Natural Science Basic Research Plan in Shaanxi Province of China 2013GY2-14.

Data Availability Statement

The data presented in this work are available from the corresponding author upon reasonable request.

Acknowledgments

WX Zhang acknowledges support from China Scholarship Council. Finally, the authors thank Tony J. Zhang for polishing the language of the paper.

Conflicts of Interest

The authors declare that they have no conflict of interest.

Nomenclatures

A amplitude of sinusoidal wave u c corrosion depth
A * normalized amplitude u c * normalized corrosion depth
a 0 standard activity of the reactant V m molar volume
a s e mechano-electrochemical activity v corrosion rate
E elastic modulus v * corrosion rate
F Faraday constant v 0 initial corrosion rate of the un-stressed material
i c o r r corrosion current density v y vertical corrosion rate
i a anodic current density v y s t e a d y vertical corrosion rate at steady state
i c cathodic current density v f l a t corrosion rate of the flat surface
J mass flux z valence
K T stress concentration factor α , β transfer coefficients
K T max maximal stress concentration factor μ s e electrochemical potential
K T 0 initial stress concentration factor μ 0 standard chemical potential
K T c critical stress concentration factor for crevice initiation φ electrical potential
k 1 constant of forward reaction rate ρ density
k 2 constant of reverse reaction rate σ , τ stress components
M molar mass σ m mean stress
n normal vector σ A applied stress
R a surface roughness σ A c r e v i c e critical stress for crevice initiation
R a 0 initial surface roughness σ A p i t critical stress for pit generation
R gas constant ε , γ strain components
T temperature λ amplitude of sinusoidal wave
t time
t * normalized time
t crevice * crevice generation time

References

  1. Pronina, Y.; Sedova, O. Analytical Solution for the Lifetime of a Spherical Shell of Arbitrary Thickness Under the Pressure of Corrosive Environments: The Effect of Thermal and Elastic Stresses. J. Appl. Mech. 2021, 88, 061004. [Google Scholar] [CrossRef]
  2. Ståhle, P.; Hansen, E. Phase field modelling of stress corrosion. Eng. Fail. Anal. 2015, 47, 241–251. [Google Scholar] [CrossRef] [Green Version]
  3. Cui, C.; Ma, R.; Martínez-Pañeda, E. A phase field formulation for dissolution-driven stress corrosion cracking. J. Mech. Phys. Solids 2021, 147, 104254. [Google Scholar] [CrossRef]
  4. Zhu, L.; Cui, Z.; Cui, H.; Wang, X.; Li, Y. The effect of applied stress on the crevice corrosion of 304 stainless steel in 3.5 wt% NaCl solution. Corros. Sci. 2022, 196, 110039. [Google Scholar] [CrossRef]
  5. Cherry, B.; Price, S. Pitting, crevice and stress corrosion cracking studies of cold drawn eutectoid steels. Corros. Sci. 1980, 20, 1163–1183. [Google Scholar] [CrossRef]
  6. Sharland, S. A review of the theoretical modelling of crevice and pitting corrosion. Corros. Sci. 1987, 27, 289–323. [Google Scholar] [CrossRef]
  7. Li, Y.; Guo, X.; Zhang, G. Synergistic effect of stress and crevice on the corrosion of N80 carbon steel in the CO 2 -saturated NaCl solution containing acetic acid. Corros. Sci. 2017, 123, 228–242. [Google Scholar] [CrossRef]
  8. Burstein, G.T.; Pistorius, P. Surface Roughness and the Metastable Pitting of Stainless Steel in Chloride Solutions. Corrosion 1995, 51, 380–385. [Google Scholar] [CrossRef]
  9. Walter, R.; Kannan, M.B. Influence of surface roughness on the corrosion behaviour of magnesium alloy. Mater. Des. 2011, 32, 2350–2354. [Google Scholar] [CrossRef]
  10. Li, W.; Li, D. Influence of surface morphology on corrosion and electronic behavior. Acta Mater. 2006, 54, 445–452. [Google Scholar] [CrossRef]
  11. Xu, J.; Bai, Y.; Wu, T.; Yan, M.; Yu, C.; Sun, C. Effect of elastic stress and alternating current on corrosion of X80 pipeline steel in simulated soil solution. Eng. Fail. Anal. 2019, 100, 192–205. [Google Scholar] [CrossRef]
  12. Bocchi, S.; Cabrini, M.; D’Urso, G.; Giardini, C.; Lorenzi, S.; Pastore, T. Stress enhanced intergranular corrosion of friction stir welded AA2024-T3. Eng. Fail. Anal. 2020, 111, 104483. [Google Scholar] [CrossRef]
  13. Kentish, P. Stress corrosion cracking of gas pipelines–Effect of surface roughness, orientations and flattening. Corros. Sci. 2007, 49, 2521–2533. [Google Scholar] [CrossRef]
  14. Wang, S.; Lamborn, L.; Chen, W. Near-neutral pH corrosion and stress corrosion crack initiation of a mill-scaled pipeline steel under the combined effect of oxygen and paint primer. Corros. Sci. 2021, 187, 109511. [Google Scholar] [CrossRef]
  15. Zadow, L.; Gamboa, E.; Lavigne, O. Inclined stress corrosion cracks in gas pipeline steels: Morphology and implications. Mater. Corros. 2015, 66, 1092–1100. [Google Scholar] [CrossRef]
  16. Toribio, J.; Kharin, V. Factors Affecting the Intrinsic Character of the Crack Growth Kinetics Curve in Stress Corrosion Cracking: A Review. Corros. Rev. 2001, 19, 207–252. [Google Scholar] [CrossRef]
  17. Dai, H.; Shi, S.; Guo, C.; Chen, X. Pits formation and stress corrosion cracking behavior of Q345R in hydrofluoric acid. Corros. Sci. 2020, 166, 108443. [Google Scholar] [CrossRef]
  18. Chen, Z.; Jafarzadeh, S.; Zhao, J.; Bobaru, F. A coupled mechano-chemical peridynamic model for pit-to-crack transition in stress-corrosion cracking. J. Mech. Phys. Solids 2021, 146, 104203. [Google Scholar] [CrossRef]
  19. Ståhle, P.; Bjerkén, C.; Jivkov, A. On dissolution driven crack growth. Int. J. Solids Struct. 2007, 44, 1880–1890. [Google Scholar] [CrossRef] [Green Version]
  20. Sun, S.; Chen, X.; Badwe, N.; Sieradzki, K. Potential-dependent dynamic fracture of nanoporous gold. Nat. Mater. 2015, 14, 894–898. [Google Scholar] [CrossRef]
  21. Nisbet, W.; Lorimer, G.; Newman, R. A transmission electron microscopy study of stress corrosion cracking in stainless steels. Corros. Sci. 1993, 35, 457–469. [Google Scholar] [CrossRef]
  22. Gutman, E.M. Mechanochemistry of Solid Surfaces; World Scientific Publishing Company: Singapore, 1994. [Google Scholar]
  23. Gutman, E.; Solovioff, G.; Eliezer, D. The mechanochemical behavior of type 316L stainless steel. Corros. Sci. 1996, 38, 1141–1145. [Google Scholar] [CrossRef]
  24. Wang, H.; Han, E.-H. Simulation of metastable corrosion pit development under mechanical stress. Electrochim. Acta 2013, 90, 128–134. [Google Scholar] [CrossRef]
  25. Choi, K.Y.; Kim, S.S. Morphological analysis and classification of types of surface corrosion damage by digital image processing. Corros. Sci. 2005, 47, 1–15. [Google Scholar] [CrossRef]
  26. Betts, A.J.; Boulton, L.H. Crevice corrosion: Review of mechanisms, modelling, and mitigation. Br. Corros. J. 1993, 28, 279–296. [Google Scholar] [CrossRef]
  27. Rosenfeld, I.L.; Marshakov, I.K. Mechanism of Crevice Corrosion. Corrosion 2013, 20, 115t–125t. [Google Scholar] [CrossRef]
  28. Li, Y.; Wang, X.; Zhang, G. Corrosion behaviour of 13Cr stainless steel under stress and crevice in 3.5 wt.% NaCl solution. Corros. Sci. 2020, 163, 108290. [Google Scholar] [CrossRef]
  29. Ma, J.; Zhang, B.; Wang, J.; Wang, G.; Han, E.-H.; Ke, W. Anisotropic 3D growth of corrosion pits initiated at MnS inclusions for A537 steel during corrosion fatigue. Corros. Sci. 2010, 52, 2867–2877. [Google Scholar] [CrossRef]
  30. Fan, S.; Tian, C.; Liu, Y.; Chen, Z. Surface stability in stress-assisted corrosion: A peridynamic investigation. Electrochim. Acta 2022, 423, 140570. [Google Scholar] [CrossRef]
  31. Jafarzadeh, S.; Zhao, J.; Shakouri, M.; Bobaru, F. A peridynamic model for crevice corrosion damage. Electrochim. Acta 2022, 401, 139512. [Google Scholar] [CrossRef]
  32. Duddu, R.; Kota, N.; Qidwai, S.M. An Extended Finite Element Method Based Approach for Modeling Crevice and Pitting Corrosion. J. Appl. Mech. 2016, 83, 081003. [Google Scholar] [CrossRef]
  33. Tan, H. In vivo surface roughness evolution of a stressed metallic implant. J. Mech. Phys. Solids 2016, 95, 430–440. [Google Scholar] [CrossRef]
  34. Yang, H.-Q.; Zhang, Q.; Tu, S.-S.; Wang, Y.; Li, Y.-M.; Huang, Y. A study on time-variant corrosion model for immersed steel plate elements considering the effect of mechanical stress. Ocean Eng. 2016, 125, 134–146. [Google Scholar] [CrossRef]
  35. Qiao, L.; Mao, X. Thermodynamic analysis on the role of hydrogen in anodic stress corrosion cracking. Acta Met. Et Mater. 1995, 43, 4001–4006. [Google Scholar] [CrossRef]
  36. Pronina, Y. Analytical solution for the general mechanochemical corrosion of an ideal elastic–plastic thick-walled tube under pressure. Int. J. Solids Struct. 2013, 50, 3626–3633. [Google Scholar] [CrossRef] [Green Version]
  37. Vasudevan, A.K. Applied Stress Affecting the Environmentally Assisted Cracking. Met. Mater. Trans. A 2013, 44, 1254–1267. [Google Scholar] [CrossRef] [Green Version]
  38. Croll, S. Surface roughness profile and its effect on coating adhesion and corrosion protection: A review. Prog. Org. Coatings 2020, 148, 105847. [Google Scholar] [CrossRef]
  39. Späth, H. Two Dimensional Spline Interpolation Algorithms; A. K. Peters, Ltd.: Natick, MA, USA, 1995. [Google Scholar]
  40. Zienkiewicz, O.C.; Taylor, R.L.; Zhu, J.Z. (Eds.) Chapter 7-Elasticity: Two- and Three-Dimensional Finite Elements. In The Finite Element Method: Its Basis and Fundamentals, 7th ed.; Butterworth-Heinemann: Oxford, UK, 2013; pp. 211–255. [Google Scholar]
  41. Cheng, Z.; Zhang, Q.; Wang, D.; Lu, W. Cyclic stress-assisted surface diffusion and stress concentration of machined surface topography. Eng. Fract. Mech. 2020, 234, 107087. [Google Scholar] [CrossRef]
  42. Yang, W.; Srolovitz, D. Surface morphology evolution in stressed solids: Surface diffusion controlled crack initiation. J. Mech. Phys. Solids 1994, 42, 1551–1574. [Google Scholar] [CrossRef] [Green Version]
  43. Katardjiev, I.; Carter, G.; Nobes, M.; Berg, S.; Blom, H. Three-dimensional simulation of surface evolution during growth and erosion. J. Vac. Sci. Technol. A Vac. Surf. Film. 1994, 12, 61–68. [Google Scholar] [CrossRef]
  44. Kamaya, M.; Haruna, T. Crack initiation model for sensitized 304 stainless steel in high temperature water. Corros. Sci. 2006, 48, 2442–2456. [Google Scholar] [CrossRef]
  45. Kamaya, M.; Haruna, T. Influence of local stress on initiation behavior of stress corrosion cracking for sensitized 304 stainless steel. Corros. Sci. 2007, 49, 3303–3324. [Google Scholar] [CrossRef]
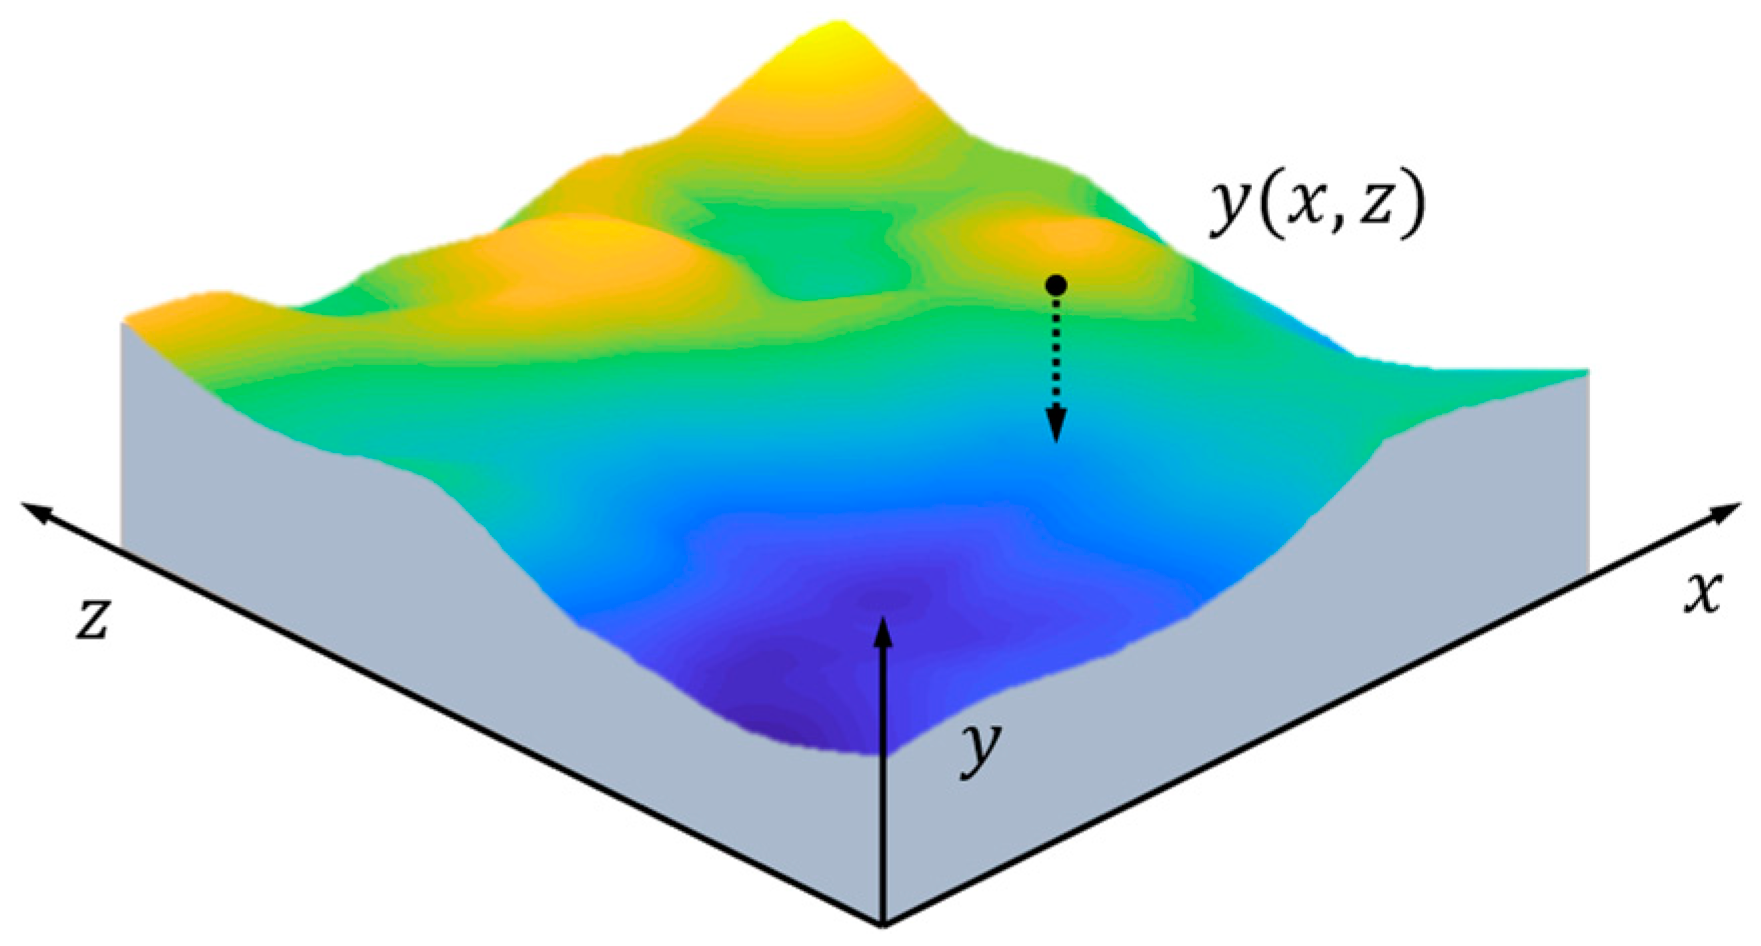
Figure 1. A 3D model of a substrate with a rough surface.
Metals 13 00108 g001
Figure 2. Preprocessing of biquadratic spline interpolation.
Metals 13 00108 g002
Figure 3. Procedure of tracking the surface movement under stress corrosion.
Metals 13 00108 g003
Figure 4. Flow chart for FEM [41].
Metals 13 00108 g004
Figure 5. A semi-infinite elastic substrate with a sinusoidal surface profile, which is evolving under stress corrosion.
Metals 13 00108 g005
Figure 6. Mechanical calculation model for FEM. Traction-free is taken at the surface, and the uniform displacement is applied at the vertical boundries. For the bottom boundry, the vertical displacement is fixed at zero.
Metals 13 00108 g006
Figure 7. Simulation procedure of the morphology evolution under stress corrosion.
Metals 13 00108 g007
Figure 8. (a) Surface morphology evolution process and (b) corrosion rate distribution when A * = 0.1 and σ A = 100 MPa .
Metals 13 00108 g008
Figure 9. Evolution of (a) the maximal stress concentration factor and (b) surface roughness during corrosion when A * = 0.1 and σ A = 100 MPa .
Metals 13 00108 g009
Figure 10. Crevice initiation time t c r e v i c e * for different σ A and A * .
Metals 13 00108 g010
Figure 11. (a) Surface morphology evolution process and (b) corrosion rate distribution when A * = 0.1 and σ A = 50 MPa .
Metals 13 00108 g011
Figure 12. Evolution of (a) maximal stress concentration factor and (b) surface roughness during the corrosion when A * = 0.1 and σ A = 50 MPa .
Metals 13 00108 g012
Figure 13. Evolution of (a) the maximal stress concentration factor and (b) surface roughness during corrosion when A * = 0.1 and σ A = 19 MPa .
Metals 13 00108 g013
Figure 14. Surface morphology evolution process when A * = 0.1 and σ A = 19 MPa .
Metals 13 00108 g014
Figure 15. (a) Maximal stress concentration factor and (b) surface roughness under a steady state for different applied stresses when A * = 0.1 .
Metals 13 00108 g015
Figure 16. (a) Surface morphology evolution process and (b) corrosion rate distribution when A * = 0.1 and σ A = 10 MPa .
Metals 13 00108 g016
Figure 17. Evolution of (a) maximal stress concentration factor and (b) surface roughness during corrosion when A * = 0.1 and σ A = 10 MPa .
Metals 13 00108 g017
Figure 18. Evolution of (a) maximal stress concentration factor and (b) surface roughness during corrosion when A * = 0.6 and σ A = 30 MPa .
Metals 13 00108 g018
Figure 19. Surface morphology evolution process when A * = 0.6 and σ A = 30 MPa .
Metals 13 00108 g019
Figure 20. Distribution of the corrosion acceleration ratio v y s t e a d y / v f l a t along the surface under initial and steady states when A * = 0.1 and σ A = 30 MPa .
Metals 13 00108 g020
Figure 21. Corrosion acceleration ratio of the steady corrosion morphology of the flat surface v y s t e a d y / v f l a t under different applied stresses when A * = 0.1 .
Metals 13 00108 g021
Disclaimer/Publisher’s Note: The statements, opinions and data contained in all publications are solely those of the individual author(s) and contributor(s) and not of MDPI and/or the editor(s). MDPI and/or the editor(s) disclaim responsibility for any injury to people or property resulting from any ideas, methods, instructions or products referred to in the content.