Article

The Effect of Fatigue Damage on the Corrosion Fatigue Crack Growth Mechanism in A7N01P-T4 Aluminum Alloy

1
School of Materials Science and Engineering, Xihua University, Chengdu 610039, China
2
Beijing GAONA Materials and Technology Co., Ltd., Beijing 100081, China
3
Applied Mechanics and Structure Safety Key Laboratory of Sichuan Province, School of Mechanics and Aerospace Engineering, Southwest Jiaotong University, Chengdu 610031, China
4
School of Engineering Training Center, Southwest Jiaotong University, Chengdu 610031, China
*
Author to whom correspondence should be addressed.
Metals 2023, 13(1), 104; https://doi.org/10.3390/met13010104
Submission received: 18 November 2022 / Revised: 28 December 2022 / Accepted: 29 December 2022 / Published: 4 January 2023
(This article belongs to the Special Issue Corrosion and Wear Behavior of Metals)

Abstract

:
A7N01P-T4 aluminum alloy plates for high-speed trains will experience a certain amount of fatigue damage under alternating loads. Three groups of samples, P0 (no fatigue damage), P1 (loading stress 30 MPa), and P2 (loading stress 70 MPa), were created, and corrosion fatigue crack growth (CFCG) tests were conducted in 3.5 wt.% NaC1 solution. The crack growth rate was found to increase after fatigue damage as the damage degree increased. In addition, the A7N01P-T4 aluminum alloy base metal exhibited obvious secondary cracks and crack bifurcations after fatigue damage. It is believed that fatigue damage causes stress concentration in the material, while a certain degree of stress corrosion cracking occurs during the CFCG growth process. This is because hydrogen (H) easily accumulates and diffuses along the grain boundary, which reduces the strength of the grain boundary, thereby becoming the preferred orientation for crack growth. This explains why the CFCG rate of the material is accelerated following fatigue damage to a certain extent.

1. Introduction

As high-speed trains have developed in recent years, the high-speed railway in China has entered a new era. To reduce the dead weight of high-speed trains, improve energy utilization efficiency, and satisfy the needs of being lightweight, a significant number of high-strength aluminum alloy materials are currently used as key components in high-speed train bodies and sleeper beams [1,2,3]. As an Al–Mg–Zn series high-strength aluminum alloy, A7N01 is widely used in the construction of space shuttles and high-speed trains due to its lightweight, low density, high strength, and easy processing advantages [4,5,6]. In comparison to traditional materials, the weight of a car body made from A7N01 aluminum alloy material is 35% less than that made from stainless steel, weathering steel, or other materials. Therefore, with the same traction conditions, an aluminum alloy car body can improve the load while reducing energy consumption. At the same time, aluminum alloy has stronger corrosion resistance than weathering steel [7,8].
Fatigue is the fracture phenomenon that is caused by the accumulation of mechanical damage to metal and its structural parts under the action of long-term load. Fatigue fracture damage accounts for over 80% of the total failure form. Therefore, scholars have widely studied the fatigue fracture of metal materials both domestically and abroad for a long time [9,10,11,12]. Corrosion fatigue is a corrosion mechanical failure of metal materials in an alternating load and corrosion environment. It is not a simple superposition of corrosion and fatigue damage but rather a process of mutual promotion between corrosion and fatigue damage. In the actual service conditions of high-speed trains, as they are exposed to numerous complex and diverse environmental conditions, including humid environment, marine atmosphere, and industrial waste environment, Cl, NO3, and other corrosive media can result in corrosion damage to aluminum alloy materials [1,13,14,15]. In addition, the aluminum alloy car body of high-speed trains bears a continuous constant load and alternating cyclic load for prolonged periods of time while in service, which results in a certain degree of fatigue damage to the aluminum alloy material. However, the influence mechanism of fatigue damage on corrosion fatigue crack growth has not been widely studied. The service reliability of key structural parts of the aluminum alloy car body of high-speed trains is important for guaranteeing safe train operation. Therefore, studying the corrosion fatigue crack growth behavior of A7N01 aluminum alloy at different fatigue damage levels to determine the fracture performance of materials in service is of great significance and engineering value [16,17,18,19,20].
This paper focuses on the corrosion fatigue crack growth behavior of unserviced A7N01P-T4 aluminum alloy base metal after fatigue damage to varying degrees using the modified single notch specimen (SENT specimen). This will help determine the corrosion fatigue crack growth mechanism of A7N01P-T4 aluminum alloy base metal after fatigue damage, which has an important reference value for corrosion protection and enhancing the performance of aluminum alloy materials in high-speed trains.

2. Materials and Methods

2.1. Materials

The experimental material is A7N01P-T4 aluminum alloy base material, and the factory state is a 14 mm thick aluminum alloy plate. The A7N01P-T4 aluminum alloy plate is processed into standard fatigue samples through wire cutting, and sample thickness is 10 mm.
The fatigue limit of A7N01P-T4 aluminum alloy base metal is 130 MPa [14], and the cyclic load that is borne by high-speed trains during operation is far lower than the fatigue limit. Therefore, three groups of fatigue-damaged samples: P0 (no fatigue damage); P1 (loading stress 30 MPa); and P2 (loading stress 70 MPa), were established. The fatigue test loading stress cycle curve can be seen in Figure 1a,b, and the specific fatigue test parameters can be seen in Table 1. The standard fatigue specimen of A7N01P-T4 aluminum alloy base material was pre-loaded with fatigue damage using a QBG-100 high-frequency fatigue testing machine, and the number of cycles was 107. The fatigue sample after fatigue damage is shown in Figure 1d. It is evident that the macro size of the fatigue-damaged sample does not change as the dynamic and static loads mainly act on the interior of the material. Processing was conducted based on the size of the small sample of crack growth that is shown in Figure 1c, and the sampling location can be seen in Figure 1d.

2.2. Microstructure

The metallographic samples were ground using sandpaper with different grit sizes of 180–2000, and the samples were polished using a polishing machine until no scratches remained on their surfaces. After polishing, the samples were cleaned with alcohol and mixed with acid (2% HF, 3% HCL, 5% HNO3, 90% H2O), with a chemical etching time of 15 s [1]. The microstructure of the A7N01P-T4 aluminum alloy was then observed using a Zeiss microscope. For samples with corrosion fatigue crack propagation, the crack orientation was observed using an ultra-depth of field and stereo microscope. A tensile machine was then used to break the sample, the fracture was sawn, and it was ultrasonically cleaned with alcohol. An optical microscope (OM) (model of equipment: Zeiss-A1M, Carl Zeiss AG, Oberkochen, Germany) and scanning electron microscope (SEM) (model of equipment: JSM-6490LV, JEOL, Tokyo, Japan) were used to observe the fracture of the corrosion fatigue crack growth sample. The element types and product components were then analyzed. Using electron back-scattered diffraction (EBSD) (model of equipment: NordlysNano, Oxford Instruments, Oxford, UK), the distribution of secondary phases and grain boundaries was investigated analytically. All samples were then electropolished in an electrolyte consisting of 10% roach acid and 90% ethanol. The electropolishing process was run at 25 V for a polishing time of 40 s.

2.3. Electrotesting

To obtain the electrochemical properties of fatigue-damaged samples with different degrees, the size of 10 mm × 10 mm ×10 mm was used for the parallelepiped sample. With the exception of the test surface, the rest of the sample was coated and sealed with 704 silica gel. After the sample was completely cured, the test surface was treated to make it smooth, placed in an alcohol solution for 15 min of cleaning, removed, and then blow-dried. CS310 electrochemical workstation was used for conducting electrochemical tests, which were conducted in a three-electrode system. Saturated calomel electrode and platinum sheet were used as the reference and auxiliary electrode, and the sample was the working electrode [21]. The test solution was 3.5 wt.% NaC1. Before polarization, the sample was placed in the electrolyte solution for 30 min to ensure system stability. Dynamic potential scanning was performed at a scanning rate of 1 mV/s regarding the open circuit potential of −500 mV to 500 mV. The frequency range of electrochemical impedance was between 105 Hz and 0.01 Hz.

2.4. Corrosion Fatigue Crack Propagation

A corrosion fatigue crack propagation test was conducted using a vertical fatigue testing machine. To simulate the corrosion effect of seawater corrosion on the sample, the corrosion environment was set as 3.5 wt.% NaCl solution, fatigue crack length was measured using the flexibility method, and the measured accuracy of the sample was no less than 0.01 mm. The measurement gap opening displacement was calibrated based on the GB/T 12160-2002 [22] standard. The maximum axial loading force was 3.5 KN, the frequency was F = 0.5 Hz, the waveform was a sine wave, and the stress ratio was 0.1. Based on the standard GB/T 2012.2-2006 [23], the sample was pre-cracked, and the length of the pre-crack was recorded as approximately 2 mm. During testing, data for the number of cycles N and crack length a were collected in real-time. Referring to the standard GB/T 6398-2017 [24] “Fatigue of Metal Materials”, the seven-point incremental polynomial data processing adopted the method that is specified in the “Crack Growth Rate Test Method”. The data was processed using a VB programming program, and the CFCG behavior was then described based on the relationship between crack growth rate (da/dN) and the range of the stress intensity factor K.
Δ K = Δ P B W × 2 + α ( 1 α ) 3 / 2 × ( 0.886 + 4.64 α 13.32 α 2 + 14.72 α 3 5.6 α 4 )
d a d N = C ( Δ K )   2
In the formula, α = a/W, a is crack length, W is sample width, B is sample thickness, ΔP is load amplitude, N is the number of stress cycles, C and m are constants related to the material, and ΔK is stress intensity factor variation range.
The results obtained were compared for all conditions as a means of considering the stage II region of the da/dN × ΔK curves. Values of the Paris-Erdogan coefficients C and m were obtained for all tested conditions in stage II of the tests. The values were then plotted based on the equation da/dN = C × (ΔK)m, where m is the coefficient of the linear regression and C is the coefficient obtained by the extension of the plotted line.

3. Results

3.1. Microstructure

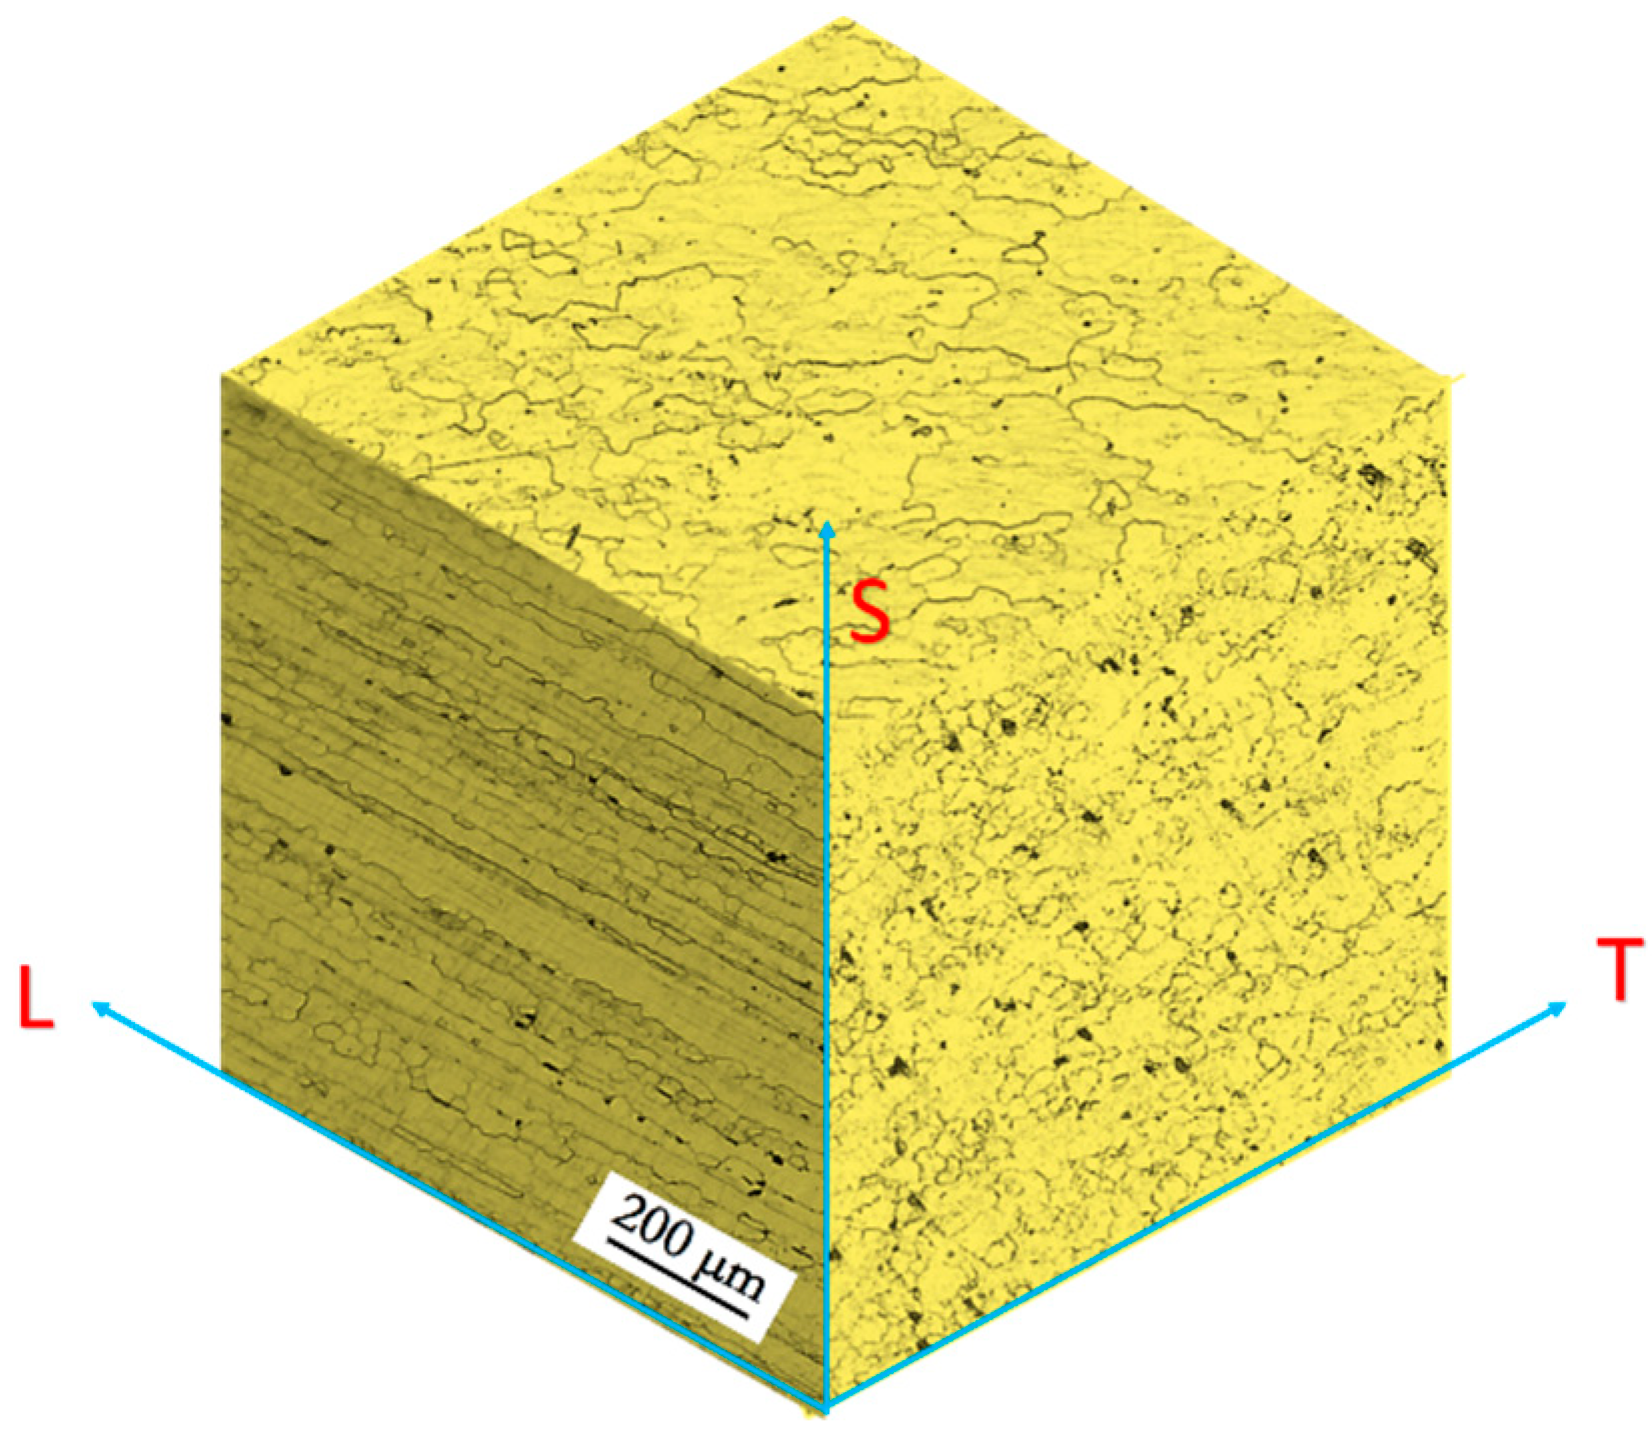
The three-direction microstructure of A7N01P-T4 aluminum alloy can be seen in Figure 2, where the directions are rolling (L), long transverse direction (T), and thickness (S). The grains in the L-T plane are arranged in a uniform manner, and plastic deformation is negligible. The grains in the L-S plane are “flattened”, and the grains exhibit obvious fibrous features along the rolling direction.

3.2. Electrochemical Analysis

An electrochemical workstation was used for conducting dynamic potential scanning on fatigue-damaged samples of different degrees in 3.5 wt.% NaC1 solution and the polarization curves of the three samples that were obtained can be seen in Figure 3a. The self-corrosion potential Ecorr and self-corrosion current density Icorr were obtained by fitting the polarization curves (Table 2). The test results demonstrate that the three samples did not have different self-corrosion potentials.
The electrochemical impedance spectra of fatigue-damaged samples at different levels are shown in Figure 3b. Nyquist diagrams all demonstrate a capacitive arc. According to the principle of electrochemical impedance testing, the radius of a capacitive arc in the electrochemical impedance spectrum directly reflects material surface polarization resistance. The larger the capacitive arc radius, the greater the polarization resistance of the material and the better the corrosion resistance. The fitting electrochemical parameters of the electrochemical impedance spectra are shown in Table 3, where Rs represents solution resistance, CPE-T is interface capacitance, CPE-P is the dispersion index of the curve, and Rp is polarization resistance. The table shows that the capacitive reactance arc radius increases significantly as the damage degree increases. Figure 3c, and 3d Bode plots and Table 3 impedance parameters demonstrate that the Rp value under fatigue damage P2 state is significantly lower than P1 and P0, thereby indicating that the corrosion resistance of the material is significantly reduced following fatigue damage.

3.3. Corrosion Fatigue Crack Growth Rate Curve

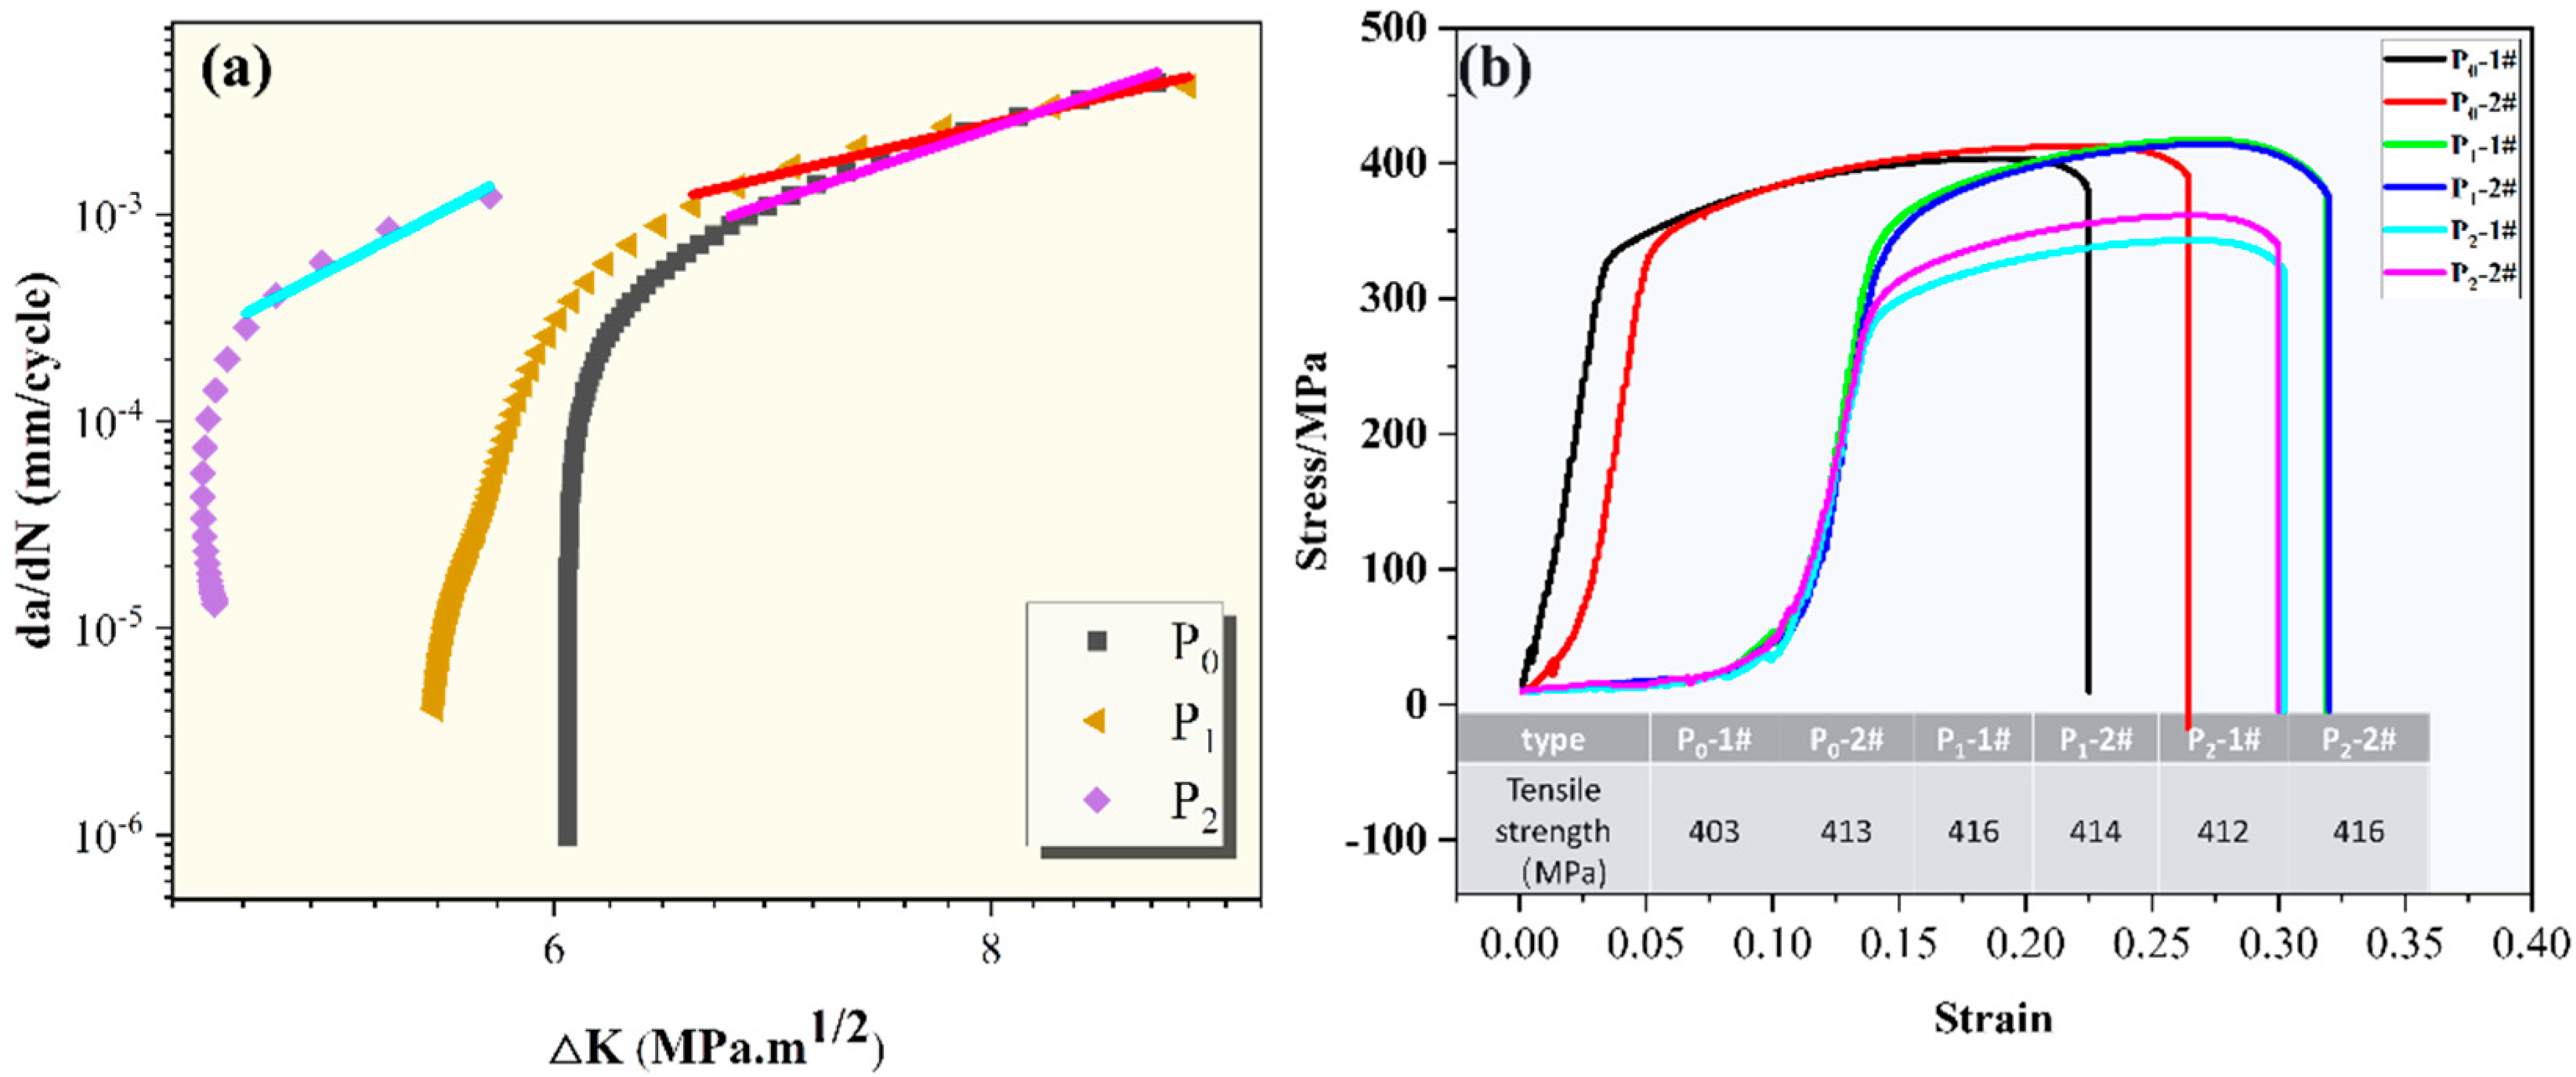
It can be seen from the corrosion fatigue crack growth curves under different fatigue damage states that the corrosion fatigue crack growth thresholds of fatigue damage samples P1 (loading stress 30 MPa) and P2 (loading stress 70 MPa) decrease with the increase of fatigue damage in 3.5 wt.% NaCl solution (Figure 4a). The corrosion fatigue crack growth rate increases as P0 (without fatigue damage) increases. Fatigue damage P2 with a loading stress of 70 MPa has the fastest corrosion fatigue crack growth rate.
The tensile strength of A7N01P-T4 aluminum alloy base metal under different fatigue damage can be seen in Figure 4b. The tensile strength of the A7N01P-T4 aluminum alloy sample increases after fatigue damage, and the lowest tensile strength of the sample without fatigue damage is 408 MPa. The tensile strength of sample P1 is 415 MPa, and for sample P2, it is 414 MPa. In comparison to tensile strength without mechanical damage, the overall difference is minimal. Table 4 shows the Paris formula fitting results of the CFCG rate in 3.5 wt.% NaCl solution.

3.3.1. Fracture Morphology of Corrosion Fatigue Crack Growth

The corrosion fatigue crack growth micro-fracture of A7N01P-T4 aluminum alloy base metal under different fatigue damage can be seen in Figure 5. In fatigue-damaged samples P1 and P2, a small number of secondary cracks were found on the corrosion fatigue crack growth fracture, and intergranular fracture and transgranular fracture morphological characteristics were observed on the fracture. The secondary crack was caused by the local stress concentration at the crack tip during the process of corrosion fatigue crack growth, resulting in the crack surface tearing. Generally, the secondary crack appears in the area where the second phase is densely distributed between adjacent fatigue strip gaps or grain boundaries. The fracture surface after fatigue damage results in a hydrogen embrittlement phenomenon. At higher multiples, the corrosion fatigue crack propagation fracture surface after fatigue damage has fatigue striations and holes formed by more second phase shedding. The 3.5 wt.% NaCl solution corrodes the micro surface of the fracture surface, and the relative vagueness of the fatigue striation of the corrosion fatigue crack sample fracture surface, but fatigue striations with different spacing are still evident locally. The fatigue stripe spacing of the sample P0 without fatigue damage is approximately 0.6 μm, and the fatigue stripe spacing of fatigue-damaged specimens P1 and P2 are 1.1 μm and 2.2 μm. The crack growth rate is reflected by the fatigue striation spacing to a certain extent. As the crack growth rate increases, fatigue striation spacing also increases, and the fatigue striation spacing of P2 is the largest. This is in accordance with the test results of P2 with the fastest crack growth rate, and both are verified. In addition, bright undulating bands can be observed in the SEM images, which is potentially due to fatigue stress damage to the crack tip. This proves that fatigue damage reduces the corrosion fatigue crack growth resistance of A7N01P-T4 aluminum alloy base metal.

3.3.2. Path Analysis of Corrosion Fatigue Crack Growth

The macro path of corrosion fatigue crack growth of the non-fatigue-damaged sample A7N01P-T4 aluminum alloy base metal can be seen in Figure 6a. The figure shows that the corrosion fatigue crack growth steady-state growth zone has a large crack width, the crack tip is small and sharp, and the corrosion fatigue crack growth path exhibits no obvious crack deflection. From the morphology of the crack tip in Figure 6a at high multiples, it can be seen that the crack tip growth path is relatively straight, and there are fewer secondary cracks in the crack tip. The secondary crack direction is always the same as the corrosion fatigue crack growth direction, and there is no crack bifurcation at the crack tip. The P1 crack growth path of the A7N01P-T4 aluminum alloy base metal fatigue-damaged sample is shown in Figure 6b, and it can be seen that the overall crack is relatively tortuous. Obvious secondary cracks and crack deflection can be observed in some areas of the corrosion fatigue crack growth path, but no crack bifurcation is evident in the crack tip. The P2 crack growth path is shown in Figure 6c, and the overall crack is relatively tortuous. Secondary cracks and crack deflection are evident in some areas of the corrosion fatigue crack growth path, and the corrosion fatigue crack tip is sharp. From the corrosion fatigue crack growth micro-fracture, it can be observed that the fracture surface of the sample has some holes that are formed by the falling off of second phase particles after fatigue damage. The bonding force between the second phase and the matrix in the aluminum alloy is believed to decrease following fatigue damage. As was previously mentioned, second phase particle distribution has a more significant impact on the corrosion fatigue crack growth path, and the holes that are formed by the second phase falling off will produce stress concentration, which results in secondary crack initiation. By comparing the morphology corrosion of the crack growth path of fatigue-damaged samples P0 and P1, it can be seen that the secondary crack and crack bifurcation of fatigue-damaged sample P2 are both smaller. The fracture surface shows there to be many secondary cracks distributed on the corrosion fatigue crack growth fracture surface of the sample following fatigue damage, which is in accordance with the corrosion fatigue crack growth path results. There are believed to be two growth mechanisms for the corrosion fatigue crack growth process of the sample following fatigue damage: hydrogen embrittlement and anodic dissolution. The crack growth mechanism of the sample without fatigue damage is more inclined toward anodic dissolution.
The EBSD results at the corrosion fatigue crack tip of A7N01P-T4 aluminum alloy under different fatigue damage levels are shown in Figure 7. From Figure 7a, the Inverse Pole Figure(IPF) diagram of the crack tip without fatigue damage can be seen. The analysis of the IPF diagram demonstrates that the crack is mainly transgranular during the growth process. Figure 7b shows the grain boundary distribution morphology at the crack tip of A7N01P-T4 aluminum alloy, green representing small angle grain boundaries. A large number of small green angle grain boundaries are evenly distributed around the crack tip, which indicates the plastic deformation at the crack tip of A7N01P-T4 aluminum alloy base metal without mechanical damage has relative uniformity during crack propagation. The Kernel average misorientation(KAM) diagram of the A7N01P-T4 aluminum alloy base metal crack tip is shown in Figure 6c, where green represents irregular residual strain. The residual strain can be seen to be uniformly distributed near the crack tip, which corresponds to the small angle grain boundary distribution that is evident in Figure 7b. Therefore, uniform plastic deformation occurs close to the crack during corrosion fatigue crack growth. The IPF diagram of the P1 corrosion fatigue crack tip is shown in Figure 7d. Analysis of the IPF diagram found the crack to be mainly transgranular growth with a small amount of intergranular growth. The distribution pattern of grain boundaries at the crack tip of A7N01P-T4 aluminum alloy fatigue- damaged sample P1 (loading stress 30 MPa) is shown in Figure 7e. The grains of the sample are obviously changed following fatigue damage compared to the grains without mechanical damage. Many fine grains are uniformly distributed around the larger grain circumference, and a large number of small green-angle grain boundaries are evenly distributed around the crack tip. This demonstrates that the plastic deformation at the crack tip of fatigue damage specimen P1 exhibits a certain degree of non-uniformity during crack growth. The KAM diagram of the P1 crack tip, which also shows the inhomogeneity of plastic deformation, is shown in Figure 7f, while Figure 7g shows the IPF diagram of the P2 crack tip. The analysis found the crack to be mainly transgranular during the growth process, but there is also intergranular growth, and the proportion of intergranular growth is greater than that of P0 and P1. The grain boundary distribution topography of the P2 crack tip is shown in Figure 7h, and the grain is thicker than that of P0 and P1. In the KAM diagram of the P2 crack tip, it can be observed that there is a more obvious heterogeneity of residual strain on the growth path. This corresponds to the small angle grain boundary distribution that is shown in Figure 7e.

4. Discussion

4.1. The Effect of Fatigue Damage on Microstructure

The fatigue damage of A7N01P-T4 aluminum alloy affects its corrosion fatigue crack propagation behavior. Following fatigue damage, the microstructure of A7N01P-T4 aluminum alloy changes due to material deformation. The composition, microstructure, grain size, and corrosion products that are produced during corrosion fatigue are all internal factors that affect corrosion fatigue crack propagation. There is no obvious effect on the middle steady crack growth zone by the microstructure of metal material [25,26,27,28], but it has a greater impact on the near-threshold area during the crack initiation stage. Generally, the more grain boundaries there are in the material structure, the stronger the resistance of the material will be to corrosion fatigue crack growth. After fatigue damage, the aluminum alloy structure is more disordered, and the grain deformation is serious. This is the main reason for reduced resistance to crack growth in the material. Fatigue damage generally reduces the corrosion fatigue crack growth threshold of A7N01P-T4 aluminum alloy. The fatigue-damaged samples P1 and P2 corrosion fatigue crack growth threshold reduce as the fatigue damage degree increases. After fatigue damage, a certain amount of dislocation density and damage is introduced inside the material of the sample. The change in tensile strength of the specimen following fatigue damage demonstrates that the dislocation density that is introduced does not hinder corrosion fatigue crack growth, and material defects reduce the corrosion fatigue crack growth threshold value instead.
After fatigue damage, the A7N01P-T4 aluminum alloy corrosion fatigue crack growth process involves anodic dissolution and hydrogen embrittlement. Crack deflection is the main basis for distinguishing hydrogen embrittlement and anodic dissolution from crack growth morphology. Following fatigue damage, the crack growth path exhibits obvious crack bifurcation, which indicates that a certain degree of stress corrosion cracking occurs, and the crack growth rate is accelerated to a certain extent.

4.2. Fatigue Damage Promotes Stress Corrosion Cracking

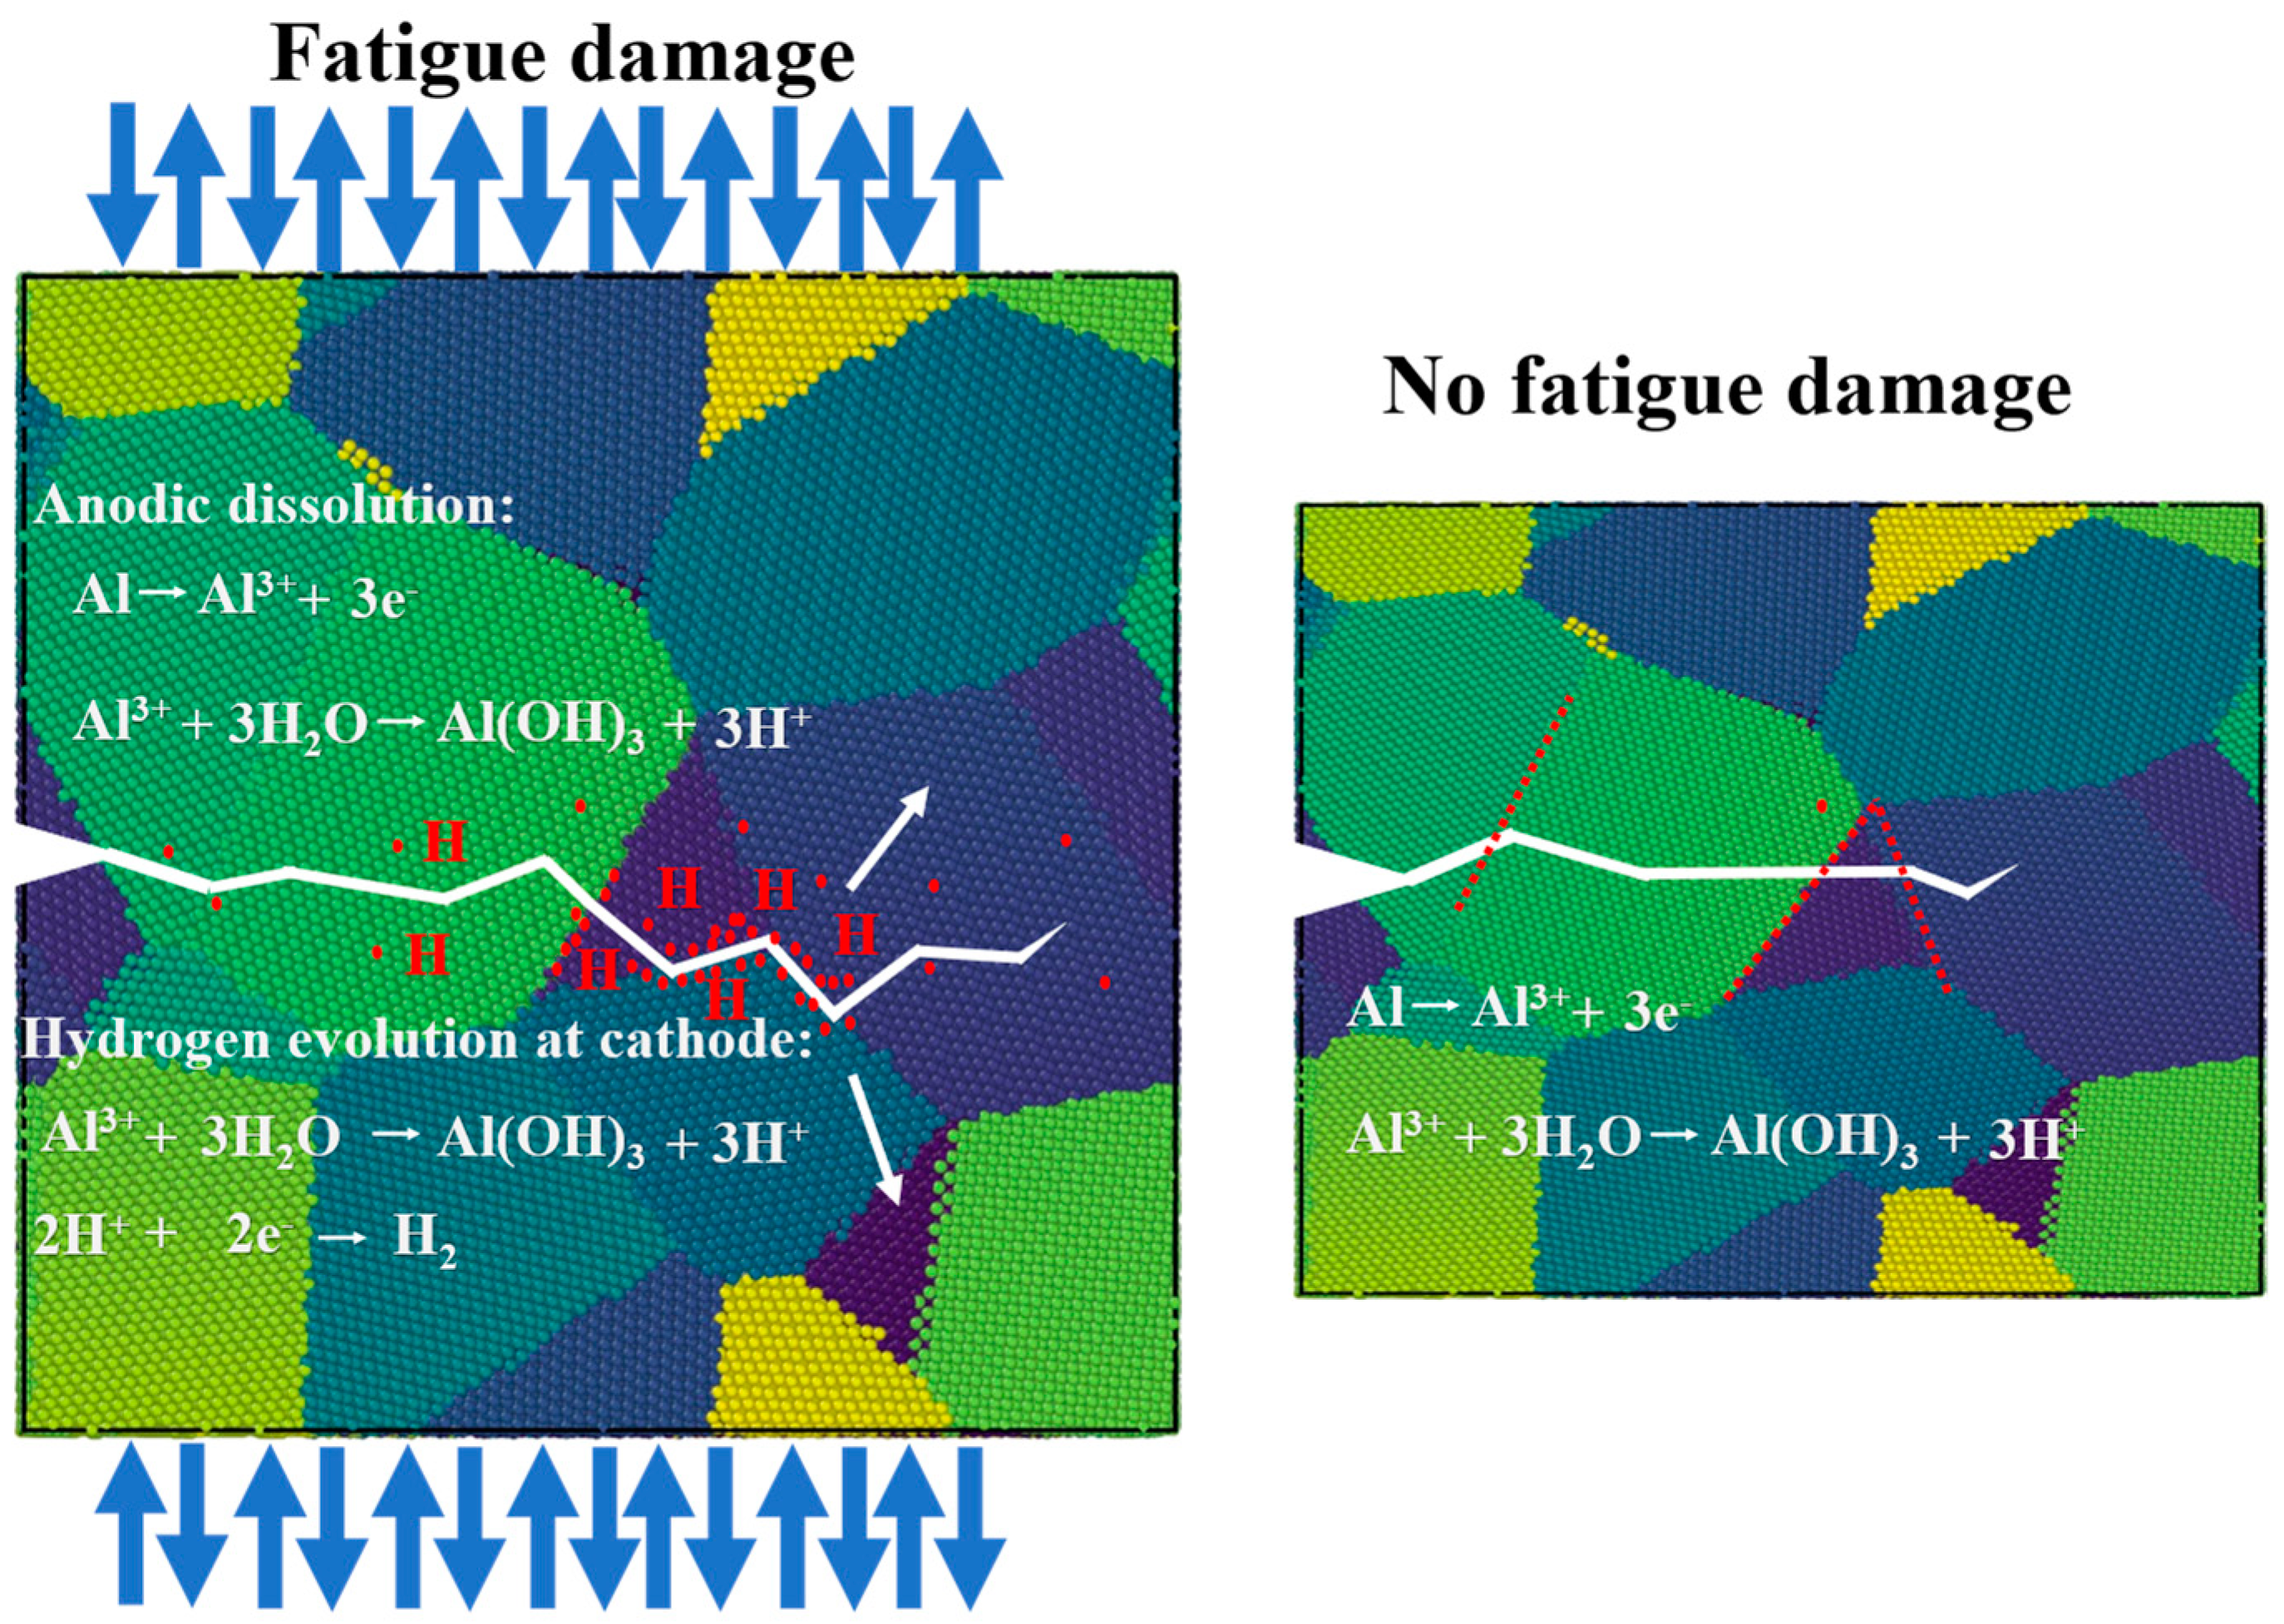
The corrosion fatigue crack growth curve of metal materials can be divided into three types: corrosion fatigue type, stress corrosion type, and mixed type [29,30,31]. The mixed type possesses the characteristics of corrosion fatigue type and stress corrosion type and is incredibly representative [32,33,34,35,36]. Shen Lin [14] studied the corrosion fatigue and stress corrosion crack growth behavior of A7N01P-T4 aluminum alloy base metal, finding the corrosion fatigue crack growth rate to be three orders of magnitude higher than the stress corrosion crack growth rate. Li [37] found 6151-T6 aluminum alloy to have crack initiation at the corrosion pit, the early crack growth behavior of the material described by KI/KII mixed mode. Chih Kuang [38] performed a comparison and analysis of the crack growth behavior of 7050-T73 aluminum alloy base metal in a corrosive environment and air, finding the fatigue life of materials in a corrosive environment to be significantly reduced. In addition, establishing a model that reflects the corrosion fatigue crack growth behavior of different materials is quite difficult as a result of differences in corrosion medium and various metal materials during the corrosion fatigue process. Therefore, foreign and domestic scholars have successively proposed various corrosion fatigue crack growth models [39,40,41]. Wei [42] proposed a linear superposition model for corrosion fatigue crack growth Δ, finding that when K is higher than KISCC, the influences corrosion medium and external load have on the fatigue crack growth of high-strength steel are independent of each other and total crack growth rate is formed by the superposition of corrosion fatigue crack growth rate and simple fatigue crack growth rate. Wang [41] studied the corrosion fatigue crack growth behavior of 4340 high-strength steel with different loading frequencies, the results demonstrating that with maximum stress intensity factor ΔK when K is higher than KISCC (threshold stress intensity of stress corrosion cracking), there is a significant environmental effect. At the same time, when the load is lower than the threshold value or higher than the larger stress intensity factor, there is a much smaller environmental effect. A new engineering model considering the interaction and competition between fatigue and the environment is proposed. Fatigue damage caused in advance interacts with the environment and causes material performance degradation. The model of fatigue damage that promotes stress corrosion cracking tendency can be seen in Figure 8. This model demonstrates that the material under fatigue damage undergoes stress corrosion cracking, and hydrogen embrittlement promotes crack growth to a certain extent. Wang Rong [28] proposed a corrosion passivation fracture model of materials during corrosion fatigue crack growth that considered the influence of corrosion damage on material elements, anodic dissolution, and hydrogen embrittlement. A relationship was found between corrosion fatigue rate and a range of stress intensity factors of material elements, corrosion fatigue threshold, loading frequency, anodic dissolution rate, and hydrogen embrittlement. After fatigue damage, the corrosion fatigue crack growth demonstrates a mixed crack growth mode. Fatigue damage facilitates the promotion of stress corrosion cracking, which also explains the accelerated crack growth rate following large fatigue damage.

5. Conclusions

(1)
Material corrosion resistance decreases following fatigue damage. The corrosion fatigue crack growth rate of fatigue-damaged specimens increases as the fatigue damage degree also increases, and the corrosion fatigue crack growth rate of fatigue-damaged specimen P2 (loading stress 70 MPa) is fastest.
(2)
The existence of secondary cracks in the sample without fatigue damage reduces crack tip stress concentration while delaying crack propagation. High magnification SEM of the fatigue-damaged specimen demonstrates that the shedding of the second phase at the grain boundary is promoted by H, and voids are formed.
(3)
The EBSD results demonstrate that the undamaged samples are mainly transgranular, while the fatigue-damaged samples are alternately intergranular and transgranular to a certain extent. This is caused by the anodic dissolution mechanism and hydrogen embrittlement, indicating that fatigue damage facilitates the promotion of stress corrosion cracking.

Author Contributions

J.J.: methodology, funding acquisition, project administration, writing—reviewing and editing. W.C.: conceptualization, investigation, validation, writing—original draft, writing—reviewing and editing. W.L.: data curation, writing—original draft, writing—reviewing and editing. G.G.: project administration, supervision. L.D.: data curation. Z.Z.: data curation. All authors have read and agreed to the published version of the manuscript.

Funding

Sichuan Province Science and Technology Support Program (CN) (No. 2020YFH0134) [2021YFG0095] and Key Project of Xihua University (No. Z202123).

Data Availability Statement

Data available on request from the authors.

Conflicts of Interest

The authors declare that they have no known competing financial interests or personal relationships that could have appeared to influence the work reported in this paper.

References

  1. Cavalcante, T.R.F.; Pereira, G.S.; Koga, G.Y.; Bolfarini, C.; Bose Filho, W.W.; Avila, J.A. Fatigue crack propagation of aeronautic AA7050-T7451 and AA2050-T84 aluminum alloys in air and saline environments. Int. J. Fatigue 2022, 154, 106519. [Google Scholar] [CrossRef]
  2. Huan, Z.; Poulami, C.; Dirk, P.; Tilmann, H.; Binhan, S.; Hung, W.C.; Baptiste, G.; Dierk, R. Hydrogen trapping and embrittlement in high-strength Al alloys. Nature 2022, 602, 437–441. [Google Scholar]
  3. An, J.; Chen, J.; Gou, G. (v19preprint40) Research on Corrosion Fatigue Crack Propagation Behavior of Welded Joints of A7N01P-T4 Aluminum Alloys. J. Corros. Sci. Eng. 2016, 19, 1. [Google Scholar]
  4. Qi, X.; Song, R.; Qi, W.; Jin, J.; Wang, C.; Li, H.; Sun, B. Correspondence between Susceptibility to SCC of 7050 Aluminum Alloy and Passive Film-induced Stress at Various pH Values. J. Cent. South Univ. 2017, 32, 173–178. [Google Scholar] [CrossRef]
  5. Lu, W.; Ma, C.; Gou, G.; Fu, Z.; Sun, W.; Che, X.; Chen, H.; Gao, W. Corrosion fatigue crack propagation behavior of A7N01P-T4 aluminum alloy welded joints from high-speed train underframe after 1.8 million km operation. Mater. Corros. 2021, 72, 879–887. [Google Scholar] [CrossRef]
  6. Arena, F.; Frusteri, F.; Mondello, N.; Giordano, N.; Parmaliana, A. Interaction pathway of chloride ions with ?-Al2O3: Surface acidity and thermal stability of the Cl/?-Al2O3 system. J. Chem. Soc. Faraday Trans. 1992, 88, 3353–3356. [Google Scholar] [CrossRef]
  7. Costa, D.; Ribeiro, T.; Cornette, P.; Marcus, P. DFT Modeling of Corrosion Inhibition by Organic Molecules: Carboxylates as Inhibitors of Aluminum Corrosion. J. Phys. Chem. C Nanomater. Interfaces 2016, 120, 28607–28616. [Google Scholar] [CrossRef]
  8. de Hass, M.; De Hosson, J.T.M. Grain boundary segregation and precipitation in aluminium alloys. Scr. Mater 2001, 44, 281–286. [Google Scholar] [CrossRef] [Green Version]
  9. Shah, S.R.; Pryce, I.L.; John, T.S.; Greer, J.M. Effect of Environmental Corrosion on Fatigue Crack Growth Morphology: A Detailed Investigation of the Boundary between Fatigue and Corrosion Control Regimes. In Advanced Materials Research; Trans Tech Publications Ltd.: Baech, Switzerland, 2014; Volume 891. [Google Scholar]
  10. Holroyd, N.; Scamans, G.M. Crack Propagation During Sustained-Load Cracking of Al–Zn–Mg–Cu Aluminum Alloys Exposed to Moist Air or Distilled Water. Metall. Mater. Trans. A 2011, 42, 3979–3998. [Google Scholar] [CrossRef]
  11. Young, G.A.; Scully, J.R. The effects of test temperature, temper, and alloyed copper on the hydrogen-controlled crack growth rate of an Al–Zn–Mg–(Cu) alloy. Metall. Mater. Trans. A 2002, 33, 1167–1181. [Google Scholar] [CrossRef]
  12. Borchers, T.E.; McAllister, D.P.; Zhang, W. Macroscopic Segregation and Stress Corrosion Cracking in 7xxx Series Aluminum Alloy Arc Welds. Metall. Mater. Trans. A Phys. Metall. Mater. Sci. 2015, 46, 1827–1833. [Google Scholar] [CrossRef]
  13. Horner, D.A.; Connolly, B.J.; Zhou, S.; Crocker, L.; Turnbull, A. Novel images of the evolution of stress corrosion cracks from corrosion pits. Corros. Sci. 2011, 53, 3466–3485. [Google Scholar] [CrossRef]
  14. Shen, L.; Chen, H.; Xu, L.D.; Che, X.L.; Chen, Y. Stress corrosion cracking and corrosion fatigue cracking behavior of A7N01P-T4 aluminum alloy. Mater. Corros. 2018, 69, 207–214. [Google Scholar] [CrossRef]
  15. Xiao, F.; An, J.; Chen, H.; Li, P.; Gao, W. x-The Effect of Microstructure on the Corrosion Fatigue Property of A7N01P-T4 Aluminum Alloy Welding Joints. Corrosion 2018, 74, 1229–1236. [Google Scholar] [CrossRef] [PubMed]
  16. Chen, L.; Yuan, S.; Kong, D.; Zhao, G.; Zhang, C. Influence of aging treatment on the microstructure, mechanical properties and anisotropy of hot extruded Al–Mg–Si plate. Mater Des. 2019, 182, 107999. [Google Scholar] [CrossRef]
  17. Liu, X.S.; Zhang, L.; Wang, L.S.; Wu, S.H.; Fang, H.Y. Fatigue behavior and life prediction of A7N01 aluminium alloy welded joint. Trans. Nonferrous Met. Soc. China 2012, 22, 2930–2936. [Google Scholar] [CrossRef]
  18. Song, W.; Wang, P.; Wan, D.; Qian, G.; Correia, J.; Berto, F. Fatigue crack growth behavior of Ni–Cr–Mo–V steel welded joints considering strength mismatch effect. Int. J. Fatigue 2021, 151, 106389. [Google Scholar] [CrossRef]
  19. Hornbogen, E.; Gahr, K.Z. Microstructure and fatigue crack growth in a γ–Fe–Ni–Al alloy. Acta Metall. 1976, 24, 581–592. [Google Scholar] [CrossRef]
  20. Aboura, Y.; Garner, A.J.; Euesden, R.; Barrett, Z.; Engel, C.; Holroyd, N.J.H.; Prangnell, P.B.; Burnett, T.L. Understanding the environmentally assisted cracking (EAC) initiation and propagation of new generation 7xxx alloys using slow strain rate testing. Corros. Sci. 2022, 199, 110161. [Google Scholar] [CrossRef]
  21. Onofrio, G.; Osinkolu, G.A.; Marchionni, M. Effects of loading waveform on fatigue crack growth of Udimet 720 Li superalloy. Int. J. Fatigue 2004, 26, 203–209. [Google Scholar] [CrossRef]
  22. GB/T 12160-2002. Calibration of Extensometers for Uniaxial Tests; Standardization Administration of the People’s Republic of China: Beijing, China, 2002.
  23. GB/T 20120.2-2006. Corrosion of Metals and Alloys—Corrosion Fatigue Test—Part 2: Crack Propagation Test on Pre-Cracked Specimens; Standardization Administration of the People’s Republic of China: Beijing, China, 2006.
  24. GB/T 6398-2017. Metallic Materials-Fatigue Test-Fatigue Crack Growth Method; Standardization Administration of the People’s Republic of China: Beijing, China, 2017.
  25. Schwarzenböck, E.; Ollivier, E.; Garner, A.; Cassell, A.; Hack, T.; Barrett, Z.; Engel, C.; Burnett, T.L.; Holroyd, N.J.H.; Robson, J.D.; et al. Environmental cracking performance of new generation thick plate 7000-T7x series alloys in humid air. Corros. Sci. 2020, 171, 108701. [Google Scholar] [CrossRef]
  26. Williams, J.C.; Starke, E.A. Progress in structural materials for aerospace systems. Acta Mater 2003, 51, 5775–5799. [Google Scholar] [CrossRef]
  27. Baggerly, R.G. Hydrogen-assisted stress cracking of high-strength wheel bolts. Eng. Fail. Anal 1996, 3, 231–240. [Google Scholar] [CrossRef]
  28. Arafin, M.A.; Szpunar, J.A. A new understanding of intergranular stress corrosion cracking resistance of pipeline steel through grain boundary character and crystallographic texture studies. Corros. Sci. 2009, 51, 119–128. [Google Scholar] [CrossRef]
  29. Rong, W. A fracture model of corrosion fatigue crack propagation of aluminum alloys based on the material elements fracture ahead of a crack tip. Int. J. Fatigue 2008, 30, 1376–1386. [Google Scholar]
  30. Wang, D.; Zhang, W.; Huang, S.; Yi, Y.; He, H. Effect of three-dimensional deformation at different temperatures on microstructure, strength, fracture toughness and corrosion resistance of 7A85 aluminum alloy. J. Alloys Compd. 2022, 928, 167200. [Google Scholar] [CrossRef]
  31. Chemin, A.E.A.; Saconi, F.; Bose Filho, W.W.; Spinelli, D.; Ruchert, C.O.F.T. Effect of saline corrosion environment on fatigue crack growth of 7475-T7351 aluminum alloy under TWIST flight loading. Eng. Fract. Mech. 2015, 141, 274–290. [Google Scholar] [CrossRef]
  32. Rao, A.C.U.; Vasu, V.; Govindaraju, M.; Srinadh, K.V.S. Stress corrosion cracking behaviour of 7xxx aluminum alloys: A literature review. Trans. Nonferrous Met. Soc. China 2016, 26, 1447–1471. [Google Scholar] [CrossRef]
  33. Knight, S.P.; Birbilis, N.; Muddle, B.C.; Trueman, A.R.; Lynch, S.P. Correlations between intergranular stress corrosion cracking, grain-boundary microchemistry, and grain-boundary electrochemistry for Al–Zn–Mg–Cu alloys. Corros. Sci. 2010, 52, 4073–4080. [Google Scholar] [CrossRef]
  34. Pan, S.; Dong, S.; Xu, M. Electrochemical origin for mitigated pitting initiation in AA7075 alloy with TiB2 nanoparticles. Appl. Surf. Sci. 2022, 601, 154275. [Google Scholar] [CrossRef]
  35. Kayani, S.H.; Park, S.; Euh, K.; Seol, J.B.; Kim, J.G.; Sung, H. Dislocation-aided electrochemical behavior of precipitates in stress corrosion cracking of Al–Zn–Mg–Cu alloys. Mater Charact. 2022, 190, 112019. [Google Scholar] [CrossRef]
  36. Krishnan, M.A.; Raja, V.S. Development of high strength AA 7010 aluminum alloy resistant to environmentally assisted cracking. Corros. Sci. 2016, 109, 94–100. [Google Scholar] [CrossRef]
  37. Li, X.D.; Wang, X.S.; Ren, H.H.; Chen, Y.L.; Mu, Z.T. Effect of prior corrosion state on the fatigue small cracking behaviour of 6151-T6 aluminum alloy. Corros. Sci. 2012, 55, 26–33. [Google Scholar] [CrossRef]
  38. Lin, C.K.; Yang, S.T. Corrosion fatigue behavior of 7050 aluminum alloys in different tempers. Eng. Fract. Mech. 1998, 59, 779–795. [Google Scholar] [CrossRef]
  39. Wang, L.; Hui, L.; Zhou, S.; Xu, L.; He, B. Effect of corrosive environment on fatigue property and crack propagation behavior of Al 2024 friction stir weld. Trans. Nonferrous Met. Soc. China 2016, 26, 2830–2837. [Google Scholar] [CrossRef]
  40. Ma, M.; Zhang, J.; Yi, D.; Wang, B. Investigation of high-cycle fatigue and fatigue crack propagation characteristic in 5083-O aluminum alloy. Int. J. Fatigue 2019, 126, 357–368. [Google Scholar] [CrossRef]
  41. Bai, L.Y.; Shao, F.; Ma, Q.N.; Xu, Q.; Hu, J.X.; Hou, Y.N. Mechanism of corrosion fatigue fracture of friction stir welding joints of 7075 aluminium alloy in 3.5% NaCl solution. J. Cent. South Univ. 2022, 29, 1015–1028. [Google Scholar] [CrossRef]
  42. Landes, J.D.; Wei, R.P. Correlation Between Sustained-Load and Fatigue Crack Growth in High-Strength Steels. Mater. Res. Stand 1969, 9, 25–46. [Google Scholar]
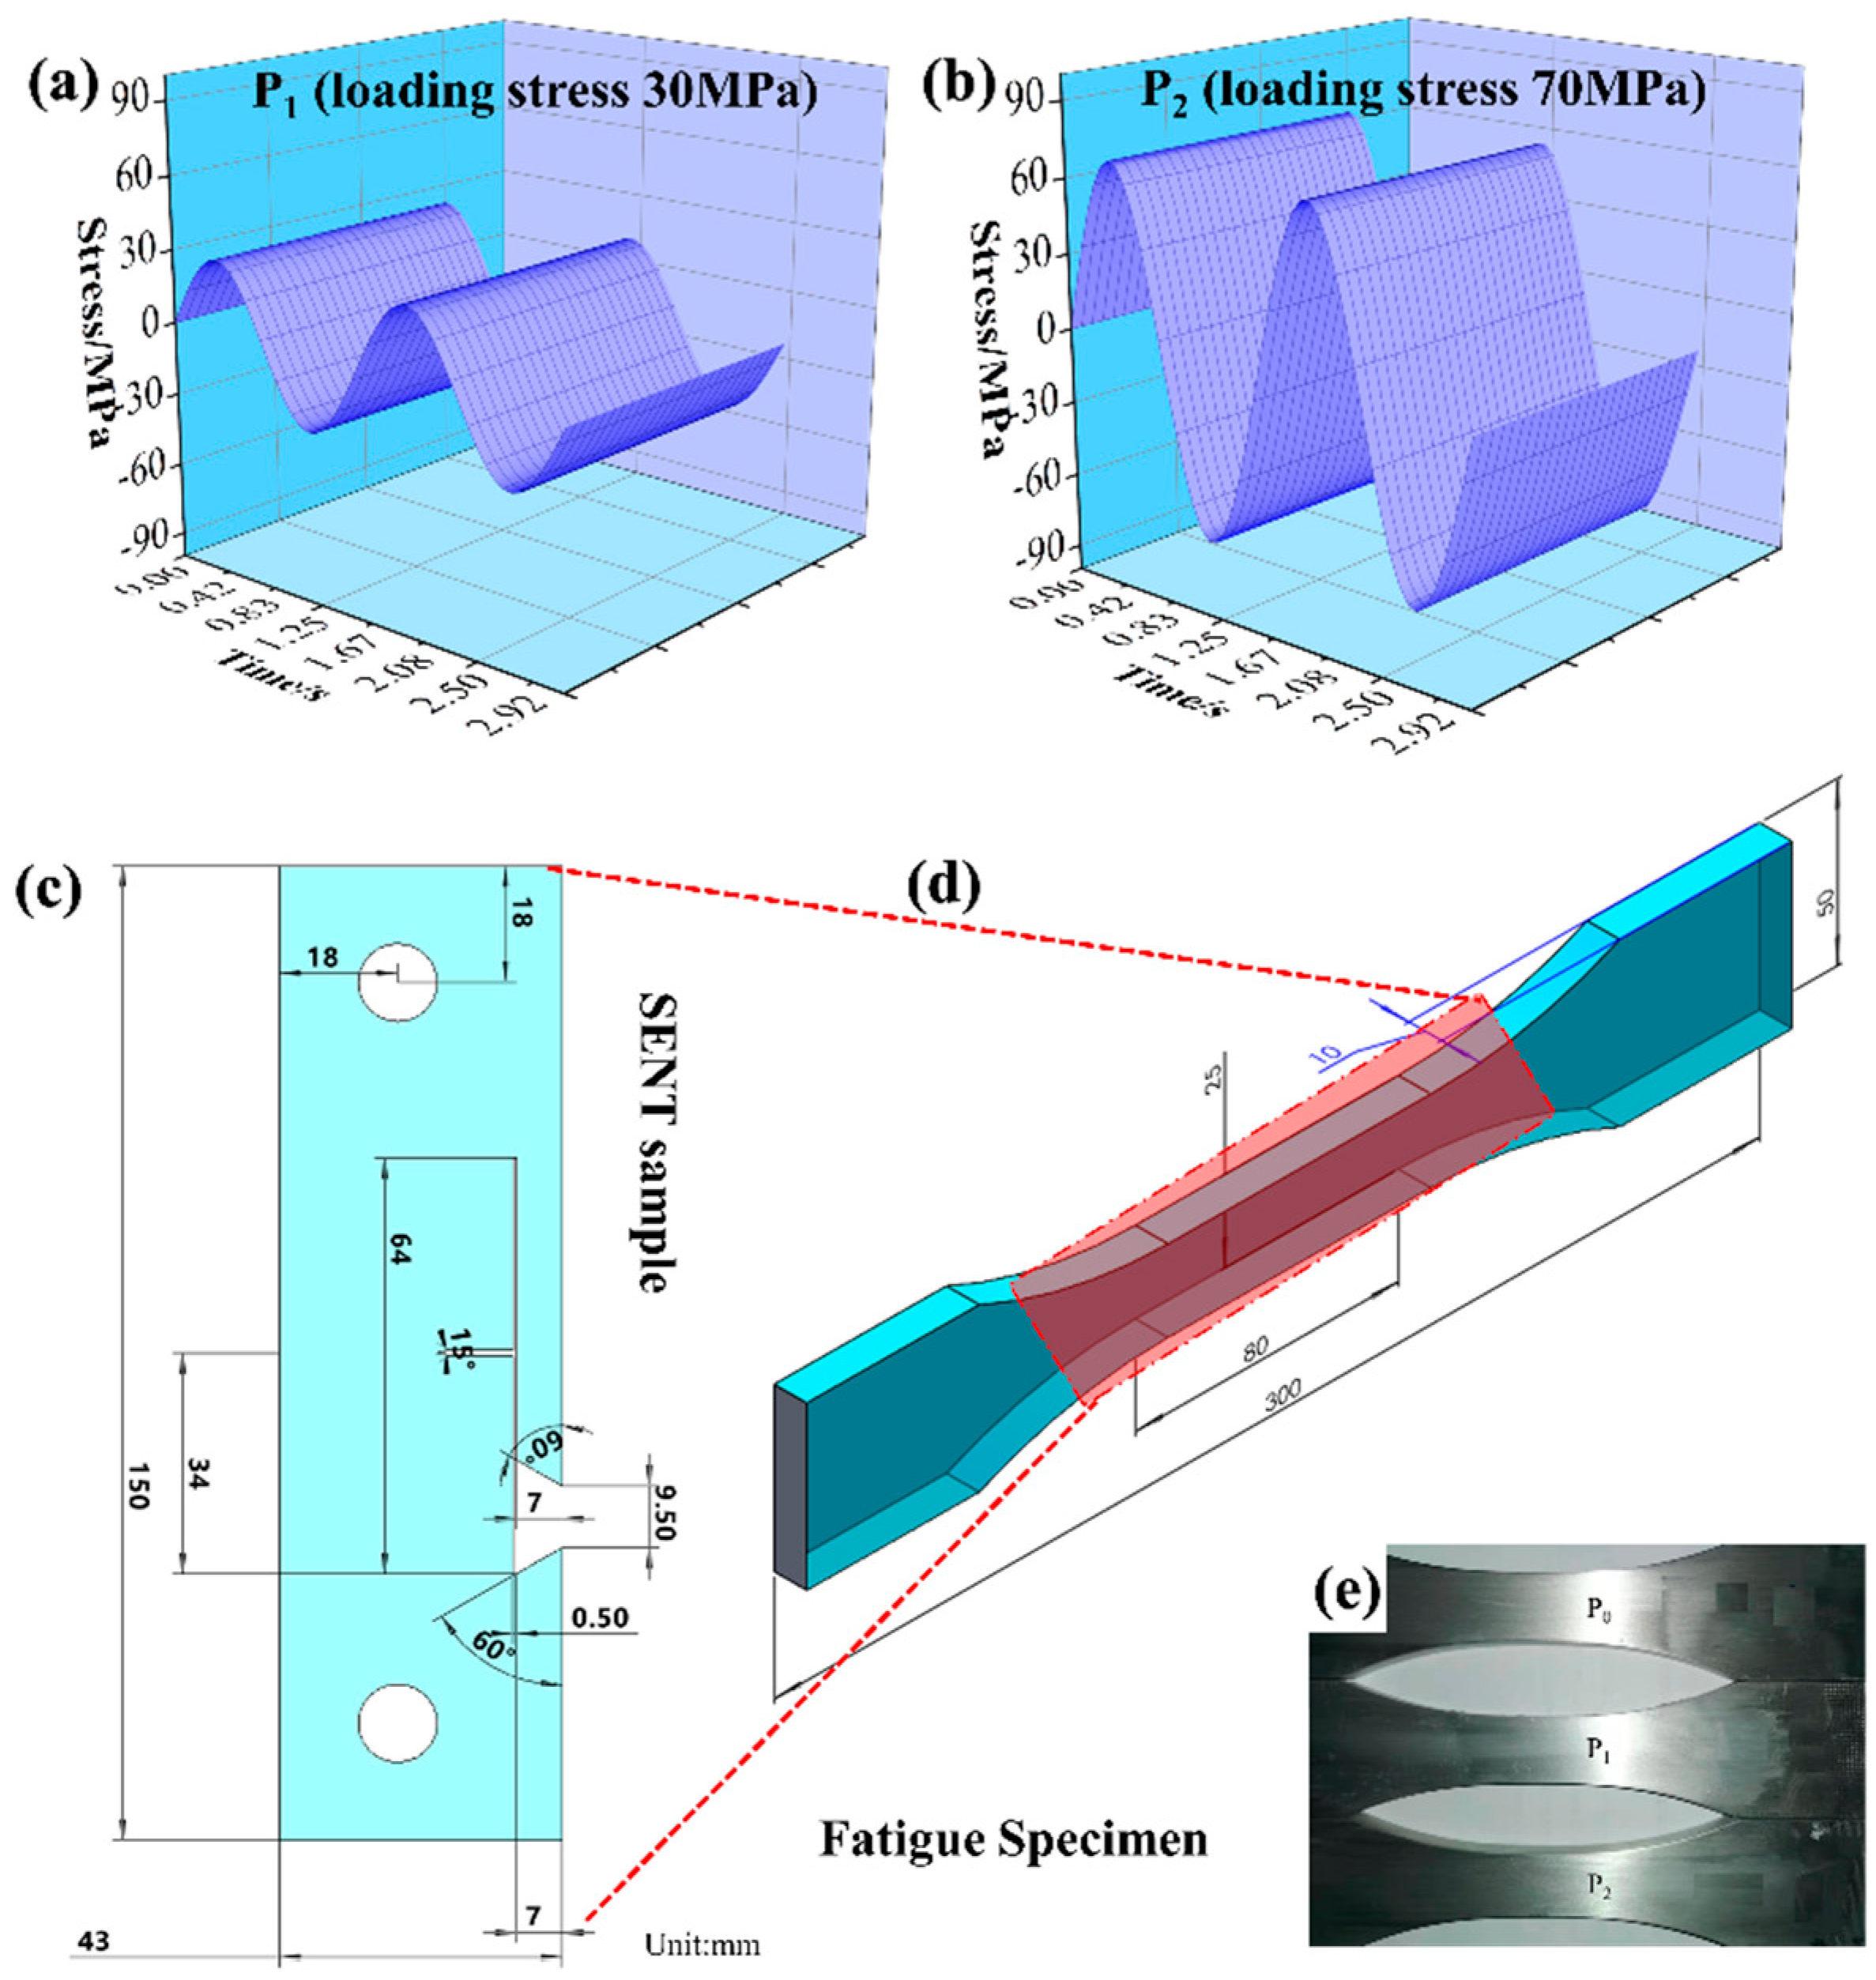
Figure 1. (a) P1 (loading stress 30 MPa) fatigue cycle curve, (b) P2 (loading stress 70 MPa) fatigue cycle curve, (c) dimension diagram of crack growth specimen (SENT specimen), (d) fatigue specification, (e) actual fatigue specimen.
Metals 13 00104 g001
Figure 2. Optical microscope image of A7N01P-T4 aluminum alloy. Orientation: rolled (L), long transverse (T), and thickness (S).
Metals 13 00104 g002
Figure 3. (a) Polarization curve, (b) Nyquist plot, (c) baud diagram, (d) Rp is polarization resistance.
Metals 13 00104 g003
Figure 4. (a) Corrosion fatigue crack growth rate curve of A7N01P-T4 aluminum alloy after fatigue damage, (b) Tensile strength of A7N01P-T4 aluminum alloy after fatigue damage.
Metals 13 00104 g004
Figure 5. Microstructure of CFCG fracture surface of different fatigue-damaged samples (a,b) P0, (c,d) P1, (e,f) P2.
Metals 13 00104 g005
Figure 6. Corrosion fatigue crack propagation path of A7N01P-T4 aluminum alloy with different fatigue damage degrees: (a) P0, (b) P1, (c) P2.
Metals 13 00104 g006
Figure 7. (a,d,g) IPF diagram of EBSD results of corrosion fatigue crack growth path of A7N01P-T4 aluminum alloy with different degrees of fatigue damage; (b,e,h) grain boundary distribution topography; (c,f,i) KAM diagram and its data.
Metals 13 00104 g007
Figure 8. Fatigue damage promoted stress corrosion cracking tendency model.
Metals 13 00104 g008
Table 1. Fatigue test parameters of A7N01P-T4 aluminum alloy base metal.
Sample TypeTest Temperature °CLoading Stress △σ/MPaFa/
Dynamic Load
Fb/
Static Load
Frequency f/HzNumber of Cycles N/Cycle
P025 °C00000
P125 °C303.7684.605103.8107
P225 °C708.6610.58105.9107
Table 2. Electrochemical parameters.
ElectrodeEcorr/VIcorr/A•cm2
P0−1.237.80 × 10−5
P1−1.267.24 × 10−5
P2−1.246.91 × 10−5
Table 3. Electrochemical impedance parameters.
Sample TypeRs/(Ω•cm2)CPE-T/(μF•cm2)CPE-PRp/(Ω•cm2)
P03.5436.47 × 10−60.8271.76 × 105
P13.231.13 × 10−50.8233.15 × 104
P20.4759.31 × 10−60.8538.91 × 104
Table 4. Paris formula fitting results.
Degree of Fatigue DamageConstant CConstant mParis Formula
P0 (non-fatigue damage)7.09 × 10−85.69da/dN = 7.09 × 10⁻⁸K)5.69
P1 (σ = 30 MPa)6.45 × 10−74.02da/dN =6.45 × 10⁻⁷K)4.02
P2 (σ = 70 MPa)2.92 × 10−108.78da/dN =2.92 × 10⁻¹⁰K)8.78
Disclaimer/Publisher’s Note: The statements, opinions and data contained in all publications are solely those of the individual author(s) and contributor(s) and not of MDPI and/or the editor(s). MDPI and/or the editor(s) disclaim responsibility for any injury to people or property resulting from any ideas, methods, instructions or products referred to in the content.