Abstract
Severe leakages of the elbow occur in the regeneration tower return pipeline of the LPG desulfurization unit, leading to the unplanned shutdown of the unit frequently over the period of four months. It is forced to apply additional steel plates to prevent the leakage. Elusively, it is found that the first wall contact with the fluid is fully eroded away in the vicinity of the bend, however, the walls of additional steel plates are intact. The clarification of this problem is required to ensure safe production. This strange phenomenon can be investigated by failure analysis and computational fluid dynamics (CFD) simulation. The failure analysis showed that the gas–liquid two-phase erosion–corrosion was the main cause of elbow leakage. The simulation shows that droplet erosion plays a dominant role in the erosion–corrosion process, and the elbow will leak in 4.3 months, which matches the actual situation very well. Furthermore, multiphase erosion–corrosion behavior was thoroughly investigated to expose the feature of the mentioned strange phenomenon. It was shown that when the corrosion holes are formed, the gas forms a fluid vortex in the holes. The vortex acts as flexible substrates, which plays a buffer layer to the droplet erosion, thus protecting the additional steel plate. The formation of the holes provides an effective way for elbow failure prevention.
1. Introduction
Liquefied petroleum gas (LPG) is mainly composed of hydrocarbons and has attracted increasing attention as a primary chemical raw material and a fuel. Sulfur compounds, especially hydrogen sulfide (H2S), are highly toxic and corrosive substances and are widely present in LPG [1]. An LPG desulfurization unit is mainly used to remove the sulfur compounds from LPG by methyl diethanolamine (MDEA) [2,3]. The LPG desulfurization unit consists of an absorption part and a regeneration part [4]. The poor amine solution absorbs hydrogen sulfide first, and then turns into the rich amine solution, and finally desorbs hydrogen sulfide and is regenerated to the poor amine solution. In the process, the reboiler heats the poor amine solution discharged from the bottom of the regeneration tower to resolve the H2S, which makes the internal components of the reboiler change from the liquid phase flow to gas–liquid two-phase flow, thus making the reboiler and the attached pipelines suffer serious erosion–corrosion [4,5,6]. The elbow at the reboiler outlet is one of the parts most prone to erosion–corrosion damage in the LPG desulfurization unit.
Erosion–corrosion is a phenomenon of metal damage caused by mechanical and electrochemical action [7]. The erosion–corrosion phenomenon widely exists in the oil and gas chemical industry and results in substantial economic losses and potential safety hazards because of the harsh work environments [8,9,10]. In a wet hydrogen sulfide environment, hydrogen sulfide reacts with carbon steel to form a passivation film, which can protect metal materials from corrosion. The mechanism is similar to that of a stainless-steel passivation film [10]. However, the droplets erode the passivation film, exposing the material beneath the passivation film to the corrosive medium. The combined effect of erosion and corrosion eventually leads to material failure.
At present, the research on multiphase flow erosion–corrosion of the elbow focuses on the erosion–corrosion containing solid particles, mainly including gas–solid two-phase flow erosion–corrosion [11,12,13,14,15], liquid–solid two-phase flow erosion–corrosion [16,17,18,19], and gas–liquid–solid multiphase flow erosion–corrosion [20,21]. The erosion–corrosion mechanism of different materials under different working conditions has been explored through experiments and the computational fluid dynamics (CFD) method. Current droplet erosion–corrosion research concentrates on liquid droplet impingement (LDI) [22,23,24,25]. When the droplets hit the solid wall, momentum is transferred to the material’s surface and the stress due to collision exceeds the material’s yield stress, resulting in material deformation [26]. LDI focuses more on the mechanics of droplet erosion on materials without considering the corrosion reaction between the droplets and materials. There have been few reports on droplet erosion–corrosion. Compared to the LDI, droplet erosion can cause damage to materials at relatively low speeds because the yield stress on the material surface is reduced when corrosion occurs.
The elbow in the regeneration tower return line of the LPG desulfurization unit leaks frequently over the period of four months, which leads to unplanned shutdown, as shown in Figure 1. To guarantee production, the leakage is repaired by an additional steel plate, as shown in Figure 2. A strange phenomenon is found where the outer wall of the elbow is entirely eroded, however, the additional plates are intact, as shown in Figure 3.
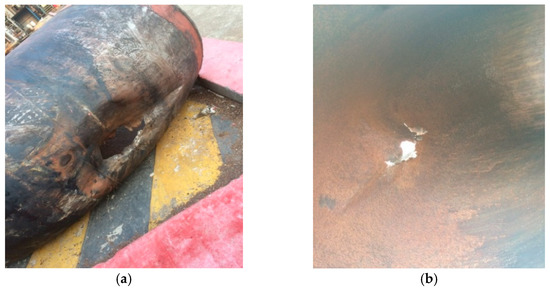
Figure 1.
Leakage occurring in the elbow: (a) outside view; (b) inside view.
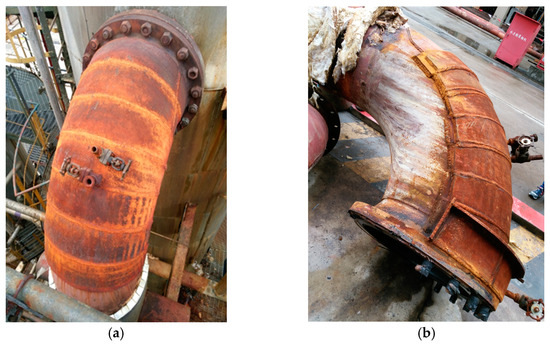
Figure 2.
The elbow before and after repair: (a) elbow; (b) elbow with additional plates.
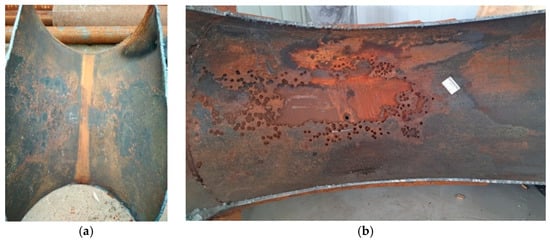
Figure 3.
The corrosion profile of the elbow: (a) inside wall of the elbow; (b) outside wall of the elbow.
To investigate the strange phenomenon of the elbow, failure analysis was performed first to investigate the main reason for the leakage based on the process data, the morphology of the elbow, and the corrosion product composition analysis. CFD simulation was also performed to characterize the flow pattern within the elbow. The erosion–corrosion rate and the ratio of the erosion rate and corrosion rate can be obtained by the mathematical model. Based on the erosion–corrosion rate, the erosion–corrosion map was established to explore the mechanism of erosion–corrosion on the elbow. This paper focused on the following two issues:
- (1)
- The main reason for the leakage in the elbow;
- (2)
- The reason why there is no obvious corrosion–erosion on the additional steel plate.
2. Method
2.1. Failure Analysis
2.1.1. Process Flowsheet
The desulfurization process uses the desulfurizing agent MDEA, the purified gas discharged from the gas absorption tower is sent to the fuel gas pipeline network, the purified gas discharged from the liquid absorption tower is sent to the liquefied gas recovery unit, the rich amine liquid discharged from the two absorption towers is gathered and sent to the regeneration tower, the regenerated poor amine liquid is sent back to the absorption tower, and the desorbed H2S is sent to the sulfur recovery unit. The desulfurization process flowchart and failure position are shown in Figure 4.
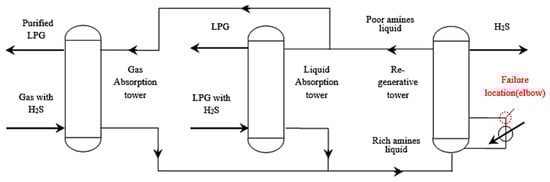
Figure 4.
Desulfurization process and failure location.
The material of the elbow was 20# steel, the diameter was 600 mm, the wall thickness was 10 mm, and the length-to-diameter ratio of the elbow was 1.5. The material of the additional steel plates was 20# steel, and the thickness was 10 mm. The chemical composition of 20# steel is listed in Table 1. The working temperature at the elbow is 120 °C, and the pressure is 0.05 MPa. The composition of the fluid in the elbow is shown in Table 2.

Table 1.
The chemical components of the 20# steel.
Table 2.
The properties and composition of the fluid.
2.1.2. Morphology and Corrosion Product Composition Analysis
In order to study the corrosion failure mechanism of the elbow, the number of holes as well as the diameter size of the holes were counted. The measuring instrument was a SATA electronic digital display vernier caliper with a division value of 0.01 mm and an accuracy of ±0.03 mm.
After counting the number of holes and their diameters, samples were taken from the severely corroded areas for microscopic morphological analysis and compositional analysis. X-ray diffraction (XRD, Rigaku Ultima IV, Tokyo, Japan) was used to determine the surface phase compositions of the samples. The working voltage was 40 kV, the working current was 40 mA, the radiation target was Cu Ka, and the scanning speed was 6°/min. The scanning ranged from 10° to 90° (2θ). The surface morphology of the samples was observed by scanning electron microscope (SEM) and the distribution of elements was detected by energy dispersive X-ray spectrometer (EDS). In this study, SEM and EDS observations were performed with a Zeiss Sigma 300 field emission scanning electron microscope (ZEISS, Oberkochen, Germany). The working voltage was 20 KV, and the current was 40 mA. A secondary electron (SE) was used for imaging. The time of the spectra acquisition was 5 min.
2.2. CFD Simulation
ANSYS Fluent (19.0, ANSYS, USA) was applied to investigate the erosion–corrosion of the 90° steel elbow under gas–liquid multiphase flow conditions with high order discretization of the equations. The Eulerian model is used to calculate the flow field distribution of the gas–liquid two-phase flow. The dispersed phase model (DPM) and the erosion–corrosion mathematical model were used to track the droplet trajectory and calculated the erosion–corrosion rate. The RNG k–ε turbulence model was applied to calculate the turbulence inside the elbow. The pressure-based solver was used to solve the above models. PRESTO was used for pressure, second-order upwind schemes for continuity, momentum, k and ε equations. SIMPLE was used for the pressure–velocity coupling. When the residuals are less than 1e-5, the calculation is considered to be convergent. The specific settings will be explained in detail below. Some assumptions should be adopted before the calculation:
- (1)
- The formation of droplets is mainly due to the entrainment of the gas phase. The main component of the droplets is the MDEA solution, composed of MDEA and non-evaporated water, and the MDEA solution is saturated by H2S.
- (2)
- The shape of the particles is spherical, and the force between the droplets is ignored because of the low liquid content.
- (3)
- The corrosion occurs only at the places where there is MEDA solution.
- (4)
- The diameter of the droplets can be calculated according to [27]. The monodisperse droplet is adopted.
- (5)
- The temperature of the inlet and the outlet of the elbow is 120 °C, and the heat transfer is ignored.
2.2.1. Geometric Model and Grid Independence Analysis
The geometric model of the elbow is shown in Figure 5. The size of the elbow is shown in Figure 5a. The geometric model of the elbow with corrosion holes is shown in Figure 5b, where the area of severe erosion–corrosion is covered with corrosion holes. After the field measurement, the number of holes with a 19 mm diameter was the highest. Therefore, the diameter of the holes was set to 19 mm and the depth of the hole was 10 mm.
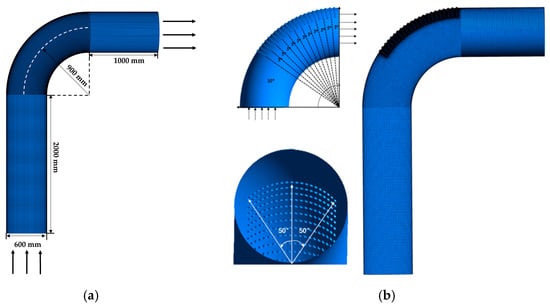
Figure 5.
Geometric models: (a) elbow; (b) elbow with holes.
The erosion rate is an important parameter to analyze the erosion–corrosion behavior of the elbow. The max erosion rate in the elbow is used to verify grid independence with a different number of grids, and the results are shown in Table 3 and Table 4. The relative error is defined as . is the erosion rate from 2 million for the elbow, and 6.1 million for the elbow with corrosion holes.
Table 3.
Validation of the grid independence of the elbow.
Table 4.
Validation of the grid independence of the elbow with corrosion holes.
2.2.2. Boundary Conditions
The properties of the fluid are shown in Table 5. The gas phase comprises hydrogen sulfide and water, and the liquid phase is MDEA. The inlet is mass-flow-inlet and the outlet is the pressure outlet [20]. The mass flow rate of gas and liquid are 3.42 kg/s and 0.004 kg/s, as shown in Table 6. The wall was set with non-slip boundary conditions. The boundary conditions for the Eulerian model and the DPM model are almost the same, but the droplets will be trapped by the wall when the droplets collide with the wall for the DPM model, as shown in Table 7 [28].
Table 5.
The properties of the gas and liquid.
Table 6.
Boundary condition for the Eulerian model.
Table 7.
Model setting and boundary condition for the discrete phase in the DPM model.
2.2.3. Mathematics Model
- (1)
- Chemical corrosion model
Reaction process [10]:
Fe + H2S → FeS + H2
Anode reactions:
Fe → Fe2+ + 2e−
Cathode reaction:
2H2S + 2e− → 2H+ + 2HS−
2HS− + 2e− → 2H+ + 2S2−
2H+ + 2e− → H2
The cathode reactions consist of a series of depolarization processes involving H2S, HS−, and H+. The H+ ions produced by the ionization of H2S are finally reduced to H2.
It is reasonably assumed that the whole reaction only occurs near the pipe wall and the ferrous ion would not be transferred through the boundary layer before the sequential chemical reaction. The formula for calculating electrochemical corrosion is shown below [29]:
where fd is 2/3; fe is 1; Z is the number of electrons; M is molar mass; g/mol, DH2S is the diffusion coefficient, m2/s; Cb,H2S is the hydrogen sulfide concentration, kg/m3; Ug is the gas velocity, m/s; dW is the diameter of the pipe; vg is the kinematic viscosity of gas, m2/s; EC is the chemical corrosion rate, kg/(m2 s).
EC = 0.0791(fd × fe)(ZH2S/ZW)(MW/MH2S)(DH2S × Cb,H2S × Ug0.7)/(dW0.3 × vg0.344)
- (2)
- Erosion model
The erosion rate caused by the impingement between the liquid droplet group and the pipe wall is as follows [30,31,32]:
where ER is the erosion rate in mm/year; K is the material constant, which is 2.0 × 10⁻⁹ for carbon steel [33]; C is a converting factor from m/s to mm/year, which is 3.15 × 10¹⁰; UP is the hit velocity of droplets; n is taken as 5 for the liquid droplet [34]; mdrop is the mass flow of droplet that hit the area, kg/s; F(α) is a number between 0 and 1 given by the function of impingement angles. ρw is the wall material density, kg/m3; A is the size of the area exposed to erosion, m2.
where the Ai is given in Table 8 [34].
ER = C (K × (UP)n × mdrop × F(α))/(ρw × A)
F(α) = ∑ (−1) (i+1) × Ai((α × π)/180)i
Table 8.
Constants of F(α).
3. Results and Discussion
3.1. Failure Analysis
3.1.1. Macro Corrosion Morphology Analysis of Elbow
The morphology of the inner and outer wall surfaces of the elbow is shown in Figure 3. The inner and outer wall of the elbow is relatively rough, and a variety of corrosion holes with different sizes could be observed. The inner wall of the elbow did not show significant wall-thinning, while the mass loss on the outer wall was severe. The area of severe wall-thinning was generally honeycombed and covered with corrosion holes. The corrosion holes expanded and joined together to form a completely broken area. A total of 103 complete holes with a maximum hole diameter of 21.1 mm and a minimum hole diameter of 7.5 mm were found in the area of severe wall thinning on the outer wall of the elbow. The diameter of the holes near the center line of the outer wall was larger and decreased along the radial direction. In addition, there was a phenomenon worthy of attention. The wall thinning on the outer wall was serious while the corresponding position of the additional steel plate was intact.
3.1.2. Microscopic Morphology and Corrosion Product Composition Analysis
Samples were taken in the area of serious wall thinning for SEM, and the results are shown in Figure 6, with magnifications of 250 and 2000 times in Figure 6a,b. It can be seen that the surface of the sample was uneven and rough. When the magnification was 2000 times, thin flakes and lumps of corrosion products remaining on the sample surface and in the crevices could be observed, which indicates that the bond between the corrosion products and the substrate was not enough to produce a protective effect on the substrate.
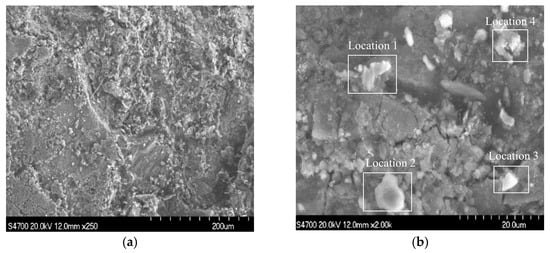
Figure 6.
SEM images of the samples: (a) ×250; (b) ×2000.
EDS was performed on four locations of the samples, as shown in Figure 7. The results show that the four main elements of the corrosion products were Fe, C, S, and O.
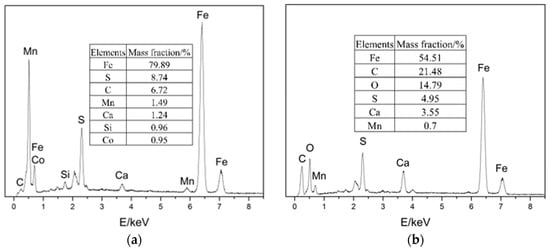
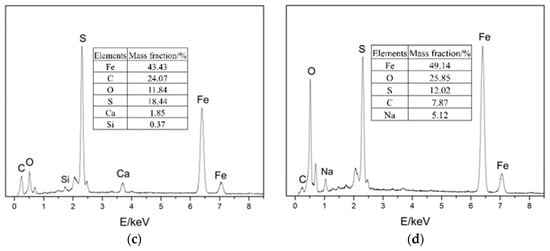
Figure 7.
EDS images of the samples: (a) location 1; (b) location 2; (c) location 3; (d) location 4.
The corrosion product composition can be obtained by XRD, which helps to further understand the failure mechanism of the elbow. The XRD results of the four positions, which is a cumulative chart for cases, are shown in Figure 8. The results show that the physical phase of the samples was mainly FeS2 and Fe, and individual samples contained a small amount of FeS.
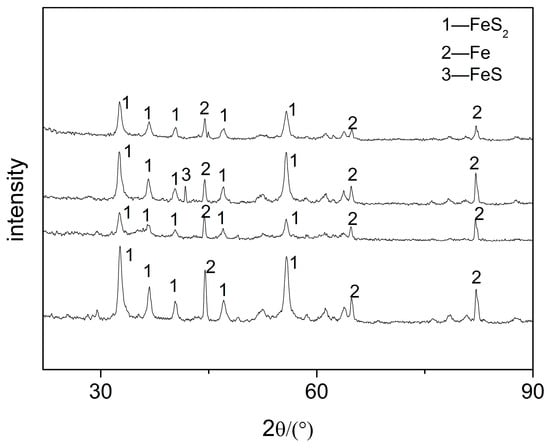
Figure 8.
XRD images of the samples.
3.1.3. Failure Analysis
According to the surface morphology of the elbow and the elemental analysis of corrosion products, the micro holes could be observed on both the inner and outer wall of the first plate of the elbow, and only the mass loss on the outer wall was serious. The EDS and XRD tests indicate that H2S corrosion occurs in the elbow and the major corrosion products were FeS2 and FeS. From the SEM test, the corrosion products were poorly bonded to the surface, and the droplets collided with the wall and carried the corrosion products away from the wall, causing damage to the material. In all, the gas–liquid two-phase erosion–corrosion is the main cause of elbow leakage, and the mechanism of the erosion–corrosion will be discussed by the CFD simulation in Section 3.2.
3.2. Simulation for Elucidation of Erosion–Corrosion Mechanism
3.2.1. Simulation of the Erosion–Corrosion Behavior on the Elbow
The velocity distribution of the gas–liquid two-phase in the elbow is shown in Figure 9 and Figure 10. The velocity distribution of the gas phase in the elbow is uniform. The gas phase had the maximum velocity on the inside of the elbow and the minimum velocity on the outside, and the velocity decreased from the inside of the elbow to the outside. The velocity distribution of the liquid phase in the elbow was more complex. A small part of the droplets flowed along the inner wall and separated near the inner wall and flow out of the elbow. Most of the droplets collided with the outer wall of the elbow at a certain velocity and angle and flow out of the elbow at a lower velocity after the collision. In addition, the droplet and the wall collision area were mainly concentrated in the axial angle of 0–75°. When the droplet collides with the wall, the droplet will gather in the collision area, so the liquid phase fraction in the collision area will be larger. The volume fraction of droplets at different axial angles is shown in Figure 11. The liquid phase was mainly concentrated in the axial angle between 30 and 75°, indicating that the collision between droplets and the wall was focused on this area. It can be assumed that the erosion–corrosion of the wall in this area was more serious.
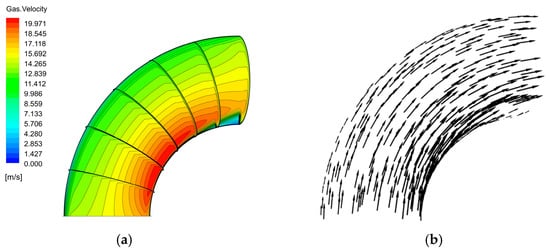
Figure 9.
Velocity distribution and streamline of the gas phase: (a) contour; (b) vector.
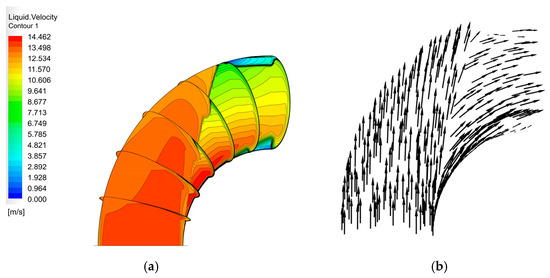
Figure 10.
Velocity distribution and streamline of the liquid phase: (a) contour; (b) vector.
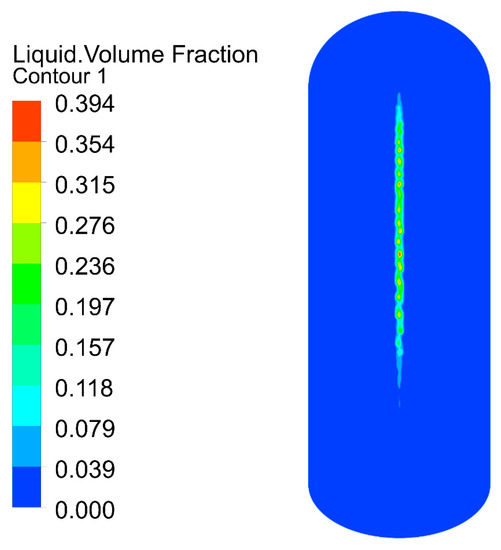
Figure 11.
Distribution of the volume fraction of the liquid phase.
The erosion–corrosion rate calculated by the mathematical model is shown in Figure 12 and Figure 13. The inner wall of the elbow was subjected to the maximum electrochemical corrosion rate of 1.107 mm/y, and the electrochemical corrosion rate gradually decreased from the inner wall to the outer wall of the elbow. The droplet erosion was mainly concentrated in the elbow outer wall surface, and the maximum erosion rate was 26.766 mm/y.

Figure 12.
Distribution of the corrosion rate: (a) view from +Y; (b) view from +X; (c) view from −Y of the elbow.
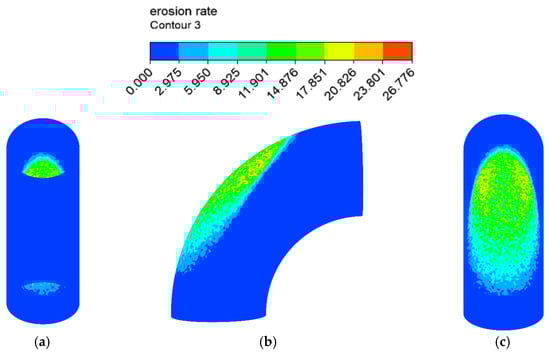
Figure 13.
Distribution of the erosion rate: (a) view from +Y; (b) view from +X; (c) view from −Y (1).
A comparison between the severe area of erosion–corrosion obtained by numerical simulation and the serious area of wall thinning in actual conditions is shown in Figure 14. The area where the erosion–corrosion rate reached or exceeded 90% of the maximum erosion–corrosion rate is defined as a serious area of erosion–corrosion. The severe electrochemical corrosion area was located at the elbow inside the wall axial angle of 0–30° while the serious erosion area was located at the elbow outside the wall axial angle of 45–75°. In practice, the elbow serious wall thinning region is located in the elbow outside the wall 50–80°. The numerical simulation of the severe erosion area and the actual corrosion serious area matched, indicating that the droplet erosion was the main cause of the elbow wall thinning, also illustrating the accuracy of the numerical simulation results. The numerical simulation of the severe erosion area and the actual severe wall thinning area had a slight shift, probably as a result of neglecting the droplet particle size distribution.
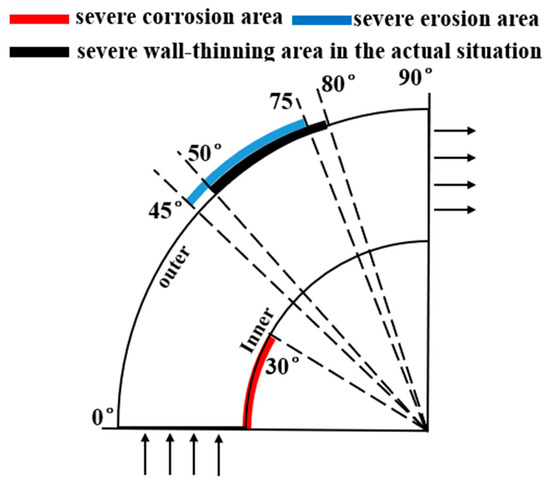
Figure 14.
Comparison between the simulation results and the actual situation.
3.2.2. Simulation of the Erosion–Corrosion Behavior on the Elbow with Corrosion Holes
When the corrosion holes formed on the outer wall of the elbow, the gas velocity distribution was as shown in Figure 15. It can be seen that the flow of gas in the elbow showed almost no change compared to the elbow. When the gas flowed into the holes, the velocity decreased significantly at the entrance of the hole and formed a vortex inside the hole, as shown in Figure 16. To describe the flow of gas inside the hole more clearly, three lines were drawn on the cross-section of the hole and the velocities of the three lines were extracted, and the results are shown in Figure 17. There was a large velocity gradient at the entrance of the holes, and the velocity from 5 m/s rapidly decreased to 0–1 m/s. Subsequently, a slight increase in the gas-phase velocity occurs due to a brief acceleration caused by the gas caught in the vortex. Then, it will flow out of the hole with the vortex. In the process of exiting the holes, the gas velocity increases first and then decreases because of the interaction with the incoming flow. Finally, the gas flows out of the holes.
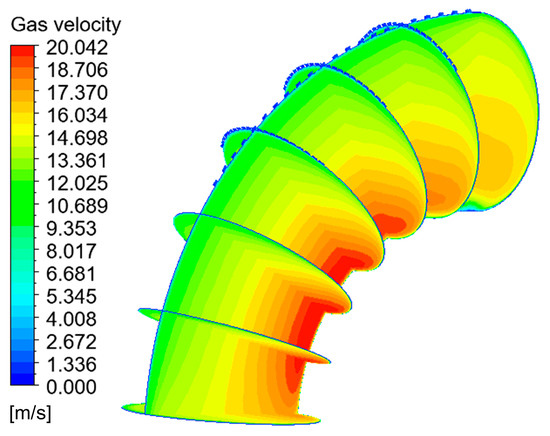
Figure 15.
Velocity distribution and streamline of the gas phase.
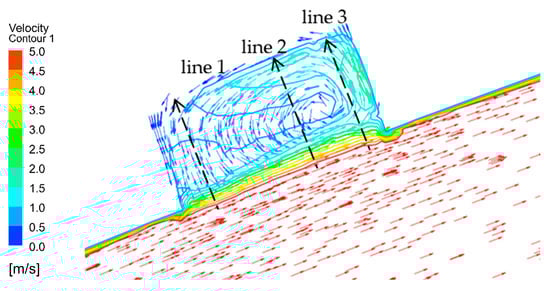
Figure 16.
Gas vortex in the holes.
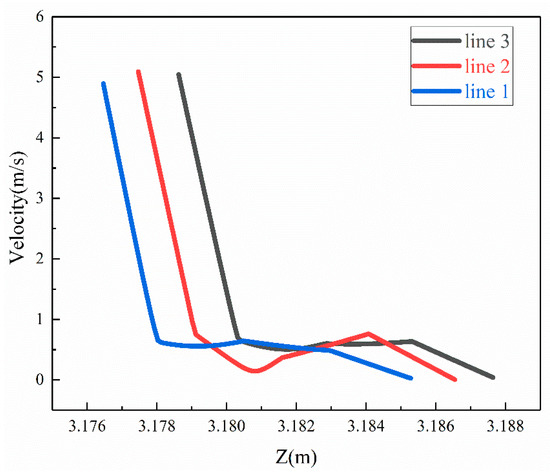
Figure 17.
Velocity of gas of the three lines.
The flow of droplets in the elbow with holes was mainly similar to the elbow, but was different in the holes, as shown in Figure 18 and Figure 19. When the droplets entered into the holes, the velocity at different locations appeared at different degrees of decline. To better describe the movement of droplets in the holes, four cross-sections of holes were chosen: location 1 (0°, 30°), location 2 (0°, 45°), location 3 (0°, 60°), and location 4 (0°, 60°) according to Figure 18, and the holes were divided into two by the diagonal of the hole cross-section. It can be seen that the velocity was larger in the area below the line, and the closer to the diagonal, the smaller the velocity, while the velocity was relatively small in the area above the line, where the closer to the diagonal, the larger the velocity. Combined with the flow of droplets in the hole, droplets flowed into the hole from the area below the diagonal, and the velocity direction of the gas and droplet was the same, so the gas on the droplet obstruction was relatively small, and the overall velocity was larger in the area. The closer the region is to the diagonal, the longer the droplet trajectory in this region and the greater the buffering effect of the gas on the droplet, resulting in a decrease in velocity near the diagonal region. When the droplet collides with the wall, the kinetic energy loss is larger after bouncing into the area above the line. At the same time, the gas in this area moves in the opposite direction to the droplet. These two reasons together led to a smaller droplet velocity in the area above the diagonal line. It can be presumed that the collision between the droplet and the hole wall is mainly concentrated in the area below the line. The presumption was proven by the volume fraction of the liquid shown in Figure 20. Therefore, it was presumed that the erosion–corrosion of the hole was concentrated in the hole wall in the area below the line. The erosion–corrosion in the area above the line was small.
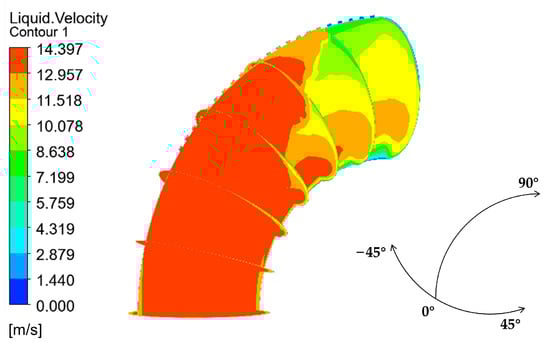
Figure 18.
Velocity distribution and streamline of the liquid phase.
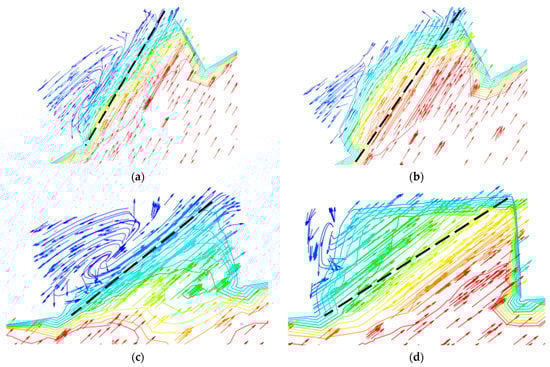
Figure 19.
Velocity distribution and streamline of the liquid phase in the holes: (a) location 1; (b) location 2; (c) location 3; (d) location 4.
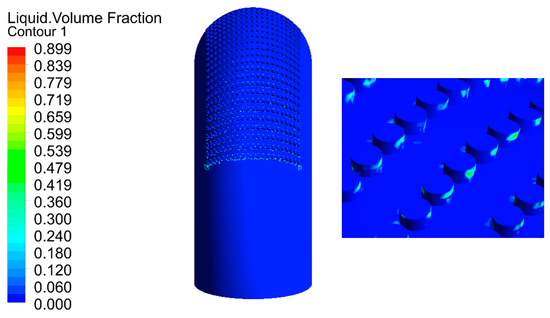
Figure 20.
Distribution of the liquid volume fraction.
The distribution of the erosion–corrosion rate on the elbow wall with the corrosion holes is shown in Figure 21, Figure 22 and Figure 23. The distribution and value of the erosion–corrosion are similar to those before. When the corrosion holes formed, the max erosion rate on the wall of holes was 15.832 mm/y, which decreased by 39.2% compared to the outer wall. The reduction in the erosion rate may be related to the formation of vortices in the holes.
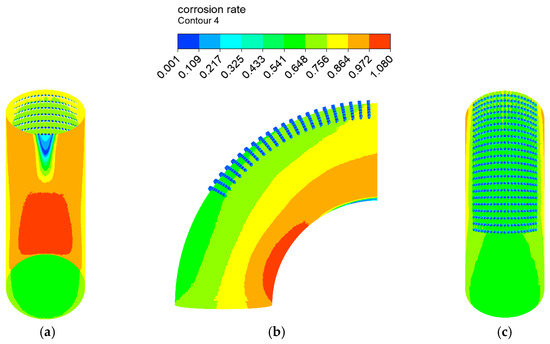
Figure 21.
Distribution of the corrosion rate: (a) view from +Y; (b) view from +X; (c) view from −Y.
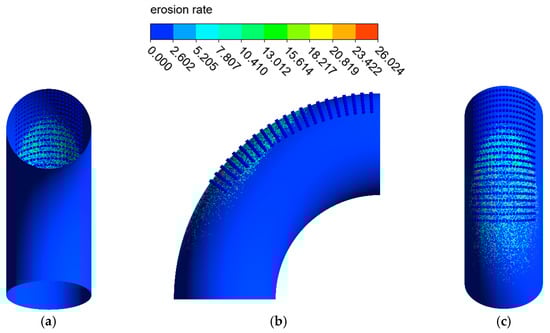
Figure 22.
Distribution of the erosion rate: (a) view from +Y; (b) view from +X; (c) view from −Y (2).
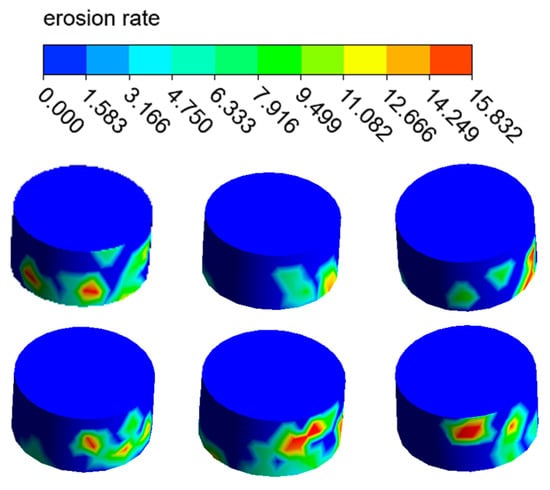
Figure 23.
Distribution of the erosion rate on the holes.
3.2.3. Comparison of the Erosion–Corrosion Behavior between the Elbow and the Elbow with Corrosion Holes
In accordance with the erosion–corrosion behavior with the formation of corrosion holes, the elbow can be divided into the erosion-dominated region, erosion–corrosion dominated region, corrosion–erosion dominated region, and corrosion-dominated region by calculating the ratio of erosion rate to corrosion rate [35], as shown in Figure 24. The erosion dominant region of the elbow is elliptical in shape, mainly located between 30–75° axially and −25–25° circumferentially. With the erosion-dominated area as the center, the area from the inside to the outside are erosion–corrosion-dominated regions, corrosion–erosion-dominated regions, and corrosion-dominated regions. When the corrosion holes formed, the erosion-dominated region was mainly concentrated in the wall of the corrosion holes. Compared to the elbow, the reduction in the area of erosion dominated area can be observed, which indicates a substantial mitigation of the erosion effect of the droplets on the wall. The changes in the other regions after the formation of corrosion holes were not noticeable.
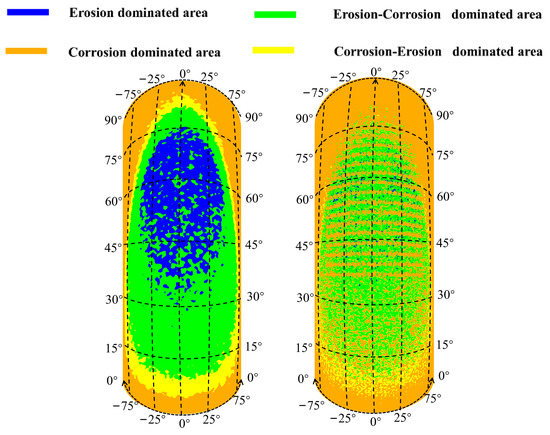
Figure 24.
Erosion–corrosion map for the outer wall.
To investigate the phenomenon of the buffer effect on the droplet erosion on the elbow after the formation of corrosion holes, three locations, which were location 1 (0°, 70°), location 2 (−5°, 50°), location 3 (5°, 60°), according to the Figure 24, were selected from the severe erosion–corrosion area and the droplet velocity near the wall was extracted for comparative analysis, as shown in Figure 25. The results show that when the droplets collided with the wall, the velocity rapidly decreased to 0 to the wall of the elbow. When the corrosion holes formed on the elbow, the droplet velocity first showed a slight decrease compared to the elbow and then rapidly decreased to 0. Combined with the distribution of the gas in the hole, the droplets first make contact with the gas vortex inside the hole, where the gas vortex is equivalent to a dynamic gas film, so the droplet velocity hitting the wall decreases, thus having a buffer effect on the droplet erosion.
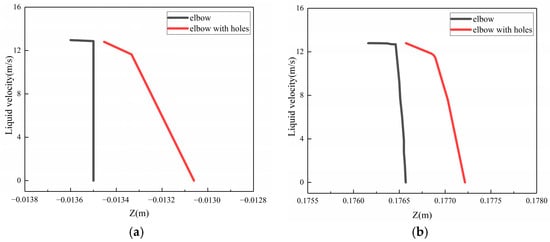
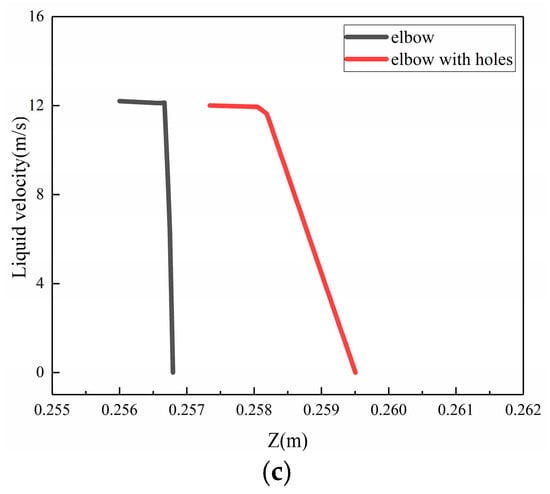
Figure 25.
The velocity near the wall: (a) location 1; (b) location 2; (c) location3.
4. Conclusions
The corrosion failure analysis of the elbow was carried out according to the actual situation on site, and the erosion–corrosion behavior of the elbow of the gas–liquid two-phase flow was explored by CFD. The conclusions are shown below:
- (1)
- Based on the macroscopic and microscopic morphology as well as the elemental and compositional analysis of the elbow wall area, it was concluded that the gas–liquid two-phase erosion–corrosion was the main cause of the elbow failure.
- (2)
- The severe erosion area obtained by numerical simulation and the actual severe wall thinning area matched. The max erosion rate was 26.766 mm/y and the max corrosion rate was 1.107 mm/y, which indicates that droplet erosion was the main cause of elbow wall thinning.
- (3)
- Compared to the erosion–corrosion behaviors on the elbow, the erosion rate on the outer wall of the elbow was the same while the max erosion rate on the wall of holes was 15.832 mm/y, which decreased by 39.2% compared to the outer wall when the corrosion holes formed in the outer wall of the elbow. The formation of the gas film played a buffering role in the collision between the droplet and the wall, changing the mechanism of action between the droplet and the wall, thus creating the protection of the additional plate.
Author Contributions
Conceptualization, A.S. and Y.L.; Methodology, A.S.; Software, Y.L.; Validation, Y.L., G.S. and Y.X.; Formal analysis, Y.L.; Investigation, Y.L.; Resources, Y.X.; Data curation, G.S.; Writing—original draft preparation, Y.L.; Writing—review and editing, Y.L.; Visualization, G.S. and Y.X.; Supervision, J.Z.; Project administration, J.Z.; Funding acquisition, J.Z. All authors have read and agreed to the published version of the manuscript.
Funding
This research was funded by the National Key R&D Program of China (2021YFB3301100).
Institutional Review Board Statement
Not applicable.
Informed Consent Statement
Not applicable.
Data Availability Statement
Not applicable.
Conflicts of Interest
The authors declare no conflict of interest.
References
- Nielsen, R.B.; Rogers, J.; Bullin, J.A.; Duewall, K.J. Treat LPGs with amines. Hydrocarb. Process. 1997, 76, 49–59. [Google Scholar]
- Zhang, F.; Shen, B.-X.; Sun, H.; Liu, J.C. Removal of organosulfurs from liquefied petroleum gas in a fiber film contactor using a new formulated solvent. Fuel Process. Technol. 2015, 140, 76–81. [Google Scholar] [CrossRef]
- Yunhai, S.; Shan, L.; Wei, L.; Dong, L.; Remy, G.; JianPeng, D. Influence of MEA and piperazine additives on the desulfurization ability of MDEA aqueous for natural gas purification. Int. J. Ind. Chem. 2016, 7, 297–307. [Google Scholar] [CrossRef]
- Wang, Z.H.; Yang, C.Y.; Zhu, L. Corrosion analysis and inhibition studies in the process of natural gas wet desulfurization. Eng. Fail. Anal. 2014, 44, 66–73. [Google Scholar] [CrossRef]
- Zou, C.; Zhao, P.; Ge, J.; Qin, Y.; Luo, P. Oxidation/adsorption desulfurization of natural gas by bridged cyclodextrins dimer encapsulating polyoxometalate. Fuel 2013, 104, 635–640. [Google Scholar] [CrossRef]
- Gong, Y.; Yang, Z.G. Corrosion evaluation of one wet desulfurization equipment–Flue gas desulfurization unit. Fuel Process. Technol. 2018, 181, 279–293. [Google Scholar] [CrossRef]
- Zheng, Y.G.; Yao, Z.Y.; Ke, W. Fluid mechanics factors on the corrosion mechanism of the effect of erosion. Corros. Sci. Prot. Technol. 2000, 12, 36–40. [Google Scholar]
- Zhang, G.A.; Zeng, L.; Huang, H.L.; Guo, X.P. A study of flow accelerated corrosion at elbow of carbon steel pipeline by array electrode and computational fluid dynamics simulation. Corros. Sci. 2013, 77, 334–341. [Google Scholar] [CrossRef]
- Burson-Thomas, C.B.; Wood, R. Developments in Erosion–Corrosion Over the Past 10 Years. J. Bio Tribo Corros. 2017, 3, 14. [Google Scholar] [CrossRef]
- Wen, X.; Bai, P.; Luo, B.; Zheng, S.; Chen, C. Review of recent progress in the study of corrosion products of steels in a hydrogen sulphide environment. Corros. Sci. 2018, 139, 124–140. [Google Scholar] [CrossRef]
- Wang, Y.; Liu, R.T.; Liu, M.; Yan, J.J. Numerical investigation on erosion characteristics of coplanar elbows connection for gas-solid flow. In Proceedings of the 10th International Conference on Applied Energy (ICAE), Hong Kong, China, 22–25 August 2018; pp. 5245–5250. [Google Scholar]
- Zhang, J.; Zhang, H.; Chen, X.H.; Yu, C.Y. Gas-Solid Erosion Wear Characteristics of Elbow Pipe with Corrosion Defects. ASME J. Press. Vessel Technol. 2021, 143, 051501. [Google Scholar] [CrossRef]
- Zolfagharnasab, M.H.; Salimi, M.; Zolfagharnasab, H.; Alimoradi, H.; Shams, M.; Aghanajafi, C. A novel numerical investigation of erosion wear over various 90-degree elbow duct sections. Powder Technol. 2021, 380, 1–17. [Google Scholar] [CrossRef]
- Zeng, Q.F.; Qi, W.C. Simulation Analysis of Erosion-Corrosion Behaviors of Elbow under Gas-Solid Two-Phase Flow Conditions. Lubricants 2020, 8, 92. [Google Scholar] [CrossRef]
- Hernik, B. Numerical Study of the Erosion Process and Transport of Pulverized Coal-Air Mixture in the Mill-Duct System. Energies 2022, 15, 899. [Google Scholar] [CrossRef]
- Liu, J.G.; BaKeDaShi, W.L.; Li, Z.L.; Xu, Y.Z.; Ji, W.R.; Zhang, C.; Cui, G.; Zhang, R.Y. Effect of flow velocity on erosion corrosion of 90-degree horizontal elbow. Wear 2017, 376, 516–525. [Google Scholar] [CrossRef]
- Zeng, L.; Zhang, G.A.; Guo, X.P. Erosion–corrosion at different locations of X65 carbon steel elbow. Corros. Sci. 2014, 85, 318–330. [Google Scholar] [CrossRef]
- Owen, J.; Ramsey, C.; Barker, R.; Neville, A. Erosion-corrosion interactions of X65 carbon steel in aqueous CO2 environments. Wear 2018, 414, 376–389. [Google Scholar] [CrossRef]
- Yu, J.; Li, H.; Liu, X.; Yu, Y.; Xu, W.; Wang, H.; Liu, P. Numerical investigation of liquid-solid erosion in unbonded flexible pipes. Int. J. Press. Vessel. Pip. 2022, 199, 104743. [Google Scholar] [CrossRef]
- Jia, W.L.; Zhang, Y.R.; Li, C.J.; Luo, P.; Song, X.Q.; Wang, Y.Z.; Hu, X.Y. Experimental and numerical simulation of erosion-corrosion of 90° steel elbow in shale gas pipeline. J. Nat. Gas Sci. Eng. 2021, 89, 103871. [Google Scholar] [CrossRef]
- Elemuren, R.; Evitts, R.; Oguocha, I.N.A.; Kennell, G.; Gerspacher, R.; Odeshi, A.G. Full factorial, microscopic and spectroscopic study of erosion-corrosion of AISI 1018 steel elbows in potash brine-sand slurry. Tribol. Int. 2020, 142, 105989. [Google Scholar] [CrossRef]
- Fujisawa, N.; Yamagata, T.; Wada, K. Attenuation of wall-thinning rate in deep erosion by liquid droplet impingement. Ann. Nucl. Energy 2016, 88, 151–157. [Google Scholar] [CrossRef]
- Fujisawa, N. Liquid droplet impingement erosion on multiple grooves. Wear 2020, 462, 203513. [Google Scholar] [CrossRef]
- Chidambaram, P.K.; Kim, H.D. A numerical study on the water droplet erosion of blade surfaces. Comput. Fluids 2018, 164, 125–129. [Google Scholar] [CrossRef]
- Seksinsky, D.; Marshall, J.S. Droplet Impingement on a Surface at Low Reynolds Numbers. ASME J. Fluids Eng. 2020, 143, 021304. [Google Scholar] [CrossRef]
- Field, J.E. ELSI conference: Invited lecture: Liquid impact: Theory, experiment, applications. Wear 1999, 233–235, 1–12. [Google Scholar] [CrossRef]
- Kataoka, I.; Ishii, M.; Mishima, K. Generation and Size Distribution of Droplet in Annular Two-Phase Flow. ASME J. Fluids Eng. 1983, 105, 230–238. [Google Scholar] [CrossRef]
- Qiao, Q.; Cheng, G.; Li, Y.; Wu, W.; Hu, H.; Huang, H. Corrosion failure analyses of an elbow and an elbow-to-pipe weld in a natural gas gathering pipeline. Eng. Fail. Anal. 2017, 82, 599–616. [Google Scholar] [CrossRef]
- Stack, M.M.; Corlett, N.; Turgoose, S. Some recent advances in the development of theoretical approaches for the construction of erosion–corrosion maps in aqueous conditions. Wear 1999, 233–235, 535–541. [Google Scholar] [CrossRef]
- Huser, A.; Oddmund, K. Prediction of Sand Erosion in Process and Pipe Components. BHR Group Conf. Ser. Publ. 1998, 31, 217–228. [Google Scholar]
- Mclaury, B.S.; Shirazi, S.A. An Alternate Method to API RP 14E for Predicting Solids Erosion in Multiphase Flow. J. Energy Resour. Technol. 2000, 122, 115–122. [Google Scholar] [CrossRef]
- Jianwen, Z.; Aiguo, J.; Yanan, X.; Jianyun, H. Numerical Investigation on Multiphase Erosion-Corrosion Problem of Steel of Apparatus at a Well Outlet in Natural Gas Production. ASME J. Fluids Eng. 2018, 140, 121301. [Google Scholar] [CrossRef]
- Haugen, K.; Kvernvold, O.; Ronold, A.; Sandberg, R. Sand erosion of wear-resistant materials: Erosion in choke valves. Wear 1995, 186–187, 179–188. [Google Scholar] [CrossRef]
- Heitz, E. Mechanistically based prevention strategies of flow-induced corrosion. Electrochim. Acta 1996, 41, 503–509. [Google Scholar] [CrossRef]
- Stack, M.M.; Abdelrahman, S.M.; Jana, B.D. A new methodology for modelling erosion–corrosion regimes on real surfaces: Gliding down the galvanic series for a range of metal-corrosion systems. Wear 2010, 268, 533–542. [Google Scholar] [CrossRef]


Disclaimer/Publisher’s Note: The statements, opinions and data contained in all publications are solely those of the individual author(s) and contributor(s) and not of MDPI and/or the editor(s). MDPI and/or the editor(s) disclaim responsibility for any injury to people or property resulting from any ideas, methods, instructions or products referred to in the content. |
© 2023 by the authors. Licensee MDPI, Basel, Switzerland. This article is an open access article distributed under the terms and conditions of the Creative Commons Attribution (CC BY) license (https://creativecommons.org/licenses/by/4.0/).