

Effects of Cooling Rate on the Solidification Process of Pure Metal Al: Molecular Dynamics Simulations Based on the MFPT Method


Abstract
:1. Introduction
2. Methods
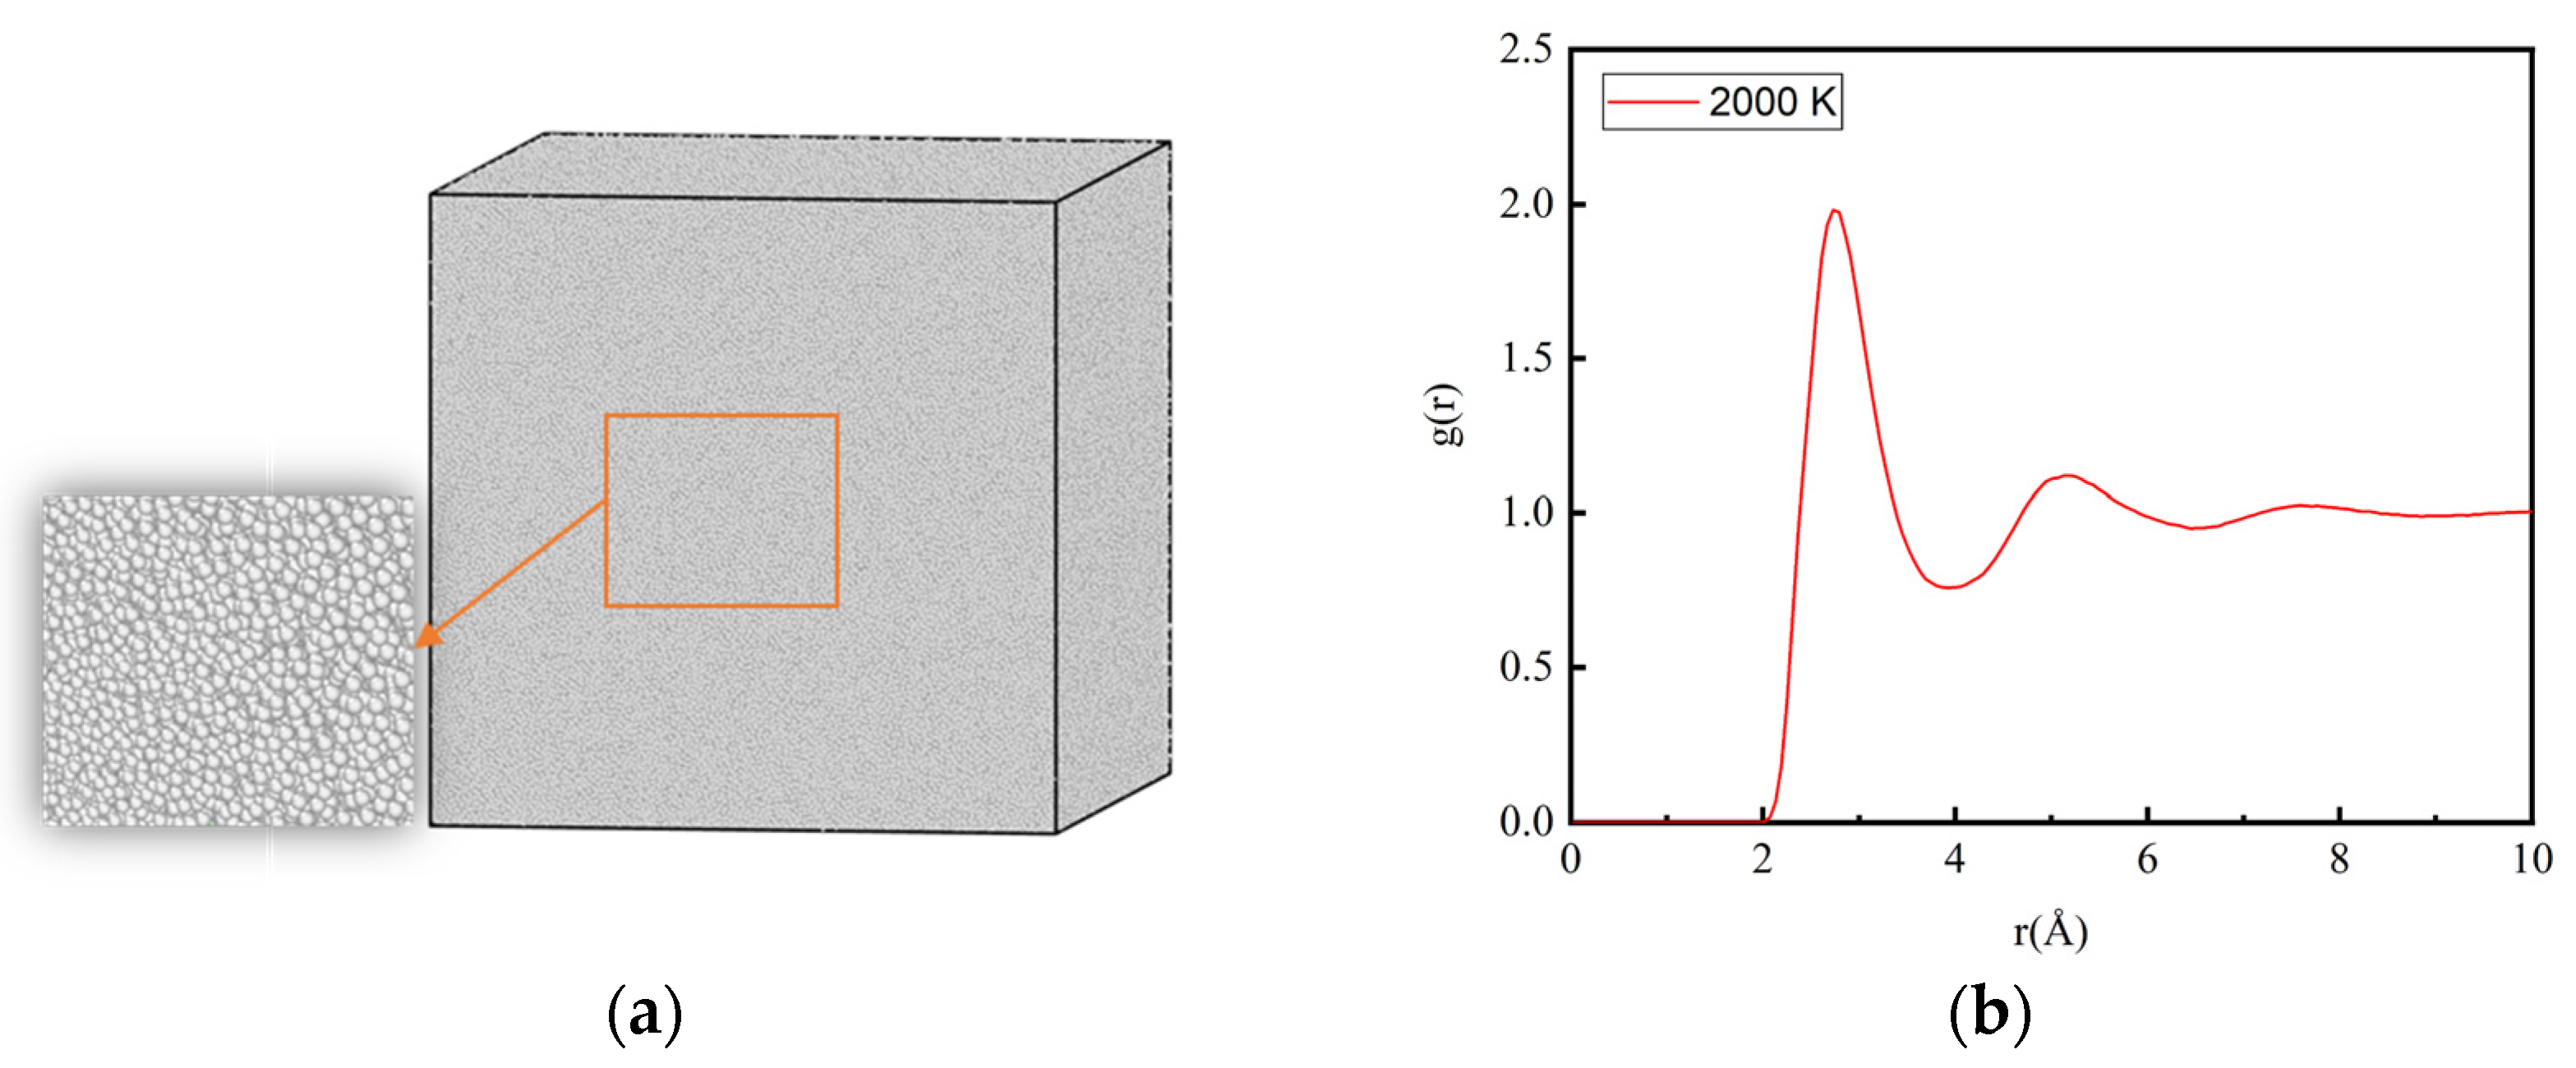
Simulation Details
3. Results and Discussion
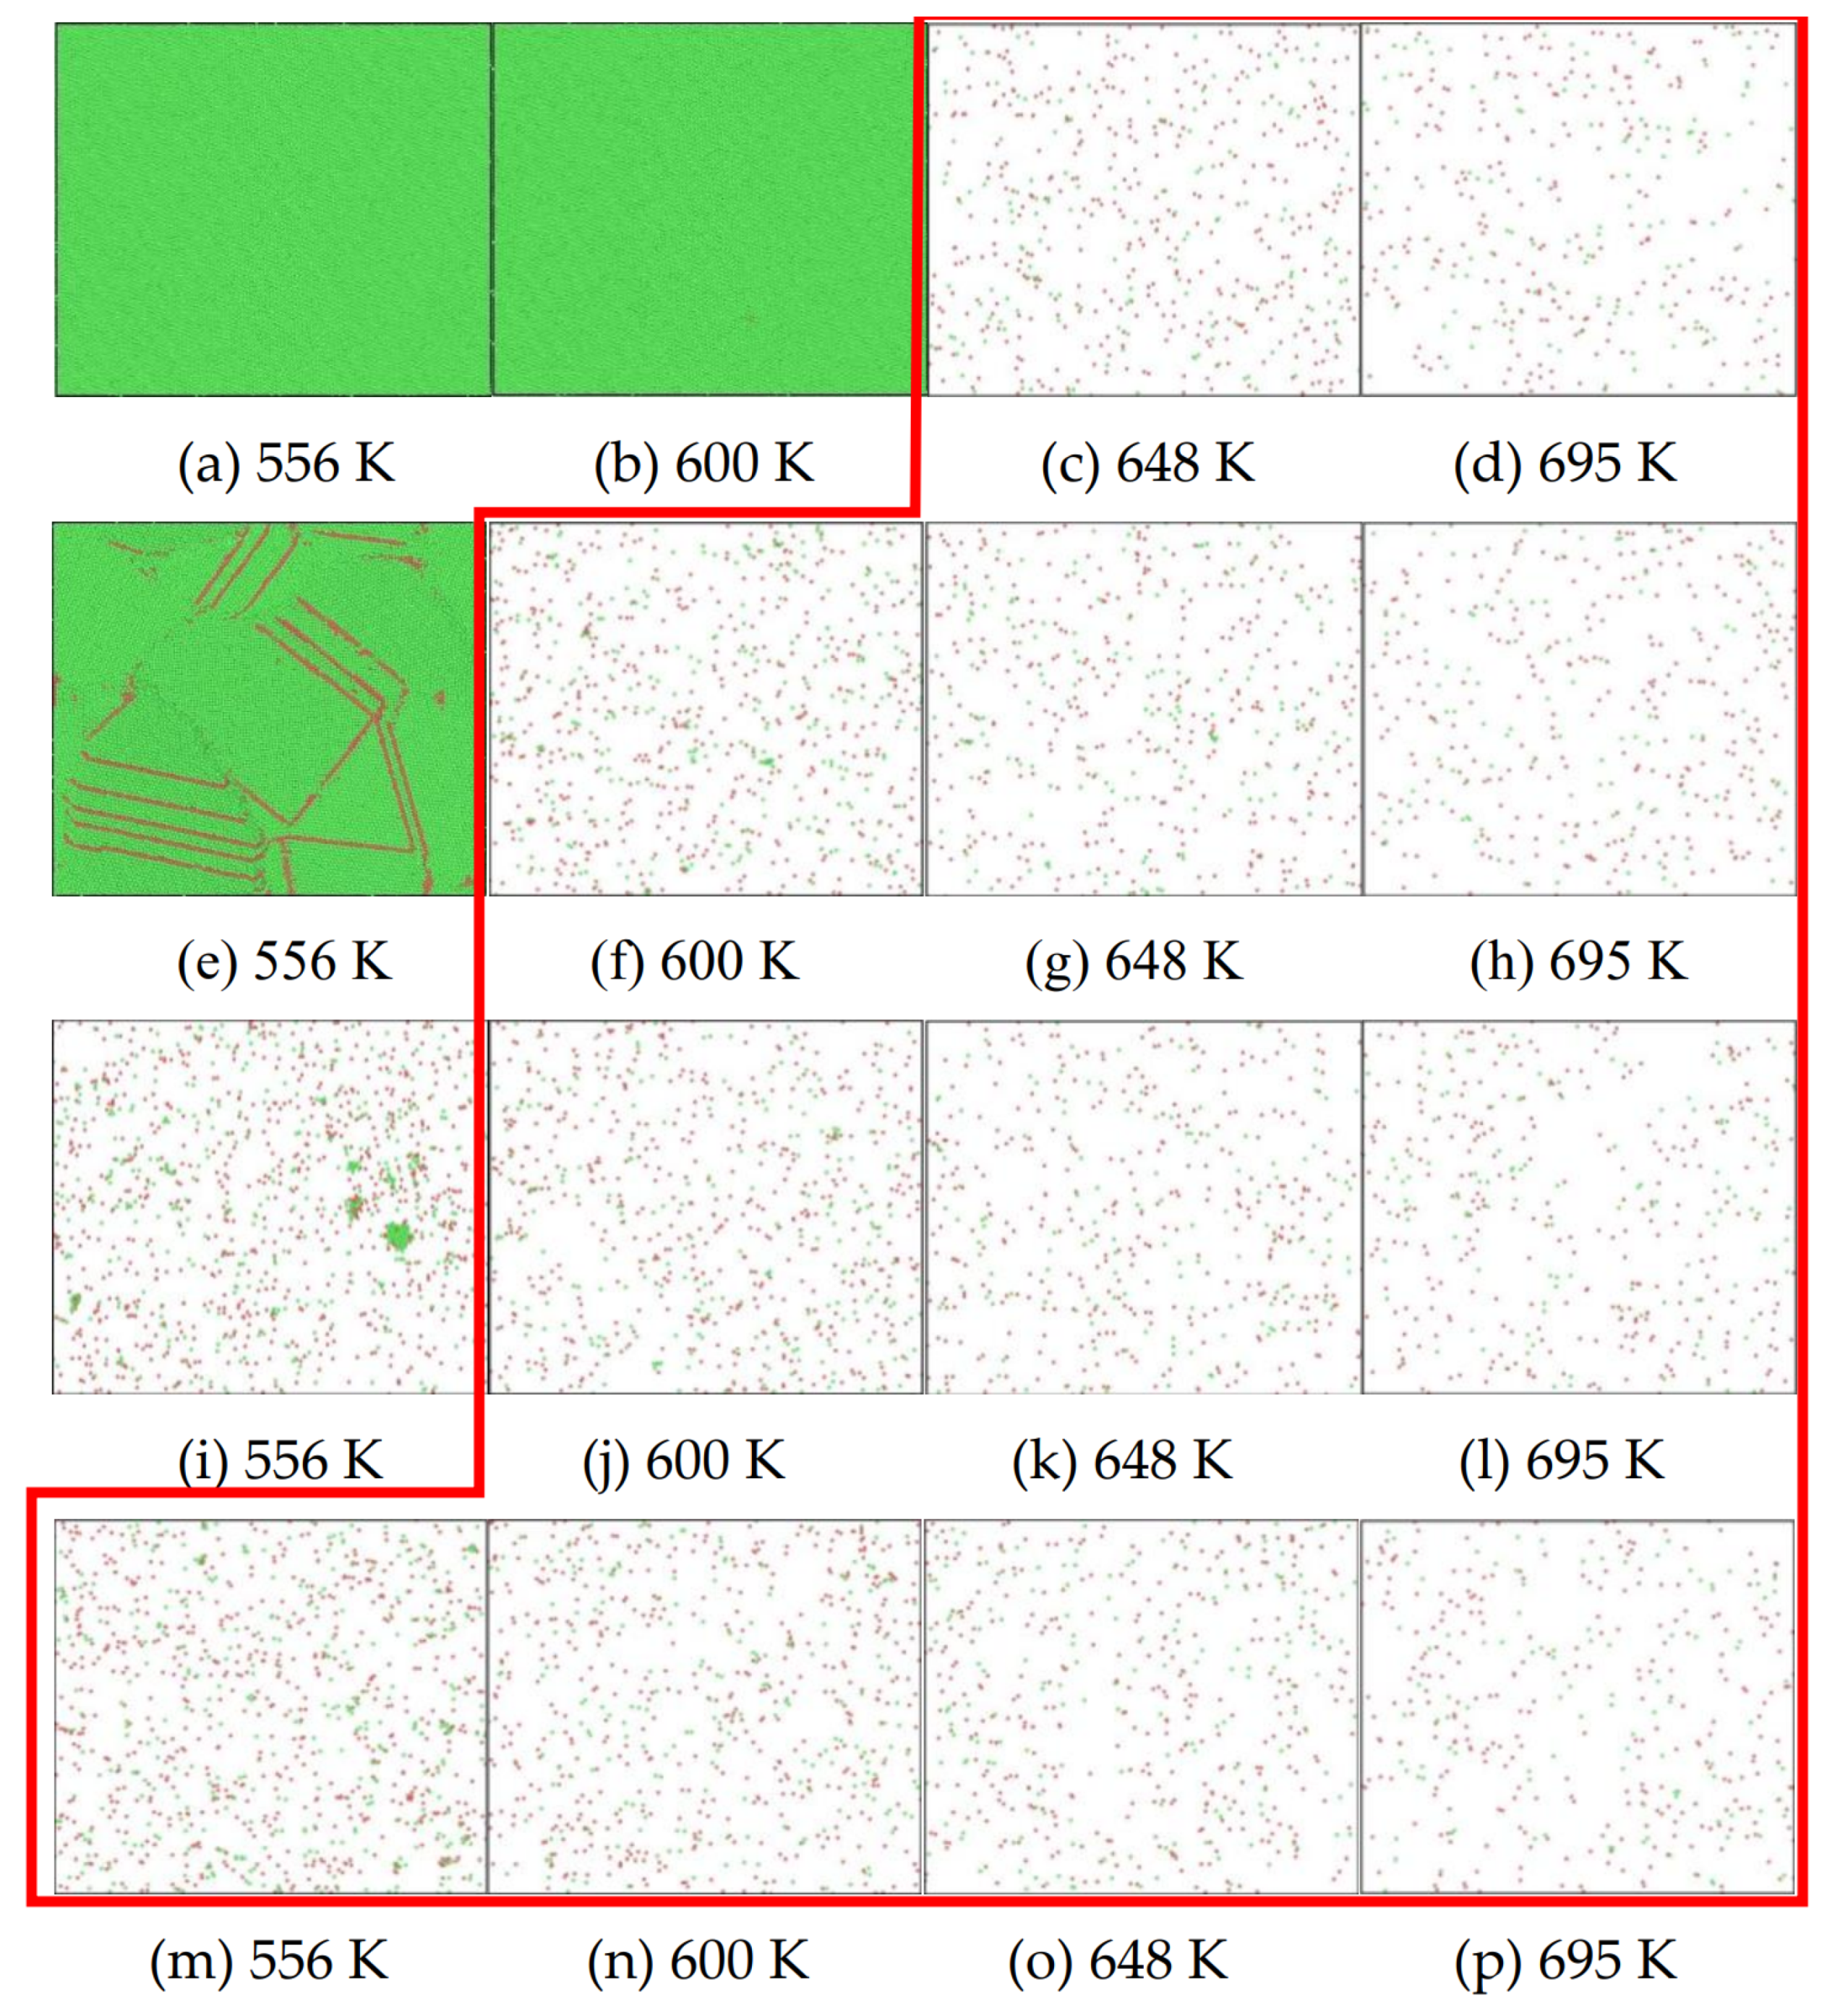
3.1. Microstructure Evolution
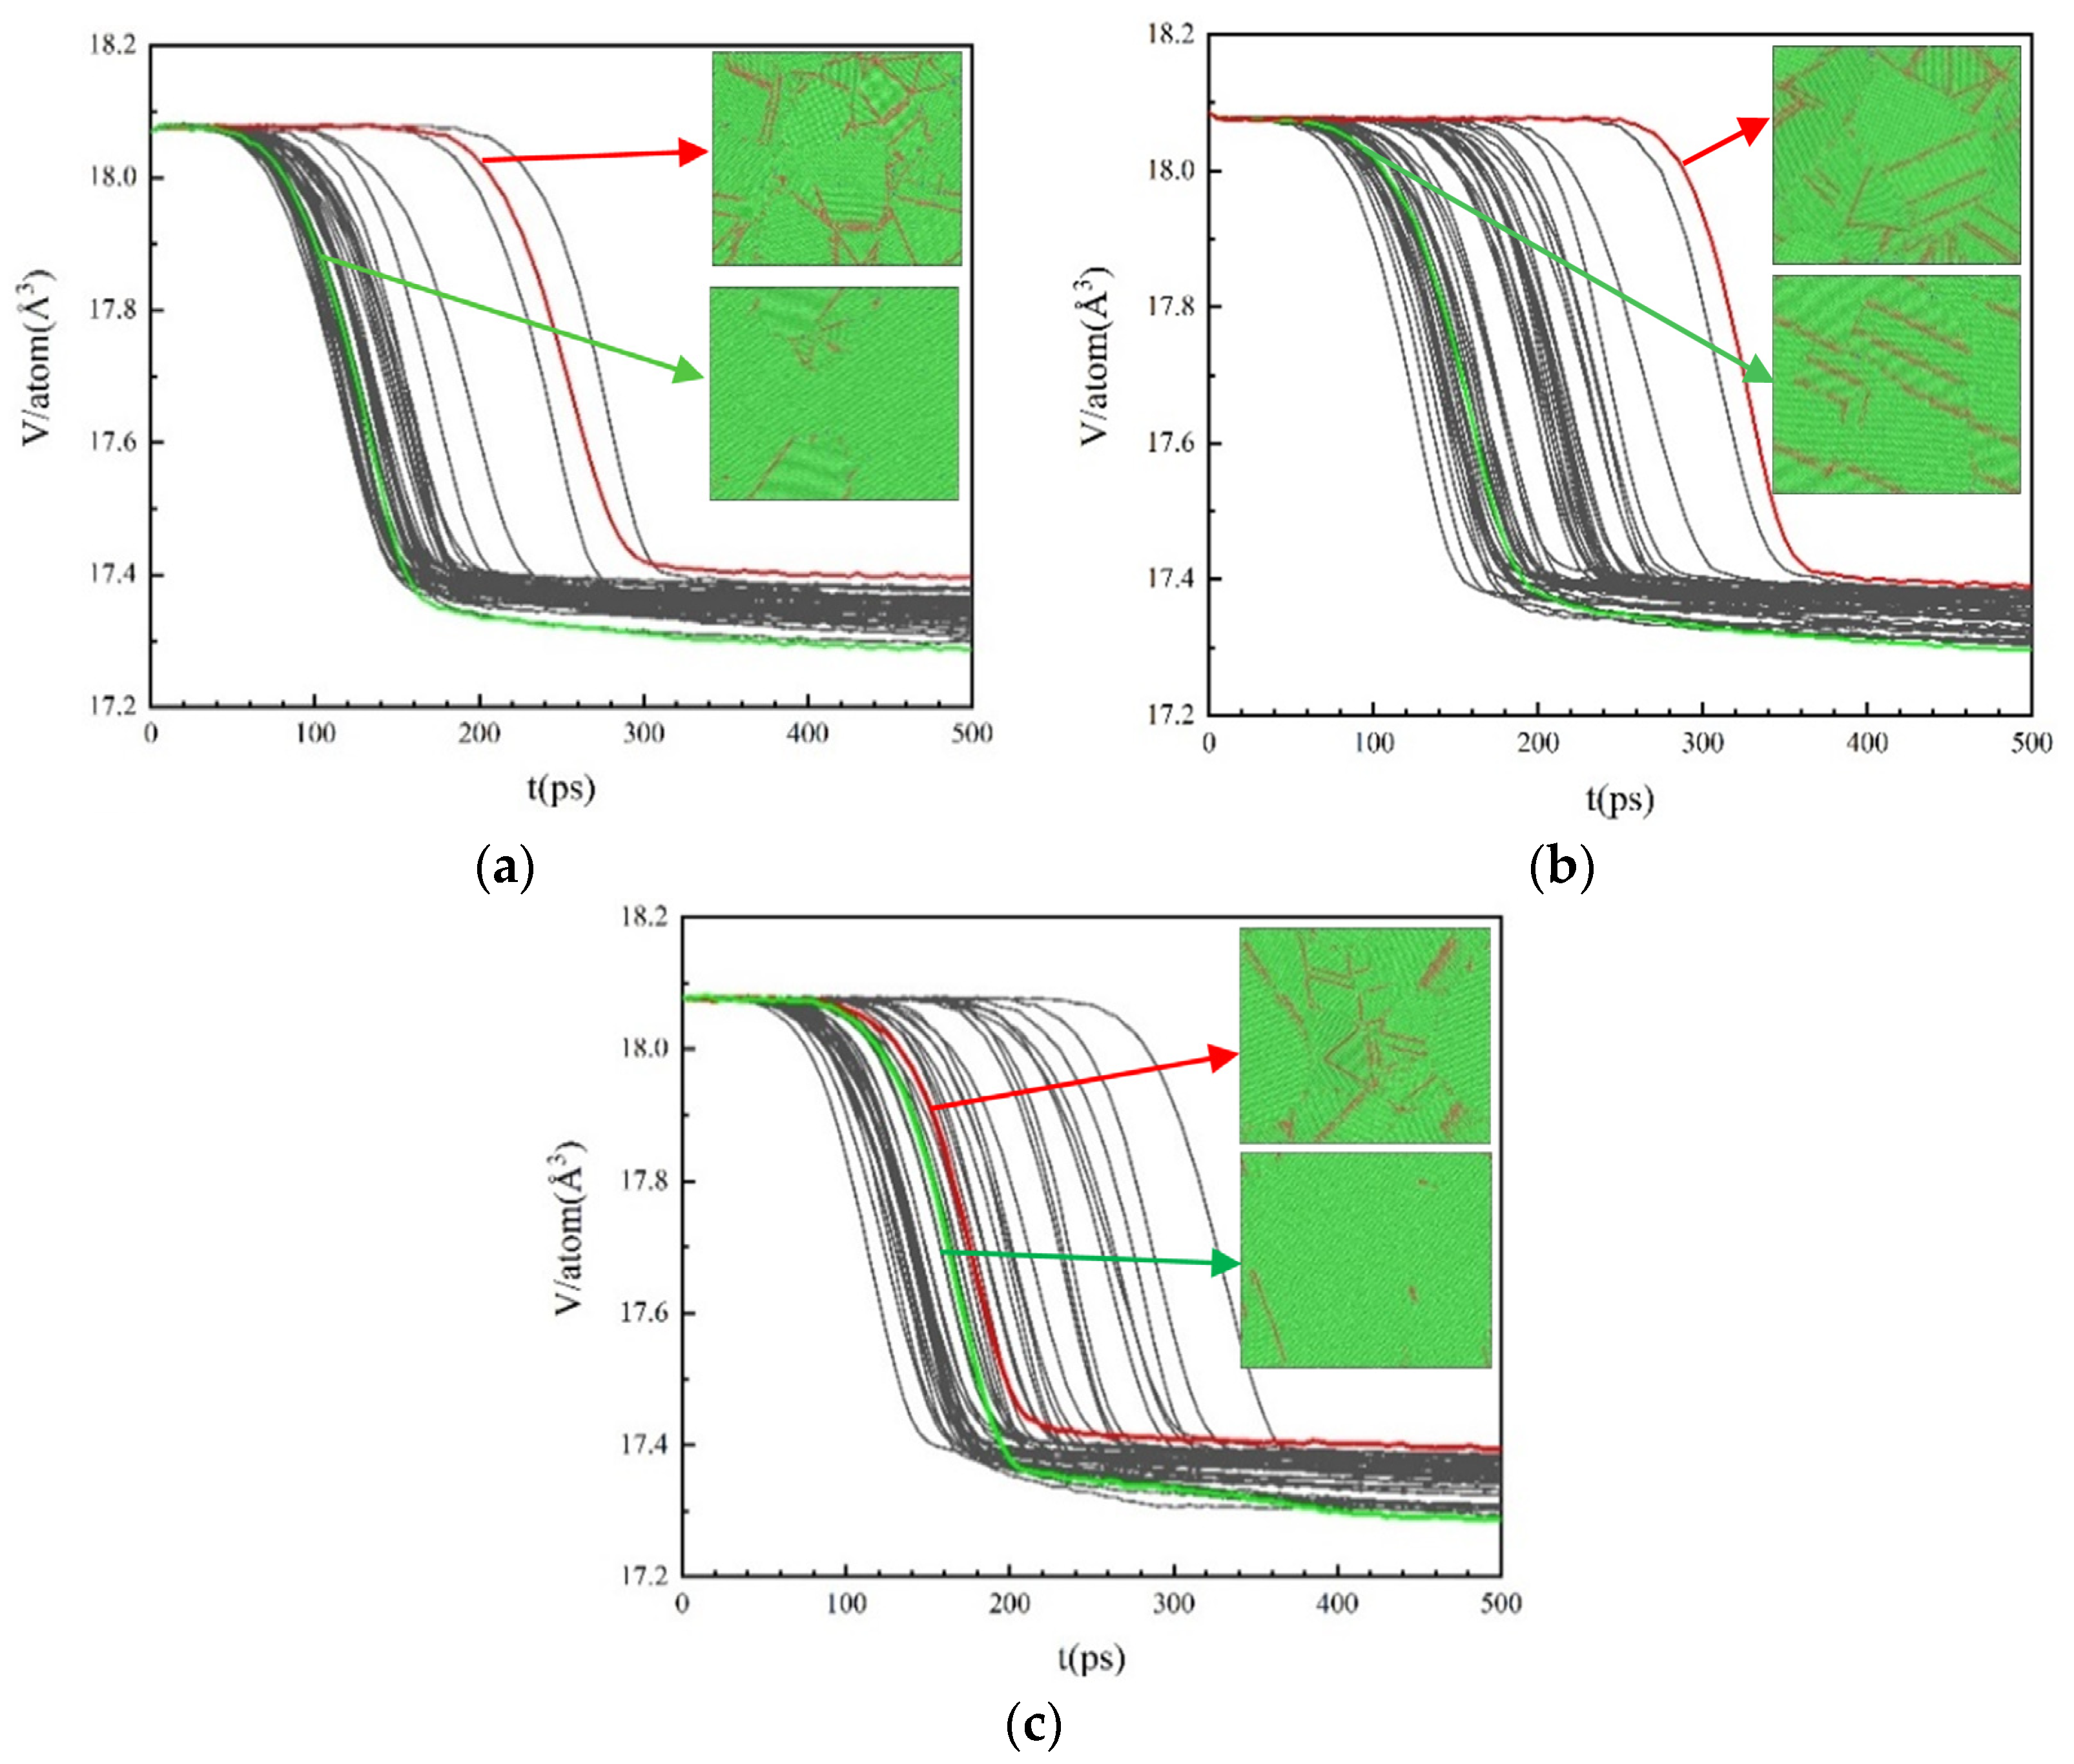
3.2. Influence of Cooling Rate on Nucleation Parameters
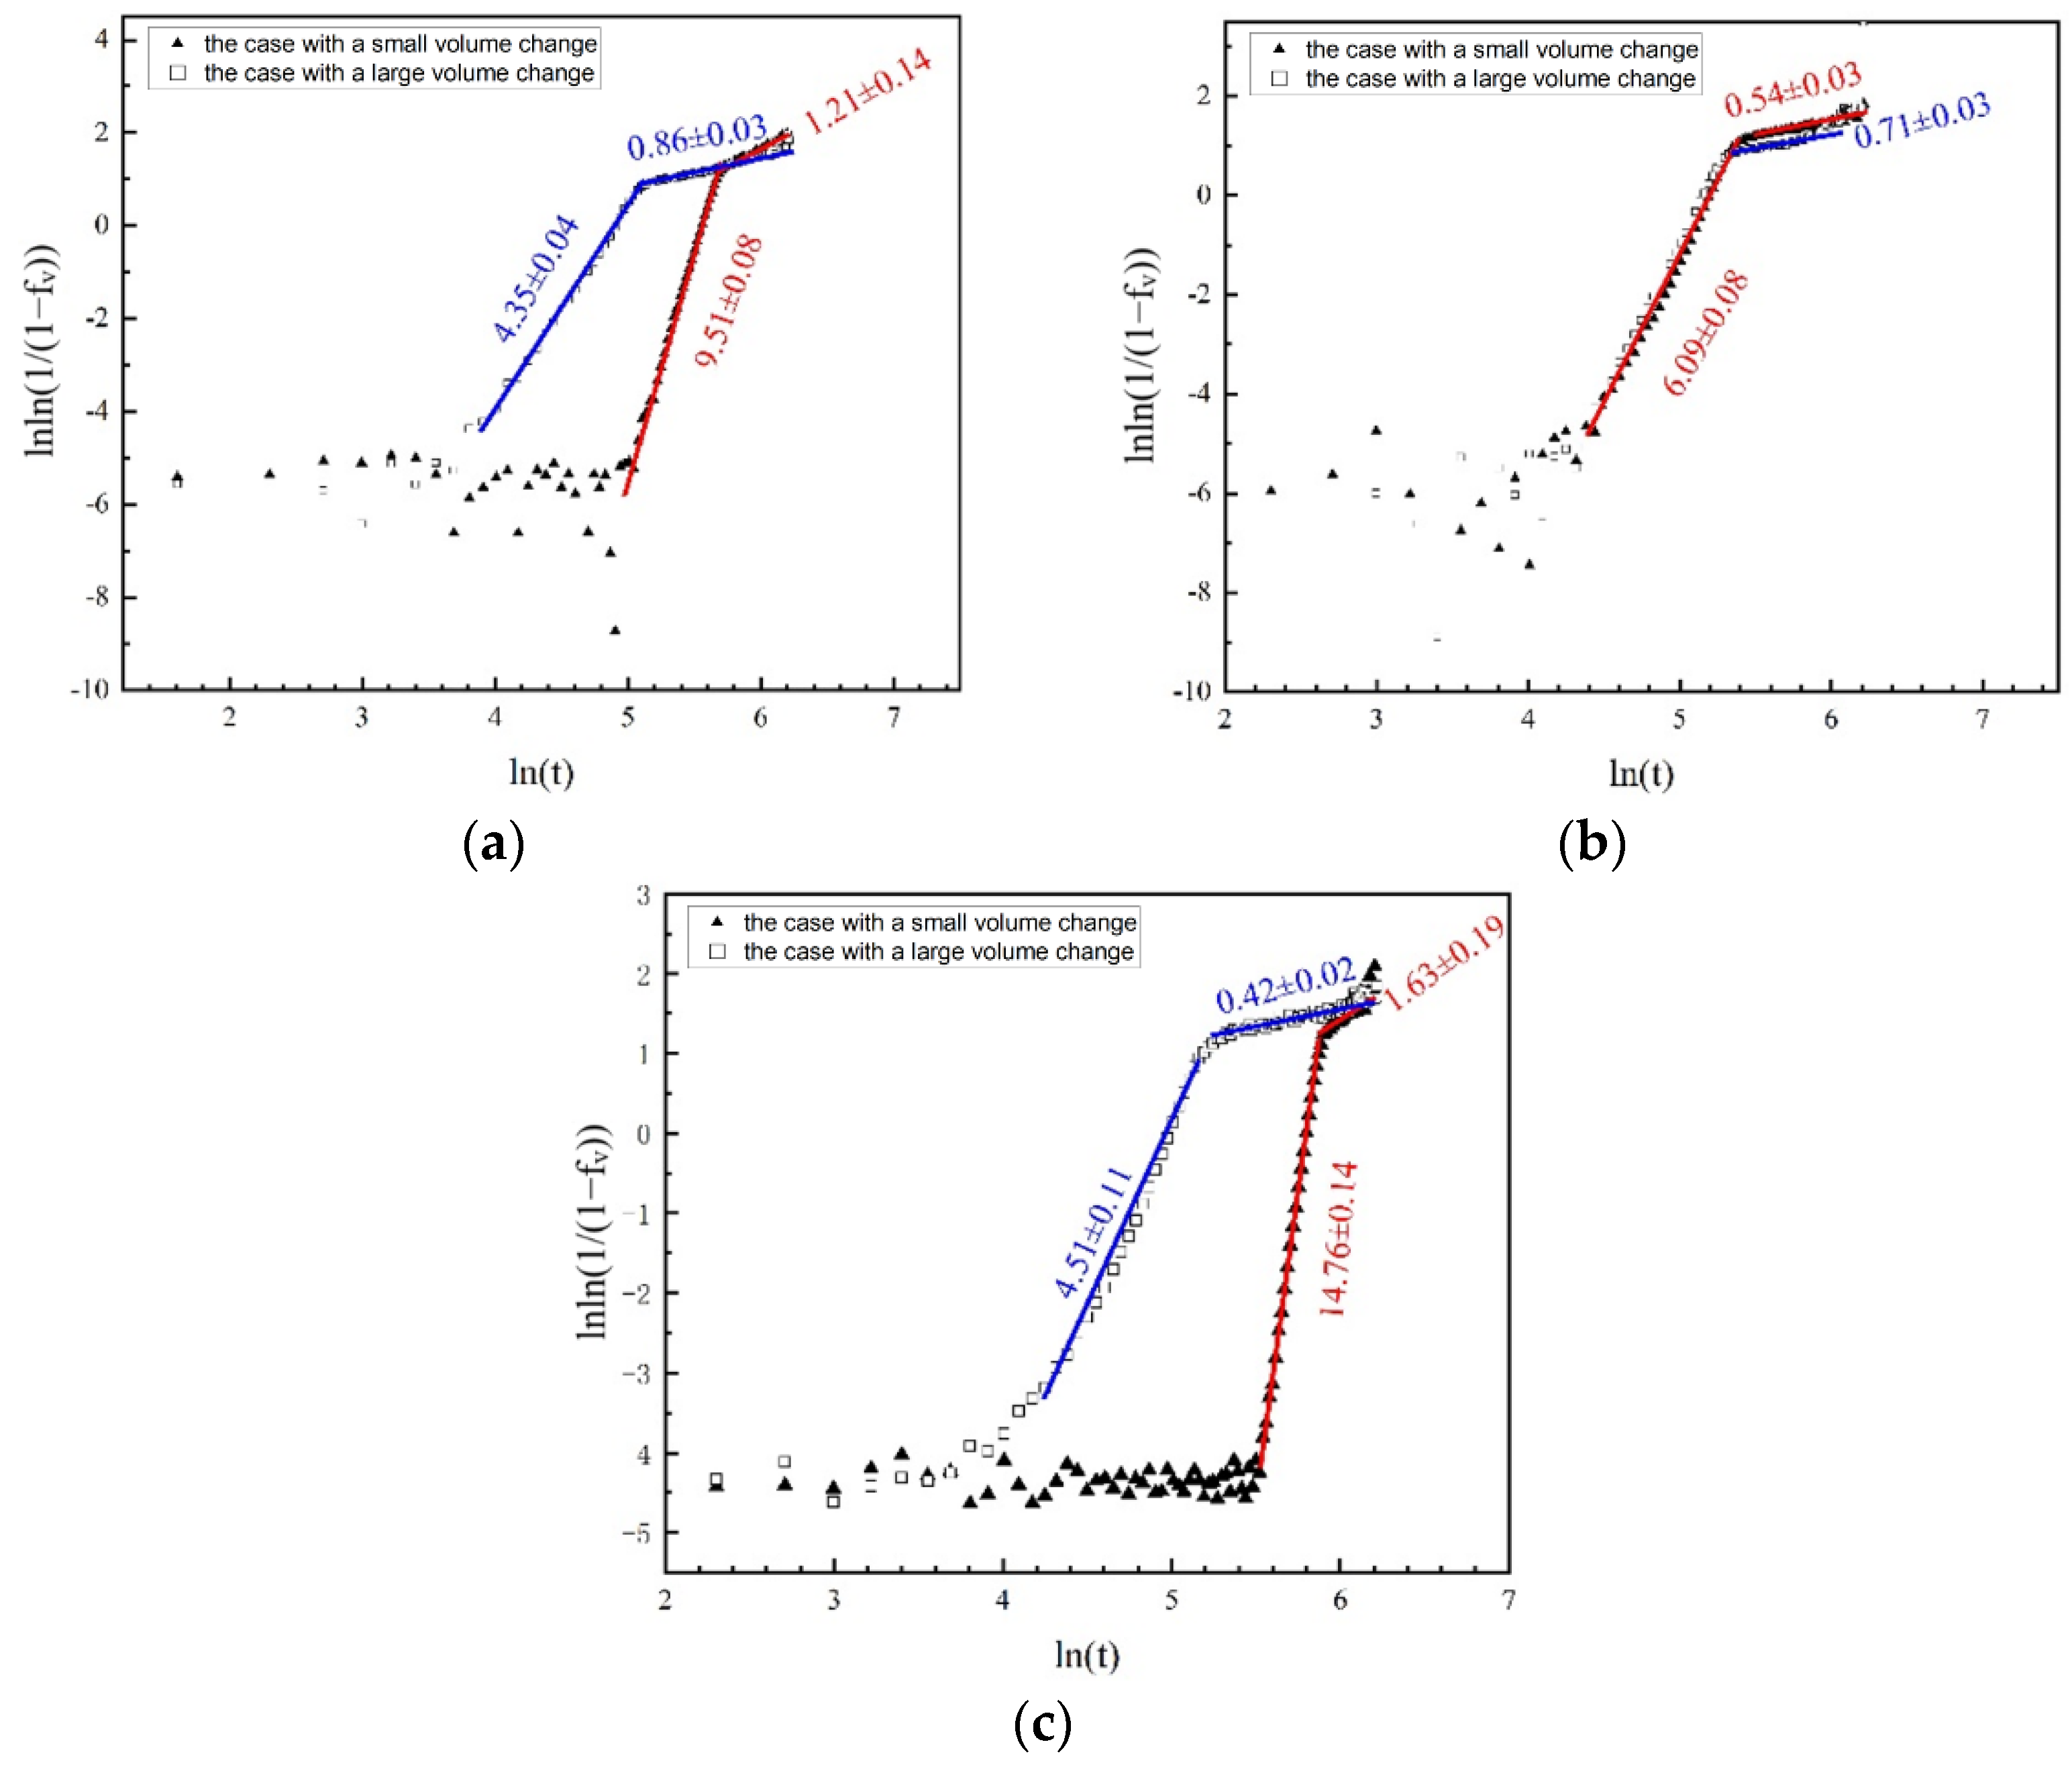
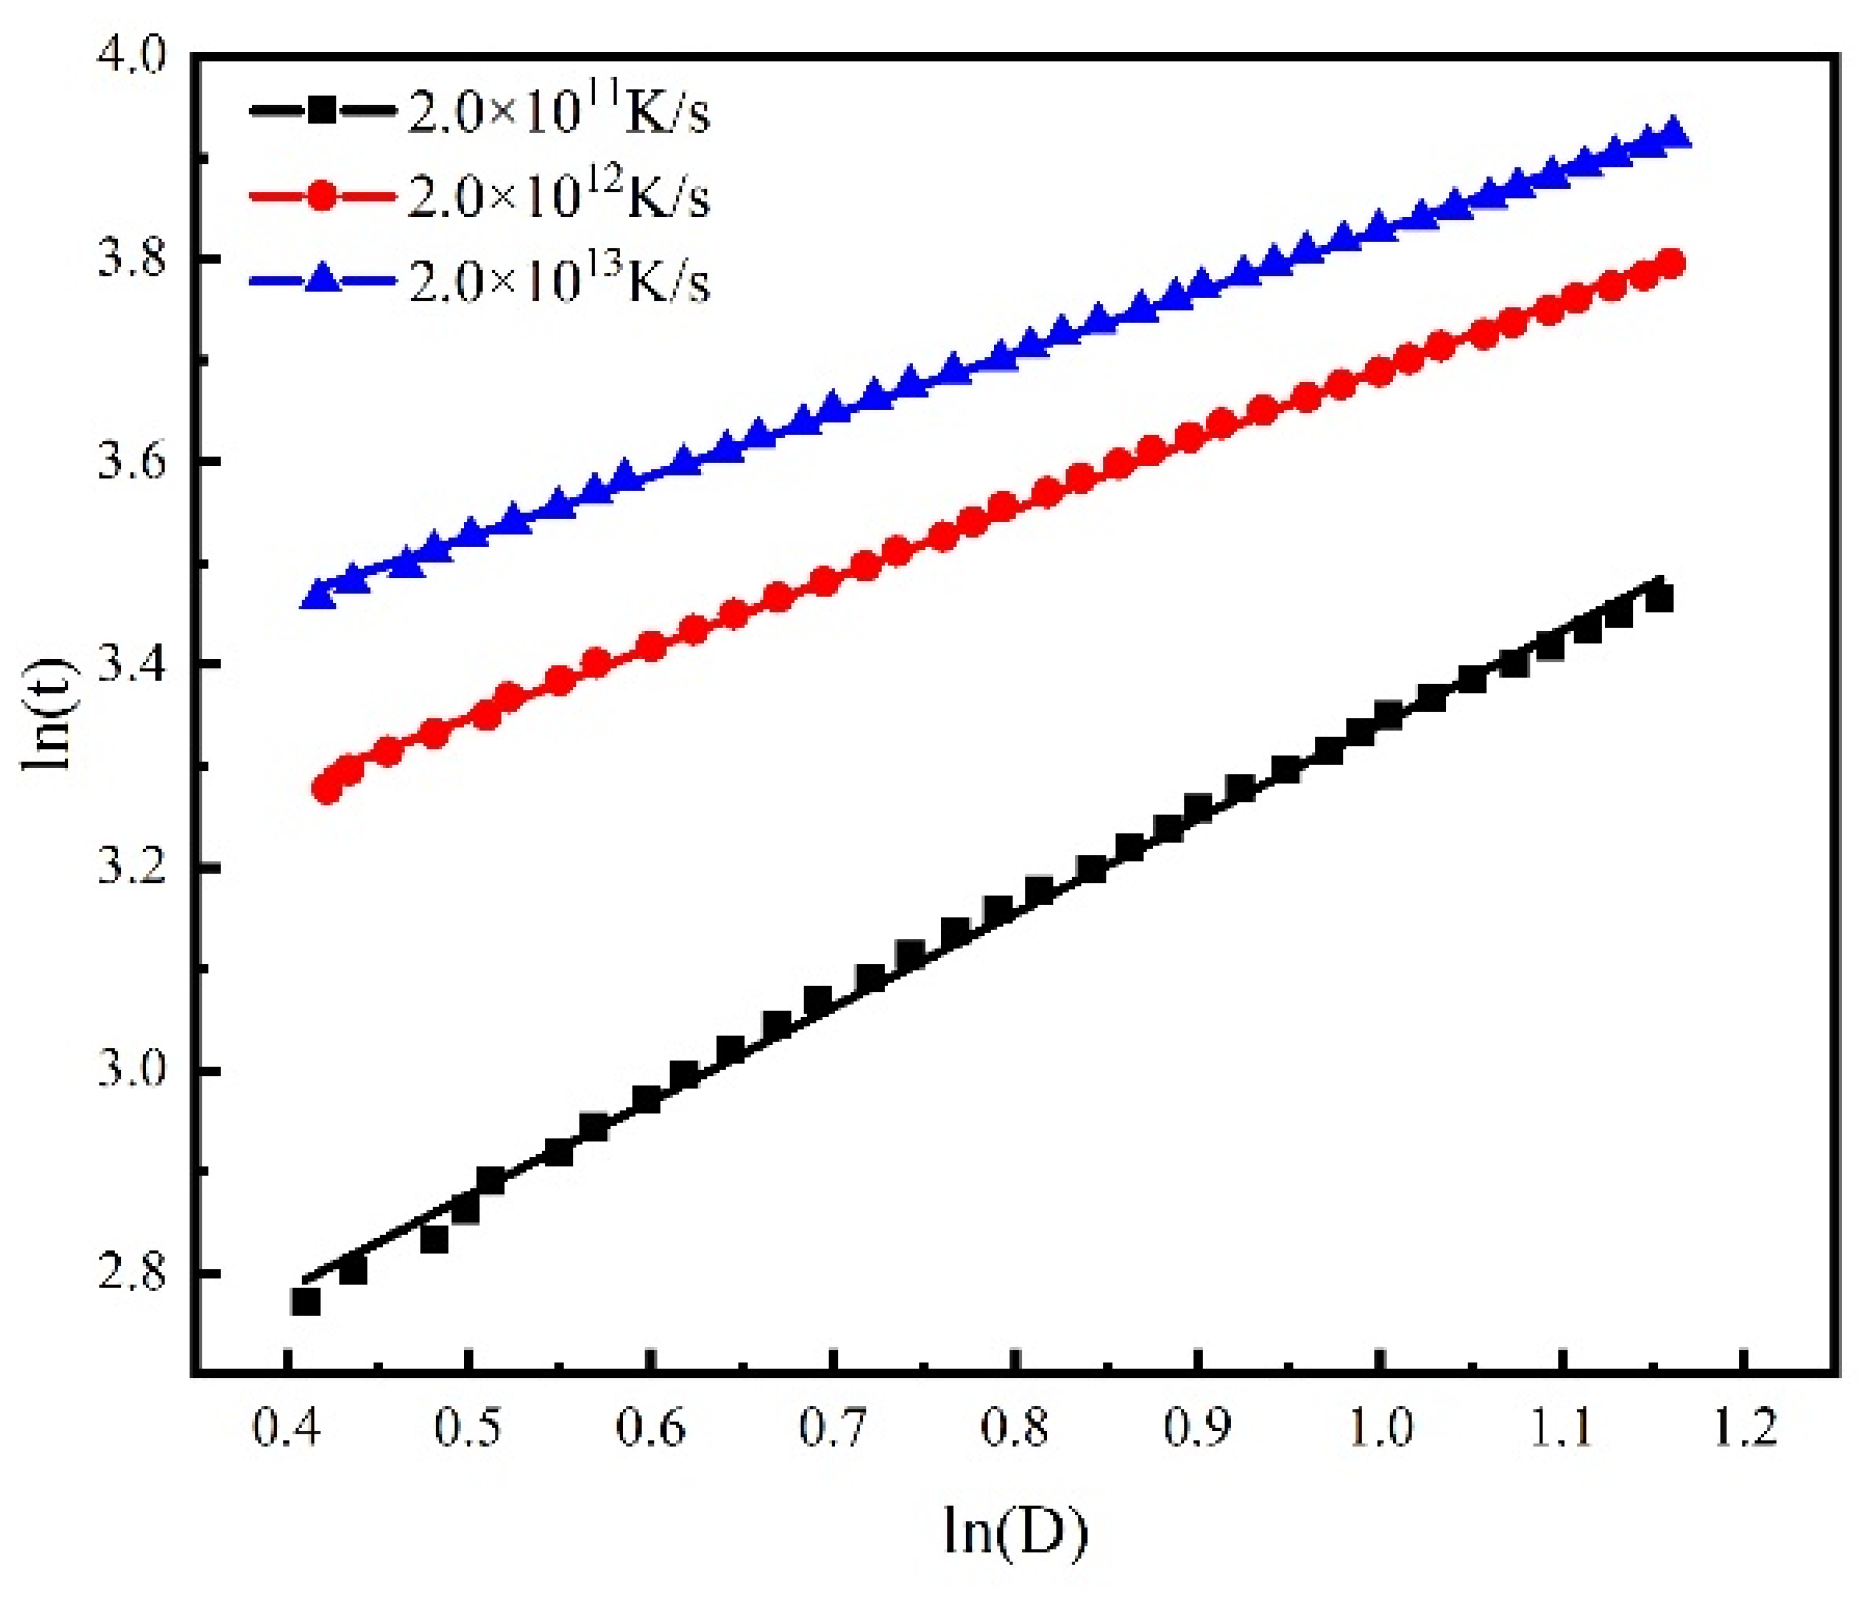
3.3. Influence of Cooling Rate on Crystal Growth
4. Conclusions
Author Contributions
Funding
Data Availability Statement
Acknowledgments
Conflicts of Interest
References
- Pinomaa, T.; Lindroos, M.; Walbrühl, M.; Provatas, N.; Laukkanen, A. The significance of spatial length scales and solute segregation in strengthening rapid solidification microstructures of 316L stainless steel. Acta Mater. 2020, 184, 1–16. [Google Scholar] [CrossRef]
- Liu, S.C.; Jie, J.C.; Guo, Z.K.; Yin, G.M.; Wang, T.M.; Li, T.J. Solidification microstructure evolution and its corresponding mechanism of metastable immiscible Cu80Fe20 alloy with different cooling conditions. J. Alloys Compd. 2018, 742, 99–106. [Google Scholar] [CrossRef]
- He, J.; Zhao, J.Z.; Ratke, L. Solidification microstructure and dynamics of metastable phase transformation in undercooled liquid Cu–Fe alloys. Acta Mater. 2006, 54, 1749–1757. [Google Scholar] [CrossRef]
- Xu, X.L.; Tang, C.; Wang, H.F.; An, Y.K.; Zhao, Y.H. Microstructure evolution and grain refinement mechanism of rapidly solidified single-phase copper based alloys. J. Mater. Sci. Technol. 2022, 128, 160–179. [Google Scholar] [CrossRef]
- Grisell, D.L.; Ralf, D.; Jutta, R. Atomistic insight into the non-classical nucleation mechanism during solidification in Ni. J. Chem. Phys. 2017, 146, 154702. [Google Scholar]
- Zheng, L.; Guo, Q.Z.; Dominik, D.; Zhou, L.; Cheng, B.X. The Effect of Process Parameters in Interdendritic-Melt Solidification Control Technique on the Microstructure and Properties of a Ni-Base Superalloy. Mater. Sci. Forum 2016, 879, 1129–1134. [Google Scholar] [CrossRef]
- Mi, G.F.; Dong, C.F.; Li, C.Y.; Wang, H.Y. Microstructures Development in Al-5Fe and Al-5Fe-3Y Alloys Solidified at Different Cooling Rate. Adv. Mater. Res. 2011, 189–193, 2462–2466. [Google Scholar] [CrossRef]
- Ren, W.M.; Chen, Z.Y.; Xiang, Z.L.; Chai, L.H. Microstructure and Properties of Rapidly Solidified Al-Zn-Mg-Cu Alloy. Mater. Sci. Forum 2020, 993, 203–207. [Google Scholar] [CrossRef]
- Vitalij, I.K. Classical Nucleation Theory. In Nucleation Theory; Lecture Notes in Physics; Springer: Dordrecht, the Netherlands, 2013; Volume 860, pp. 17–41. [Google Scholar]
- Neilson, G.F.; Weinberg, M.C. A test of classical nucleation theory: Crystal nucleation of lithium disilicate glass. J. Non-Cryst. Solids 1979, 34, 137–147. [Google Scholar] [CrossRef]
- Yan, R.; Ma, S.D.; Sun, W.Z.; Jing, T.; Dong, H.B. The solid–liquid interface free energy of Al: A comparison between molecular dynamics calculations and experimental measurements. Comput. Mater. Sci. 2020, 184, 109910. [Google Scholar] [CrossRef]
- Mahata, A.; Zaeem, M.A.; Baskes, M.I. Understanding homogeneous nucleation in solidification of aluminum by molecular dynamics simulations. Model. Simul. Mater. Sci. Eng. 2018, 26, 025007. [Google Scholar] [CrossRef]
- Jin, Y.M.M.; Khachaturyan, A.G. Atomic density function theory and modeling of microstructure evolution at the atomic scale. J. Appl. Phys. 2006, 100, 013519. [Google Scholar] [CrossRef]
- Grest, G.S.; Srolovitz, D.J.; Anderson, M.P. Computer simulation of grain growth—IV. Anisotropic grain boundary energies. Acta Metall. 1985, 33, 509–520. [Google Scholar] [CrossRef]
- Huang, C.M.; Joanne, C.L.; Patnaik, B.S.V.; Jayaganthan, R. Monte Carlo simulation of grain growth in polycrystalline materials. Appl. Surf. Sci. 2006, 252, 3997–4002. [Google Scholar] [CrossRef]
- Rappaz, M.; Gandin, C.-A. Probabilistic modelling of microstructure formation in solidification processes. Acta Metall. Et Mater. 1993, 41, 345–360. [Google Scholar] [CrossRef]
- Gandin, C.-A.; Rappaz, M. A Coupled Finite Element-cellular Automaton Model for the Prediction of Dendritic Grain Structures in Solidification Process. Acta Metall. Et Mater. 1994, 42, 2233–2246. [Google Scholar] [CrossRef]
- Zuo, X.J.; Coutinho, Y.; Chatterjee, S.; Moelans, N. Phase field simulations of FCC to BCC phase transformation in (Al)CrFeNi medium entropy alloys. Mater. Theory 2022, 6, 12. [Google Scholar] [CrossRef]
- Boldrini, J.L.; Caretta, B.M.C.; Fernández-Cara, E. Some optimal control problems for a two-phase field model of solidification. Rev. Matemática Complut. 2009, 23, 49. [Google Scholar] [CrossRef]
- Miyoshi, E.; Takaki, T. Validation of a novel higher-order multi-phase-field model for grain-growth simulations using anisotropic grain-boundary properties. Comput. Mater. Sci. 2016, 112, 44–51. [Google Scholar] [CrossRef]
- Miyoshi, E.; Takaki, T. Extended higher-order multi-phase-field model for three-dimensional anisotropic-grain-growth simulations. Comput. Mater. Sci. 2016, 120, 77–83. [Google Scholar] [CrossRef]
- Hou, Z.Y.; Liu, L.X.; Liu, R.S.; Tian, Z.A.; Wang, J.G. Kinetic details of nucleation in supercooled liquid Na: A simulation tracing study. Chem. Phys. Lett. 2010, 491, 172–176. [Google Scholar] [CrossRef]
- Auer, S.; Frenkel, D. Prediction of absolute crystal-nucleation rate in hard-sphere colloids. Nature 2001, 409, 1020–1023. [Google Scholar] [CrossRef] [PubMed]
- Aga, R.S.; Morris, J.R.; Hoyt, J.J.; Mendelev, M. Quantitative Parameter-Free Prediction of Simulated Crystal-Nucleation Times. Phys. Rev. Lett. 2006, 96, 245701. [Google Scholar] [CrossRef]
- Bokeloh, J.; Rozas, R.E.; Horbach, J.; Wilde, G. Nucleation barriers for the liquid-to-crystal transition in Ni: Experiment and simulation. Phys. Rev. Lett. 2011, 107, 145701. [Google Scholar] [CrossRef] [PubMed]
- Shibuta, Y.; Sakane, S.; Takaki, T.; Ohno, M. Submicrometer-scale molecular dynamics simulation of nucleation and solidification from undercooled melt: Linkage between empirical interpretation and atomistic nature. Acta Mater. 2016, 105, 328–337. [Google Scholar] [CrossRef]
- Hou, Z.Y.; Dong, K.J.; Tian, Z.A.; Liu, R.S.; Wang, Z.; Wang, J.G. Cooling rate dependence of solidification for liquid aluminium: A large-scale molecular dynamics simulation study. Phys. Chem. Chem. Phys. 2016, 18, 17461–17469. [Google Scholar] [CrossRef] [PubMed]
- Mahata, A.; Zaeem, M.A. Size effect in molecular dynamics simulation of nucleation process during solidification of pure metals: Investigating modified embedded atom method interatomic potentials. Model. Simul. Mater. Sci. Eng. 2019, 27, 085015. [Google Scholar] [CrossRef]
- Mendelev, M.I.; Kramer, M.J.; Becker, C.A.; Asta, M. Analysis of semi-empirical interatomic potentials appropriate for simulation of crystalline and liquid Al and Cu. Philos. Mag. 2008, 88, 1723–1750. [Google Scholar] [CrossRef]
- Adler, J.; Pine, P. Visualization techniques for modelling carbon allotropes. Comput. Phys. Commun. 2009, 180, 580–582. [Google Scholar] [CrossRef]
- Stukowski, A. Structure identification methods for atomistic simulations of crystalline materials. Model. Simul. Mater. Sci. Eng. 2012, 20, 045021. [Google Scholar] [CrossRef]
- Asadi, E.; Asle Zaeem, M.; Nouranian, S.; Baskes, M.I. Two-phase solid–liquid coexistence of Ni, Cu, and Al by molecular dynamics simulations using the modified embedded-atom method. Acta Mater. 2015, 86, 169–181. [Google Scholar] [CrossRef]
- Jan, W.; Reinhard, S.; David, R. New method to analyze simulations of activated processes. J. Chem. Phys. 2007, 126, 134103. [Google Scholar]
- Anatolii, V.M.; Bulat, N.G. A method for analyzing the non-stationary nucleation and overall transition kinetics: A case of water. J. Chem. Phys. 2014, 140, 024104. [Google Scholar]
- Anatolii, V.M.; Bulat, N.G. Kinetics of the Crystalline Nuclei Growth in Glassy Systems. Phys. Chem. Chem. Phys. 2017, 19, 11340. [Google Scholar]
- Eisenstein, J.C.; Wang, L.; Cai, Y.; Wu, H.A.; Luo, S.N. Crystallization in supercooled liquid Cu: Homogeneous nucleation and growth. J. Chem. Phys. 2015, 142, 064704. [Google Scholar]
- Stukowski, A. Visualization and analysis of atomistic simulation data with OVITO—The Open Visualization Tool. Model. Simul. Mater. Sci. Eng. 2010, 18, 015012. [Google Scholar] [CrossRef]
- Wang, G.Y.; Zheng, K.; Huang, Y.X.; Yu, J.B.; Wu, H.; Chen, X.P.; Tao, L.Q. Investigation of the positive effect of doping Al atom to the adsorption of CO2 on BN nanosheets: A DFT study. Phys. Chem. Chem. Phys. 2020, 22, 9368–9374. [Google Scholar] [CrossRef]
- Avrami, M. Kinetics of Phase Change. II Transformation-Time Relations for Random Distribution of Nuclei. J. Chem. Phys. 1940, 8, 212. [Google Scholar] [CrossRef]
- William, J.; Mehl, R. Reaction kinetics in processes of nucleation and growth. Trans. Metall. Soc. AIME 1939, 135, 416–442. [Google Scholar]
- Cahn, J.W. The kinetics of grain boundary nucleated reactions. Acta Metall. 1956, 4, 449–459. [Google Scholar] [CrossRef]
- Burke, J.E. Some factors affecting rate of grain growth in metals. Aime Trans. 1949, 180, 73–91. [Google Scholar]
- Beck, P.A.; Holzworth, M.L.; Hu, H. Instantaneous rates of grain growth. Phys. Rev. 1948, 73, 526–527. [Google Scholar] [CrossRef]
- Fateme, N.; Sara, K.; Bita, P.; Hamed, M. Recent advances in the kinetics of normal/abnormal grain growth: A review. Arch. Civ. Mech. Eng. 2021, 21, 29. [Google Scholar]


| T | Cooling Rate | |||
|---|---|---|---|---|
| 2.0 × 10¹⁰ K/s | 2.0 × 10¹¹ K/s | 2.0 × 10¹² K/s | 2.0 × 10¹³ K/s | |
| 556 K | / | / | / |  |
| 600 K | / |  | 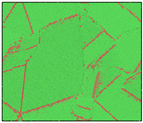 | 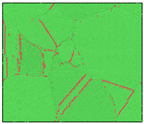 |
| 648 K | 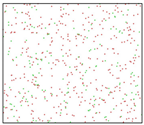 | 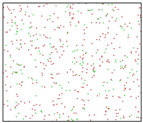 |  |  |
| 695 K | 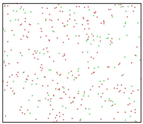 | 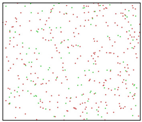 |  | 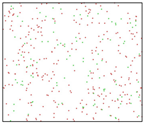 |
| Cooling Rate | Temperature of Isothermal Solidification |
|---|---|
| 2.0 × 10¹¹ K/s | 600 K |
| 2.0 × 10¹² K/s | |
| 2.0 × 10¹³ K/s |
| Time | Cooling Rate | ||
|---|---|---|---|
| 2.0 × 10¹¹ K/s | 2.0 × 10¹² K/s | 2.0 × 10¹³ K/s | |
| 10 ps |  | 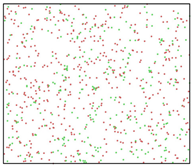 |  |
| 20 ps | 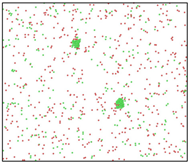 | 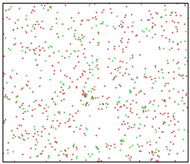 | 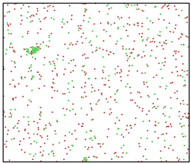 |
| 100 ps | 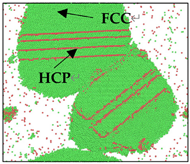 |  | 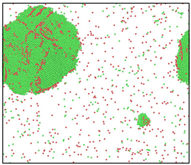 |
| 150 ps | 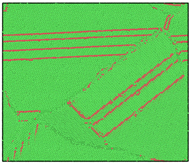 | 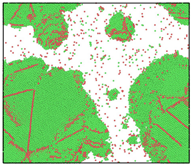 |  |
| 250 ps | 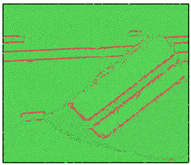 | 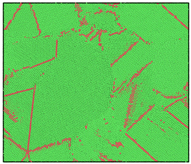 |  |
| 500 ps | 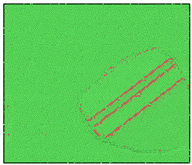 | 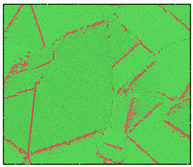 |  |
| Cooling Rate | n* | r* | |
|---|---|---|---|
| 2.0 × 10¹¹ K/s | 20 | 8.18 × 1033 m−3s−1 | 0.44 nm |
| 2.0 × 10¹² K/s | 12.18 | 3.55 × 1033 m−3s−1 | 0.37 nm |
| 2.0 × 10¹³ K/s | 8.09 | 3.05 × 1033 m−3s−1 | 0.32 nm |
Publisher’s Note: MDPI stays neutral with regard to jurisdictional claims in published maps and institutional affiliations. |
© 2022 by the authors. Licensee MDPI, Basel, Switzerland. This article is an open access article distributed under the terms and conditions of the Creative Commons Attribution (CC BY) license (https://creativecommons.org/licenses/by/4.0/).
Share and Cite
Chen, X.; Fan, W.; Jiang, W.; Lin, D.; Wang, Z.; Hui, X.; Wang, Y. Effects of Cooling Rate on the Solidification Process of Pure Metal Al: Molecular Dynamics Simulations Based on the MFPT Method. Metals 2022, 12, 1504. https://doi.org/10.3390/met12091504
Chen X, Fan W, Jiang W, Lin D, Wang Z, Hui X, Wang Y. Effects of Cooling Rate on the Solidification Process of Pure Metal Al: Molecular Dynamics Simulations Based on the MFPT Method. Metals. 2022; 12(9):1504. https://doi.org/10.3390/met12091504
Chicago/Turabian StyleChen, Xiaohua, Weijie Fan, Wenwen Jiang, Deye Lin, Zidong Wang, Xidong Hui, and Yanlin Wang. 2022. "Effects of Cooling Rate on the Solidification Process of Pure Metal Al: Molecular Dynamics Simulations Based on the MFPT Method" Metals 12, no. 9: 1504. https://doi.org/10.3390/met12091504
APA StyleChen, X., Fan, W., Jiang, W., Lin, D., Wang, Z., Hui, X., & Wang, Y. (2022). Effects of Cooling Rate on the Solidification Process of Pure Metal Al: Molecular Dynamics Simulations Based on the MFPT Method. Metals, 12(9), 1504. https://doi.org/10.3390/met12091504