Article

Constitutive Equation and Characterization of the Nickel-Based Alloy 825

1
School of Materials Science and Engineering, Taiyuan University of Science and Technology, Taiyuan 030024, China
2
School of Mechanical Engineering, Taiyuan University of Science and Technology, Taiyuan 030024, China
3
State Key Laboratory of Rolling and Automation, Northeastern University, Shenyang 110819, China
*
Author to whom correspondence should be addressed.
Metals 2022, 12(9), 1496; https://doi.org/10.3390/met12091496
Submission received: 30 July 2022 / Revised: 22 August 2022 / Accepted: 5 September 2022 / Published: 9 September 2022
(This article belongs to the Special Issue Advanced Technology in Microalloyed Steels)

Abstract

:
In this contribution, a series of isothermal compression tests for the 825 nickel-based alloy were performed using a Gleeble-3800 computer-controlled thermomechanical simulator at the compression temperature range of 850 °C to 1150 °C and the strain rate range of 0.14 s−1 to 2.72 s−1. The hot deformation equation of the alloy is derived from the piecewise model based on the theory of work hardening-dynamic recovery and dynamic recrystallization (DRX), respectively. Comparisons between the predicted and experimental data indicate that the proposed constitutive model had a highly accurate prediction. The deformation rate and temperature effect were associated with microstructural change, and the evolution of the microstructure was analyzed through electron backscatter diffraction (EBSD) and transmission electron microscopy (TEM). The dislocation densities of the alloy at the deformation of 850 °C and 2.72 s−1 is higher than at the other deformation, the higher dislocation density is the higher stored energy and the higher degree of DRX. As well, two types of DRX nucleation mechanisms have been identified: discontinuous dynamic recrystallization (DDRX) and continuous dynamic recrystallization (CDRX). Changes in grain boundary have significant effect on the DRX nucleation of the alloy, twin boundaries act as potential barriers limiting dislocation slip and motion and eventually leading to the accumulation of dislocation during plastic deformation. This study identified that the major contribution which results in the growth of new twins in DRX grains is the new boundary of Σ3 twins.

1. Introduction

Nickel-based alloys is a kind of alloy based on nickel, which has high strength, oxidation resistance, and corrosion resistance and other comprehensive properties at high temperature [1]. Because of its excellent mechanical properties, it is widely used as a favorable material in many fields, such as aviation and aerospace industries, nuclear energy, petroleum, etc., [2,3]. For example, nickel-based alloys 617 were used in the super-supercritical power plant [4]. Gaurav et al. [5] investigated the dissimilar welds indicate that the welds hot cracking and carbon migration of martensitic P91/P92 and austenitic can be solved by using nickel-based filler wire due to its intermediate physical and mechanical properties. Commonly, hot forming is usually used to manufacture components. However, due to the high alloying degree of nickel, chromium, molybdenum, niobium copper, aluminum, titanium, etc., and severe interaction among alloying elements, alloys often suffer complex microstructure evolution and hot deformation processes [6,7]. Furthermore, owing to the mediocre high temperature plasticity of the nickel alloy, the surface of the plate is easily cracked during the hot rolling process [8,9]. Therefore, in order to obtain the optimum microstructure and mechanical properties of nickel-based alloys, it is crucial to investigate hot deformation behavior and microstructural evolution during hot deformation. It is also very important to promote related applications.
Over the past decades, the development computer code to simulation model technology has promoted the successful application of the material finite element. The finite element simulation model has been extensively used to analyses and optimize hot rolling, forging, extrusion, and other material forming processes [10,11]. It is well-known that the finite element simulation model can be truly reliable only when a high-precision constitutive equation is built. In recent years, many constitutive models have been reported in international publications, constitutive models are divided into three main categories: phenomenological constitutive model (PCM), physical-based constitutive model (PBCM), and artificial neural network (ANN) [12]. The common features of PCM are based on empirical observations, it consists of some mathematical functions to define the flow stress. It is widely used for the simulation of metal or alloy-forming processes at high deformation rates and temperatures. Nitin et al. [13] Developed two phenomenological based constitutive models of modified Fields–Backofen (m-FB) and Khan–Huang–Liang (KHL) for analyzing the deformation behavior of Austenitic Stainless Steel 316, the result revealed that Khan–Huang–Liang (KHL) model was preferred for the flow stress prediction. It is worth noting that there are some potential deficiencies in PCM. The PCM cannot accurately describe the experimental results when the material’s internal microstructure changes significantly. Compared to PCM, PBCM can accurately define material deformation behavior, taking into account the deformation mechanism such as thermal activation, slips kinetics, and dislocation dynamics. Lin et al. [14] divided the complete hot deformation process into four stages according to the work hardening (WH), dynamic recovery (DRV), and DRX. They are work hardening stage, transition stage, softening stage, and steady stage. Wang et al. [15] divided the complete hot deformation process into two stages according to the dislocation density theory and kinetics of DRX. The feature of ANN [16] is a large class of parallel processing architectures, and it is not necessary to postulate a mathematical pattern at the beginning. The relationship can be built by input layer, hidden layers, and the output layer through adequate training from the experimental data. Meanwhile, the ANN could be an efficient tool and some efforts have been made to the applications in academic study.
It is well-known that grain refinement and grain boundary strengthening have been used to develop the mechanical properties of nickel-based alloy. Temperature, strain rate, and deformation degree play a crucial role in the evolution of microstructures during hot deformation [17]. DRX is an efficient method for refining grain. Deformation conditions directly affect the degree of DRX, and DRX nucleation mechanisms play a crucial role during the hot deformation. Additionally, the DRX is associated with twin boundary in materials with low stacking energy [18]. A.K. et al. [19] pointed out that there is a linear relationship between the area fraction of DRX grains and the fraction of Σ3 boundaries, and the new twin boundaries formed during DRX. In this study, constitutive equation of the nickel-based alloy 825 was developed. The complete hot deformation process was divided into two parts based on dislocation density theory and DRX, respectively. Then the predicted data and experimental data were carried out to assess the predictive ability of the model, it is found that the constitutive equation has a very good predictive ability. The flow behavior and DRX nucleation mechanisms of the alloy were investigated, and twin boundary evolution is discussed in detail.

2. Materials and Methods

The ready-made rod material used in this investigation is a nickel-based alloy 825, the chemical composition (wt.%) is 20.46Cr-39.22Ni-2.84Mo-2.00Cu-0.53Mn-0.13Al-0.97Ti-0.43Si-0.016C-(bal)Fe. Its diameter is 30 mm, and the cylindrical compression specimens were machined to a diameter of 10 mm and a height of 15 mm. The uniaxial thermal compression tests were conducted using a Gleeble-3800 computer-controlled thermomechanical simulator. The hot deformation samples were first heated to 1200 °C at a rate of 5 °C/s and held for 3 min to achieve homogeneous microstructures distribution, then the specimens were cooled at 5 °C/s to the deformation temperature range of 850–1150 °C with an interval of 100 °C and held for 3 min. The specimens were subjected to a 50% reduction in height with deformation rates of 0.14, 0.37, 1, and 2.72 s−1, respectively. The hot deformed specimens were quenched in water after the deformation.
The compression samples were cut in parallel with the compression axis and prepared for microstructure characterization using polished standard procedures. The hot deformed microstructure was studied by using a Zeiss scanning electron microscope (SEM) Sigma-300 equipped with an electron backscattering diffraction (EBSD) unit. The accelerating voltage was 20 kV and a scanning step size of 0.5 mm was used during the EBSD scans. The scanned data were processed and analyzed with channel-5 software package.
The thin foils for transmission electron microscopy (TEM) observation were machined and thinned by twin jet electropolished in an electrolyte of 5% perchloric acid and 95% alcohol at −20 °C with an applied potential of 30 V, and then TEM examined by a field emission gun (FEG) JEM-2100F with the operating voltage of 200 kV.

3. Results

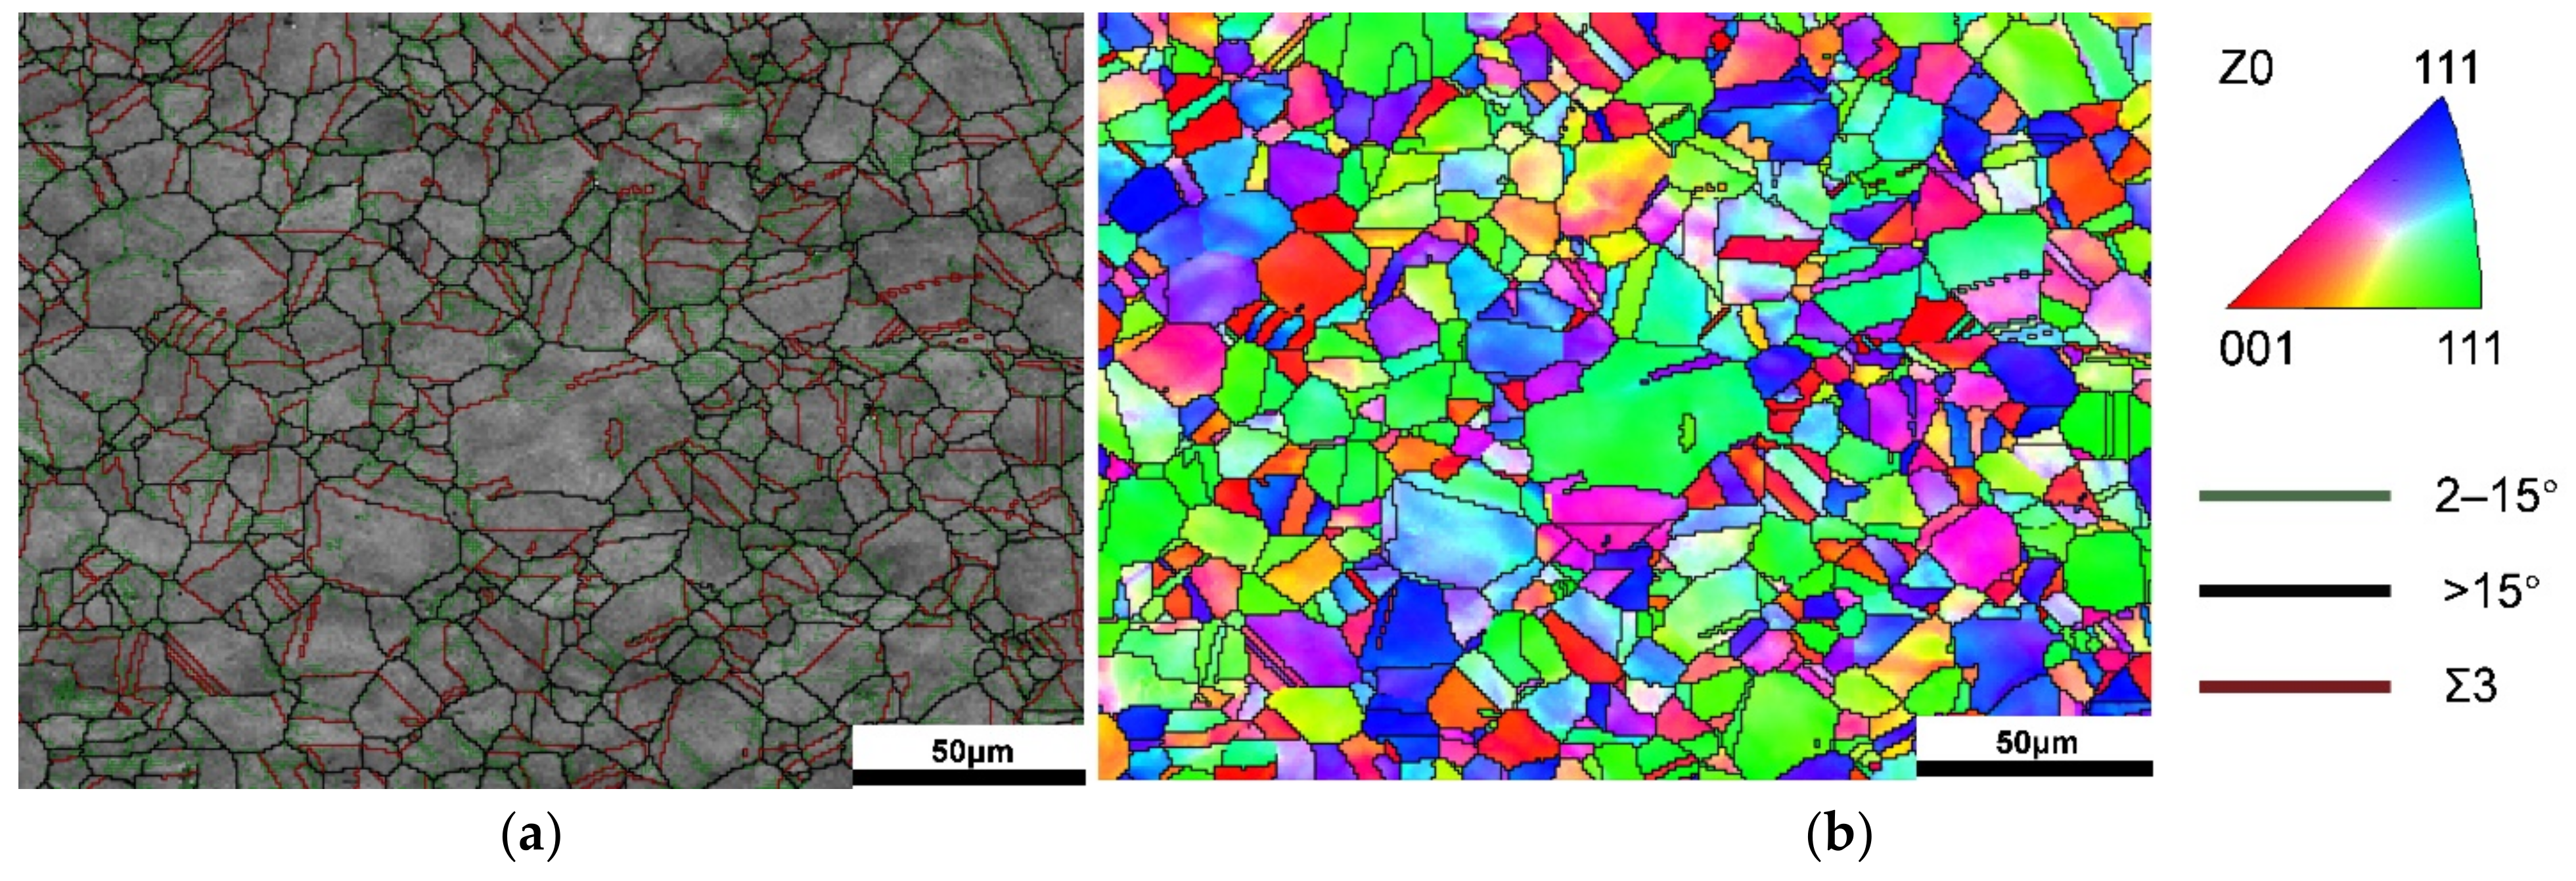
3.1. Initial Microstructures

The EBSD microstructures before hot deformation are shown in Figure 1. Figure 1a depicts that the grains are near-equiaxed with an average grain size of 11 µm. Meanwhile, it could be clearly seen that numerous Σ3 twin boundaries exist in nickel-based alloy 825., and the length fraction of Σ3 twin boundary (TB) is 44.3% based on the total boundary length. Σ3 has a relatively low energy and possesses stable self-property. The strong corrosion resistance of nickel-based alloy 825 depends on the Σ3 twin boundary with less segregation of impurities and much lower mobility property, and nickel-based alloy 825 possesses highly ordered arrangement of the grain boundary atoms, which can also remarkably improve the corrosion resistance.
Furthermore, the initial microstructure exhibits a broad distribution of low angle boundaries (LAB) which exhibit a boundary rotation angle of between 2°and 15°, and high angle boundaries (HAB) exhibiting a boundary rotation angle higher than 15°. Figure 1b shows the initial microstructure that the grain orientations are randomly distributed according to the different color distribution of the grain, which indicates the different crystal orientations [20]. It is represented that there is no obvious crystallographic texture.

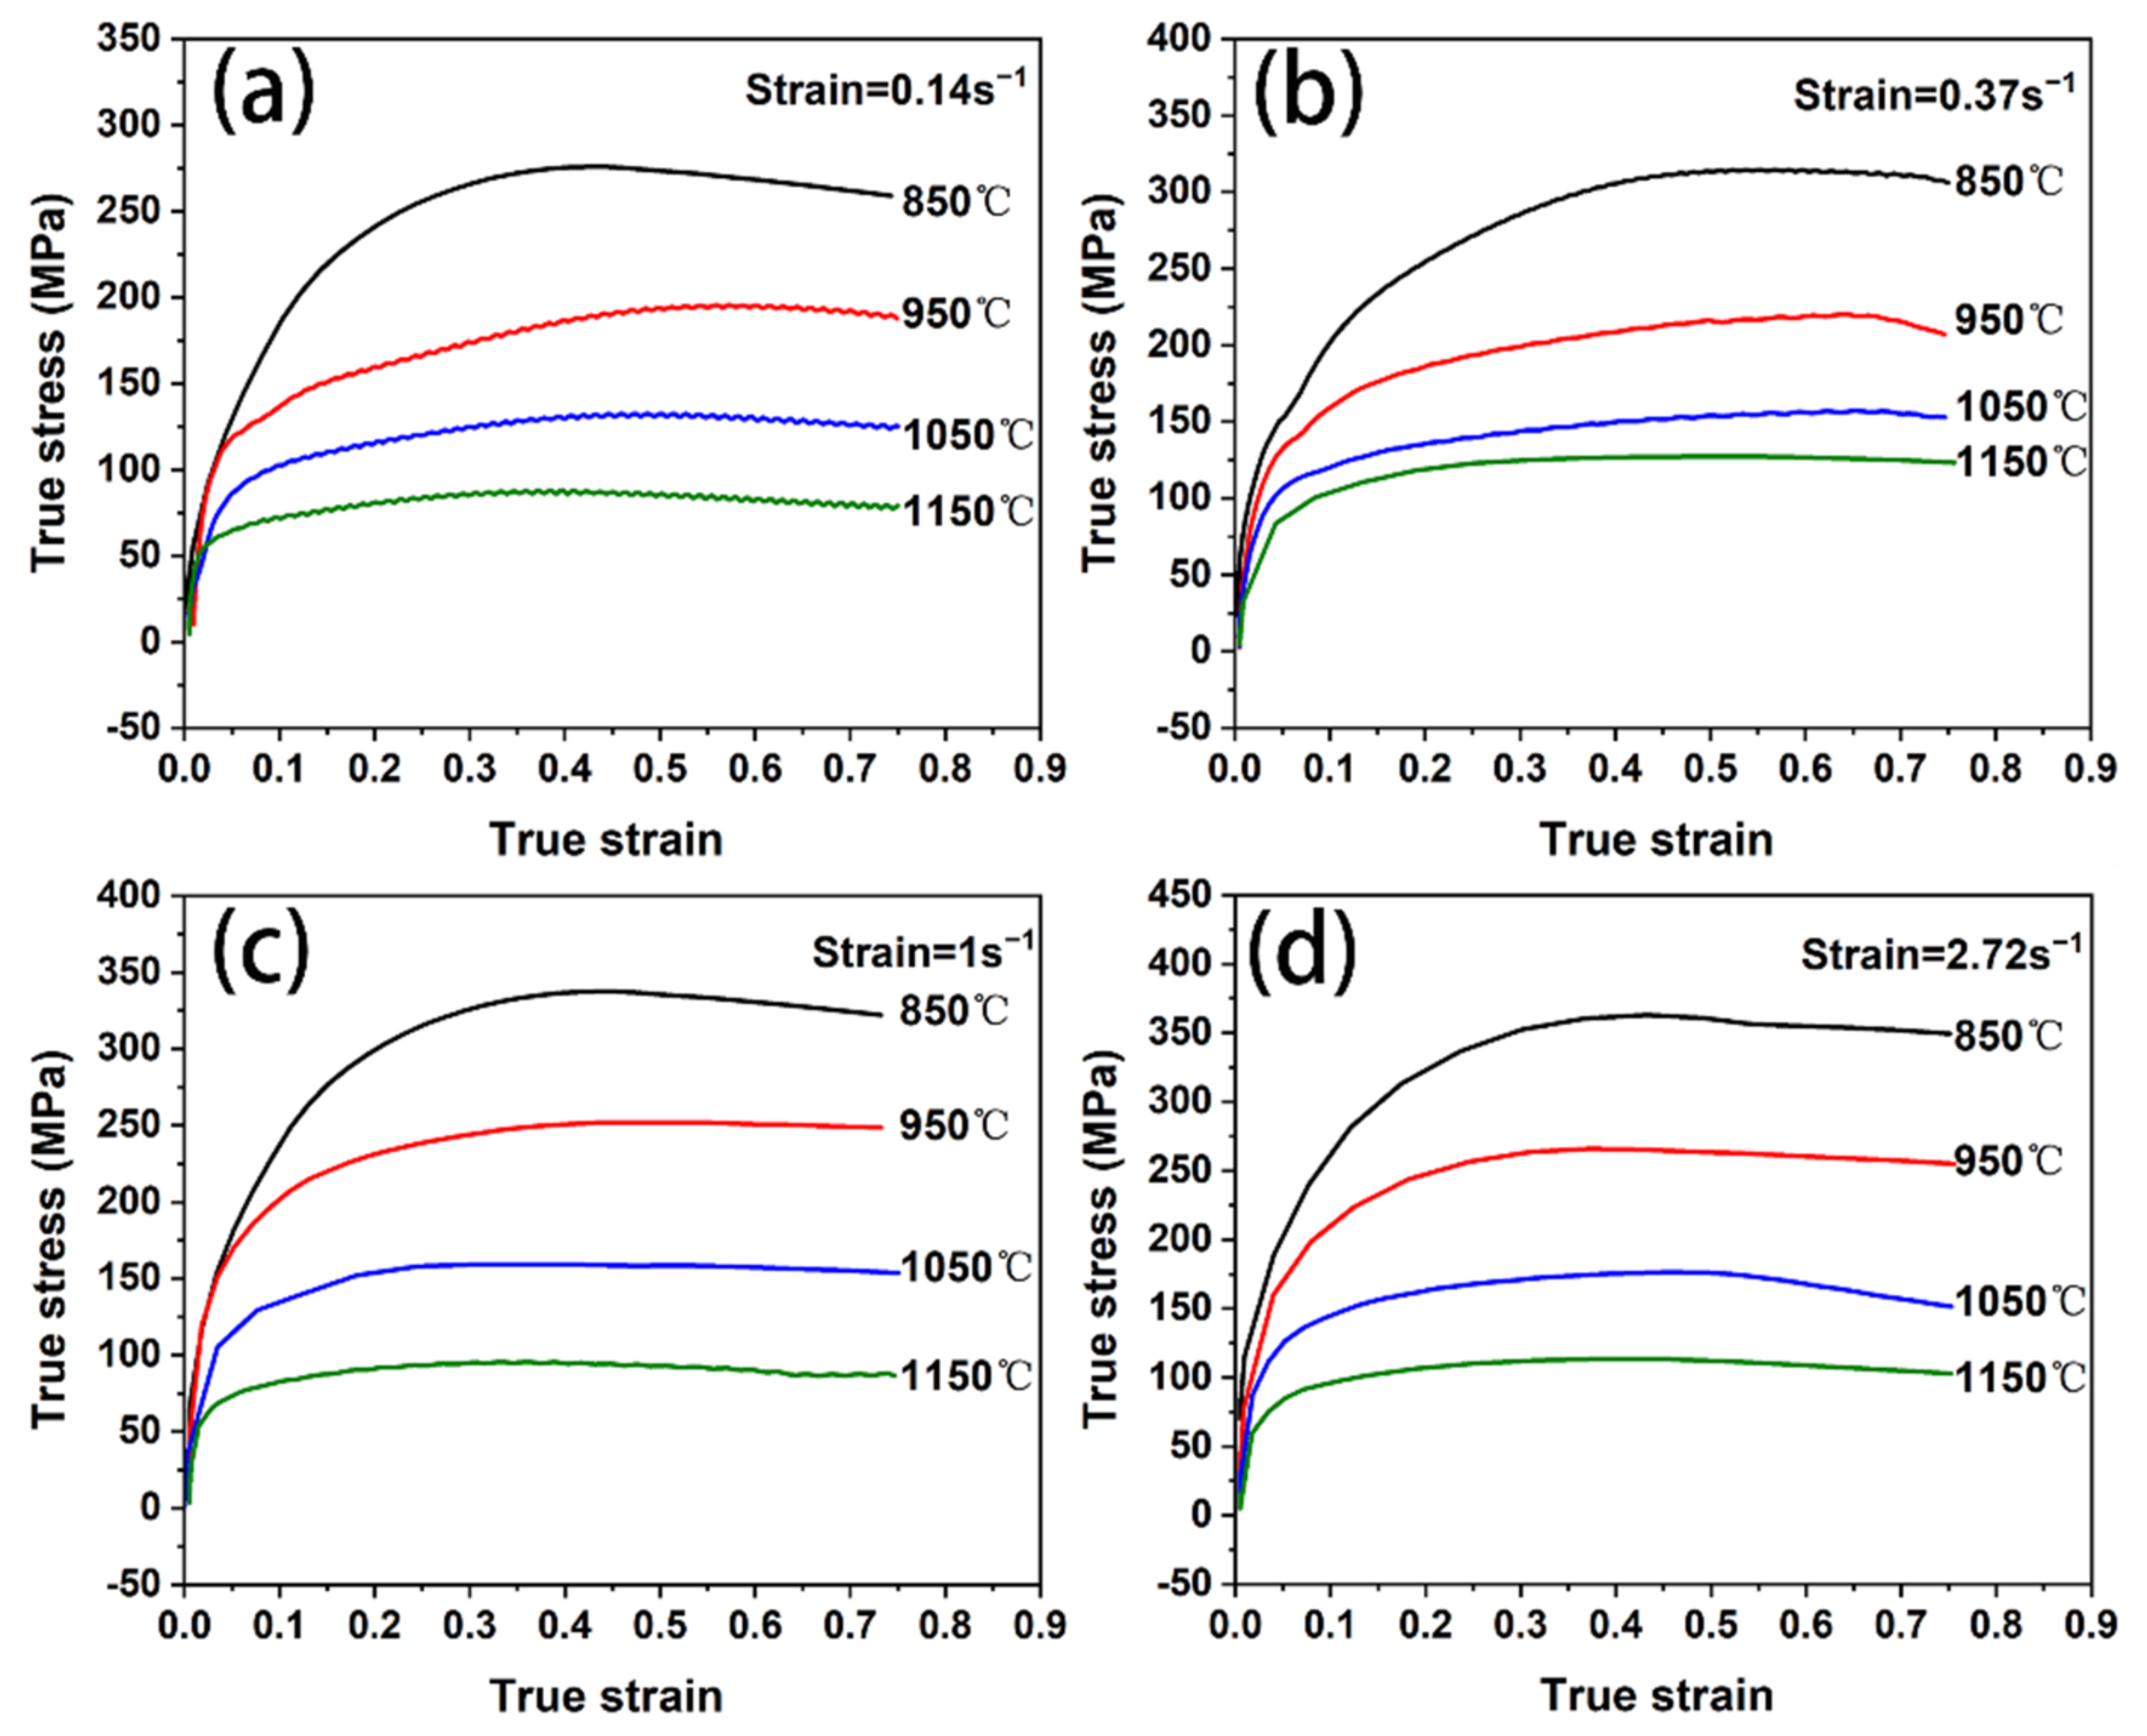
3.2. Thermal Deformation Behavior

The true stress–strain curves were obtained for different combinations of strain rates and temperatures as seen in Figure 2a–d. The flow stress curves study indicated a typical work hardening (WH), dynamic recovery (DRV), and dynamic recrystallization (DRX) behavior occur under different deformation condition of the alloy. It is well-known that DRV and DRX are the dynamic softening mechanisms during the hot deformation, and the flow stress curves display different characteristics due to microstructural evolutions of WH, DRV, and DRX [21]. Clearly, flow stress curves are sensitive to strain temperature and strain rate. As there is an increase in deformation temperature or a decrease in strain rate, the flow stress decreases due to the mobility of grain boundaries and the hot activation of the metal atoms. With the increase in strain temperature, the DRX grains are accelerated and the dislocation movement becomes intense. Meanwhile, slip and climb of dislocation are promoted with an increase in temperature, resulting in a decrease in the flow stress curves. On the other hand, because dislocations accumulate at a rapid stain rate, WH effect is increased. Therefore, at a high stain rate, the flow stress is higher.

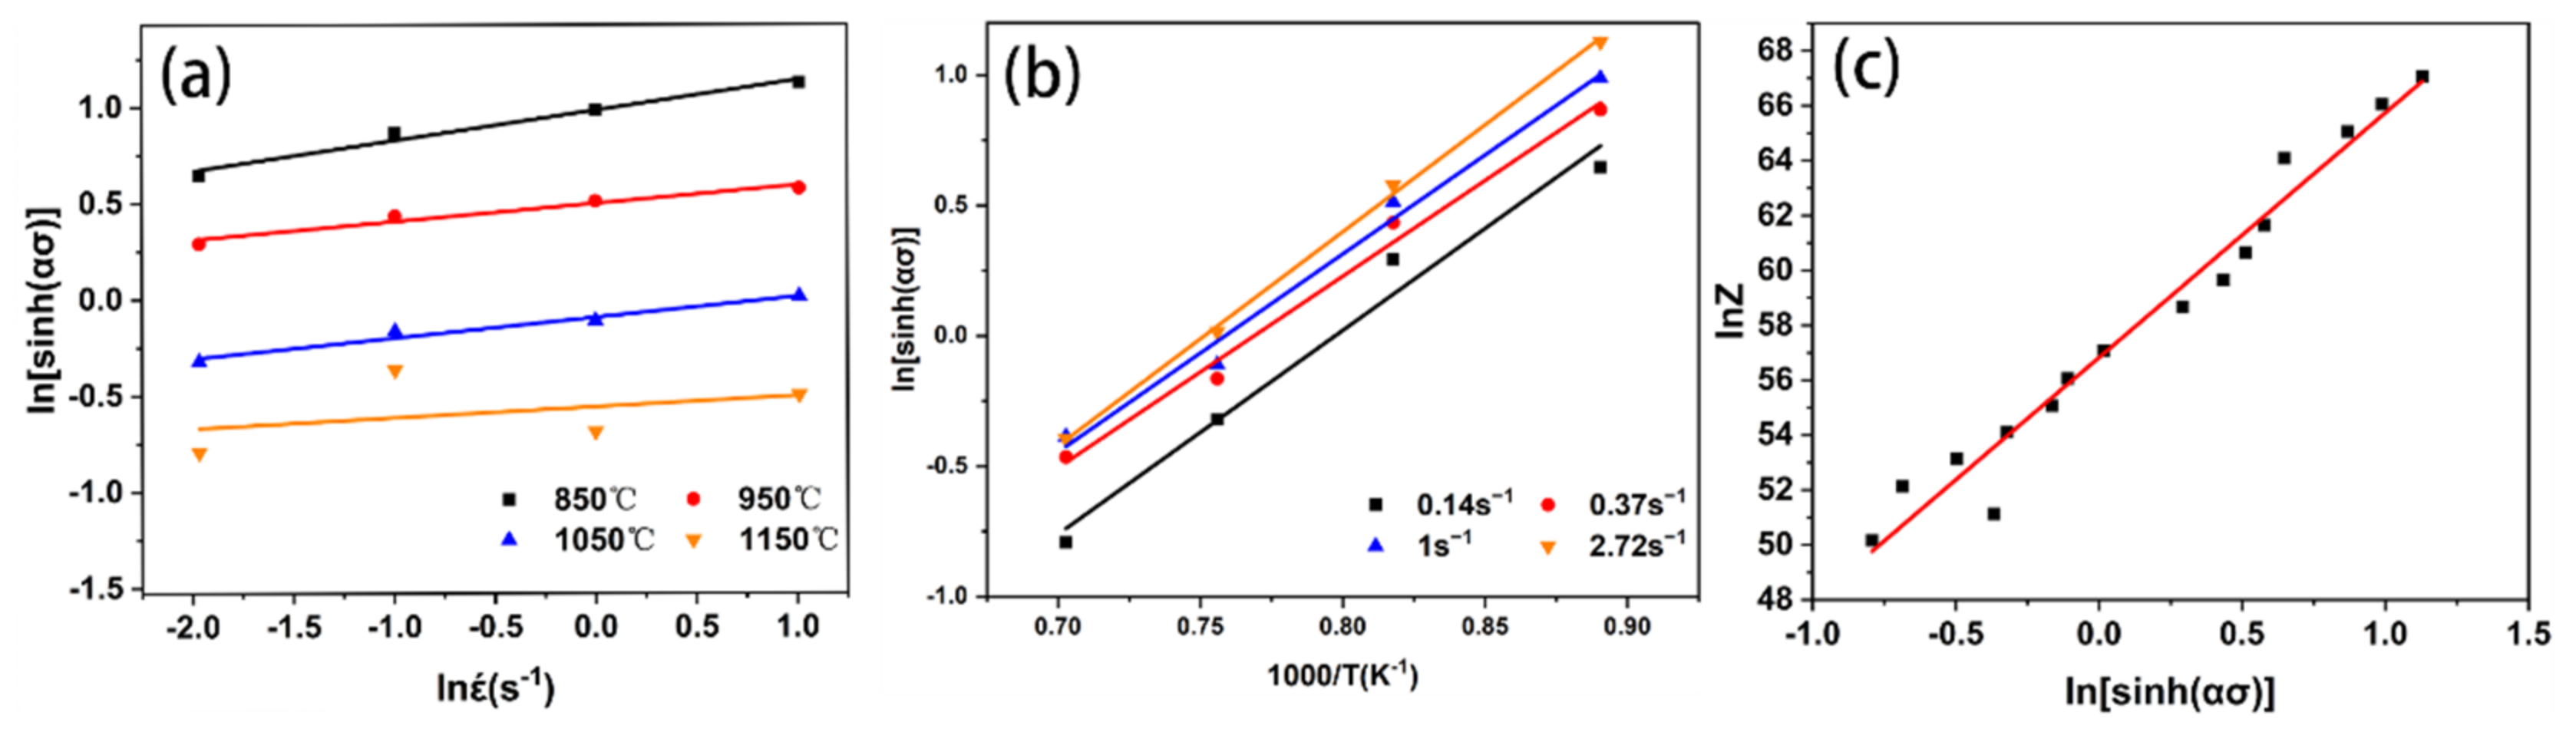
3.3. Kinetic Analysis

In general, the microstructure evolution combined effects of deformation temperature (T), flow stress (σ), and strain rate (έ) can be characterized by Zener–Hollomon parameter, as expressed by Equation (1) [22,23]. Derive the Zener–Hollomon parameter formula, which can be expressed as Equation (2) [24]. The strain rate could be described through the relationship between the flow stress and temperature.
Z = ε ˙ exp ( Q R T ) = A [ sinh ( α σ ) ] n
ε ˙ = A [ sinh ( α σ ) ] n exp Q RT
where R is the gas constant (8.31 J·mol−1·K−1), A, α, and n are the material constants. Q is the activation energy (KJ·mol−1), which represents the minimum energy required for an energy barrier to stimulate dislocation movement by diffusion [25]. Then, the Arrhenius-type constitutive equation is constructed based on the peak flow stress. The values of peak flow stress and deformation parameter are summarized in Table 1.
Taking the natural logarithm on both sides of Equation (3) gives:
ln ε ˙ = ln A + n ln [ sinh ( α σ ) ] Q R T
For different data of strain rate, Q could be calculated by differentiating Equation (3), then we averaged the results.
Q = R ln ε ˙ ln [ sinh ( α σ ) ] T ln [ sinh ( α σ ) ] ( 1 / T ) ε ˙ = R N S
where N is the average slope of the lines in the lnέ−ln[sinh(ασ)] and the linear relation can be obtained in Figure 3a. The parameter S parameter can be obtained from the slopes of the linear fitted plot of Figure 3b. The parameter S can be obtained from the slopes of the fitted line curve of the figure. So, the activation energy of the nickel-based alloy 825 could be calculated from Equation (4) as 616.725 KJ·mol−1, Similarly, the value of A was determined by the plots of lnZ−Ln [sinh (ασ)] as illustrated in Figure 3c and the values of n are equated to N.
As a result, the corresponding model parameters for α, n, A, and Q are listed in Table 2.
Finally, the relationship between Z and hot deformation parameters σ can be expressed as Equation (5).
Z = ε ˙ exp 616000 R T = 2.09 × 10 24 [ sinh ( 0.0051 σ ) ] 9.633

3.4. Kinetic Analysis

In general, the deformation mechanisms of WH and DRV were the main mechanisms at the early stage of strain–stress curves up to the strain value corresponding to the critical strain (εc) of DRX [26], and the stress value is corresponded to the critical stress (σc). For convenience, the early stage of the strain value increased to the critical strain (εc) referred to as “work hardening stage”, and the strain value exceeds the critical strain referred to as “softening stage” Since the change in dislocation density (ρ) is significantly influenced by WH and DRV, the WH and DRV correspond to the storage and annihilation of dislocation, respectively. During the hardening and recovery stage, a competition mechanism exists between the WH and DRV, and this dependence of dislocation density on the WH and DRV can be expressed by physically based models of Bergstrom’s model [27]. With the increase of the strain, once the strain exceeds the critical strain, the process of DRX will take place in the microstructures, DRX and the nucleation and growth of grains become more and more obvious in this stage. To reveal the effects of deformation parameters on the kinetics of DRX during the softening and DRX stage, the Kolmogorov–Johnson–Mehl-Avrami’s (KJMA) model was utilized in this study. In what follows, the flow stress curves will be divided into two parts: Part I (work hardening stage) the constitutive model on hardening and recovery is based on Bergstrom’s model; Part II (softening stage) the constitutive model on softening and DRX is based on KJMA model.

3.4.1. Part I. Constitutive Models Considering Work Hardening-Dynamic Recovery

Based on Bergstrom’s model, the flow stress considering dislocation density, which was expressed as [28]:
σ = σ L F S + M μ b ρ
where σLFS is the lattice friction stress, M is a dislocation strengthening constant, μ is the shear modulus, b is the burgers vector, ρ is the dislocation density, the evolution of the ρ with strain is generally controlled by the competition between the storage and the annihilation of dislocation, which can be expressed by [21,29]:
d ρ d ε = U Ω ρ
where U is a hardening parameter, which represents the immobile dislocation multiplication caused by WH. Ω is a softening parameter, and Ωρ represents the dislocation annihilation and rearrangement related to DRV. Integrating Equation (7) with the initial dislocation density (ρ0) at ε = 0, which can be expressed by [21]:
ρ = ρ 0 exp ( Ω ε ) + U Ω 1 exp ( Ω ε )
Previous research has suggested that the σLFS is negligible at high deformation temperatures. Thus, the applied stress can be represented as [14]:
σ = α μ b ρ
Substituting Equation (9) into Equation (10), the flow stress during WH and DRV period can be expressed as:
σ = σ s a t 2 + σ 0 2 σ s a t 2 exp ( Ω ε ) σ s a t = α μ b ρ 0 σ 0 = α μ b U / Ω
where σ0 and σsat are the yield stress and the saturated stress due to DRV, respectively. If Equation (10) is differentiated with respect to ρ, this can be obtained as:
d σ d ρ = α μ b 2 ρ
Combining Equations (7) and (11), the WH rate can be expressed as:
θ = d σ d ε = d ρ d ε d σ d ρ = α μ b U 2 ρ α μ b Ω ρ 2
Based on Equations (10) and (12), it can be found in that the parameters of σsat can be determined, and it is generally determined by the relationship between the work-hardening rate (θ) and flow stress (σ) [27], as shown in Figure 4.
The θ-σ curve consists of three segments [30,31,32]. The softening mechanism is DRV in segment I, and sub-grains are formed at this stage. As the strain increases, the value of θ would decrease linearly to zero when an equilibrium between the WH and the DRV, meanwhile, the flow stress increases in the saturated stress (σsat). Segment III shows the stage of deformation from the start of the DRX until the end of the deformation. In this segment, the value of θ drops rapidly to zero as the flow stress increases in peak stress (σp) and then decreases to a minimum. With the flow stress increases in the steady stress (σss), the value of θ will increase to zero. In the meantime, a new equilibrium between the WH and the softening induced by the DRV and DRX is obtained. Consequently, from the curves of θ-σ, the parameters of σc, σsat, σp, and σss under different constraints can be determined, respectively. Zener–Hollomon parameter (Z) and the parameters of σc, σsat, σp and σss are combined as shown in Figure 5.
For the investigated nickel-based alloy 825, there is a good linear relationship between the LnZ and σc parameters, σsat, σp and σss, and the relationship can be expressed as follows:
σ c = 15.43 L nZ 701.45 σ P = 0.0194 L nZ + 0.4745 σ s at = 1.059 σ p + 8.448 σ s s = 0.948 σ p + 2.083
According to Equation (10), the softening parameter (Ω) can be calculated by [27],
Ω ε = ln σ sat 2 σ 0 2 σ sat 2 σ 2
The relation between the strain (ε) and ln[(σ2satσ20)/(σ2satσ2)] is shown in Figure 6a, and there is a good linear relationship between the parameters of LnZ and σ0 as shown in Figure 6b.
Summarizing, the constitutive equation based on Bergstrom’s model can be represented as:
σ = σ sat 2 + σ 0 2 σ sat 2 exp Ω ε 0.5 σ sat = 11.30 + 1.07 σ p σ 0 = 5.16 ln Z 205.396 Ω = 3.576 ln Z + 37.9 Z = ε ˙ exp 6.16 × 10 5 / R T = 2.09 × 10 24 [ sinh ( 0.0051 σ ) ] 9.633

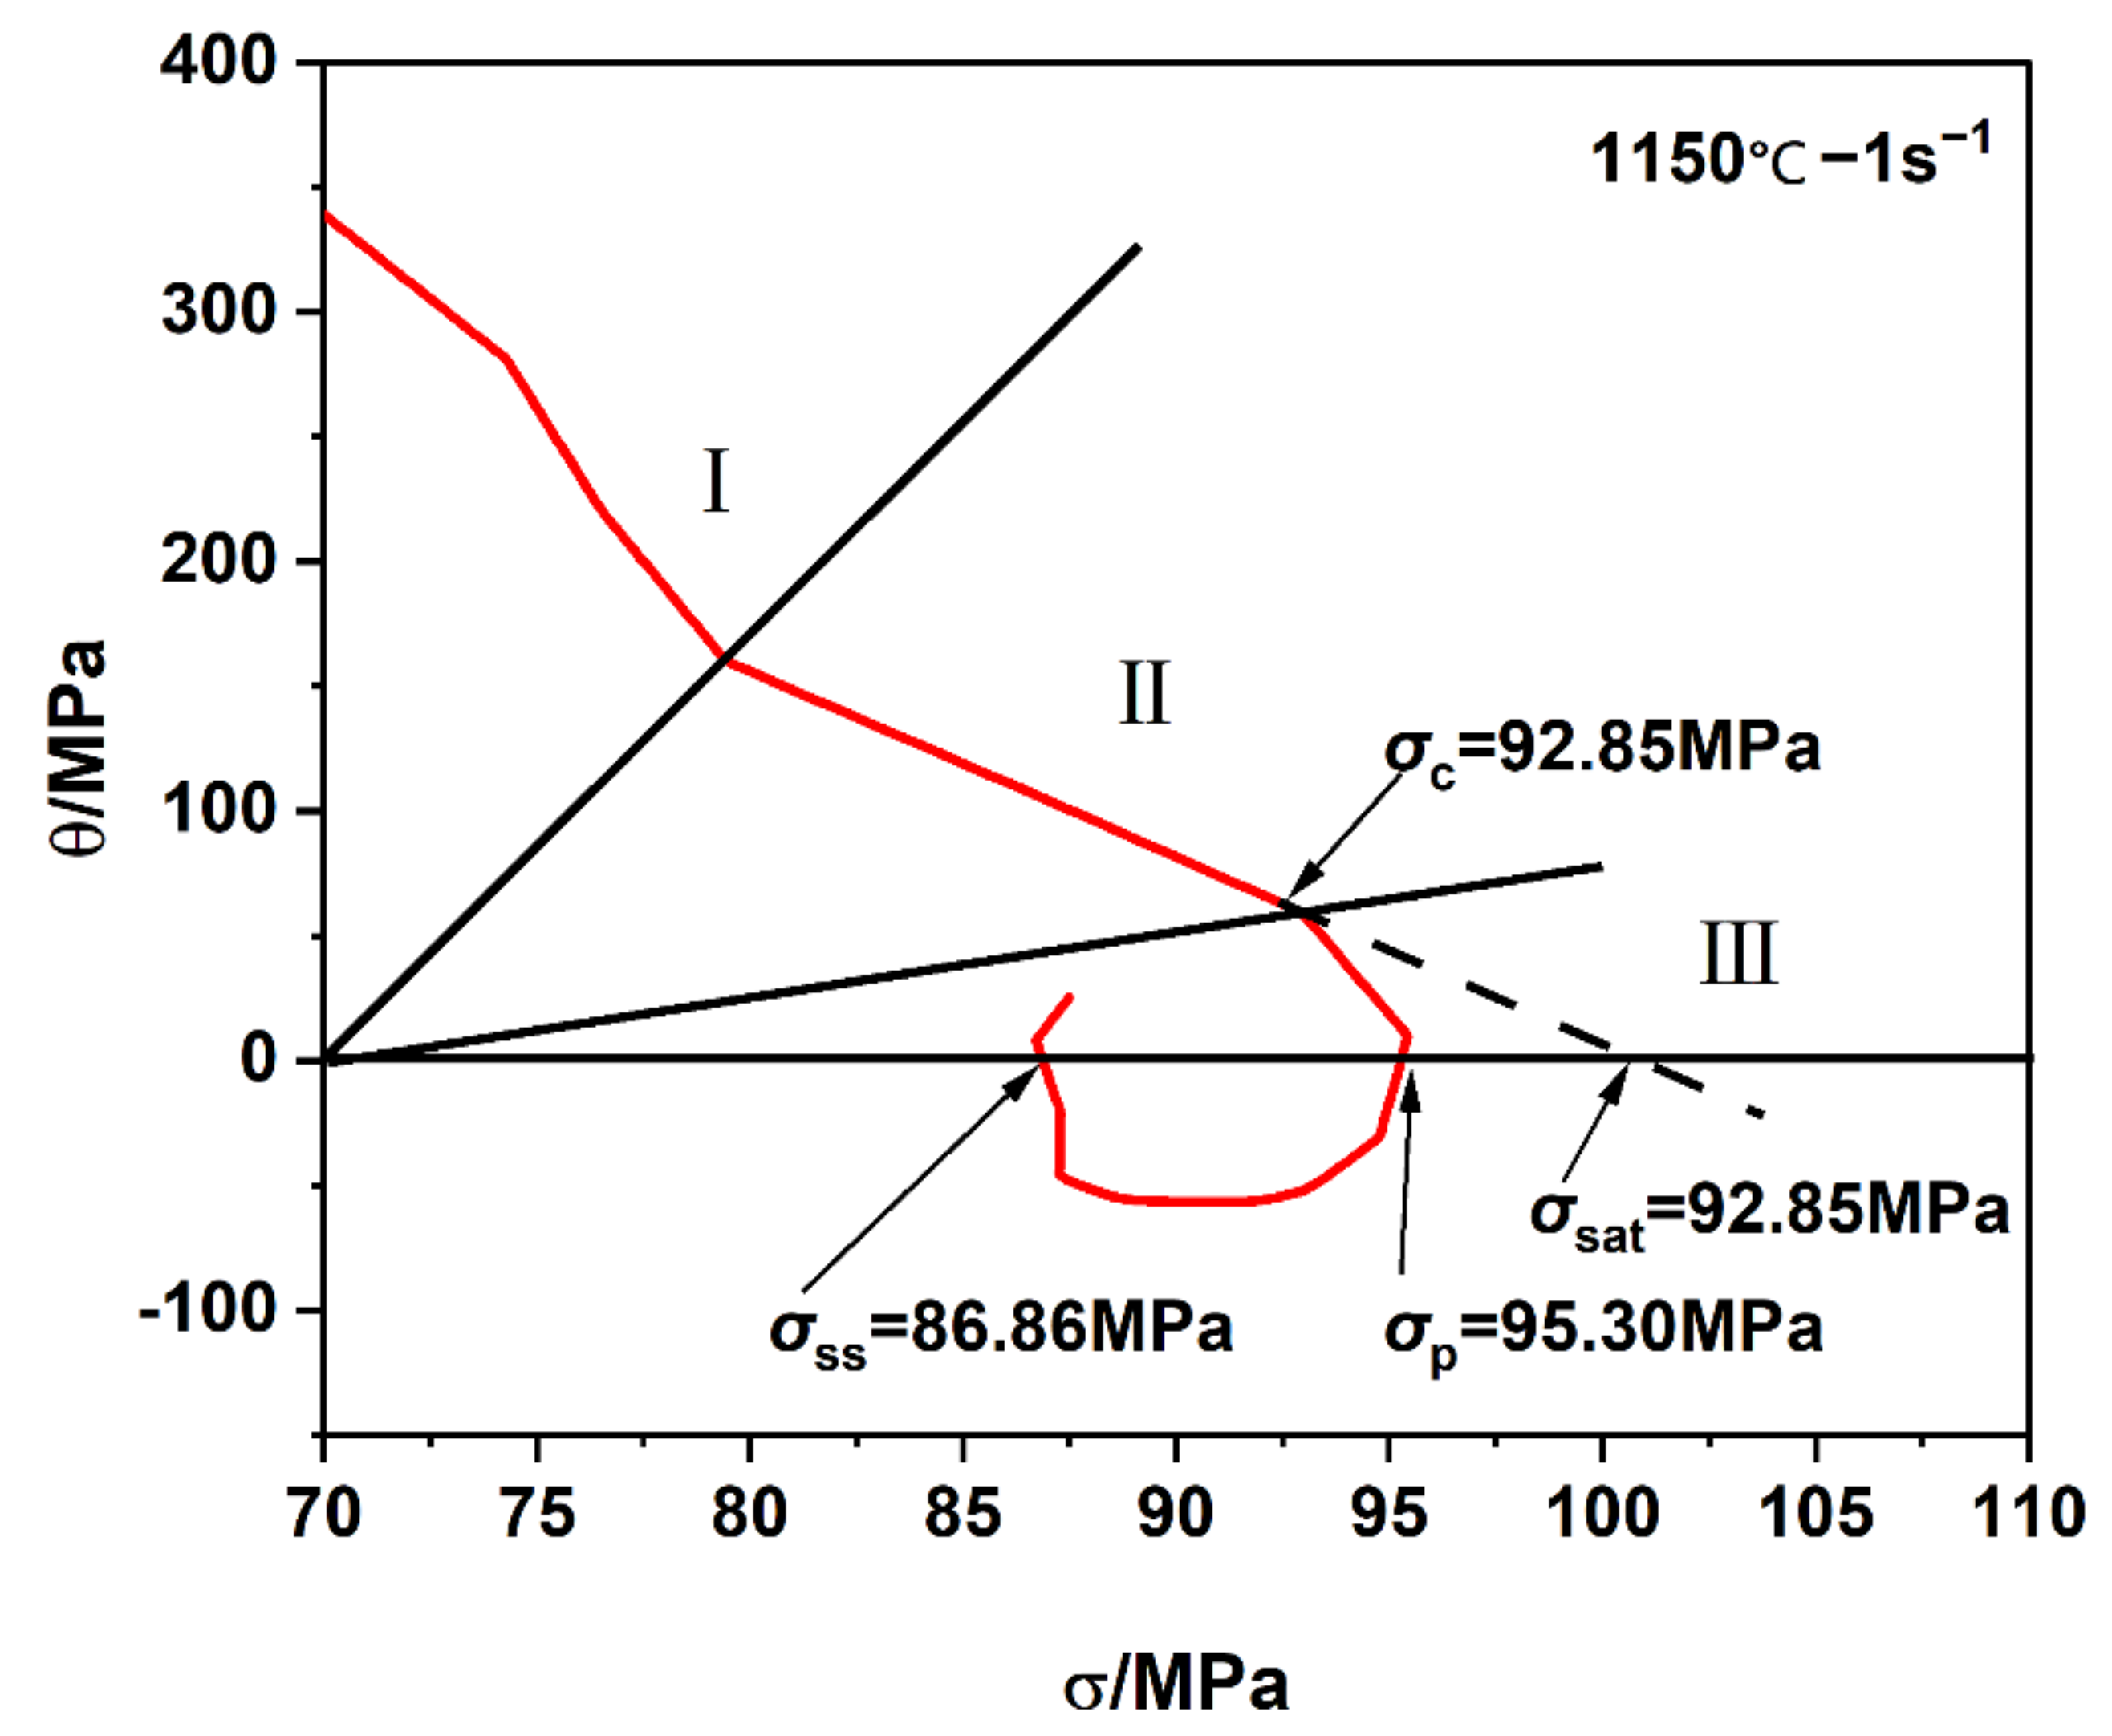
3.4.2. Part II. Constitutive Model Based on Dynamic Recrystallization

Based on the KJMA model, flow stress accounting for dynamic recrystallisation was expressed as [33]:
σ = σ s σ s σ ss 1 exp k 1 × ε ε c ε p k 2 ε ε c
where k1 and k2 are the material constants. Generally, the volume fraction of DRX (Xd) can be expressed as:
X d = 1 exp k 1 × ε ε c ε p k 2 ε ε c
Equation (18) can be deduced by:
ln ln 1 X d = ln k 1 + k 2 ln ε ε c ε p ε ε c
According to Equation (18), the parameters k1 and k2 can be calculated through linear analysis as shown in Figure 7a, and there is a good linear relationship between the parameters of εc and εp as shown in Figure 7b.
Meanwhile, the progress of the DRX, XD, can also be written as [14]:
X d = σ s σ σ s σ ss ε ε c
Consequently, the constituent equations during DRX can be derived by the following equations:
σ = σ s σ s σ ss 1 exp 1.6487 × ε ε c ε p 2.07767 σ s = 1.059 σ P + 8.448 σ s s = 0.948 σ p + 2.083 ε P = 1.42 ε c + 0.003

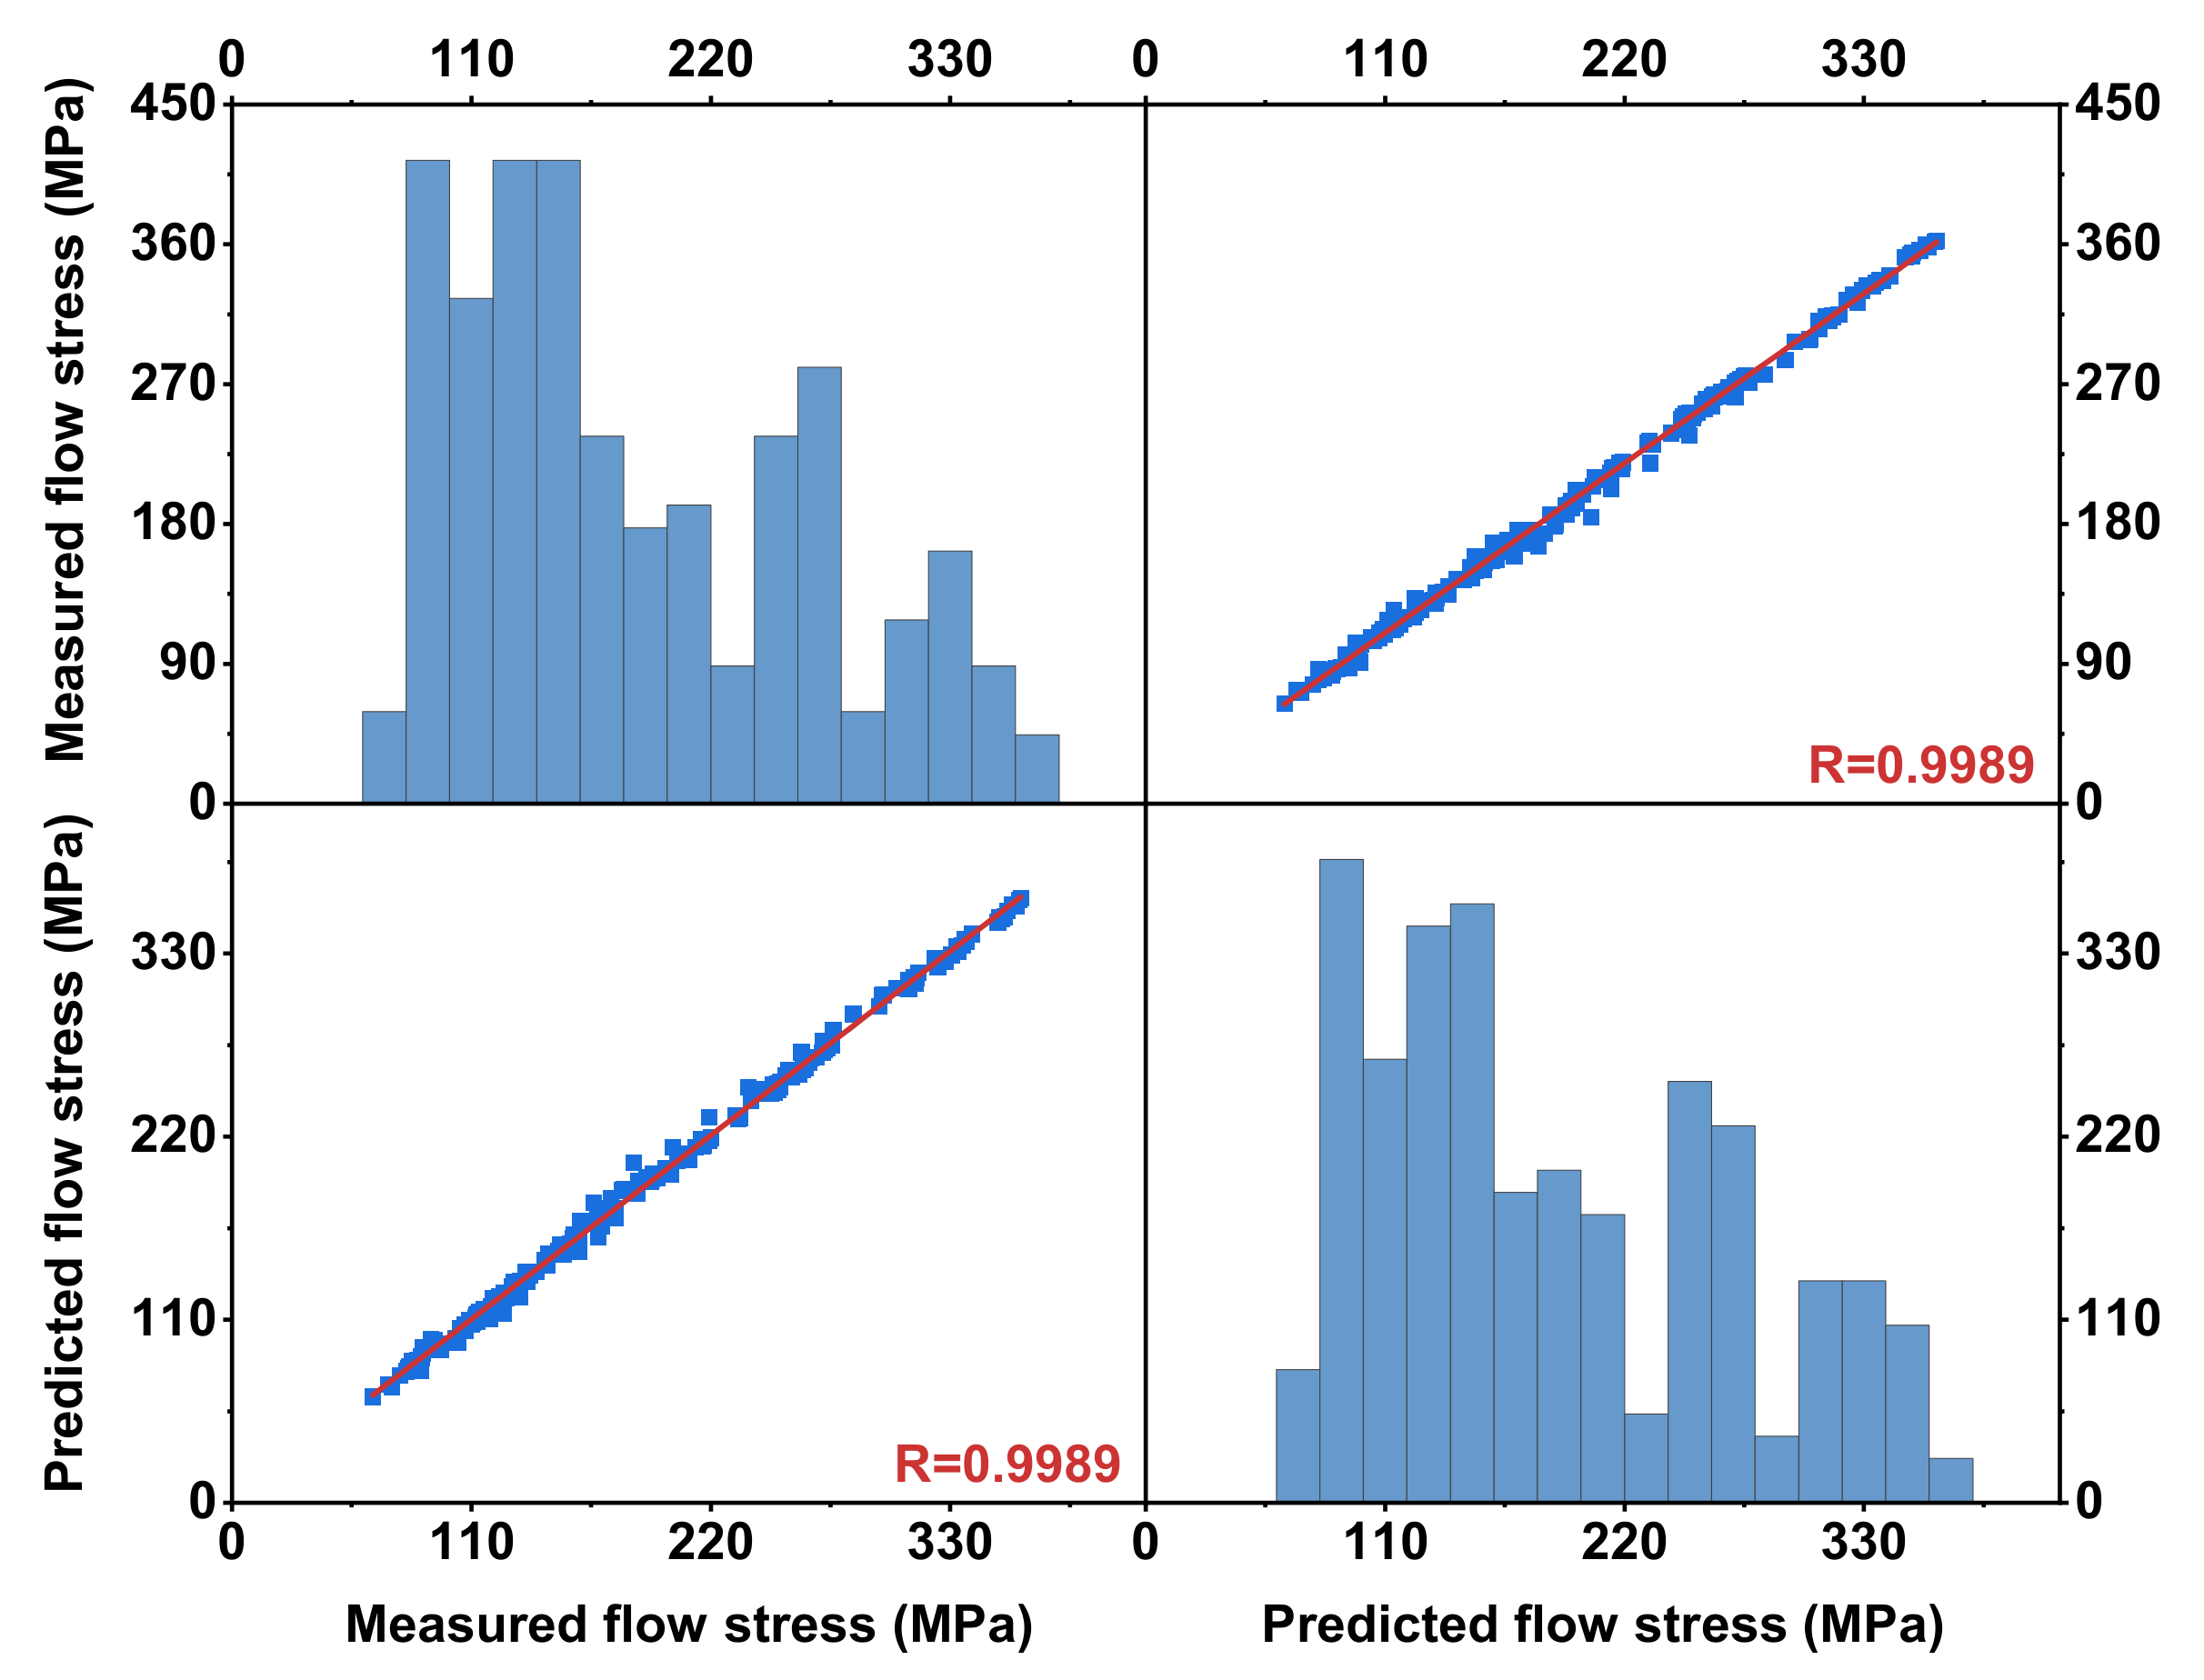
3.4.3. Verification of the Developed Constitutive Model

In order to verify the accuracy of constitutive model developed for the nickel-based alloy 825, the predicted and experimental flow stresses under different deformation conditions are shown in Figure 8. It was found that the predicted data agree well with the measured data, Bergstrom’s model and Kolmogorov–Johnson–Mehl–Avrami’s model fit well to the experimental data in this study.
Furthermore, for a more direct comparison of the results obtained by the constitutive model with the experimental data, the scatter map of the predicted and measured data under different deformation conditions is shown in Figure 9. It was found that most data points lie quite close to the optimal fitting curve (y = x).
The predicted accuracies of the constitutive model can be evaluated by the correlation parameters (R) and the average absolute relative error (AARE) [24]:
A A R E ( % ) = 1 N i = 1 N E i P i E i × 100 %
R = i = 1 N E i E ¯ P i P ¯ i = 1 N E i E ¯ 2 i = 1 N P i P ¯ 2
where Ei and Pi are the experimental data and predicted data, respectively. N is total number of data used. The values of AARE and R were 0.997 and 3.53%, respectively. As a result, it indicates that the developed constitutive model has a very good predictive ability.

4. Discussion

4.1. Applicability and Physical Meanings of Developed Constitutive Models

This work demonstrates the applicability of the physical-based constitutive model in the prediction of the hot deformation behavior of the nickel-based alloy 825. The piecewise constitutive model is capable of predicting the full process of hot deformation with a high degree of accuracy. However, most of the literature has concentrated on the hyperbolic sine law, and a few works are based on the piecewise constitutive model. In the literature of X.-GrantChen et al. [34], the hot deformation behavior is widely described by the Arrhenius-type equation. The parameter for the constitutive models derives from the peak stress. However, for some complex hot deformation processes in multiphase microstructure evolution, the model cannot reflect the effect of strain rate and temperature with high predictive accuracy. Song et al. [35] gave one form of strain compensation for the Arrhenius-type equation, the model calculates the parameters based on the different strain. The result indicates that the effects of the strain on the flow stress are significant. However, the microstructure evolution of dislocation density, DRV and DRX, is more significant, as a result, it is extremely difficult to describe all these phenomena within a single constitutive model. In comparison, the piecewise functions used in this study provide a good level of accuracy in complete hot deformation process.
It is worthwhile to discuss the relationship between the developed models and microstructure evolution under hot deformation conditions. As is known, the WH and DRV are exist throughout the deformation process, while the WH rate is reduced due to the existence of DRV during the hot deformation. With the increase in the strain, once the strain exceeds the critical strain, DRX starts and dominates the material behavior. In a study by the Zhu et al. [11], a new physical piecewise constitutive model was developed, making it possible to predict the occurrence and completion of DRX. Moreover, the change of DRX completion strain at different strain rates and temperatures can be reflected by the transition functions. The success in predicting shows that the developed constitutive models can be used as a useful tool to study the DRX process and microstructural evolution in the hot deformation of metallic materials. Consequently, the investigation of DRX occurrence and completion point will be an important part of future multiphase material. Meanwhile, more precise microstructure evolution parameter will be obtained by means of piecewise constitutive models.

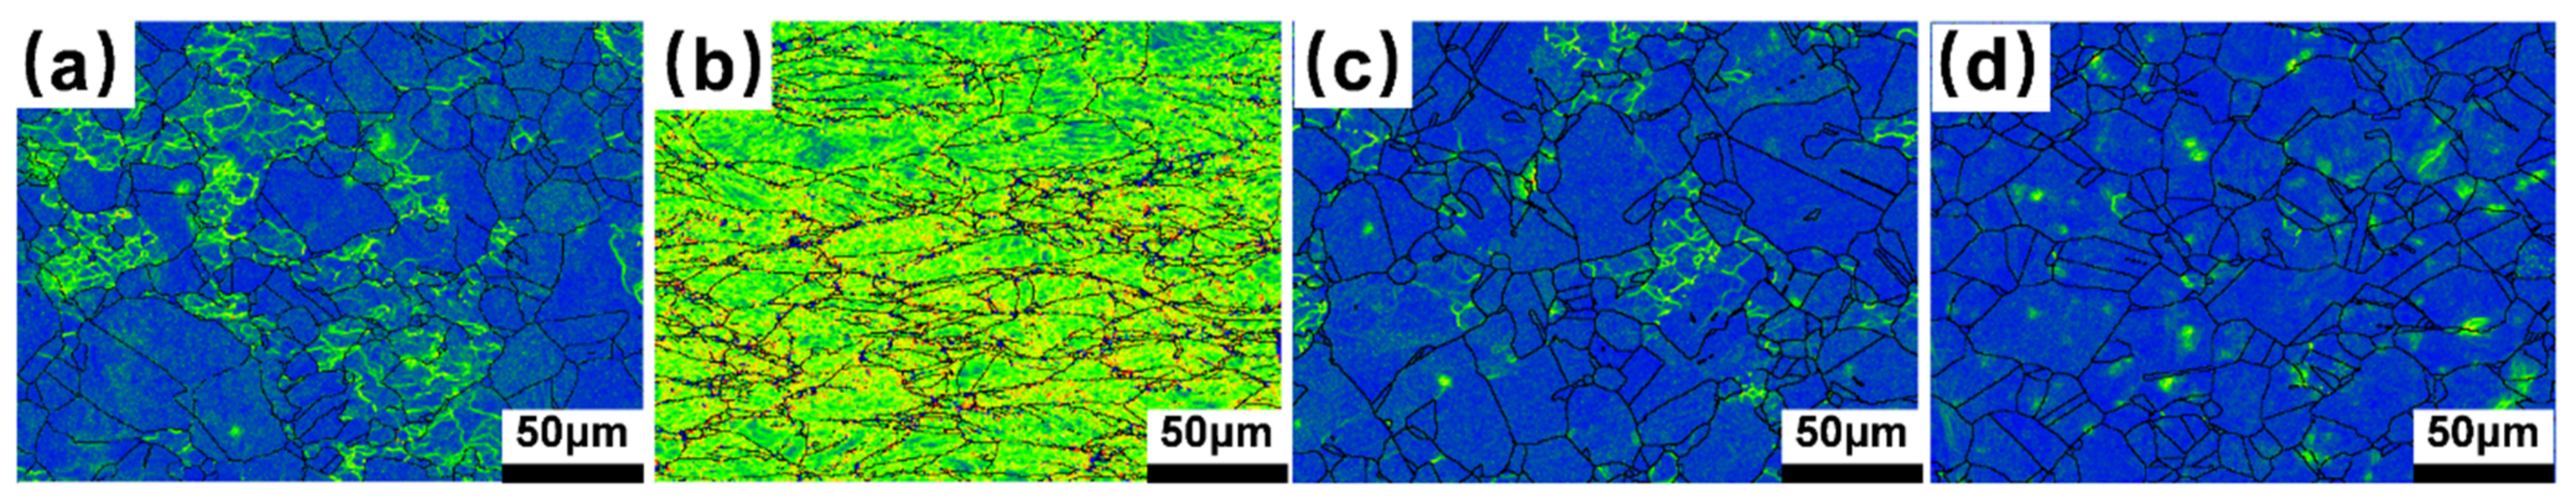
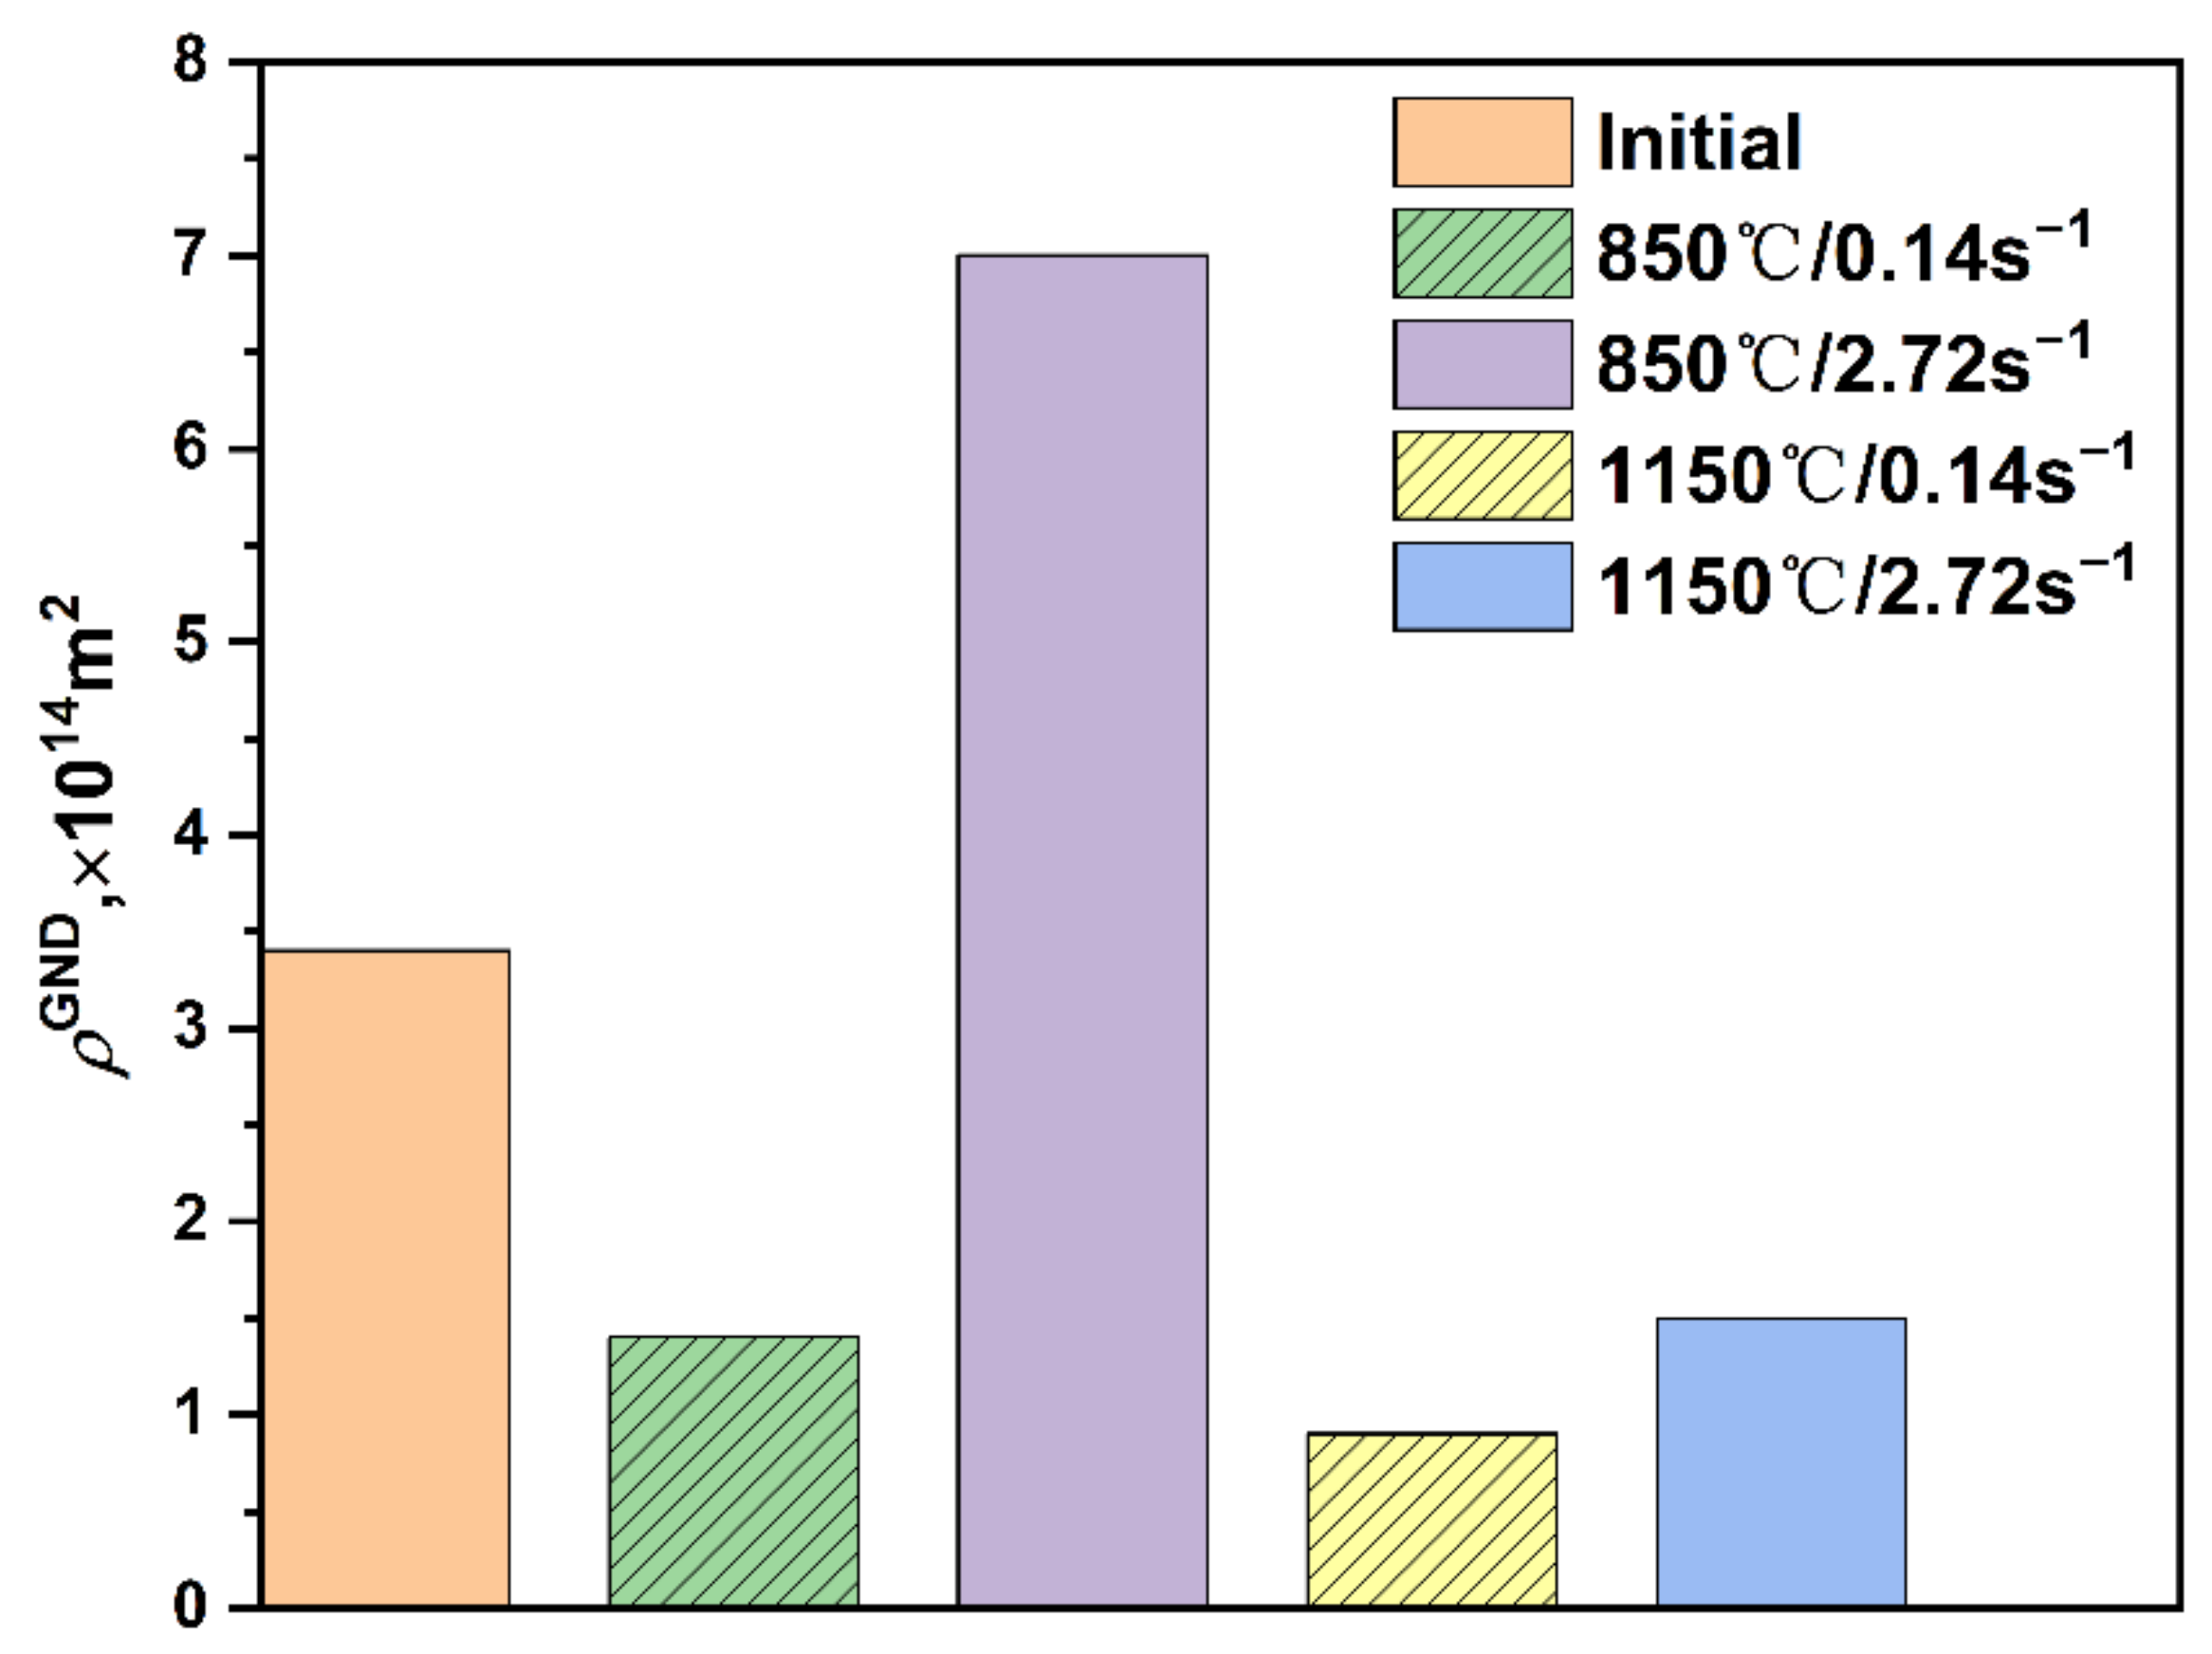
4.2. Microstructure Evolution

To further investigate the evolution of the microstructure under different deformation conditions, the EBSD maps of IPF, HAB, and LAB, and twin boundary were performed, as displayed in Figure 10. It can be found that the change of microstructural is sensitive to strain rate and temperature. With the strain rate increased to 2.72 s−1, the original equiaxed grains elongated and the deformed grains surrounded by relatively smaller grains formed a “necklace type” of structure under the deformation temperature of 850 °C. As DRX is a thermal activation process, there is enough drive force for the DRX nucleation under high strain rate during the hot deformation. According to the HAB and LAB map, with the increase in strain rate, more dislocations were generated under the deformation temperature of 850 °C, LAB occupies a dominant fraction when deformed at 850 °C and 2.72 s−1, indicating there were more substructure inside the grains. When the temperature increased to 1150 °C, DRX nucleation and growth were promoted, and the grain size begins to coarsen. Previous studies suggest that twin plays an important role in the nucleation and subsequent growth of the DRX process, and there was a linear relationship between the area fraction of DRX grains and the fraction of primary twins (Σ3) or higher-order twins (Σ9, Σ27) [18]. Twins can accelerate the DRX process of materials with low stacking fault energy. It can be observed that the twins are found within the DRX as shown in Figure 9; the evolution of twin boundary considers the strain rate and the temperature will be studied in the following discussion.

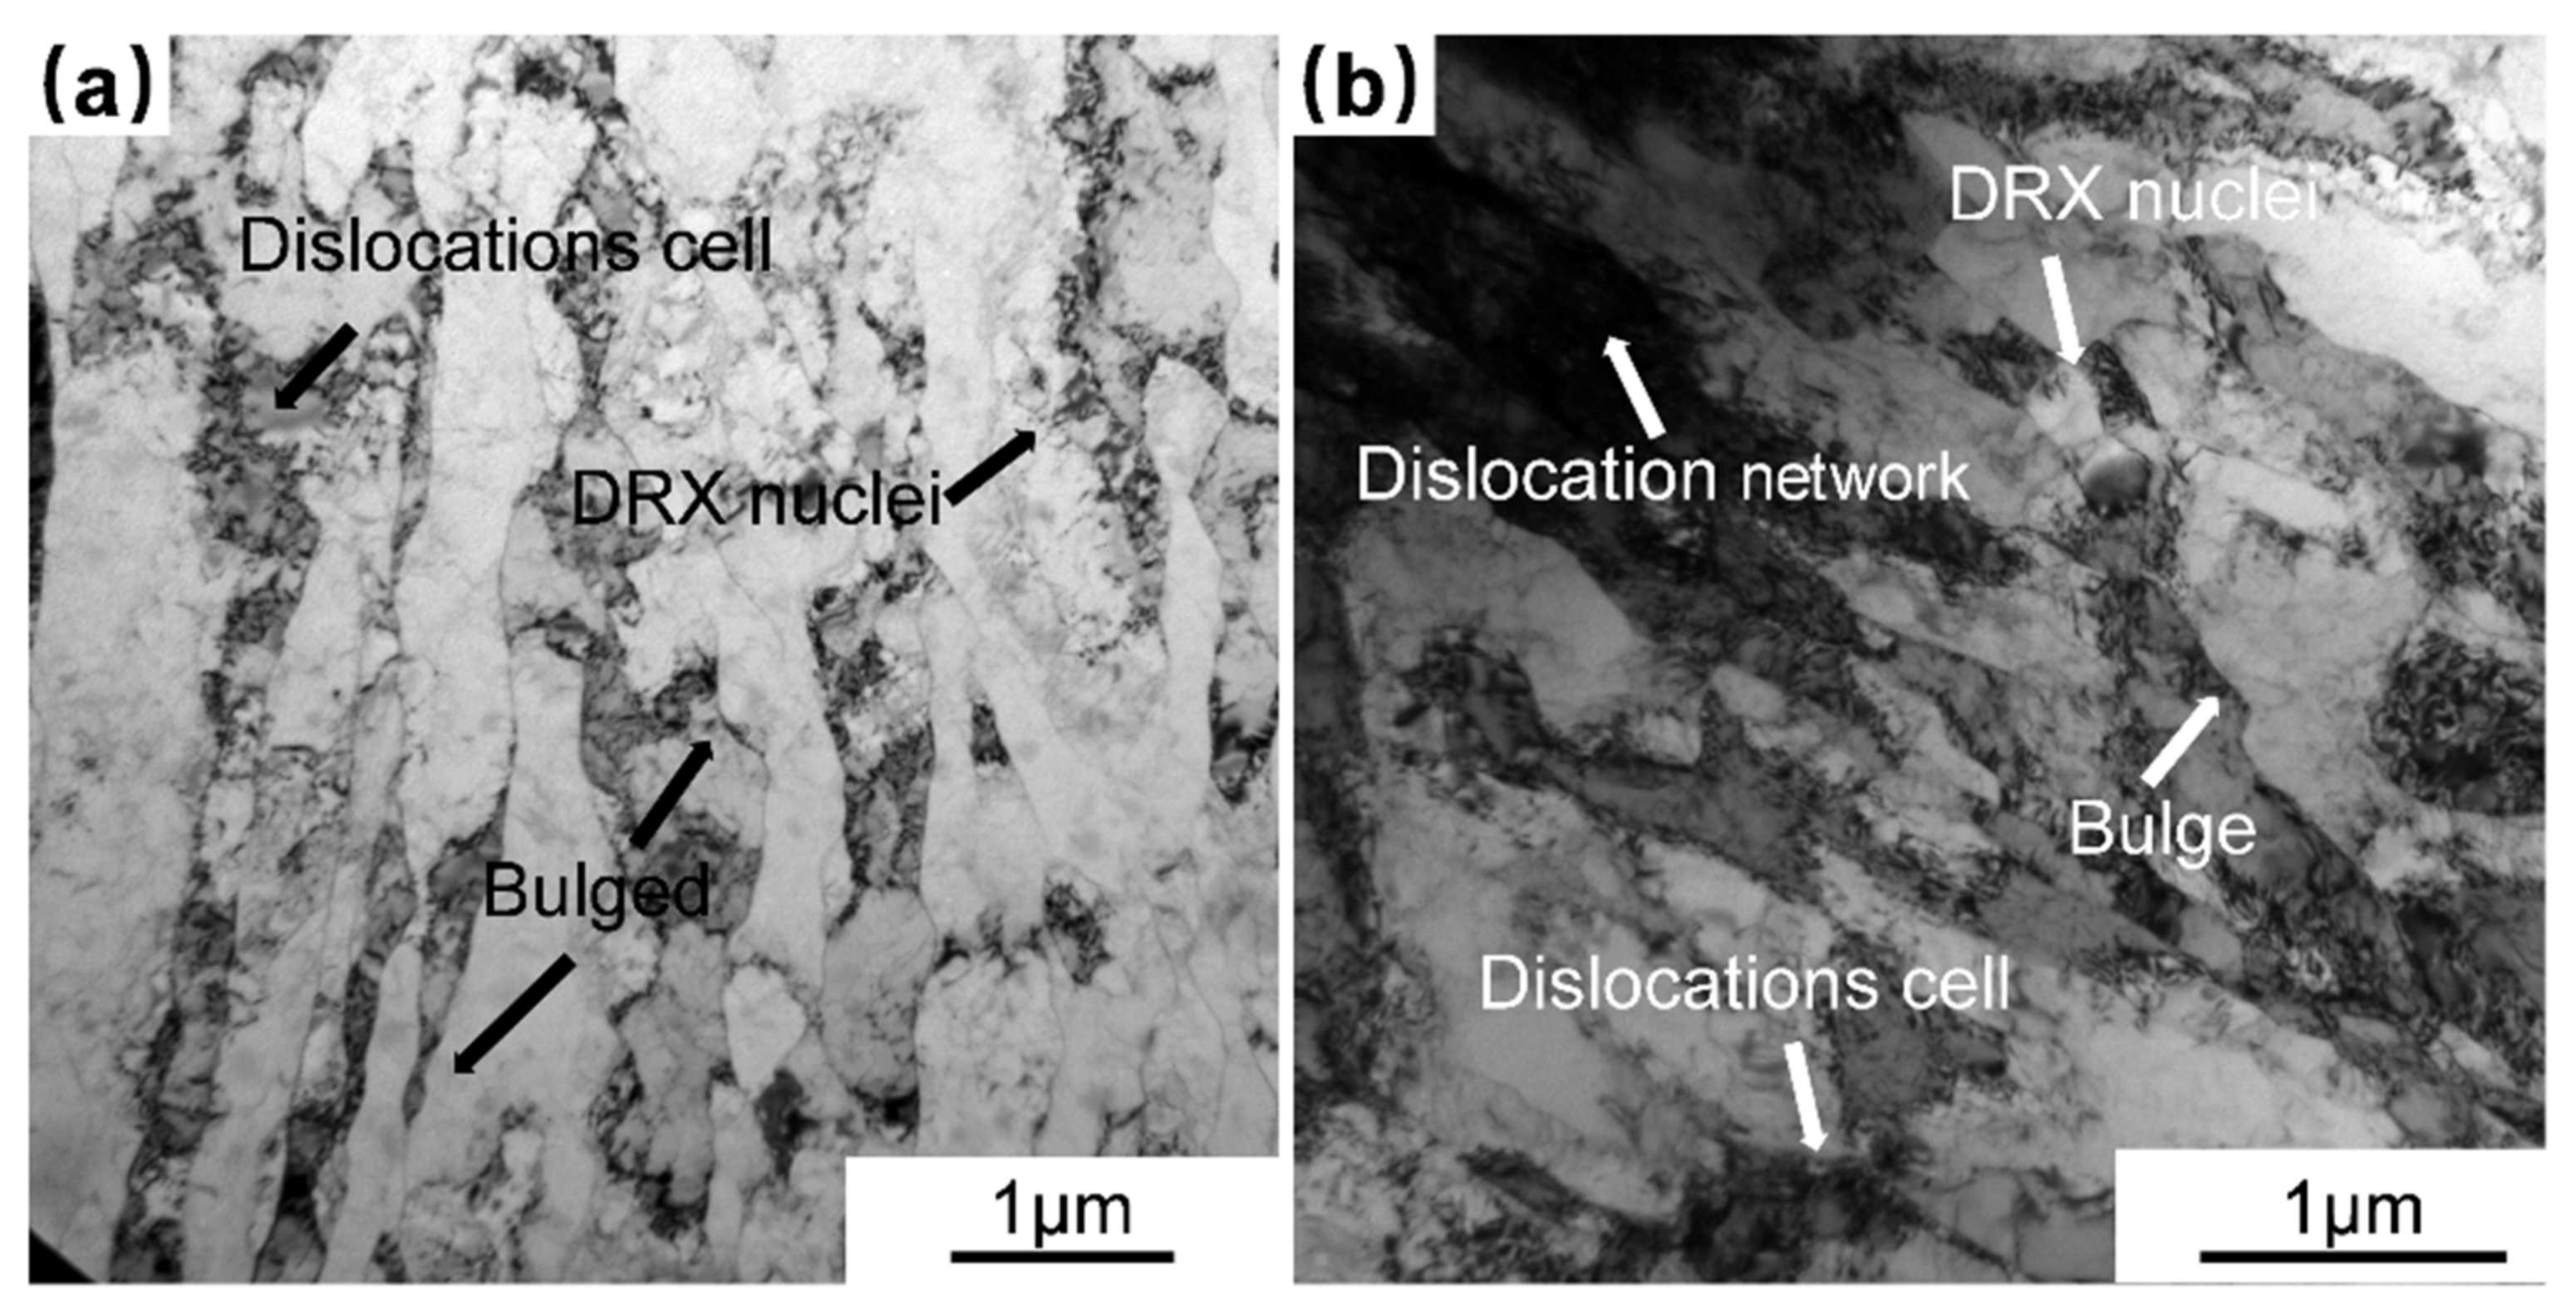
4.3. Mechanisms of Dynamic Recrystallization

The kernel average misorientation image (KAM) evolution laws of the average misorientation between a kernel point and its neighboring points under different deformation condition are illustrated in Figure 11 KAM maps.
The KAM value was related to geometrically necessary dislocation density (ρGND) caused by the dislocation density. The high plastic deformation induced a high ρGND value corresponding to the high dislocation density and the deformation of the stored energy [7]. The ρGND has the relationship with the KAM obtained from EBSD as shown in Equation (23):
ρ G N D = 2 θ / μ b
Here, θ is the mean misorientation value on the EBSD map, μ represents the step size of the scan in μm, and b is Burger’s vector of 0.255 nm in this research [36]. In this paper, KAM critical angle is defined as 3°, and misorientation angles larger than 3° are excluded from the calculation as they are caused by a grain boundary. Figure 12 shows the GND densities map of the studied nickel-based alloy 825. The dislocation densities of the nickel-based alloy 825 at the deformation of 850 °C and 2.72 s−1 are higher than the other deformation; higher dislocation density can result in higher GND densities and heavier working hardening.
As displayed in Figure 13, the TEM investigation confirmed that when the deformation rate increased to 2.72 s−1, high density of dislocation and massive dislocation substructure is observed in the grains. A mass of dislocations annihilates and recombine to form dislocation network after deformation, which leads to an increase in the stored energy of the grain and facilitate DRX nucleation. Figure 13b reveals that the high-density dislocation network was regrouped into dislocation cells, and the multilateralization of dislocation cells promotes the formation of DRX sub-grain boundaries. DRX process was fully developed with sub-grain rotation, and DRX grain transformed from sub-grain, indicating that DRX nucleation take place. It is believed that this nucleation mechanism is continuous dynamic recrystallisation (CDRX) [37]. Moreover, a high density of dislocations generated and accumulated can be observed along the initial HAGBs. Obvious jagged and bulging grain boundaries can be observed, meaning that the DRX nucleation will take place along the local bulged grain boundaries, and obvious DRX nucleation is also found in the HAGBs. This is considered to be discontinuous dynamic recrystallisation DDRX nucleation mechanism [38,39]. It is worth noting that CDRX and DDRX also existed at a lower deformation rate (0.14 s−1). The lower KAM and GND densities mean that there is enough time for nucleation and growth process at the lowest deformation rate (0.14 s−1).

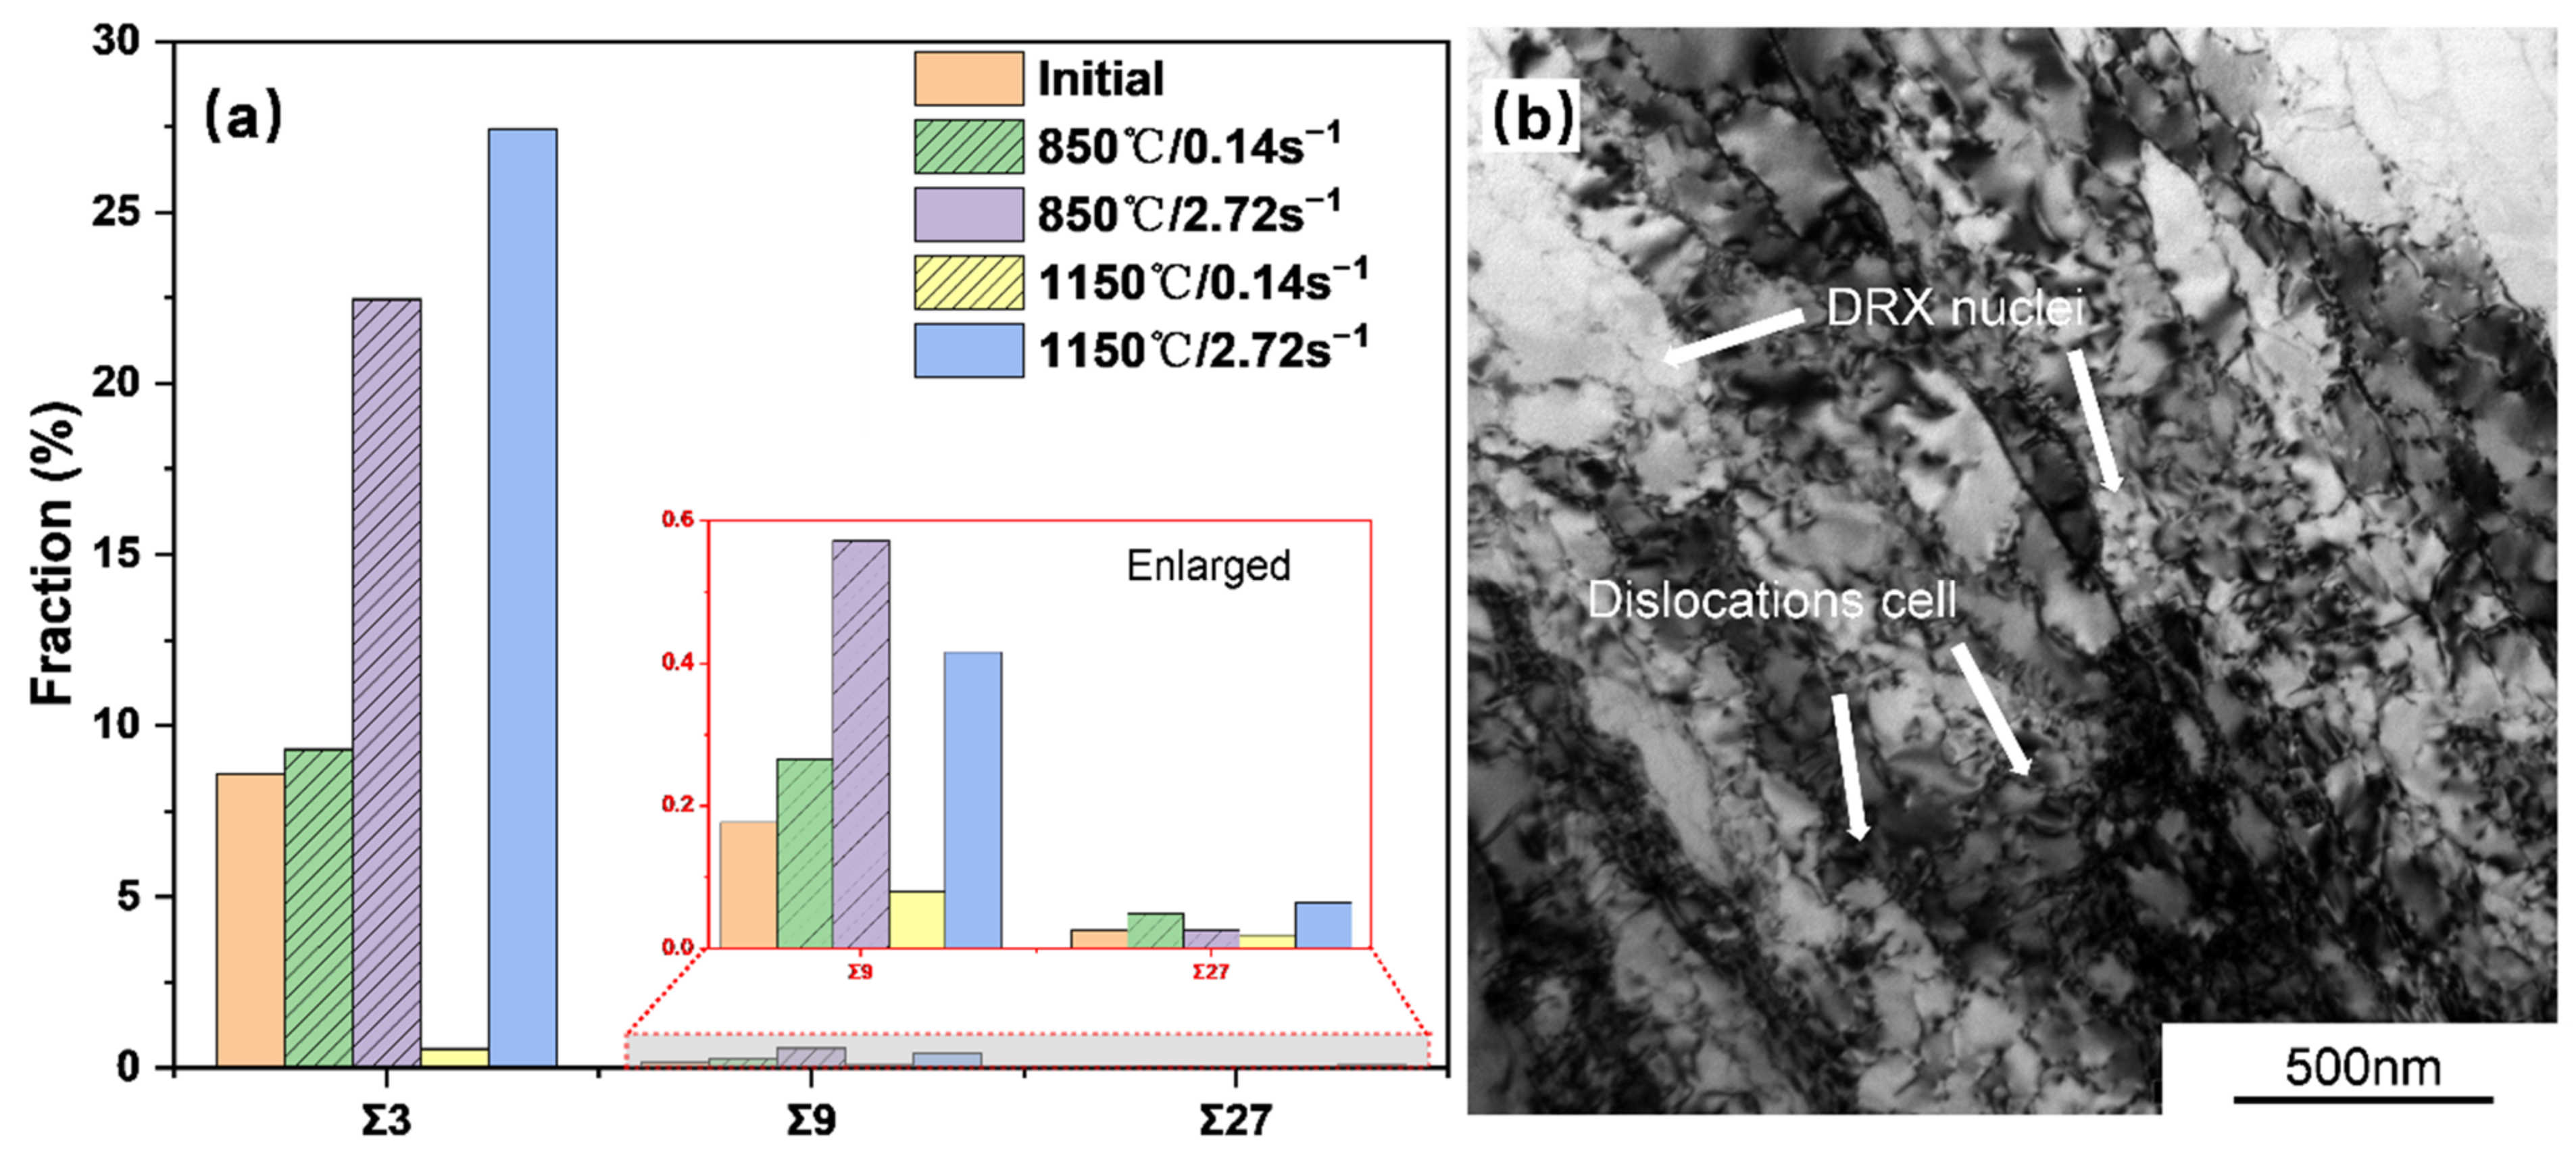
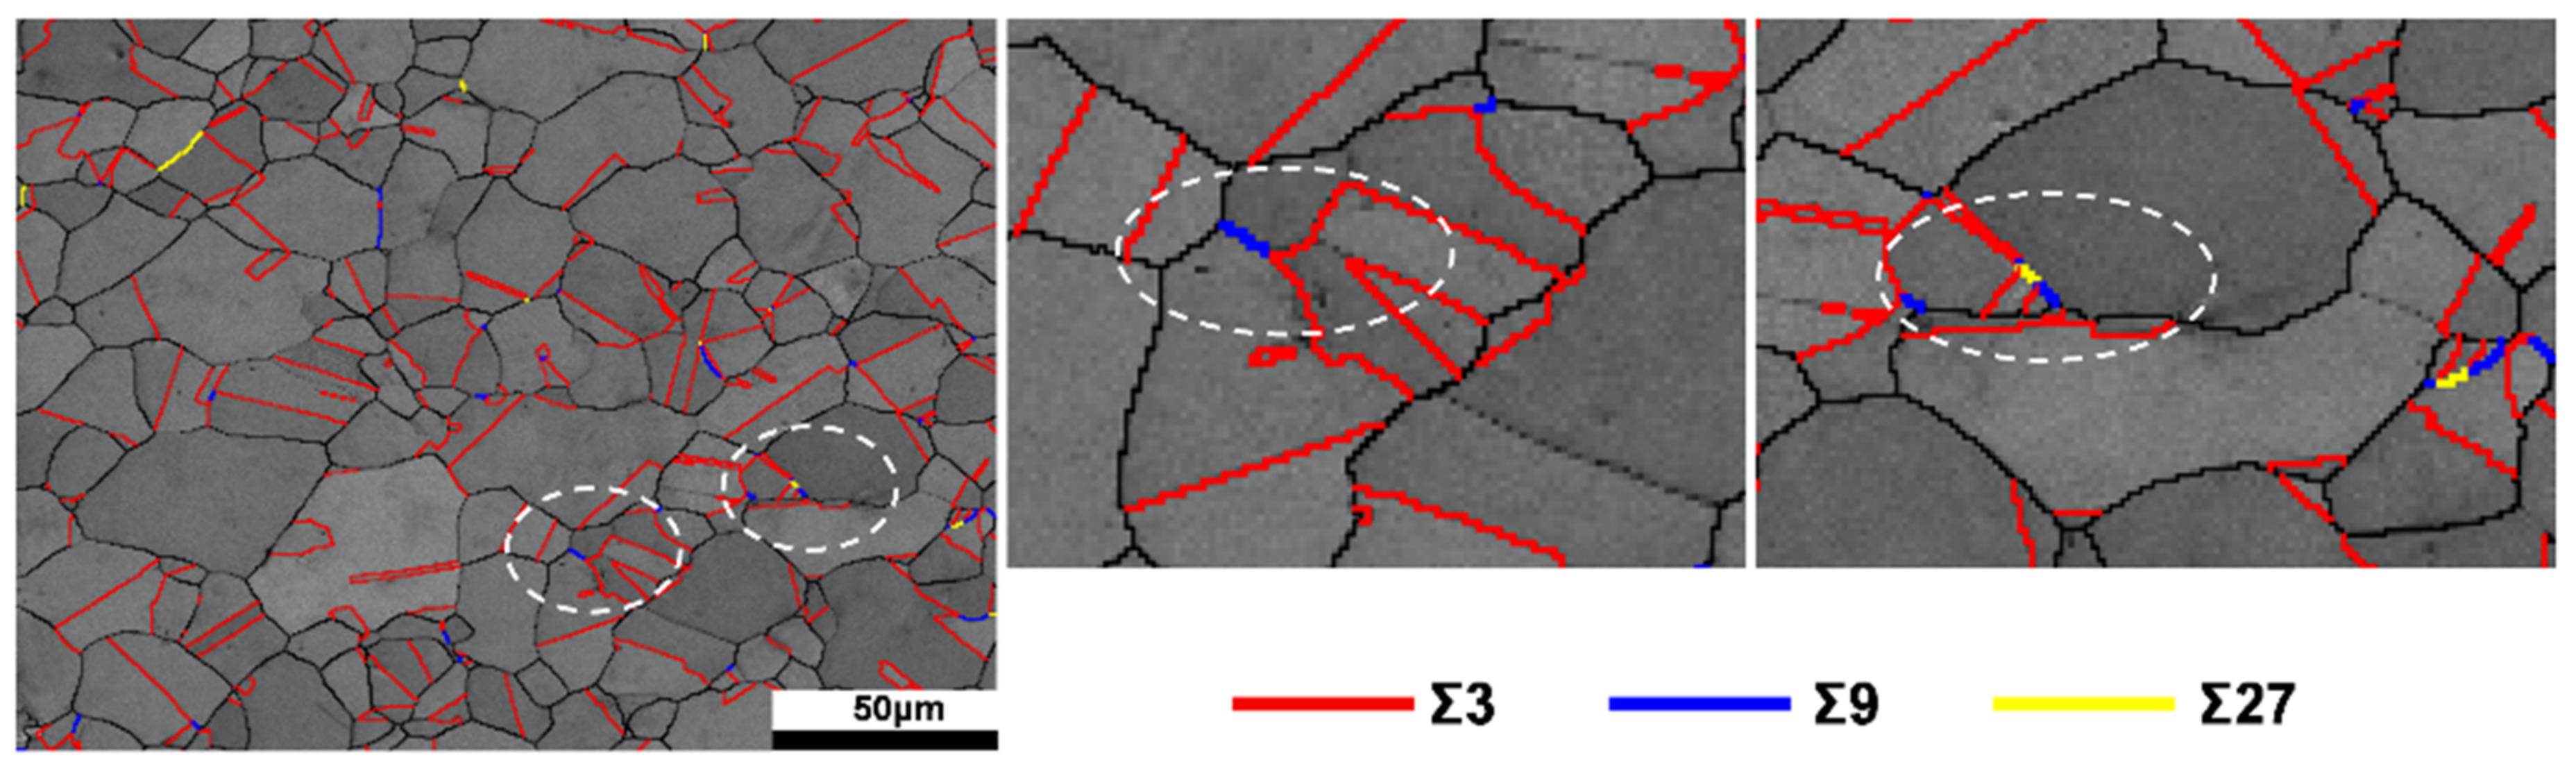
4.4. Evolution of Twin Boundaries

It has been reported that the special twin boundary Σ3, Σ9, and Σ27 can accelerate the DRX process of nickel-based alloys, and can improve mechanical properties at high temperatures [40,41]. The values are percentages of the Σ3, Σ9, and Σ27 twin boundary in terms of total boundary length during the hot deformation of nickel-based alloys 825 as can be seen in Figure 14a. It can be seen that the length fractions of Σ3 represent the majority of the total three twin boundaries, which is caused by the annealing effect of the isothermal heat solution. Note that the fraction of Σ3 is 8.578% in the initial state, then rises to 9.295% and 22.46% at 850 °C and 1150 °C, respectively. However, the fractions of Σ3 dropped drastically when the strain rate increased to 2.72 s−1, at the same time, many DRX nuclei exist in substructure, shown in Figure 11b, DRX grains are quite small due to the high strain rate, and the newly nucleated Σ3 in DRX grains have insufficient growth opportunities. As deformation temperature increased to 1150 °C, the grain boundary mobility is accelerated, thereby promoting twin nucleation and growth in DRX grains.
Previous studies have found that there is a linear relationship of positive correlation between the DRX and the twin boundaries of Σ3, Σ9, and Σ27. Moreover, the twin boundaries can reduce grain boundary energy and increase grain boundary mobility [18]. It should be noted that there is a relation of interaction and production between Σ3, Σ9 and Σ27 at the triple junctions. EBSD maps are highlighted with Σ3 (red), Σ9 (blue), and Σ27 (yellow) twin boundaries of the specimen with deformation temperature at 1150 °C (2.72 s−1), as shown in Figure 15. Two Σ3 boundary interactions form a Σ9 boundary are governed by the rule of the following equations:
Σ 3 + Σ 3 Σ 9
the meeting of two Σ3 boundary and Σ9 boundary leads to an Σ27 boundary through the rule of the following equations:
Σ 3 + Σ 9 Σ 27
However, there are relatively fewer Σ3 and Σ27 twin boundaries observed in the deformed specimens, and the increased fraction of Σ3 and Σ27 is insignificant. Thus, the main contribution that results in the growth of new twins in DRX grains is the new frontier of Σ3 twins.

5. Conclusions

(1)
Hot deformation of nickel-based alloy 825 was investigated at deformation temperature ranges of 850–1150 °C and strain rate ranges of 0.14–2.27 s−1. The peak stress combined with Zener–Hollomon parameter was developed. The minimum activation energy needed for an energy barrier to stimulate the dislocation motion by diffusion is 616.725 KJ/Mol.
(2)
Constitutive equations were developed based on Bergstrom’s model and Kolmogorov–Johnson–Mehl–Avrami’s model. Comparison between predicted and experimental data indicates that the established constitutive model is in good agreement with experimental results. The correlation parameters (R) and average absolute relative error (AARE) are 0.997 and 3.53%, respectively.
(3)
A relationship between interaction and production exists between Σ3, Σ9, and Σ27 during DRX. The major contribution which results in the growth of new twins in DRX grains is the new boundary of Σ3 twins.
(4)
Dynamic recrystallisation mechanisms are DDRX and CDRX, which occur simultaneously in all deformation conditions.

Author Contributions

Conceptualization, Y.L., J.W., H.X., and H.L.; data curation, H.X. and J.W.; funding acquisition, Y.L., H.L., and G.L.; writing—original draft, H.X.; writing—review and editing H.X. and Y.S. All authors have read and agreed to the published version of the manuscript.

Funding

This research was supported by Key Core Technology and Common Technology Research and Development Project of Shanxi Province (20201102017), Excellent Innovation Project for Graduate students in Shanxi Province (2021Y666), Central government guided local science and Technology Development Fund Project (YDZJSX2021A036).

Institutional Review Board Statement

Not applicable.

Informed Consent Statement

Not applicable.

Data Availability Statement

All data generated or analyzed during this study are included in this article.

Conflicts of Interest

The authors declare no conflict of interest.

References

  1. Zhou, C.; Qian, N.; Su, H.; Zhang, Z.; Ding, W.; Xu, J. Effect of energy distribution on the machining efficiency and surface morphology of Inconel 718 nickel-based superalloy using plasma electrolytic polishing. Surf. Coat. Technol. 2022, 441, 128506. [Google Scholar] [CrossRef]
  2. Li, G.; Liu, Z.; Wang, B.; Liu, Y.; Zhao, J. Effect of element Te on alterations of microstructure and mechanical property of nickel-based superalloy Inconel 718 through alloy infiltration. Appl. Surf. Sci. 2021, 544, 148730. [Google Scholar] [CrossRef]
  3. Sanchez, S.; Smith, P.; Xu, Z.; Gaspard, G.; Hyde, C.J.; Wits, W.W.; Ashcroft, I.A.; Chen, H.; Clare, A.T. Powder Bed Fusion of nickel-based superalloys: A review. Int. J. Mach. Tools Manuf. 2021, 165, 103729. [Google Scholar] [CrossRef]
  4. Kumar, A.; Pandey, C. Development and Evaluation of Dissimilar Gas Tungsten Arc-Welded Joint of P92 Steel/Inconel 617 Alloy for Advanced Ultra-Supercritical Boiler Applications. Metall. Mater. Trans. A 2022, 53, 3245–3273. [Google Scholar] [CrossRef]
  5. Dak, G.; Pandey, C. A critical review on dissimilar welds joint between martensitic and austenitic steel for power plant application. J. Manuf. Processes 2020, 58, 377–406. [Google Scholar] [CrossRef]
  6. Akbari, Z.; Mirzadeh, H.; Cabrera, J.-M. A simple constitutive model for predicting flow stress of medium carbon microalloyed steel during hot deformation. Mater. Des. 2015, 77, 126–131. [Google Scholar] [CrossRef]
  7. Jia, D.; Sun, W.; Xu, D.; Yu, L.; Xin, X.; Zhang, W.; Qi, F. Abnormal dynamic recrystallization behavior of a nickel based superalloy during hot deformation. J. Alloys Compd. 2019, 787, 196–205. [Google Scholar] [CrossRef]
  8. Pollock, T.M.; Tin, S. Nickel-Based Superalloys for Advanced Turbine Engines: Chemistry, Microstructure and Properties. J. Propuls. Power 2006, 22, 361–374. [Google Scholar] [CrossRef]
  9. Mingjie, Z.; Fuguo, L.; Shuyun, W.; Chenyi, L. Characterization of hot deformation behavior of a P/M nickel-base superalloy using processing map and activation energy. Mater. Sci. Eng. A 2010, 527, 6771–6779. [Google Scholar] [CrossRef]
  10. Lin, Y.C.; Chen, M.-S. Study of microstructural evolution during static recrystallization in a low alloy steel. J. Mater. Sci. 2009, 44, 835–842. [Google Scholar] [CrossRef]
  11. Zhu, H.; Ou, H. Constitutive modelling of hot deformation behaviour of metallic materials. Mater. Sci. Eng. A 2022, 832, 142473. [Google Scholar] [CrossRef]
  12. Lin, Y.C.; Xiao-Min, C. A critical review of experimental results and constitutive descriptions for metals and alloys in hot working. Mater. Des. 2011, 32, 1733–1759. [Google Scholar] [CrossRef]
  13. Kotkunde, N.; Nitin Krishnamurthy, H.; Kumar Gupta, A.; Kumar Singh, S. Study of Hot Deformation Behavior Using Phenomenological Based Constitutive Model for Austenitic Stainless Steel 316. Mater. Today Proc. 2018, 5, 4870–4877. [Google Scholar] [CrossRef]
  14. Lin, Y.C.; Chen, M.-S.; Zhong, J. Prediction of 42CrMo steel flow stress at high temperature and strain rate. Mech. Res. Commun. 2008, 35, 142–150. [Google Scholar] [CrossRef]
  15. Wang, L.; Liu, F.; Zuo, Q.; Chen, C.F. Prediction of flow stress for N08028 alloy under hot working conditions. Mater. Des. 2013, 47, 737–745. [Google Scholar] [CrossRef]
  16. Singh, K.; Rajput, S.K.; Mehta, Y. Modeling of the hot deformation behavior of a high phosphorus steel using artificial neural networks. Mater. Discov. 2016, 6, 1–8. [Google Scholar] [CrossRef]
  17. Pandey, C.; Mahapatra, M.M.; Kumar, P.; Saini, N. Effect of strain rate and notch geometry on tensile properties and fracture mechanism of creep strength enhanced ferritic P91 steel. J. Nucl. Mater. 2018, 498, 176–186. [Google Scholar] [CrossRef]
  18. Mandal, S.; Bhaduri, A.K.; Subramanya Sarma, V. Role of Twinning on Dynamic Recrystallization and Microstructure during Moderate to High Strain Rate Hot Deformation of a Ti-Modified Austenitic Stainless Steel. Metall. Mater. Trans. A 2012, 43, 2056–2068. [Google Scholar] [CrossRef]
  19. Mandal, S.; Jayalakshmi, M.; Bhaduri, A.K.; Subramanya Sarma, V. Effect of Strain Rate on the Dynamic Recrystallization Behavior in a Nitrogen-Enhanced 316L(N). Metall. Mater. Trans. A 2014, 45, 5645–5656. [Google Scholar] [CrossRef]
  20. Wu, Y.; Liu, Z.; Qin, X.; Wang, C.; Zhou, L. Effect of initial state on hot deformation and dynamic recrystallization of Ni-Fe based alloy GH984G for steam boiler applications. J. Alloys Compd. 2019, 795, 370–384. [Google Scholar] [CrossRef]
  21. Chen, X.-M.; Lin, Y.C.; Wen, D.-X.; Zhang, J.-L.; He, M. Dynamic recrystallization behavior of a typical nickel-based superalloy during hot deformation. Mater. Des. 2014, 57, 568–577. [Google Scholar] [CrossRef]
  22. Tan, G.; Li, H.-Z.; Wang, Y.; Qiao, S.-C.; Yang, L.; Huang, Z.-Q.; Cheng, T.-W.; Zhao, Z.-X. Effect of Zener-Hollomon parameter on microstructure evolution of a HEXed PM nickel-based superalloy. J. Alloys Compd. 2021, 874, 159889. [Google Scholar] [CrossRef]
  23. Tang, K.; Zhang, Z.; Tian, J.; Wu, Y.; Jiang, F. Hot deformation behavior and microstructural evolution of supersaturated Inconel 783 superalloy. J. Alloys Compd. 2021, 860, 158541. [Google Scholar] [CrossRef]
  24. Wang, S.; Luo, J.R.; Hou, L.G.; Zhang, J.S.; Zhuang, L.Z. Physically based constitutive analysis and microstructural evolution of AA7050 aluminum alloy during hot compression. Mater. Des. 2016, 107, 277–289. [Google Scholar] [CrossRef]
  25. Tahreen, N.; Zhang, D.F.; Pan, F.S.; Jiang, X.Q.; Li, C.; Li, D.Y.; Chen, D.L. Characterization of hot deformation behavior of an extruded Mg–Zn–Mn–Y alloy containing LPSO phase. J. Alloys Compd. 2015, 644, 814–823. [Google Scholar] [CrossRef]
  26. Gong, B.; Duan, X.W.; Liu, J.S.; Liu, J.J. A physically based constitutive model of As-forged 34CrNiMo6 steel and processing maps for hot working. Vacuum 2018, 155, 345–357. [Google Scholar] [CrossRef]
  27. Lin, Y.C.; Chen, X.-M.; Wen, D.-X.; Chen, M.-S. A physically-based constitutive model for a typical nickel-based superalloy. Comput. Mater. Sci. 2014, 83, 282–289. [Google Scholar] [CrossRef]
  28. Mecking, H.; Kocks, U.F. Kinetics of flow and strain-hardening. Acta Metall. 1981, 29, 1865–1875. [Google Scholar] [CrossRef]
  29. Hansen, N.; Kuhlmann-Wilsdorf, D. Low energy dislocation structures due to unidirectional deformation at low temperatures. Mater. Sci. Eng. 1986, 81, 141–161. [Google Scholar] [CrossRef]
  30. McQueen, H.J.; Yue, S.; Ryan, N.D.; Fry, E. Hot working characteristics of steels in austenitic state. J. Mater. Process. Technol. 1995, 53, 293–310. [Google Scholar] [CrossRef]
  31. Yanagida, A.; Yanagimoto, J. A novel approach to determine the kinetics for dynamic recrystallization by using the flow curve. J. Mater. Process. Technol. 2004, 151, 33–38. [Google Scholar] [CrossRef]
  32. Mirzadeh, H.; Najafizadeh, A. Prediction of the critical conditions for initiation of dynamic recrystallization. Mater. Des. 2010, 31, 1174–1179. [Google Scholar] [CrossRef]
  33. Liu, J.; Cui, Z.; Ruan, L. A new kinetics model of dynamic recrystallization for magnesium alloy AZ31B. Mater. Sci. Eng. A 2011, 529, 300–310. [Google Scholar] [CrossRef]
  34. Mofarrehi, M.; Javidani, M.; Chen, X.G. Effect of Mn content on the hot deformation behavior and microstructure evolution of Al–Mg–Mn 5xxx alloys. Mater. Sci. Eng. A 2022, 845, 143217. [Google Scholar] [CrossRef]
  35. Song, Y.; Li, Y.; Li, H.; Zhao, G.; Cai, Z.; Sun, M. Hot deformation and recrystallization behavior of a new nickel-base superalloy for ultra-supercritical applications. J. Mater. Res. Technol. 2022, 19, 4308–4324. [Google Scholar] [CrossRef]
  36. Oh, J.-H.; Yoo, B.-G.; Choi, I.-C.; Santella, M.L.; Jang, J. Influence of thermo-mechanical treatment on the precipitation strengthening behavior of Inconel 740, a Ni-based superalloy. J. Mater. Res. 2011, 26, 1253–1259. [Google Scholar] [CrossRef]
  37. Zhang, J.-S.; Xia, Y.-F.; Quan, G.-Z.; Wang, X.; Zhou, J. Thermal and microstructural softening behaviors during dynamic recrystallization in 3Cr20Ni10W2 alloy. J. Alloys Compd. 2018, 743, 464–478. [Google Scholar] [CrossRef]
  38. Chen, W.; Jia, C.; Hu, B.; Zheng, C.; Li, D. Evolution of twins and sub-boundaries at the early stage of dynamic recrystallization in a Ni-30%Fe austenitic model alloy. Mater. Sci. Eng. A 2018, 733, 419–428. [Google Scholar] [CrossRef]
  39. Xie, B.; Zhang, B.; Yu, H.; Yang, H.; Liu, Q.; Ning, Y. Microstructure evolution and underlying mechanisms during the hot deformation of 718Plus superalloy. Mater. Sci. Eng. A 2020, 784, 139334. [Google Scholar] [CrossRef]
  40. Sugui, T.; Zhenrong, L.; Zhonggang, Z.; Liqing, C.; Wenru, S.; Xianghua, L. Influence of deformation level on microstructure and creep behavior of GH4169 alloy. Mater. Sci. Eng. A 2012, 550, 235–242. [Google Scholar] [CrossRef]
  41. Qian, M.; Lippold, J.C. The effect of annealing twin-generated special grain boundaries on HAZ liquation cracking of nickel-base superalloys. Acta Mater. 2003, 51, 3351–3361. [Google Scholar] [CrossRef]
Figure 1. The EBSD Initial microstructures of nickel-based alloy 825: (a) boundary coincidence and Σ3 site lattice boundary map, and (b) IPF map.
Metals 12 01496 g001
Figure 2. Typical true strain–stress curves of the alloy under different deformation temperatures and strain rates, (a) 0.1 s−1, (b) 0.37 s−1, (c) 1 s−1, and (d) 2.271 s−1.
Metals 12 01496 g002
Figure 3. Relationship between: (a) lnέ−ln[sinh(ασ)], (b) 1/T−ln[sinh(ασ)], and (c) lnZ−ln[sinh(ασ)].
Metals 12 01496 g003
Figure 4. Work hardening rate (θ) relative to the flow stress (σ) at a deformation temperature of 1150 °C and a deformation rate of 1 s−1.
Metals 12 01496 g004
Figure 5. Relationship between: (a) lnZ and the stress (σp and σc), and (b) lnZ and the stress (σsat and σss).
Metals 12 01496 g005
Figure 6. Relationship between: (a) ε − ln[(σ2satσ20)/(σ2satσ2)], and (b) lnZσ0.
Metals 12 01496 g006
Figure 7. Relationship between: (a) ln [(εεc)] − ln[(−ln(1 − Xd))], and (b) σcσp.
Metals 12 01496 g007
Figure 8. Comparison between the experimental and with Bergstrom and KJMA models at different strain rates (symbols for the predicted flow stress; the solid line for the experimental results), (a) 0.1 s−1, (b) 0.37 s−1, (c) 1 s−1, and (d) 2.271 s−1.
Metals 12 01496 g008
Figure 9. The bar chart and scatter map of the predicted and measured flow stress under all deformation conditions.
Metals 12 01496 g009
Figure 10. T EBSD maps of IPF, HAB and LAB, Twin deformed at 850 °C and 0.14 s−1, 850 °C and 0.17 s−1, 1150 °C and 0.14 s−1, 1150 °C and 0.14 s−1, respectively.
Metals 12 01496 g010
Figure 11. EBSD maps of KAM deformed at (a) 850 °C and 0.14 s−1, (b) 850 °C and 0.17 s−1, (c) 1150 °C and 0.14 s−1, and (d) 1150 °C and 0.14 s−1.
Metals 12 01496 g011
Figure 12. The GND densities of the studied nickel-based alloy 825.
Metals 12 01496 g012
Figure 13. DRX behavior of the nickel-based alloy 825 deformed at (a) 850 °C (0.14 s−1), and (b) 850 °C (2.72 s−1).
Metals 12 01496 g013
Figure 14. (a) Effect of hot deformation on the length fraction of the twin grain boundaries and (b) TEM micrographs.
Metals 12 01496 g014
Figure 15. The twin grain boundaries of Σ3, Σ9, and Σ27.
Metals 12 01496 g015
Table 1. The peak stress at different deformation conditions.
Strain Rate (s−1)Temperature (°C)
85095010501150
0.1427519513287
0.3731421915795
1337252159113
2.72362266176127
Table 2. Material parameters.
ConstantαAn
Value0.00512.09 × 10249.633
Publisher’s Note: MDPI stays neutral with regard to jurisdictional claims in published maps and institutional affiliations.

