Article

Process Optimization of Inconel 718 Alloy Produced by Laser Powder Bed Fusion

1
Department of Mechanical Engineering, National Central University, Taoyuan 320317, Taiwan
2
Department of Mechanical Engineering, Oriental Institute of Technology, New Taipei City 220303, Taiwan
*
Author to whom correspondence should be addressed.
Metals 2022, 12(9), 1494; https://doi.org/10.3390/met12091494
Submission received: 15 August 2022 / Revised: 28 August 2022 / Accepted: 6 September 2022 / Published: 9 September 2022

Abstract

:
To cut the cost of the laser powder bed fusion (LPBF) process, which is much higher than that of the traditional manufacturing process, an effective implementation of optimization analysis is needed. The study investigated the optimization of the LPBF Inconel 718 alloy with the Taguchi method and principal component analysis (PCA), covering four control factors at three levels in the manufacturing process. It focused on four mechanical properties, namely tensile strength, elongation, impact energy, and hardness. The results show that the highest tensile strength is obtainable at a laser power of 140 W, scanning speed of 800 mm/s, scanning pitch of 70 μm, and interlayer angle of 45 degrees. The optimal combination of process parameters for multiobjective optimization is just the same as that for single-objective optimization for tensile strength. The difference between the predicted and experimental average tensile strength is 1.2%, and the error of the predicted optimal strength index is 12.6%. The most important control factor for tensile strength and multiple responses is the angle between layers, with a contribution rate exceeding 90%. With a given volume energy density of the LPBF process, the higher the power and scanning speed, the higher the accumulated energy and the larger the amount of dendritic or cellular crystals formed.

1. Introduction

As one of the fastest-growing advanced processes today [1], additive manufacturing (AM) has been applied in the manufacturing of various 3D models with complex geometric structure and components, such as medical implants [2], vehicle intake manifold [3], mold, die, and aerospace [4]. According to ASTM-F2792-12a, metal laser AM is divided into directed energy deposition (DLD) and power bed fusion (PBF), with the latter being subdivided further into electron beam powder bed fusion (EPBF) and laser powder bed fusion (LPBF), also known as selective laser melting (SLM), which will be employed in the study.
Boasting anticreep, antifatigue, antioxidation, and corrosion-resistant properties [5], Inconel alloy has been applied in the high-tech sector. In traditional manufacturing, Inconel alloys require complicated and time-consuming processing, causing high wear rates for machine tools because of their high strength, high hardness, and low ductility. In addition, Inconel components mostly have complex geometric shapes. Consequently, additive manufacturing is a suitable and economic approach in the manufacture of nickel-based superalloys [6]. Among the nickel-based superalloys, Inconel 718 is the most concerned.
Before the implementation of AM-based technologies to obtain complex-shaped parts, it is necessary to guarantee combinations of strength, ductility, and toughness, similar to those obtained via conventional manufacturing routes. As the quality of LPBF products is subject to the influence of many process parameters [7], the selection of optimal LPBF conditions is essential. Unlike the traditional method, which requires many experiments to obtain a satisfactory result, the Taguchi method is an optimization approach capable of manufacturing products with the best quality at the lowest cost. As a result of this, it has become an effective tool for improving productivity in recent years. With a factorial design, it employs orthogonal tables and a signal-to-noise ratio (S/N ratio) in data analysis [8]. However, the Taguchi method can optimize only a single quality. To solve the problem, many researchers have endeavored to couple it with other methods, such as the fuzzy method, multiple linear regression analysis, and principal component analysis, to extend its application to cases involving multiple quality characteristics [9].
Several process parameters have a significant effect on the porosity, microstructure, and mechanical properties of as-built Inconel 718 AM products [10]. After reviewing the mechanisms of pore formation in additively manufactured metals, Wang et al. [11] presented the statistical analysis of porosity and its distribution in selective laser-melted Inconel 718. Through an investigation of the effect of line energy density on yield strength, Yi et al. [12] found that the highest yield strength can be achieved at an energy density of 9.2 J/mm. Jia et al. [13] used different line energy densities for stacking. In X-ray diffraction observation, it was found that as the energy density increases, the amount of strengthening phase also increases, with the highest hardness falling at 0.33 J/mm energy. Probing the effect of laser energy density on different types of defects, such as porosity, lack of fusion, keyholing, and balling, Parida et al. [14] discovered that laser energy density has a significant effect on defect formation, a finding useful for selecting suitable process parameters for the manufacturing process. By comparison of the LPBF Inconel 718 superalloy with and without plate preheating, Borisov et al. [15] looked into the effect of layer thickness on melt pool characteristics, porosity, and hardness to understand how laser power and preheating affect microstructure development. Cao et al. [16] discussed precipitates generated during SLM manufacturing. At a cooling rate of 106 K/s, the microstructure of SLM samples is composed of cell structure and cellular dendrite, and the precipitates are a large number of irregular bulk Laves phases, a small amount of carbonitride, and nanosized spherical Al2O3 particles. Wan et al. [17] changed the printing angle between different layers with a fixed volume energy density, finding that stacking each layer in the same direction would increase strength. Zhang et al. [18] studied the microstructure evolution, hardness, and tensile properties of selective laser melting Inconel 718 along the building direction and section dimension. The tensile strength and yield strength of the LPBF Inconel 718 components are found to gradually decrease along the building direction, while the elongation exhibits an opposite trend. Yong et al. [19] reviewed the fatigue properties of AM Inconel 718 in a high-temperature environment. It is pointed out that heat treatment can eliminate most defects and improve mechanical properties. AM products still perform better in high-temperature environments due to less cold work. Schmiedel et al. [20] studied the fatigue properties of additive manufactured and wrought Inconel 718 in a high-temperature environment. The results showed that the fatigue strength of additive manufactured samples is significantly reduced, and cracks are caused by internal defects compared with wrought parts. Cheng et al. [21] examined the influence of different scanning methods on residual stress and deformation through software simulation. In 2018, Zhang et al. [22] reviewed the development of four of the most common additive manufacturing methods for metallic materials, namely powder bed fusion, direct energy deposition, binder jetting, and sheet lamination, in addition to a comprehensive comparison of process principles, microstructure, Young’s modulus, yield strength, tensile strength, and hardness of AM-fabricated parts. They indicated that the relationship between the microstructures and mechanical properties of AM’s part is still not fully understood.
The anisotropy of materials affects the cutting performance of AM products. Perez et al. [23] examined the effects of LPBF parameters on cutting forces and the anisotropy of Inconel 718 in the peripheral milling operations. A good correlation was obtained between the cutting force fluctuation and the predicted Taylor factor. The grain boundary density was acceptably correlated with the level of cutting force. Perez et al. [24] also proposed an iterative design methodology for manufacturing thin-walled AM components. The method considered the material anisotropy of different manufacturing configurations and adopted lateral stiffeners. A significant roughness and cutting force reduction (≈50%) were obtained. Ji et al. [25] compared the microstructures and machinability of SLM-fabricated IN718 and wrought IN718 in micromilling. They indicated that the SLM-fabricated component has lower grain coarsening, texture behavior, compressive residual stress, tool wear, and surface roughness.
Heat treatment has obvious influence on the mechanical properties and anisotropy features of AM products. Korkmaz et al. [26] presented a review of the challenges encountered in aggregate manufacturing, focusing on the structure of aggregate manufacturing. They indicated that the porosity, dimensional accuracy, and surface texturing can be improved by heat treatment, chemical methods, and parameter optimization. Korkmaz et al. [27] also reviewed the effect of heat treatment on titanium and nickel alloys. Solution and aging treatments can improve the microstructure and mechanical properties, and the above heat treatments are valuable for further study. Fayed et al. [28] discussed the effect of heat treatment on Inconel 718 manufactured by SLM. The 2.5-h homogenization resulted in significant changes in the microstructure, and the 4-h homogenization resulted in almost complete recrystallization and an excellent balance between strength and ductility. Bassini et al. [29] studied the heat treatment of LPBF. According to the study, the structure can be homogenized by solution treatment at 1065 °C for 2 h. At 720 °C, γ” particles were mainly formed, while at 630 °C, more γ’ strengthened particles were formed, and the hardness most significantly increased.
To cut the cost of the LPBF process, which is much higher than that of the traditional manufacturing process, an effective implementation of optimization analysis is needed. In the study, the optimal combination of Inconel 718 LPBF process parameters was obtained through optimization analyses of single and multiple objectives of the process. The predicted tensile strength was compared with that of the experimental value, and the causal relationship between the condition of the process, microstructure, mechanical property, and mechanism of fracture was discussed.

2. Materials and Methods

2.1. Optimization of the LPBF Process

2.1.1. Experimental Design

The experiment took into account four control factors (i.e., laser power, scanning speed, hatching space, and interlayer angle) at three levels. The interlayer angle refers to the difference in the laser scanning angle between successive layers. It embraced the standard L9 (34) orthogonal array for the factorial design. The range of process parameters with better formation properties was established, referring to the results of previous experiments [30]. Table 1 lists the parameters of the LPBF process, along with their ranges, covering four target mechanical properties, namely tensile strength, elongation, impact energy, and hardness.

2.1.2. Single-Objective Optimization Analysis

Single-objective optimization was performed with the Taguchi method. Quality characteristics can be divided into three cases: normal-the-better, larger-the-better, and smaller-the-better, among which the study used a larger-the-better one, targeting higher mechanical properties. In the Taguchi method, the signal-to-noise ratio (S/N ratio) is used as a quality indicator. Equation (1) is the formula for the S/N ratio for the larger-the-better case:
S / N = 10   log 10 [ 1 n 1 n 1 y i 2 ]
where n is the number of samples in each trial, and yi is the measured property.
After completing the orthogonal table experiment, the study obtained the S/N ratios for each data set, calculated the effect of each factor on the products, and then drew the response graph and the response table, the former helping the readers understand the effect of parameters and the trend affected by each level.

2.1.3. Multiobjective Optimization Analysis

Multiobjective optimization was performed with the principal component analysis (PCA) method, which is a multivariate statistical approach taking into account the variance of the original multiobjective with a small number of components. Introduced by Pearson [31] and then developed by Hotelling [32], the method is executed according to the following procedure [33]: (1) original multiobjective array, (2) normalization of the objective, (3) correlation coefficient array, (4) determination of eigenvectors and eigenvalues, and (5) evaluation of principal components.

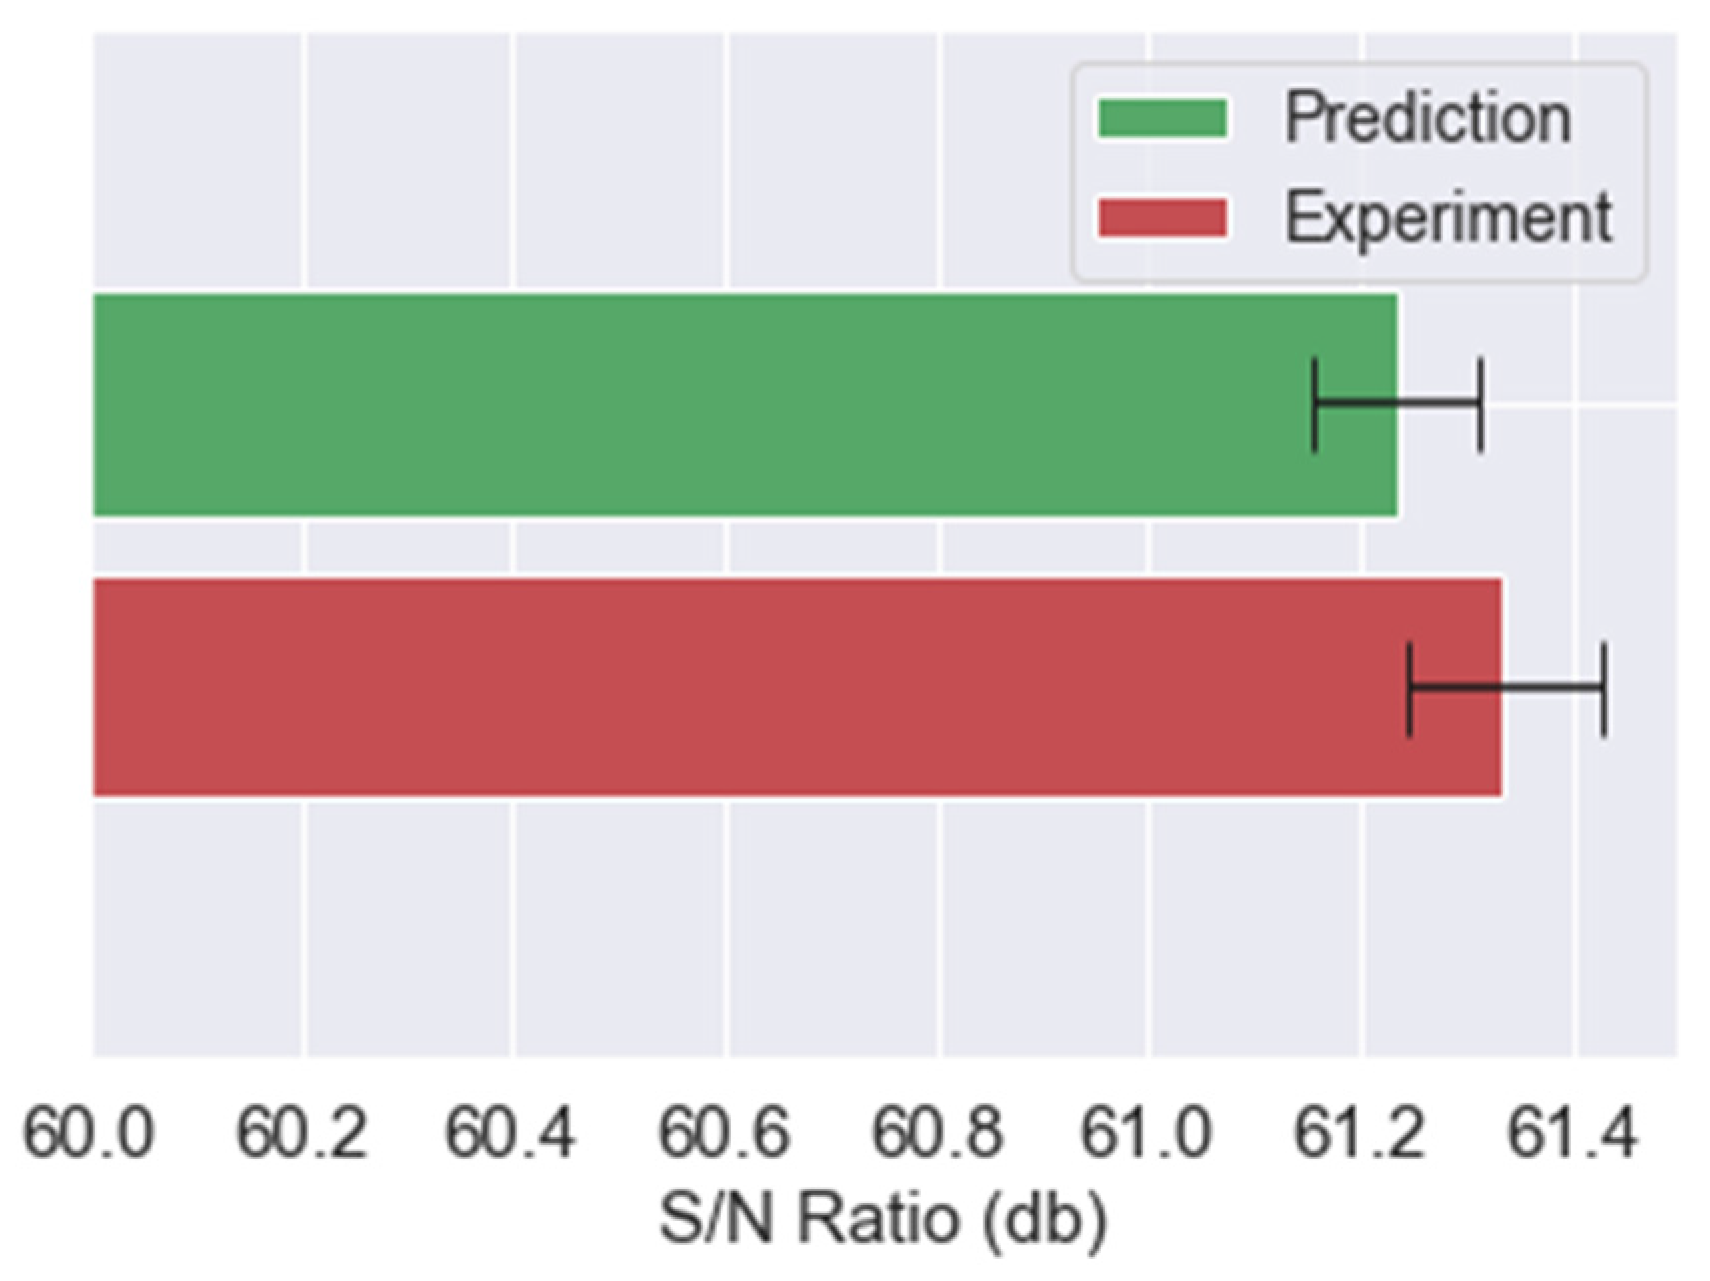
2.1.4. Verification of Optimization Parameters

After the optimal combination of process parameters was obtained from the optimization analysis, the corresponding test specimens were printed, and the mechanical properties of the specimens were measured. The optimal performance (the optimal value of the response characteristics) obtained from single-objective and multiobjective optimization was estimated with Equation (2):
S / N p r e d i c t = S / N m e a n + i = 1 n S / N i S / N m e a n  
where S/Nmean is the average value of the results of the orthogonal table experiment, and S/Ni is the S/N ratio of each quality at the optimal level.
The optimized parameters were verified by comparing the “confidence interval (CI)” of the predicted optimum performance and the experimental value. If there is an overlap, the experimental data are credible; otherwise, the experiment may be interfered with by external factors or operating errors, resulting in distorted results. In the latter case, the verification experiment has to be repeated. The confidence intervals were calculated with Equations (3) and (4).
Confidence interval of the optimal performance predicted:
CI = | N α / 2 × S e x p m e |
Confidence interval of the experimental value:
CI = | N α / 2 × S e x p ( 1 m e + 1 r ) |
where Nα/2 is the standard normal distribution. When α equals 0.05, Nα/2 equals −1.96. Sexp is the experimental error, me is the number of equivalent samples, and r is the number of repeated data in each experiment group.

2.2. Experimental Procedure

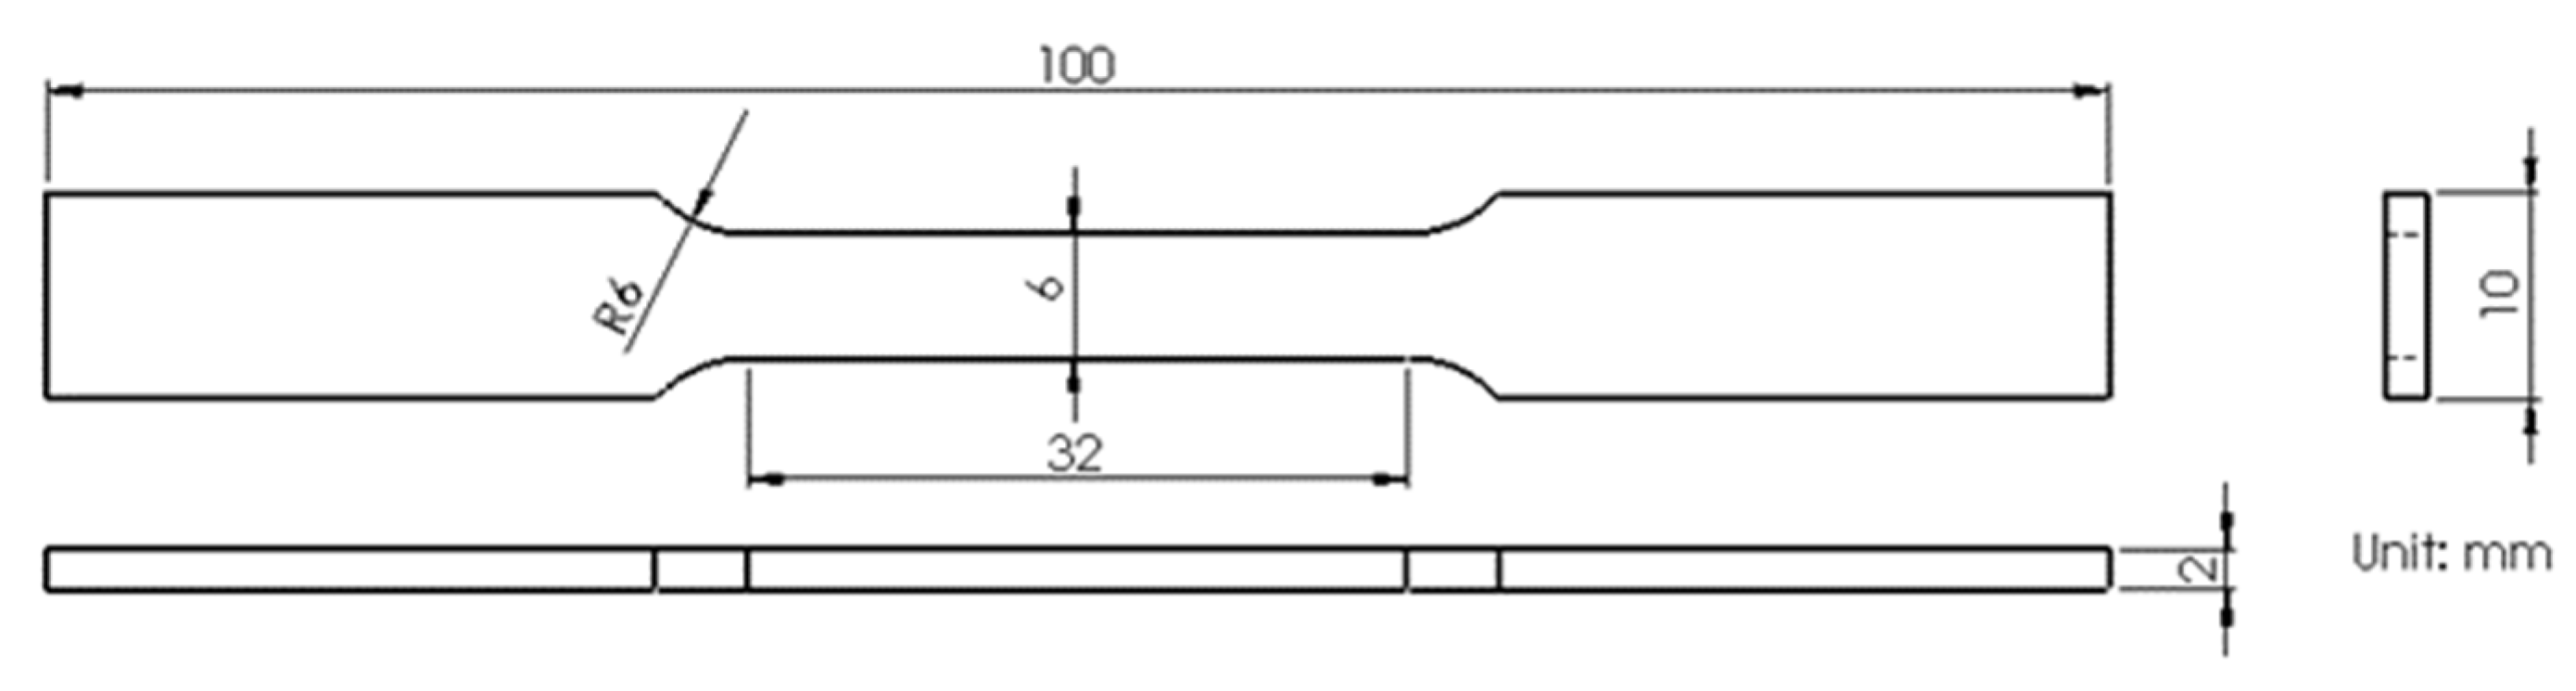
2.2.1. Specimen Production

As shown in Table 2, nine sets of test pieces were printed with different process conditions. In the study, the LPBF machine (the TSLM model) with 400 W capacity was developed by TeraSolar Energy Materials Co., Ltd. (Miaoli, Taiwan), while the Inconel 718 powder with Ni–20Cr–3Mo–5Nb–FeTiAl compositions was supplied by SANYO Special Steel Co., Ltd. (Himeji, Japan). The particle size distributions D10, D50, and D90 are 23.8, 34.2, and 50.5 μm, respectively.

2.2.2. Mechanical Property Testing

The relationship between the building and testing directions is shown in Figure 1. Tensile specimens were loaded vertical to the build direction.
After LPBF printing, the as-built tensile block with thickness of 11.5 mm was cut into three tensile specimens by the milling process as shown in Figure 2. The MTS 810 universal material testing machine (MTS Systems Corp., Minneapolis, MN, USA) was used to evaluate the tensile properties of the materials at room temperature. The strain of the specimen was measured with an extensometer (MTS Systems Corp., Minneapolis, MN, USA). Impact energy was measured with a standard V-notch Charpy specimen (10 mm × 10 mm × 55 mm), according to ASTM E23-18. The surface was processed with a milling machine. The Rockwell C scale hardness test (HRC) was performed, according to ASTM E18-07, to measure the hardness of Inconel 718 as-built. In each mechanical property test, three specimens were tested for each LPBF processing condition.

2.2.3. Metallographic and Fractographic Examination

The microstructures of the materials were examined with laser conjugate focus microscopy LCFM (Olympus Corp., Tokyo, Japan) and scanning electron microscopy SEM (JEOL Ltd., Tokyo, Japan). After cutting the specimens, they were mounted cold before being mechanically ground and polished. The specimens were then etched with an aqua regia reagent, followed by the application of deionized water and ethanol to neutralize the specimens, which were then observed with LCFM and SEM.
After the mechanical property test, the fracture features were investigated with scanning electron microscopy.

3. Results and Discussion

3.1. Mechanical Properties

The study aimed at four mechanical properties, namely tensile strength, elongation, impact energy, and hardness quality, with experimental results shown in Table 2. Tensile strength ranges between 980 and 1130 MPa, with specimen N7 having the lowest strength and specimen N5 the highest strength. Overall, the tensile strength obtained is comparable with or even better than those of other similar studies [34], underscoring the correctness of the process parameter setting in the study.

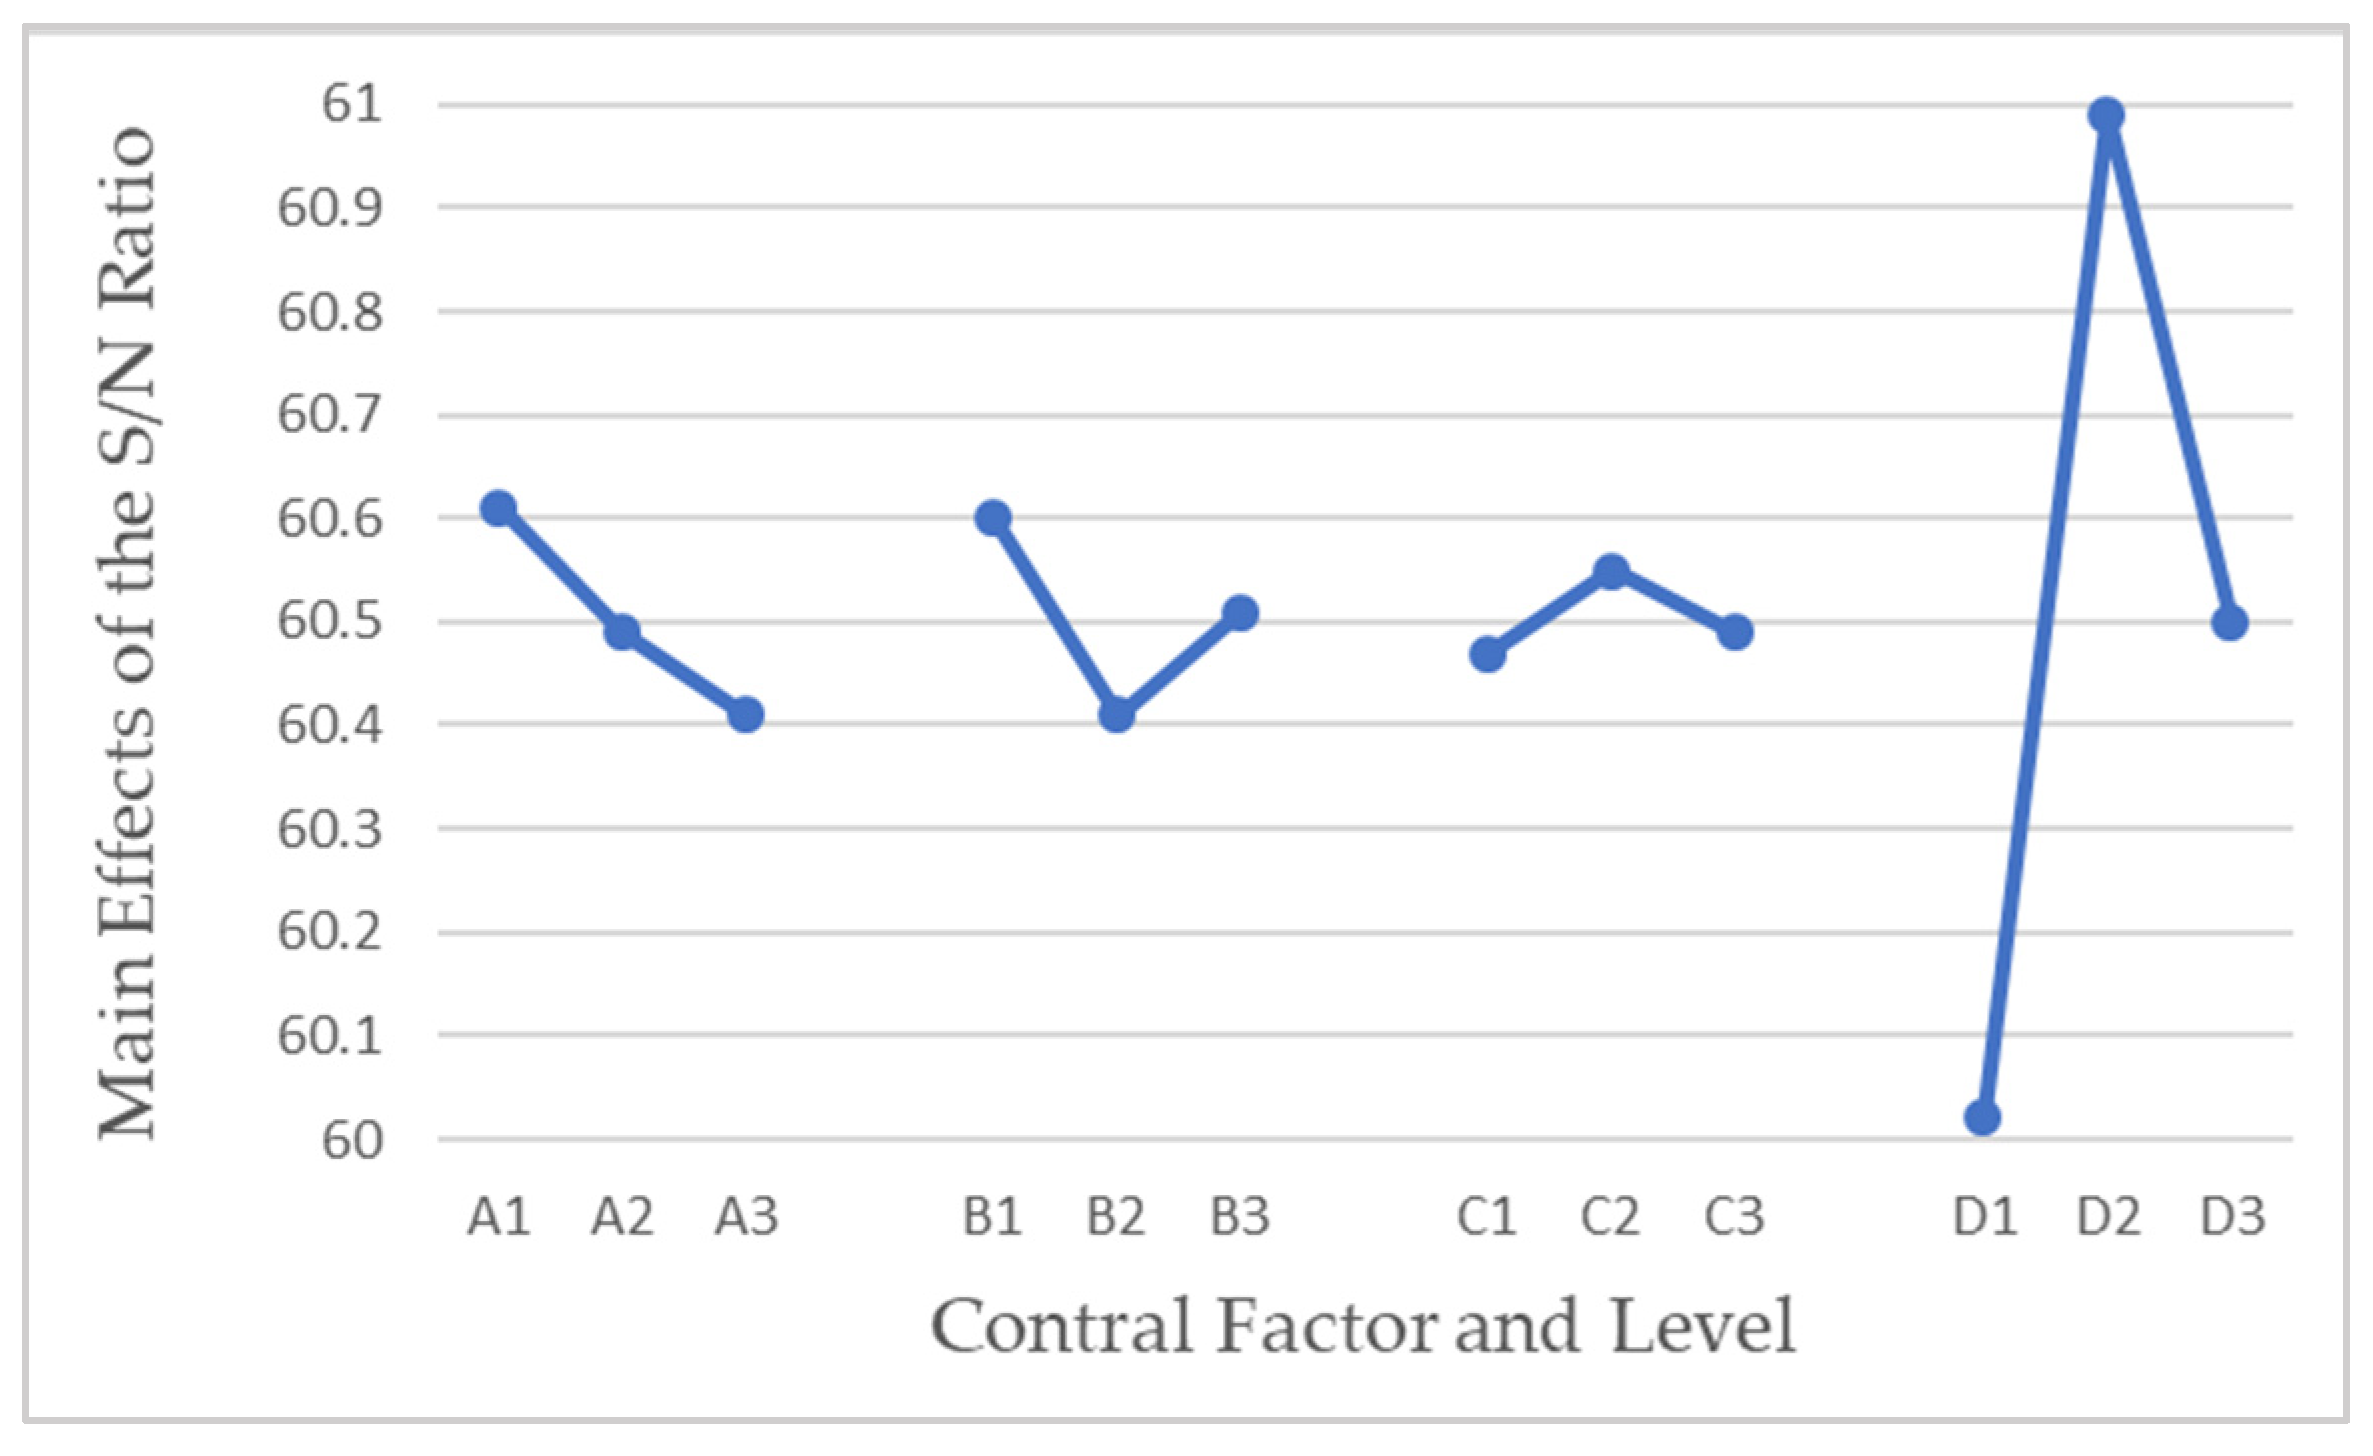
3.2. Single-Objective Optimization Analysis

Tensile strength was chosen as the target quality in the single-objective optimization analysis. In mechanical design, the higher the tensile strength, the better the quality of the material. Therefore, the larger-the-better methodology of the S/N ratio was employed. Table 2 shows the average tensile strength of the nine trials, while Figure 3 shows the response graph of the S/N ratios. Since tensile strength is the larger-the-better, a level with the largest average response is selected. In Figure 3, A1, B1, C2, and D2 have the highest value of the S/N ratio for each control factor. Therefore, the optimal combination of process parameters is [A1, B1, C2, D2], with a laser power of 140 W, scanning speed of 800 mm/s, scanning distance of 70 μm, and interlayer angle of 45°. The result of the ANOVA for the S/N ratio is also shown in Table 3, indicating that the contribution of factor D, the angle of the interlayer, to the tensile strength is 92.2%, while others are too small to be taken into account. The interlayer angle is the most important control factor for optimal tensile strength. Reasonable selection of the scanning direction and scanning sequence will reduce the heat accumulation and affect the temperature gradient of the surrounding powder. Remelting by changing the scanning direction is beneficial to obtain fine microstructure, good mechanical properties, and reduced residual stress [35]. Zhang et al. [36] compared the effects of various scanning strategies. They found that the 45° rotation has the lowest residual stress after releasing the constraint of the base plate and has the lowest spindle deformation. The result is the same as the most important control factor obtained in our study.
According to the optimal process condition and Equation (2), the optimal predicted S/N ratio is 61.23 dB, corresponding to a tensile strength of 1153 MPa. However, since the S/N ratio takes into account the analysis of the product error, it is not possible to use a single set of data for verification analysis. The optimal process condition was adopted in the printing of specimens. The tensile strength in the verification test is shown in Table 4. The difference between the predicted and experimental average tensile strength (1167 MPa) is 1.2%. Figure 4 shows 95% confidence intervals for the predicted and experimental tensile strength, which overlap, underscoring the validity of the present single-objective optimization analysis. The tensile strength of this work is much higher than that of the as-built Inconel 718 in other papers. They are about 860 and 840 MPa in [37] and [38], respectively. It shows the validity in the present optimization approach.

3.3. Multiobjective Optimization Analysis

In the engineering application of a product, different mechanical properties are usually simultaneously considered for multifunction purposes. It needs to optimize the condition of the LPBF process for multiple quality problems. The principal component analysis and Taguchi method are combined to deal with multipurpose problems. First, the multiresponse array, including the S/N ratios of responses, was normalized. Then, the correlation coefficient matrix was evaluated, along with its eigenvalues and eigenvectors from the normalized multiresponse array (Table 5). The eigenvalues are 0.501, 0.284, 0.196, and 0.019, respectively, while the eigenvector corresponding to the largest eigenvalue is [0.635 −0.674 −0.312 0.212]. The coefficients of the eigenvector are the weights of various S/N ratios. The first principal component is the sum of the products of the S/N ratios of four responses multiplied by the coefficient of the corresponding eigenvector to the largest eigenvalue. Other principal components are calculated using the same procedure. The response graphs of the S/N ratios and ANOVA are shown in Figure 5 and Table 6, respectively, which show that when the multiquality characteristic is considered, [A1, B1, C2, D2] is recommended. The combination of optimal process parameters is the same as that of a single-objective optimization targeting the tensile strength. The interlayer angle is the most important control factor, with a contribution of 97.6%. According to the optimal process condition and Equation (2), the optimal strength index predicted is 1.27. The optimal process condition was adopted in the printing of specimens. Table 7 shows the results of the verification test. The experimental strength index is 1.43. The error of the predicted optimal strength index is 12.6%. Figure 6 shows the 95% confidence intervals of the predicted and experimental tensile strengths, which overlap, confirming the validity of the present multiobjective optimization analysis.

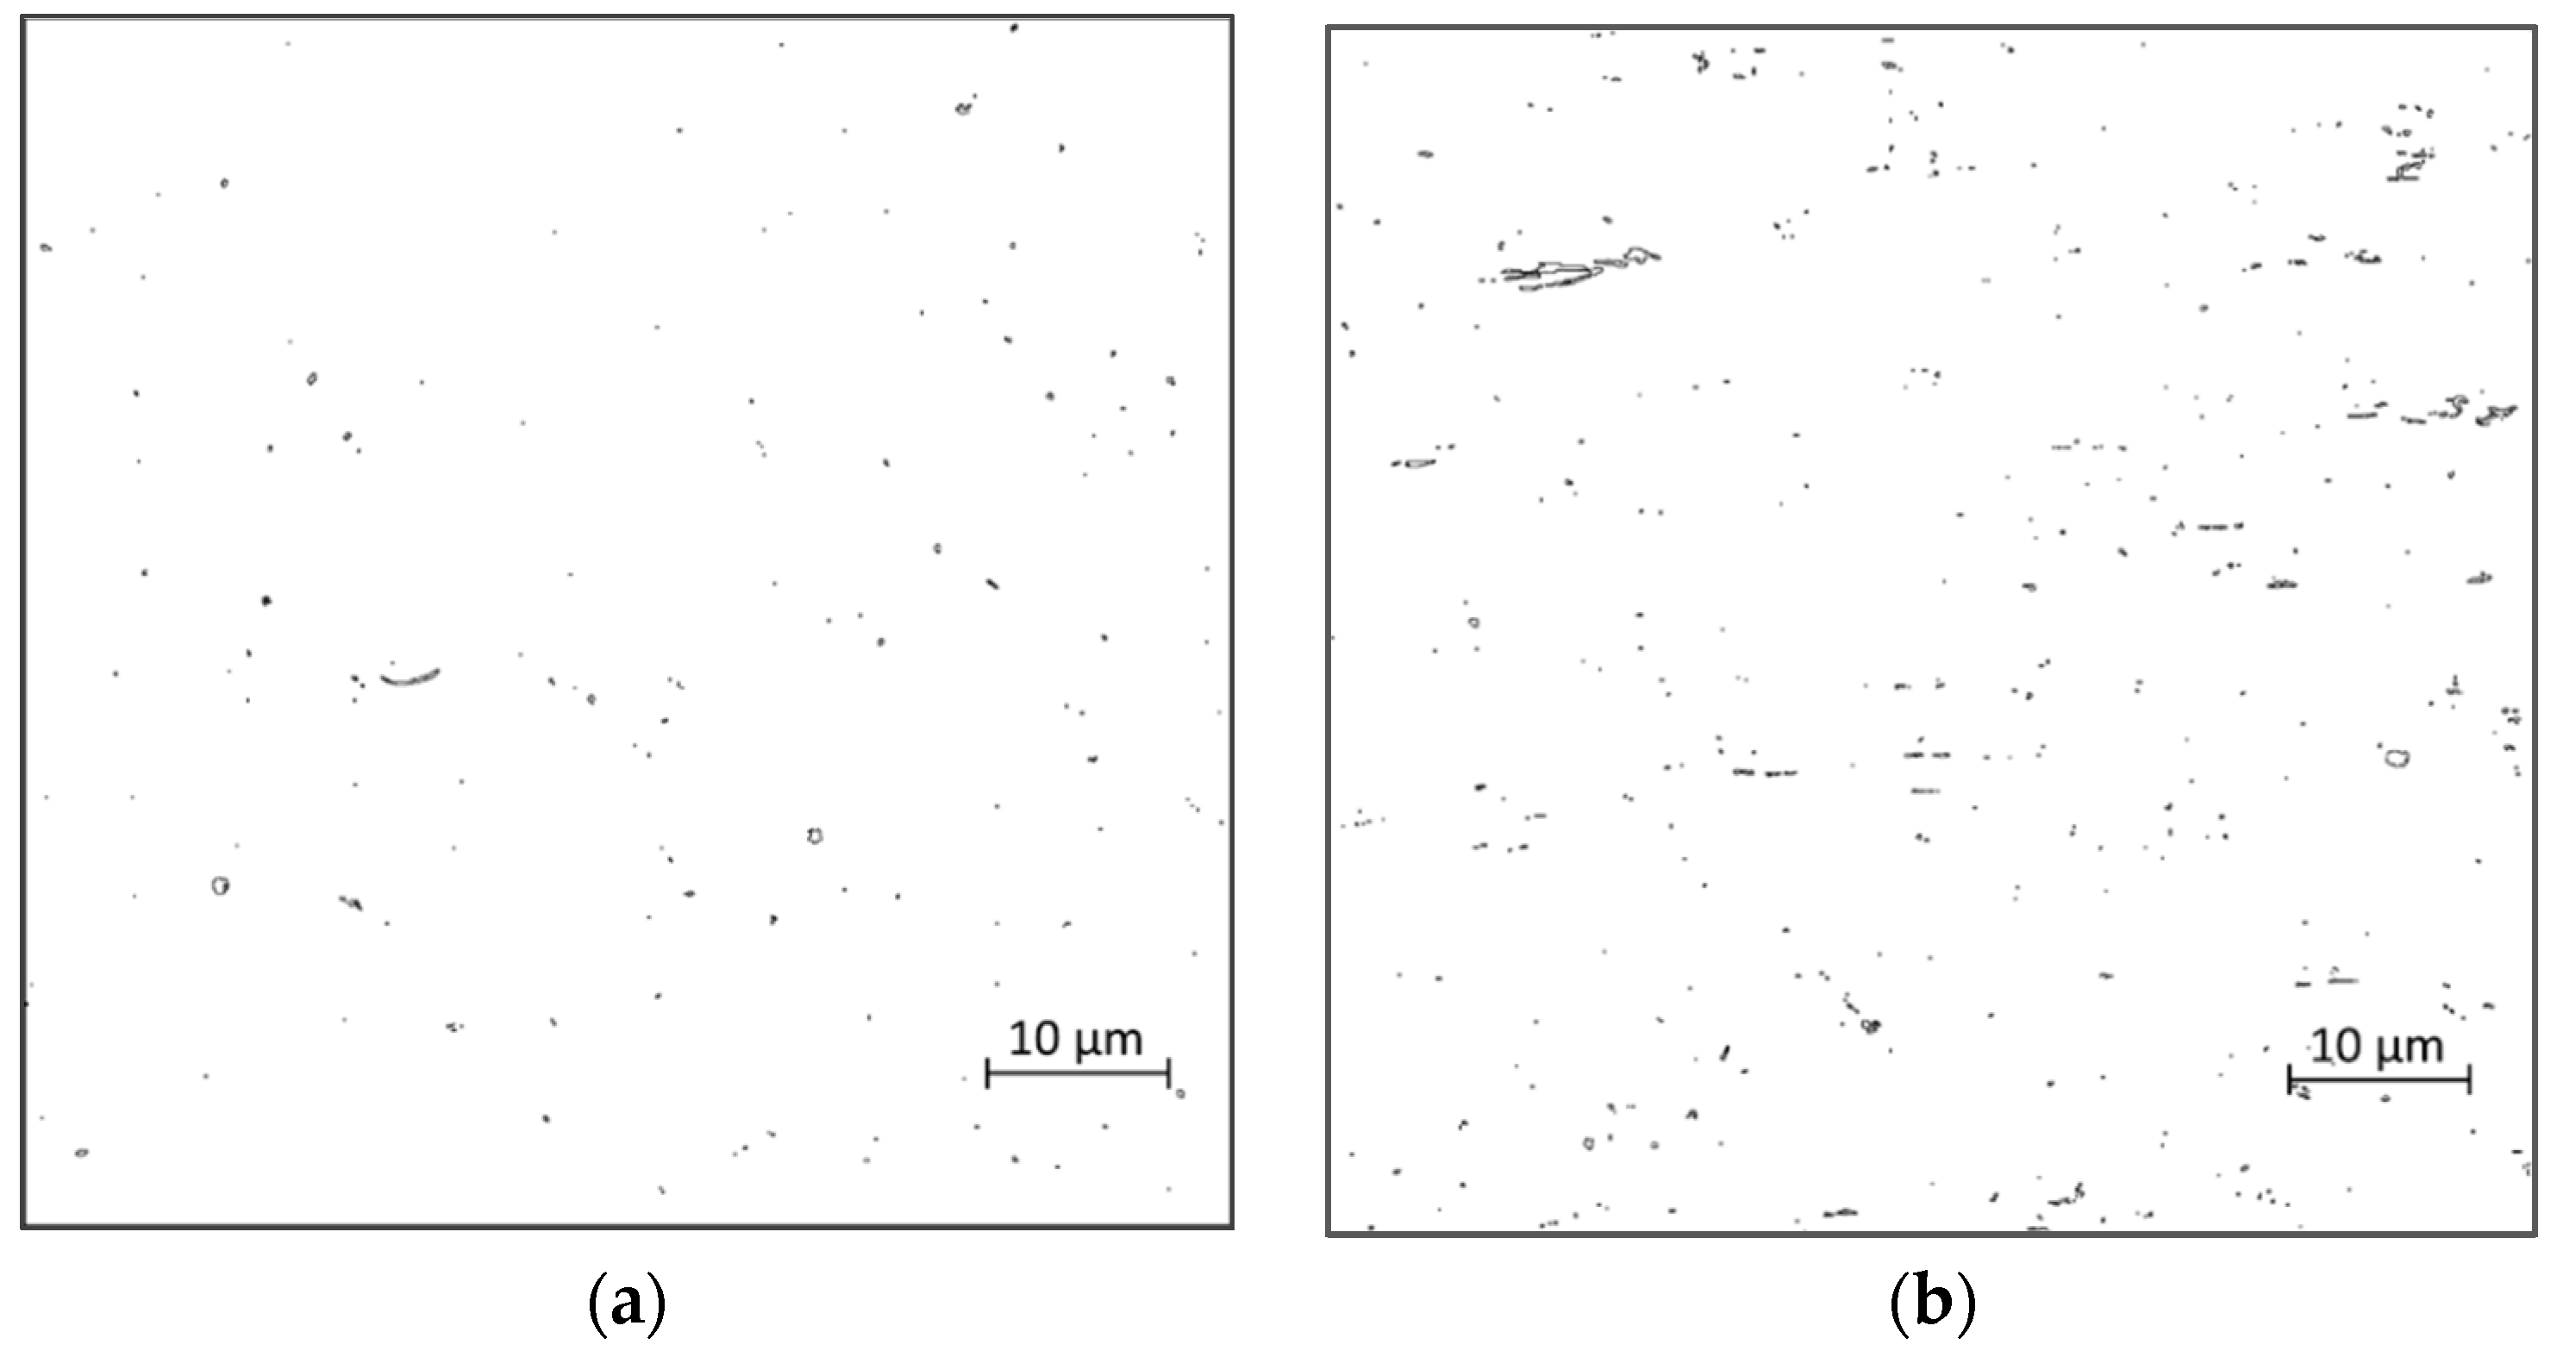
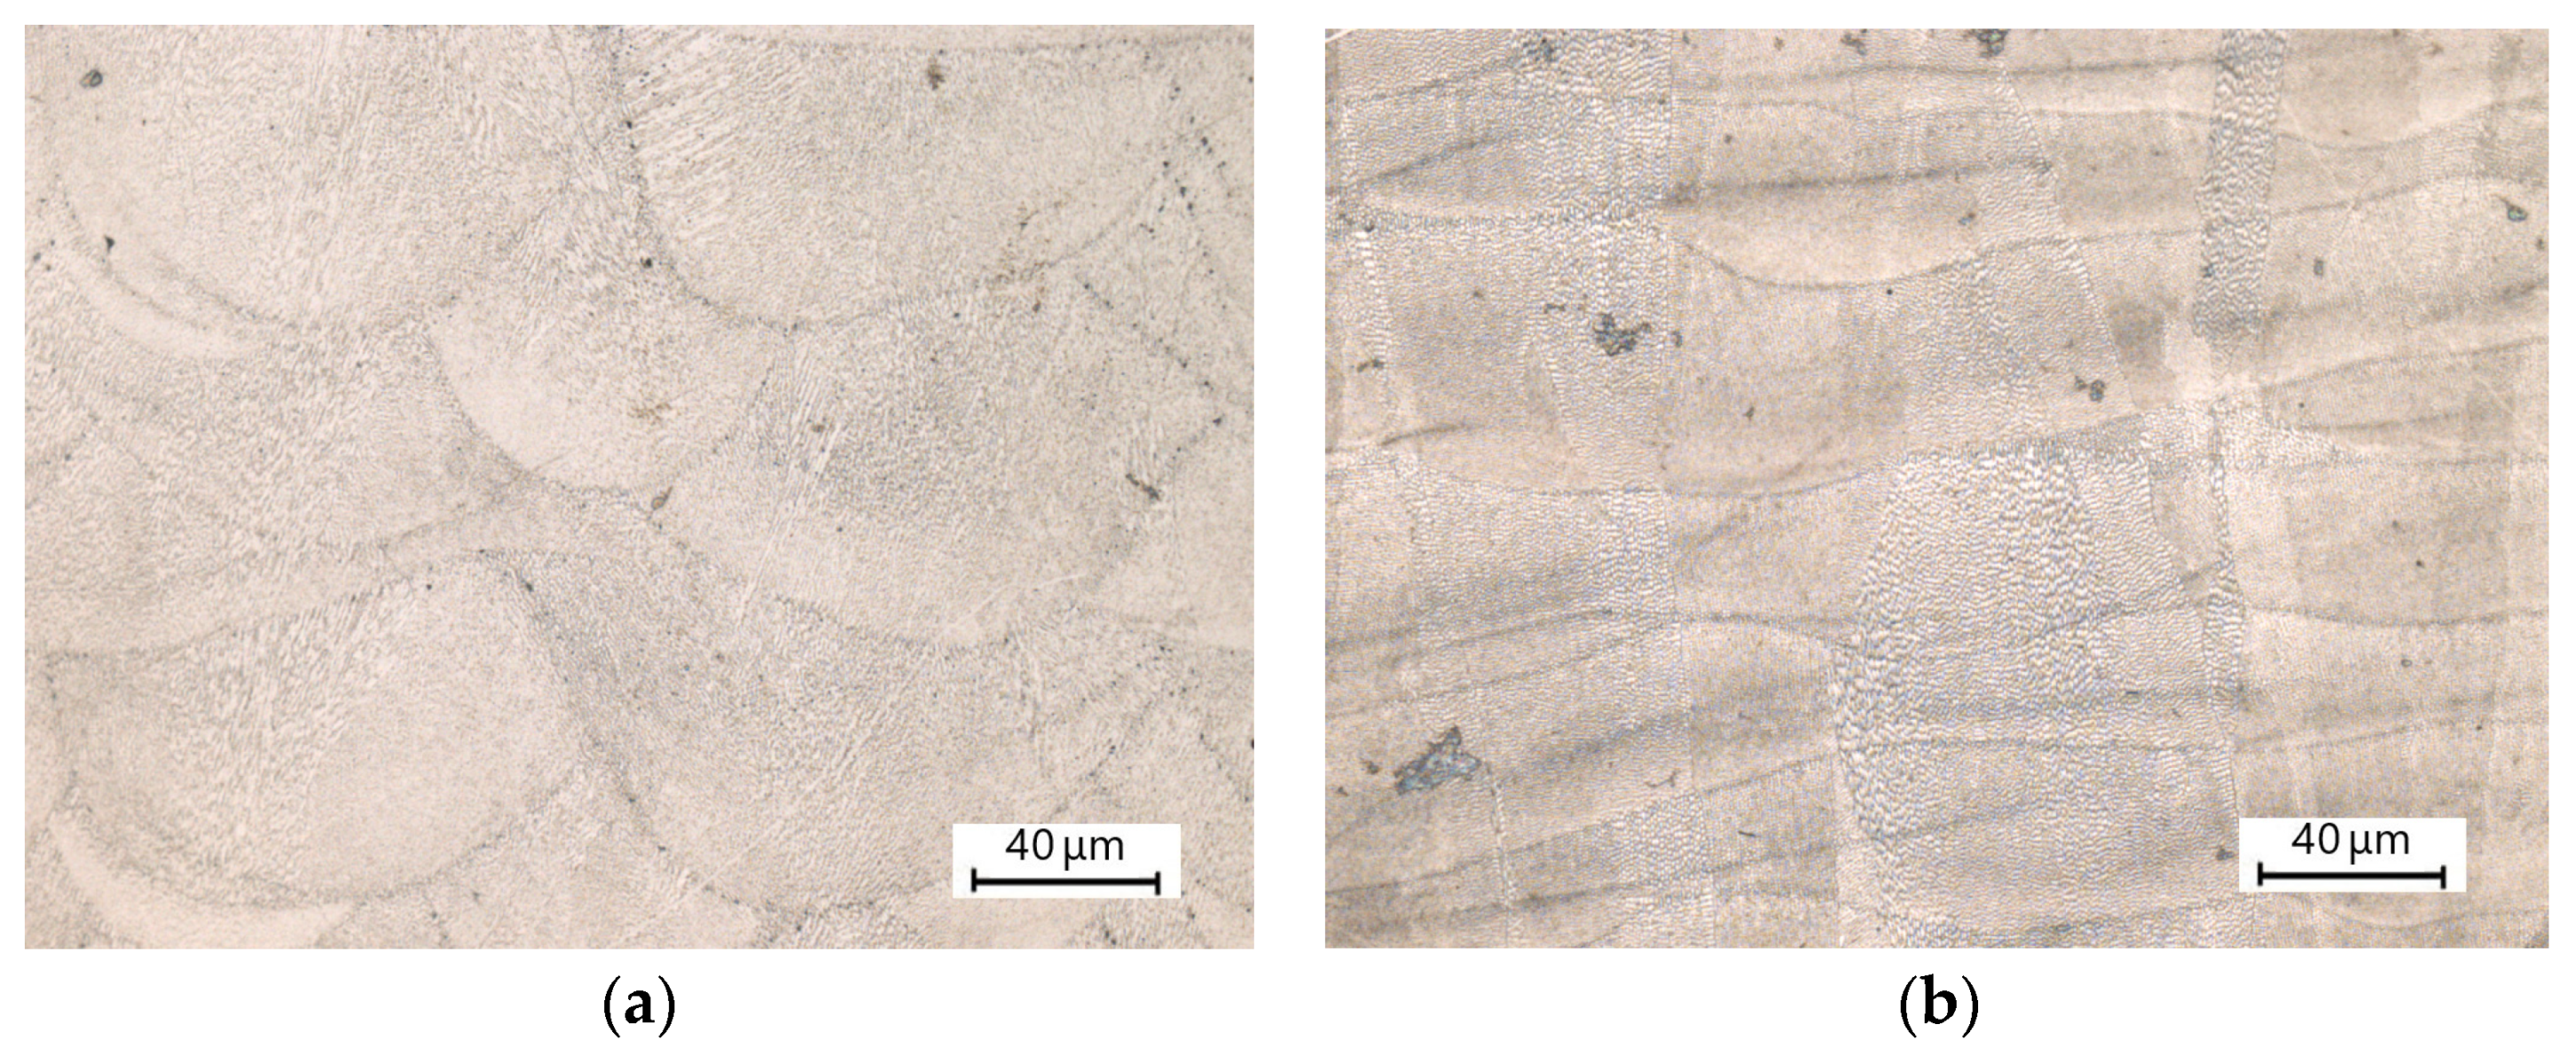
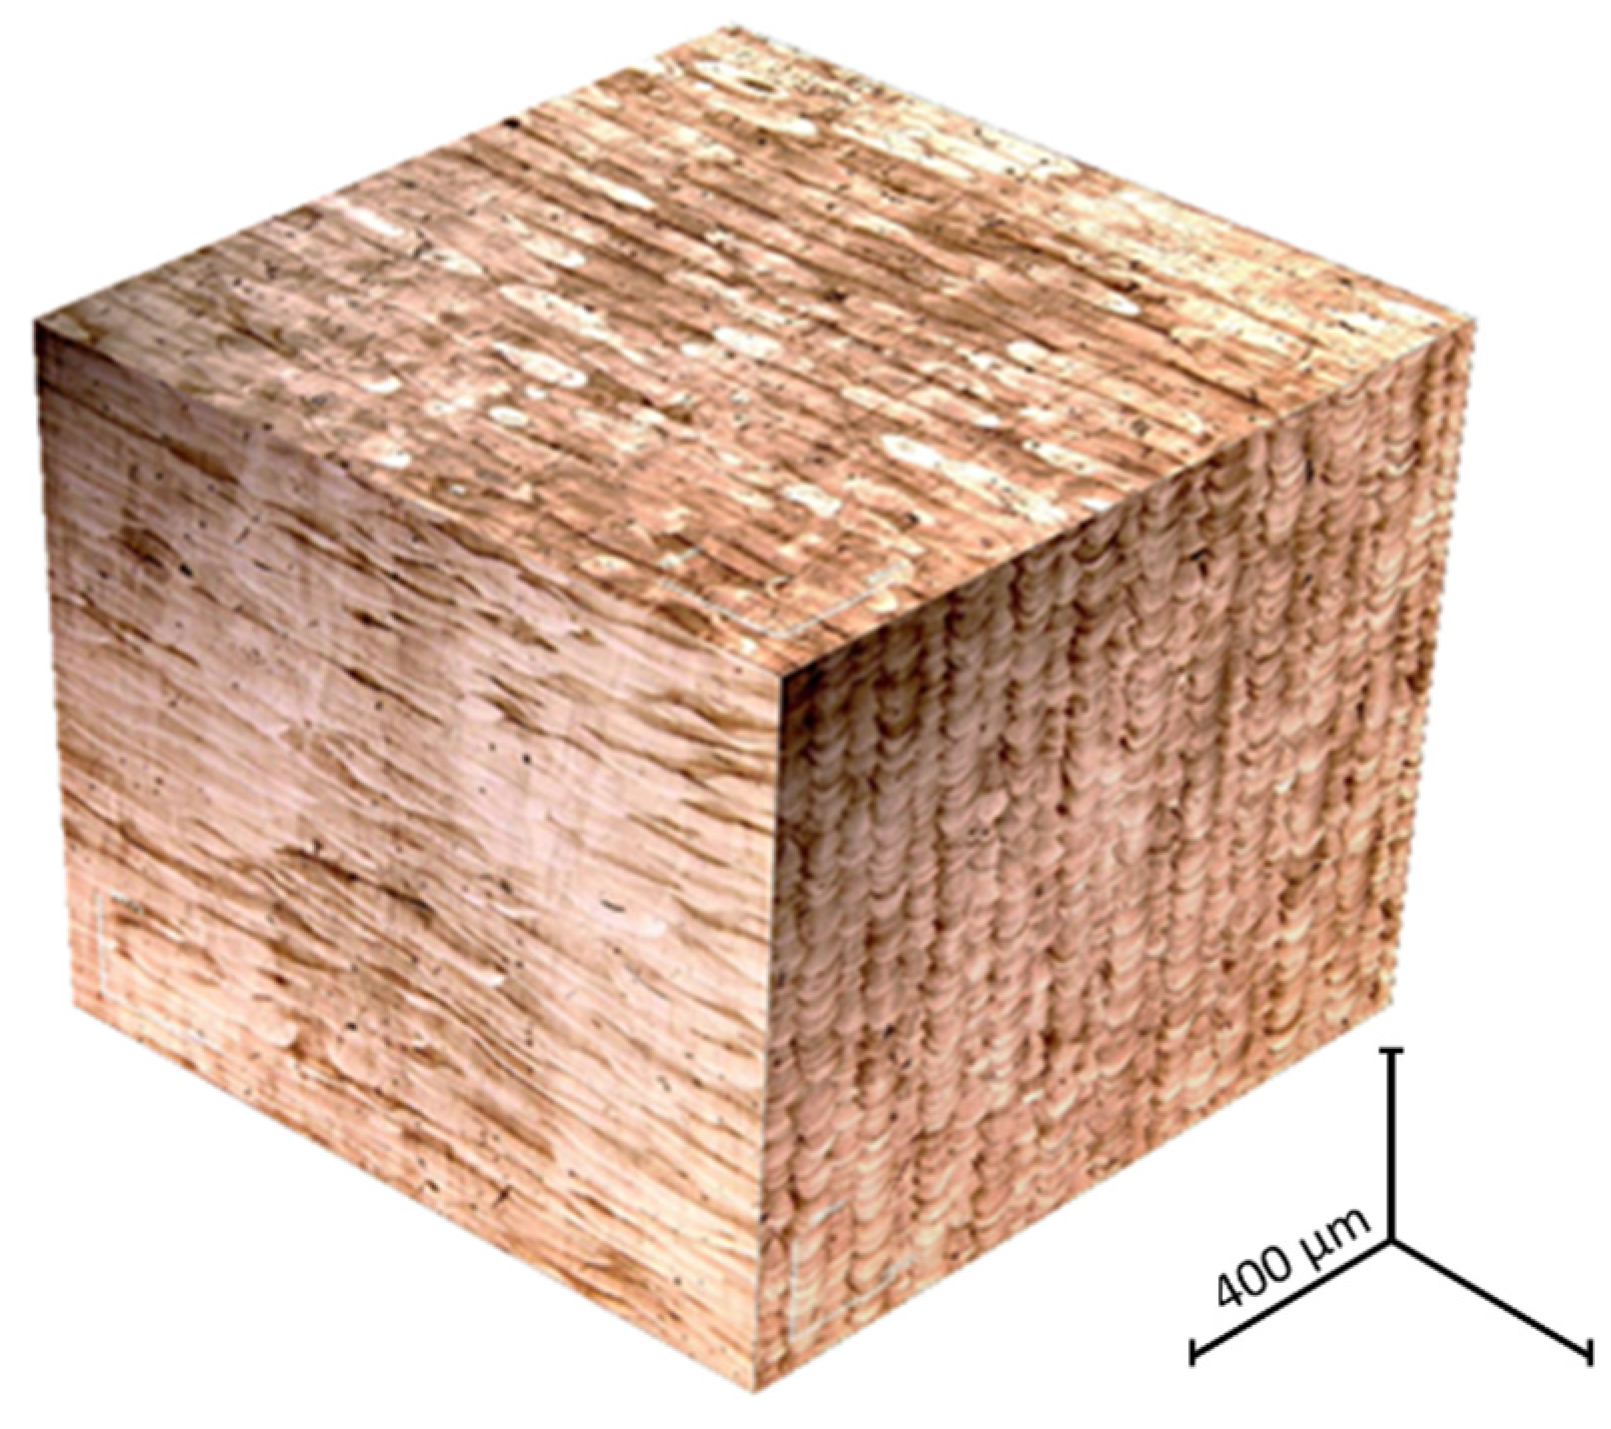
3.4. Porosity and Microstructures
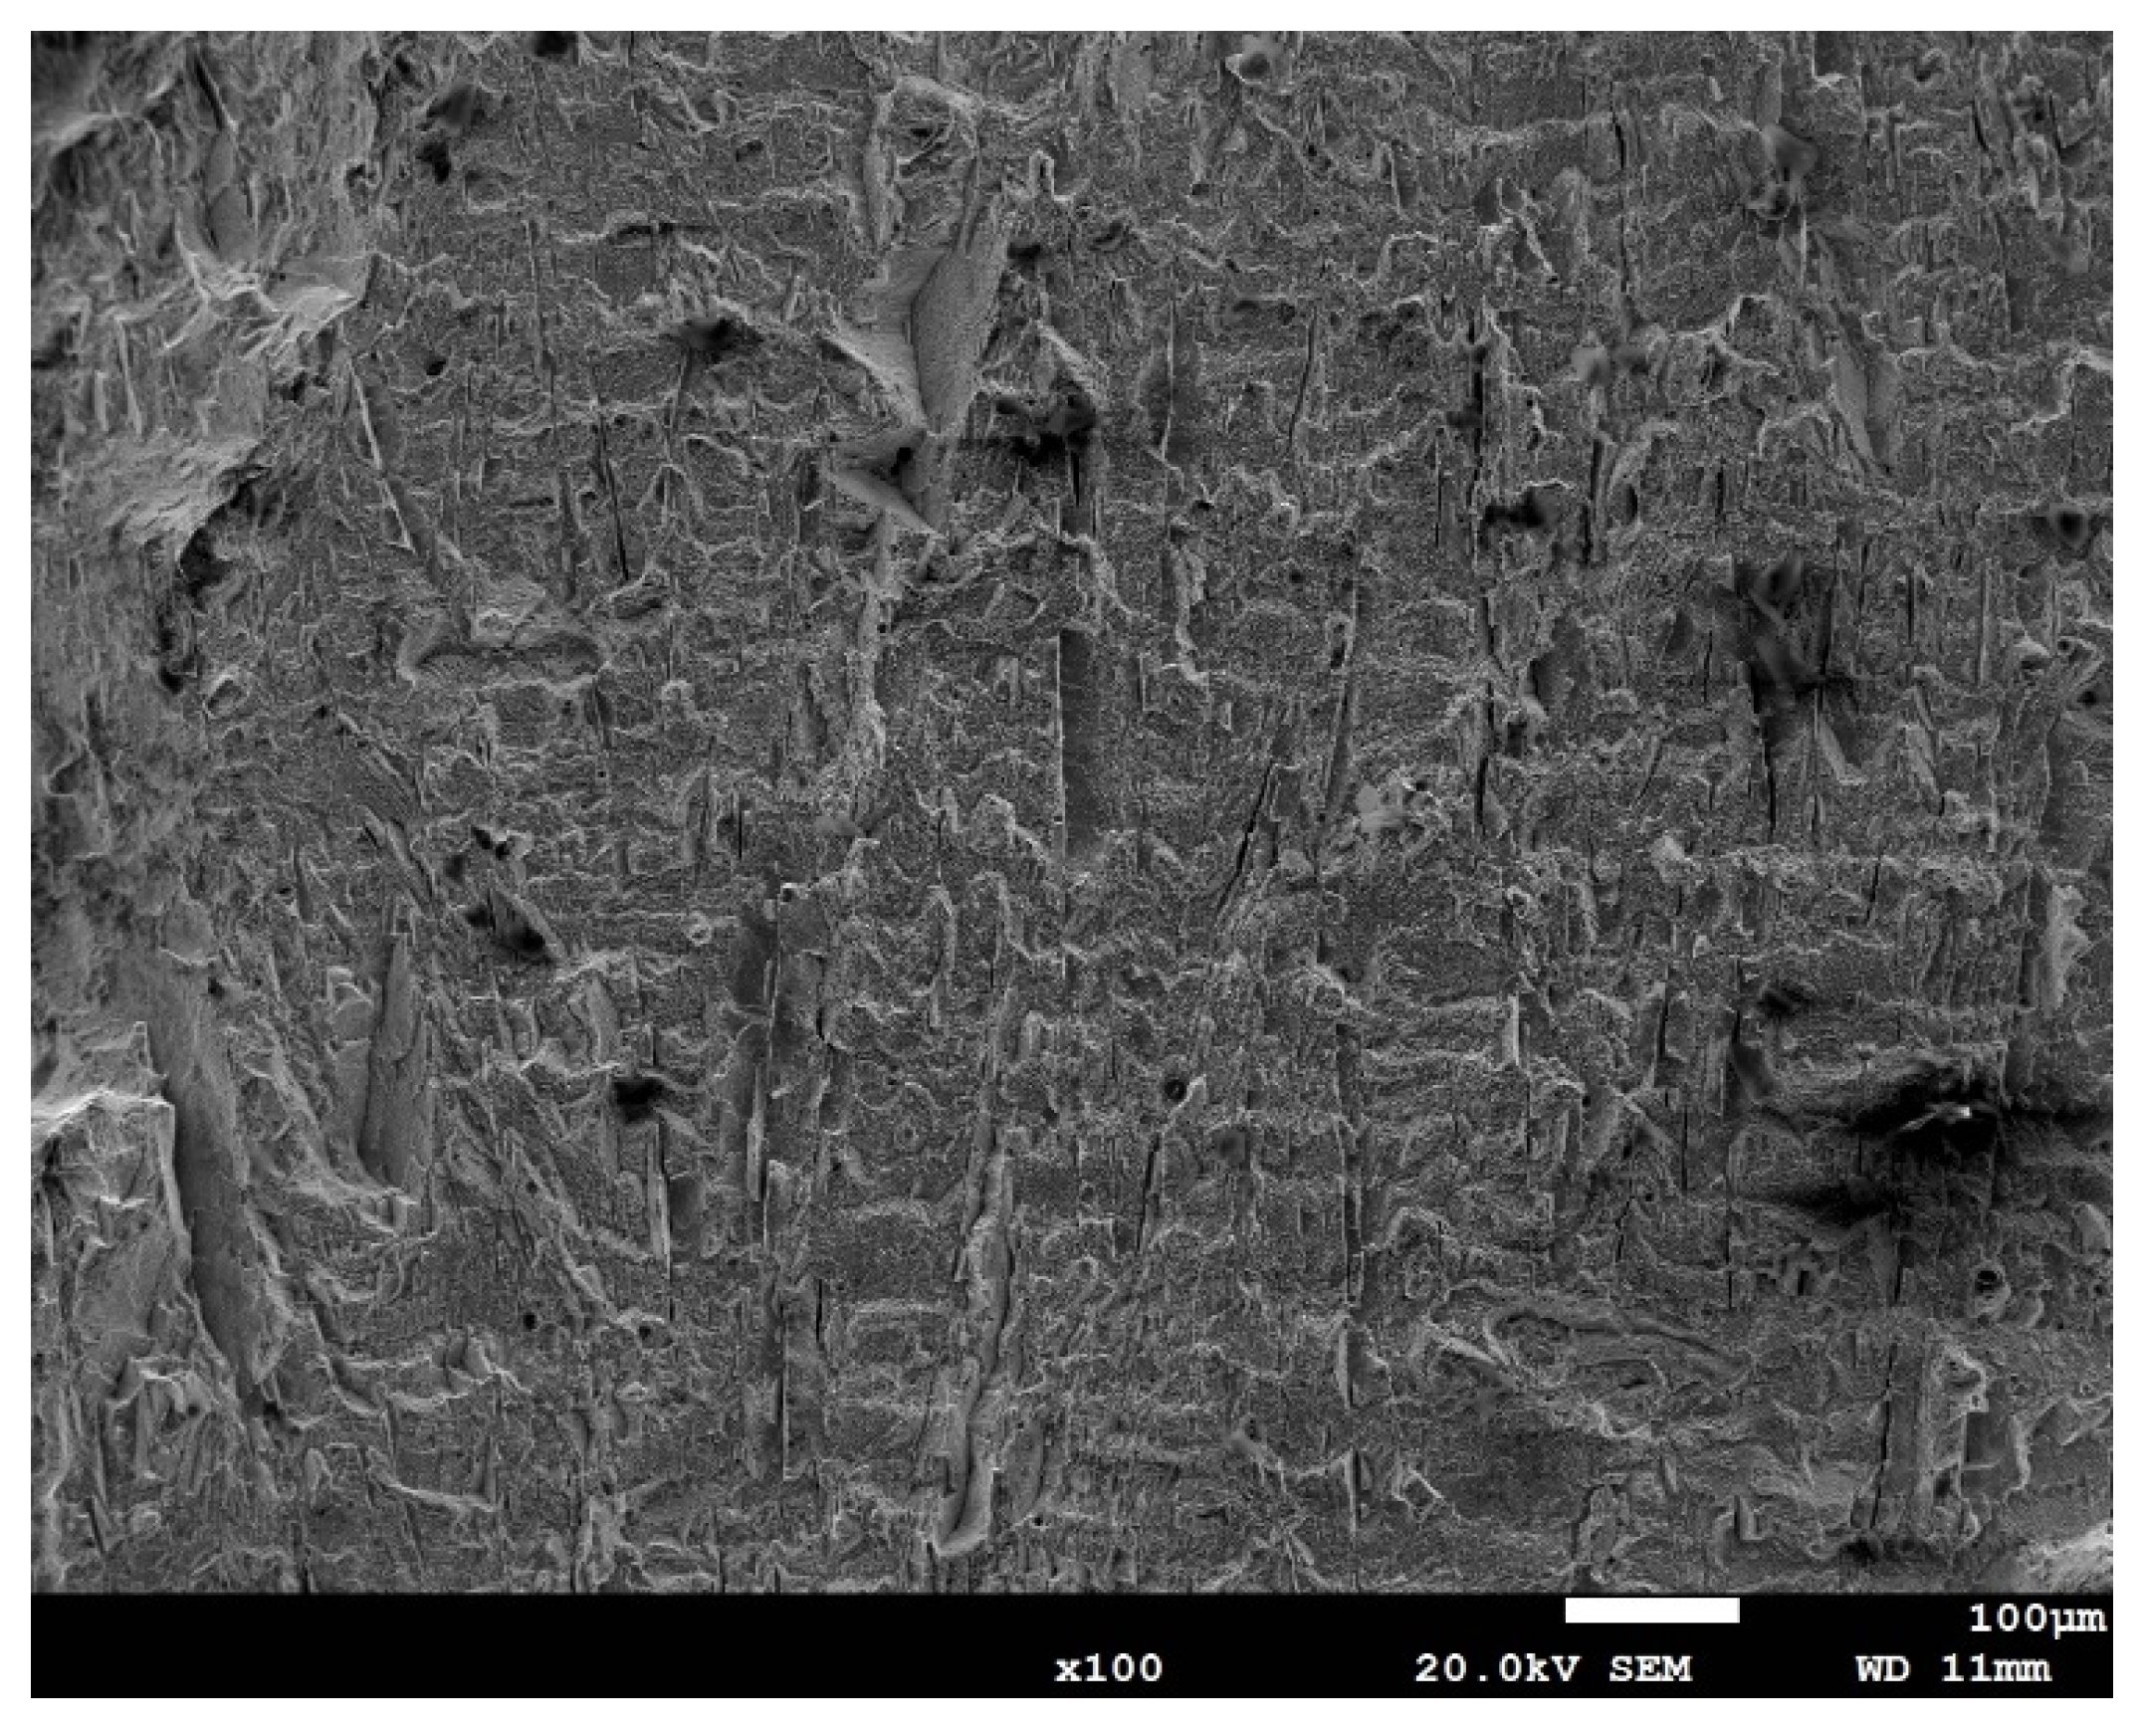
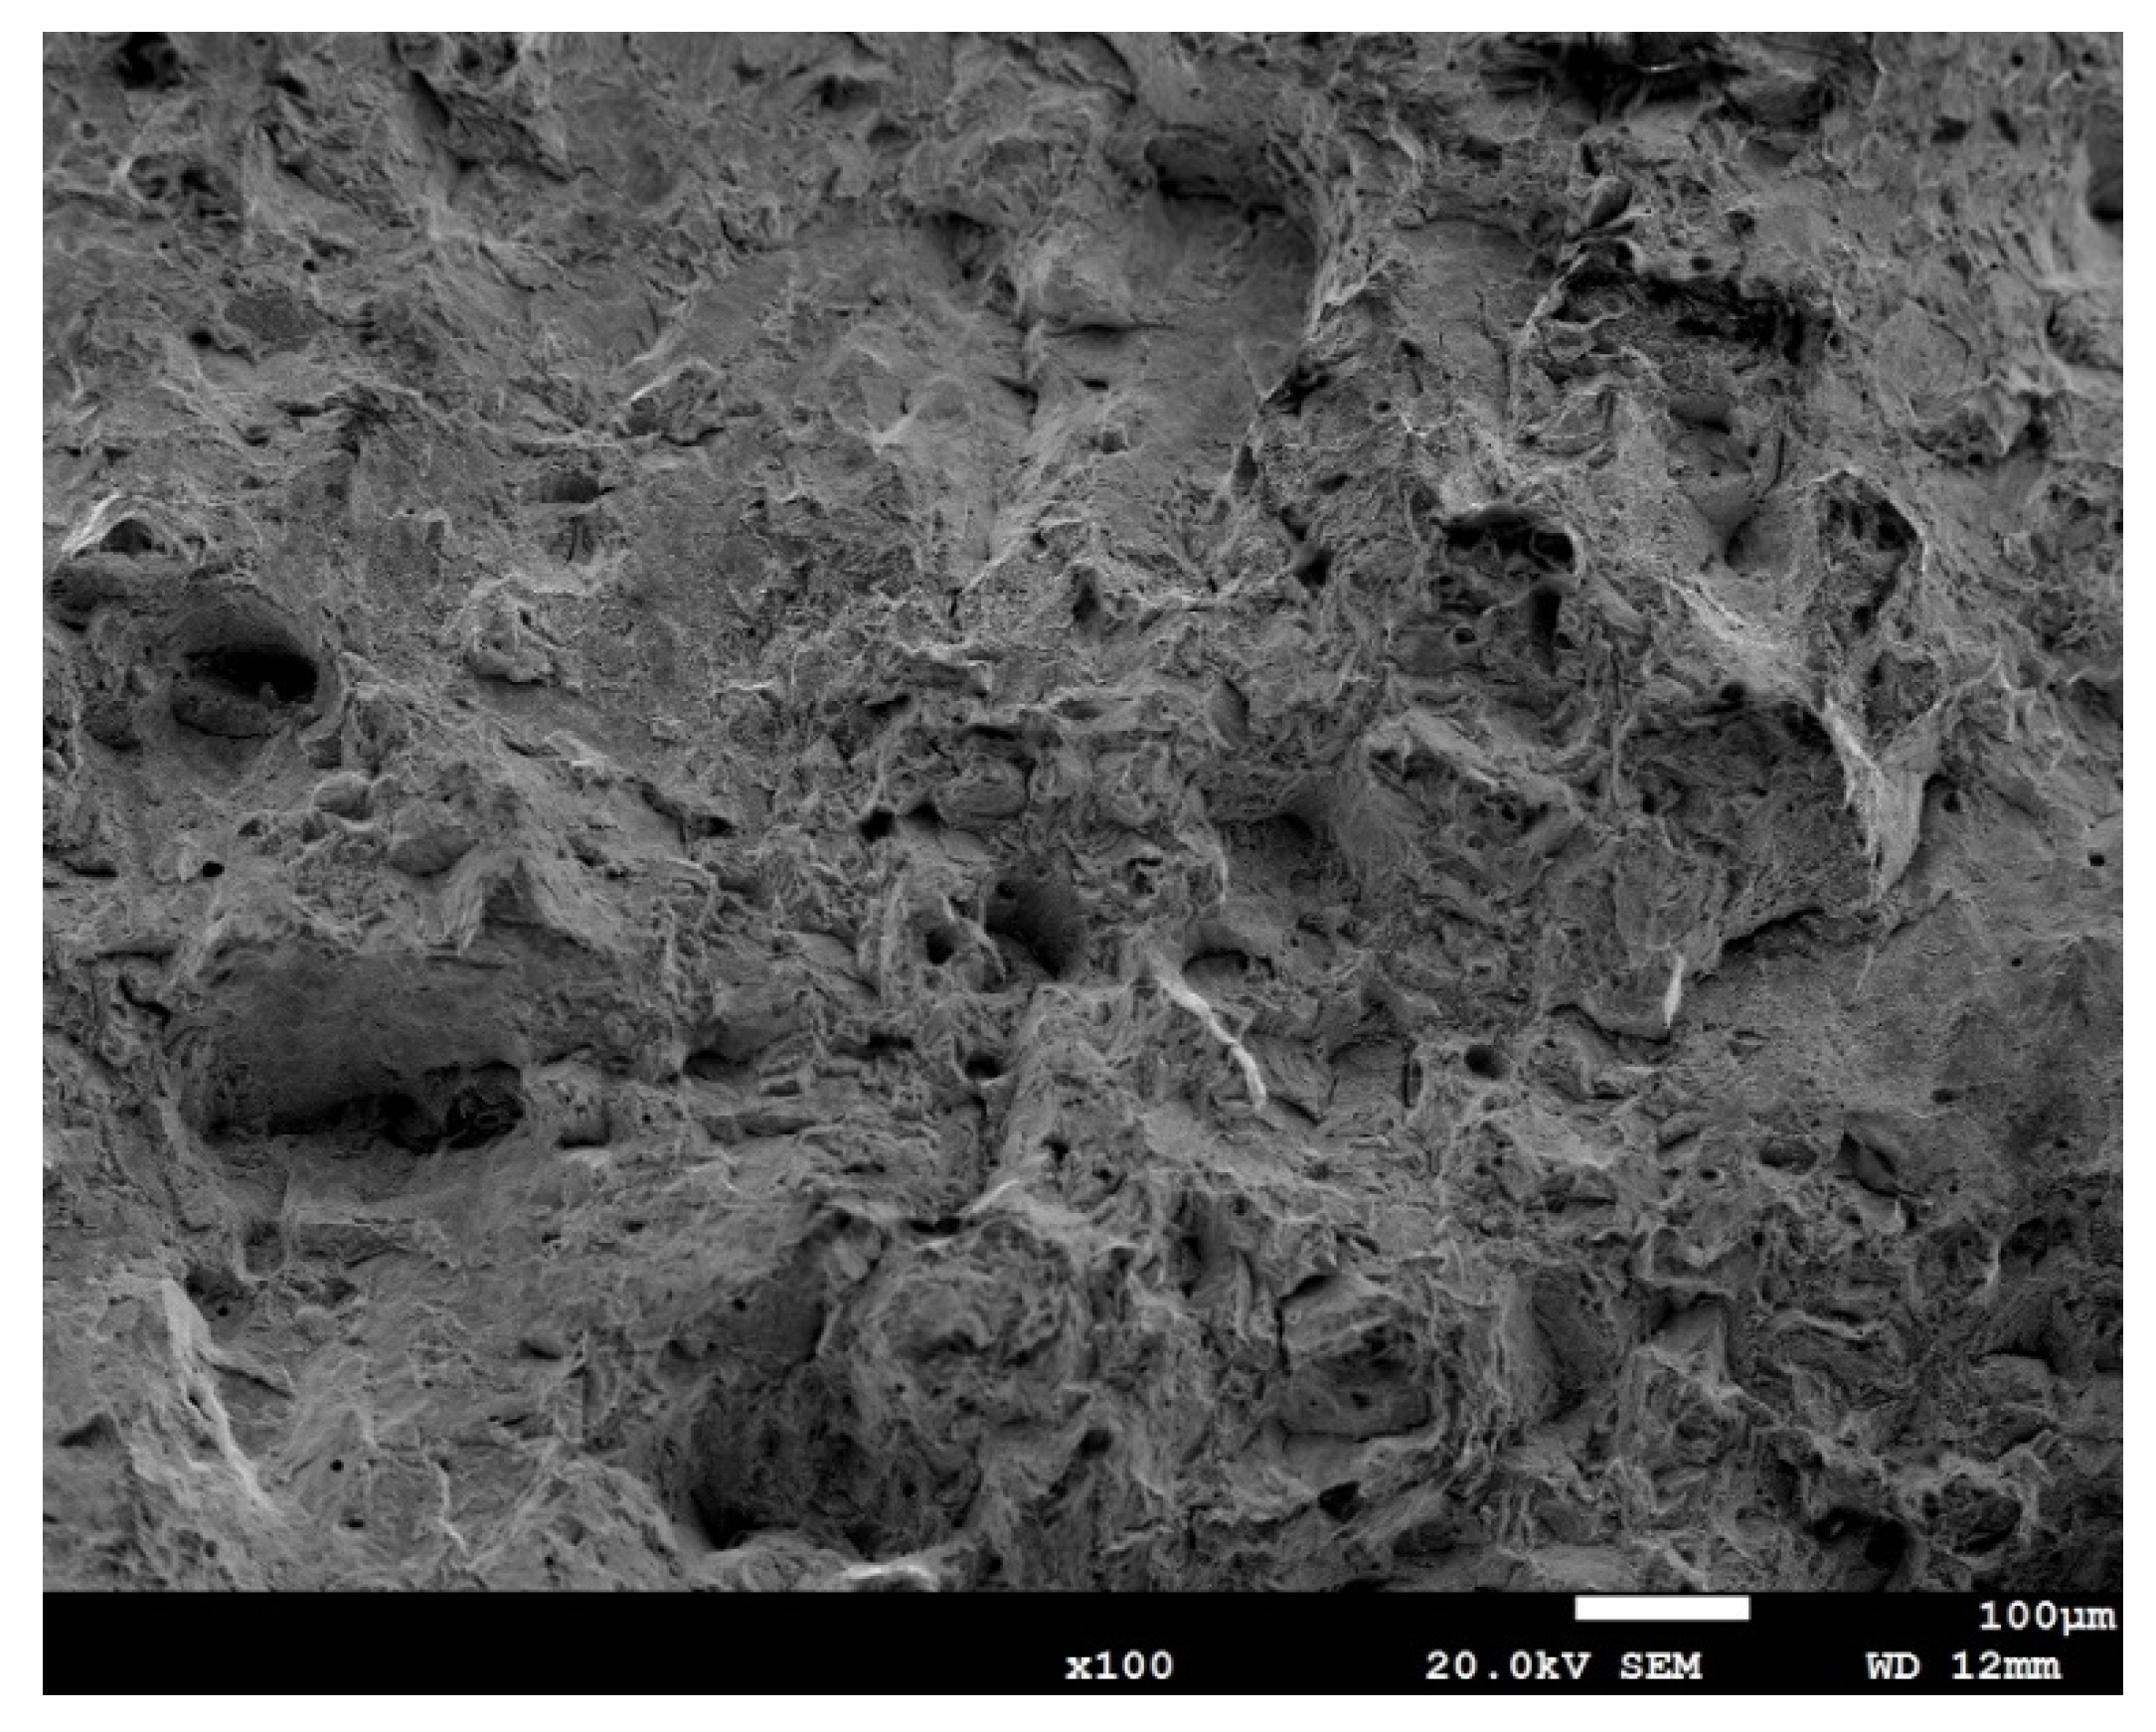
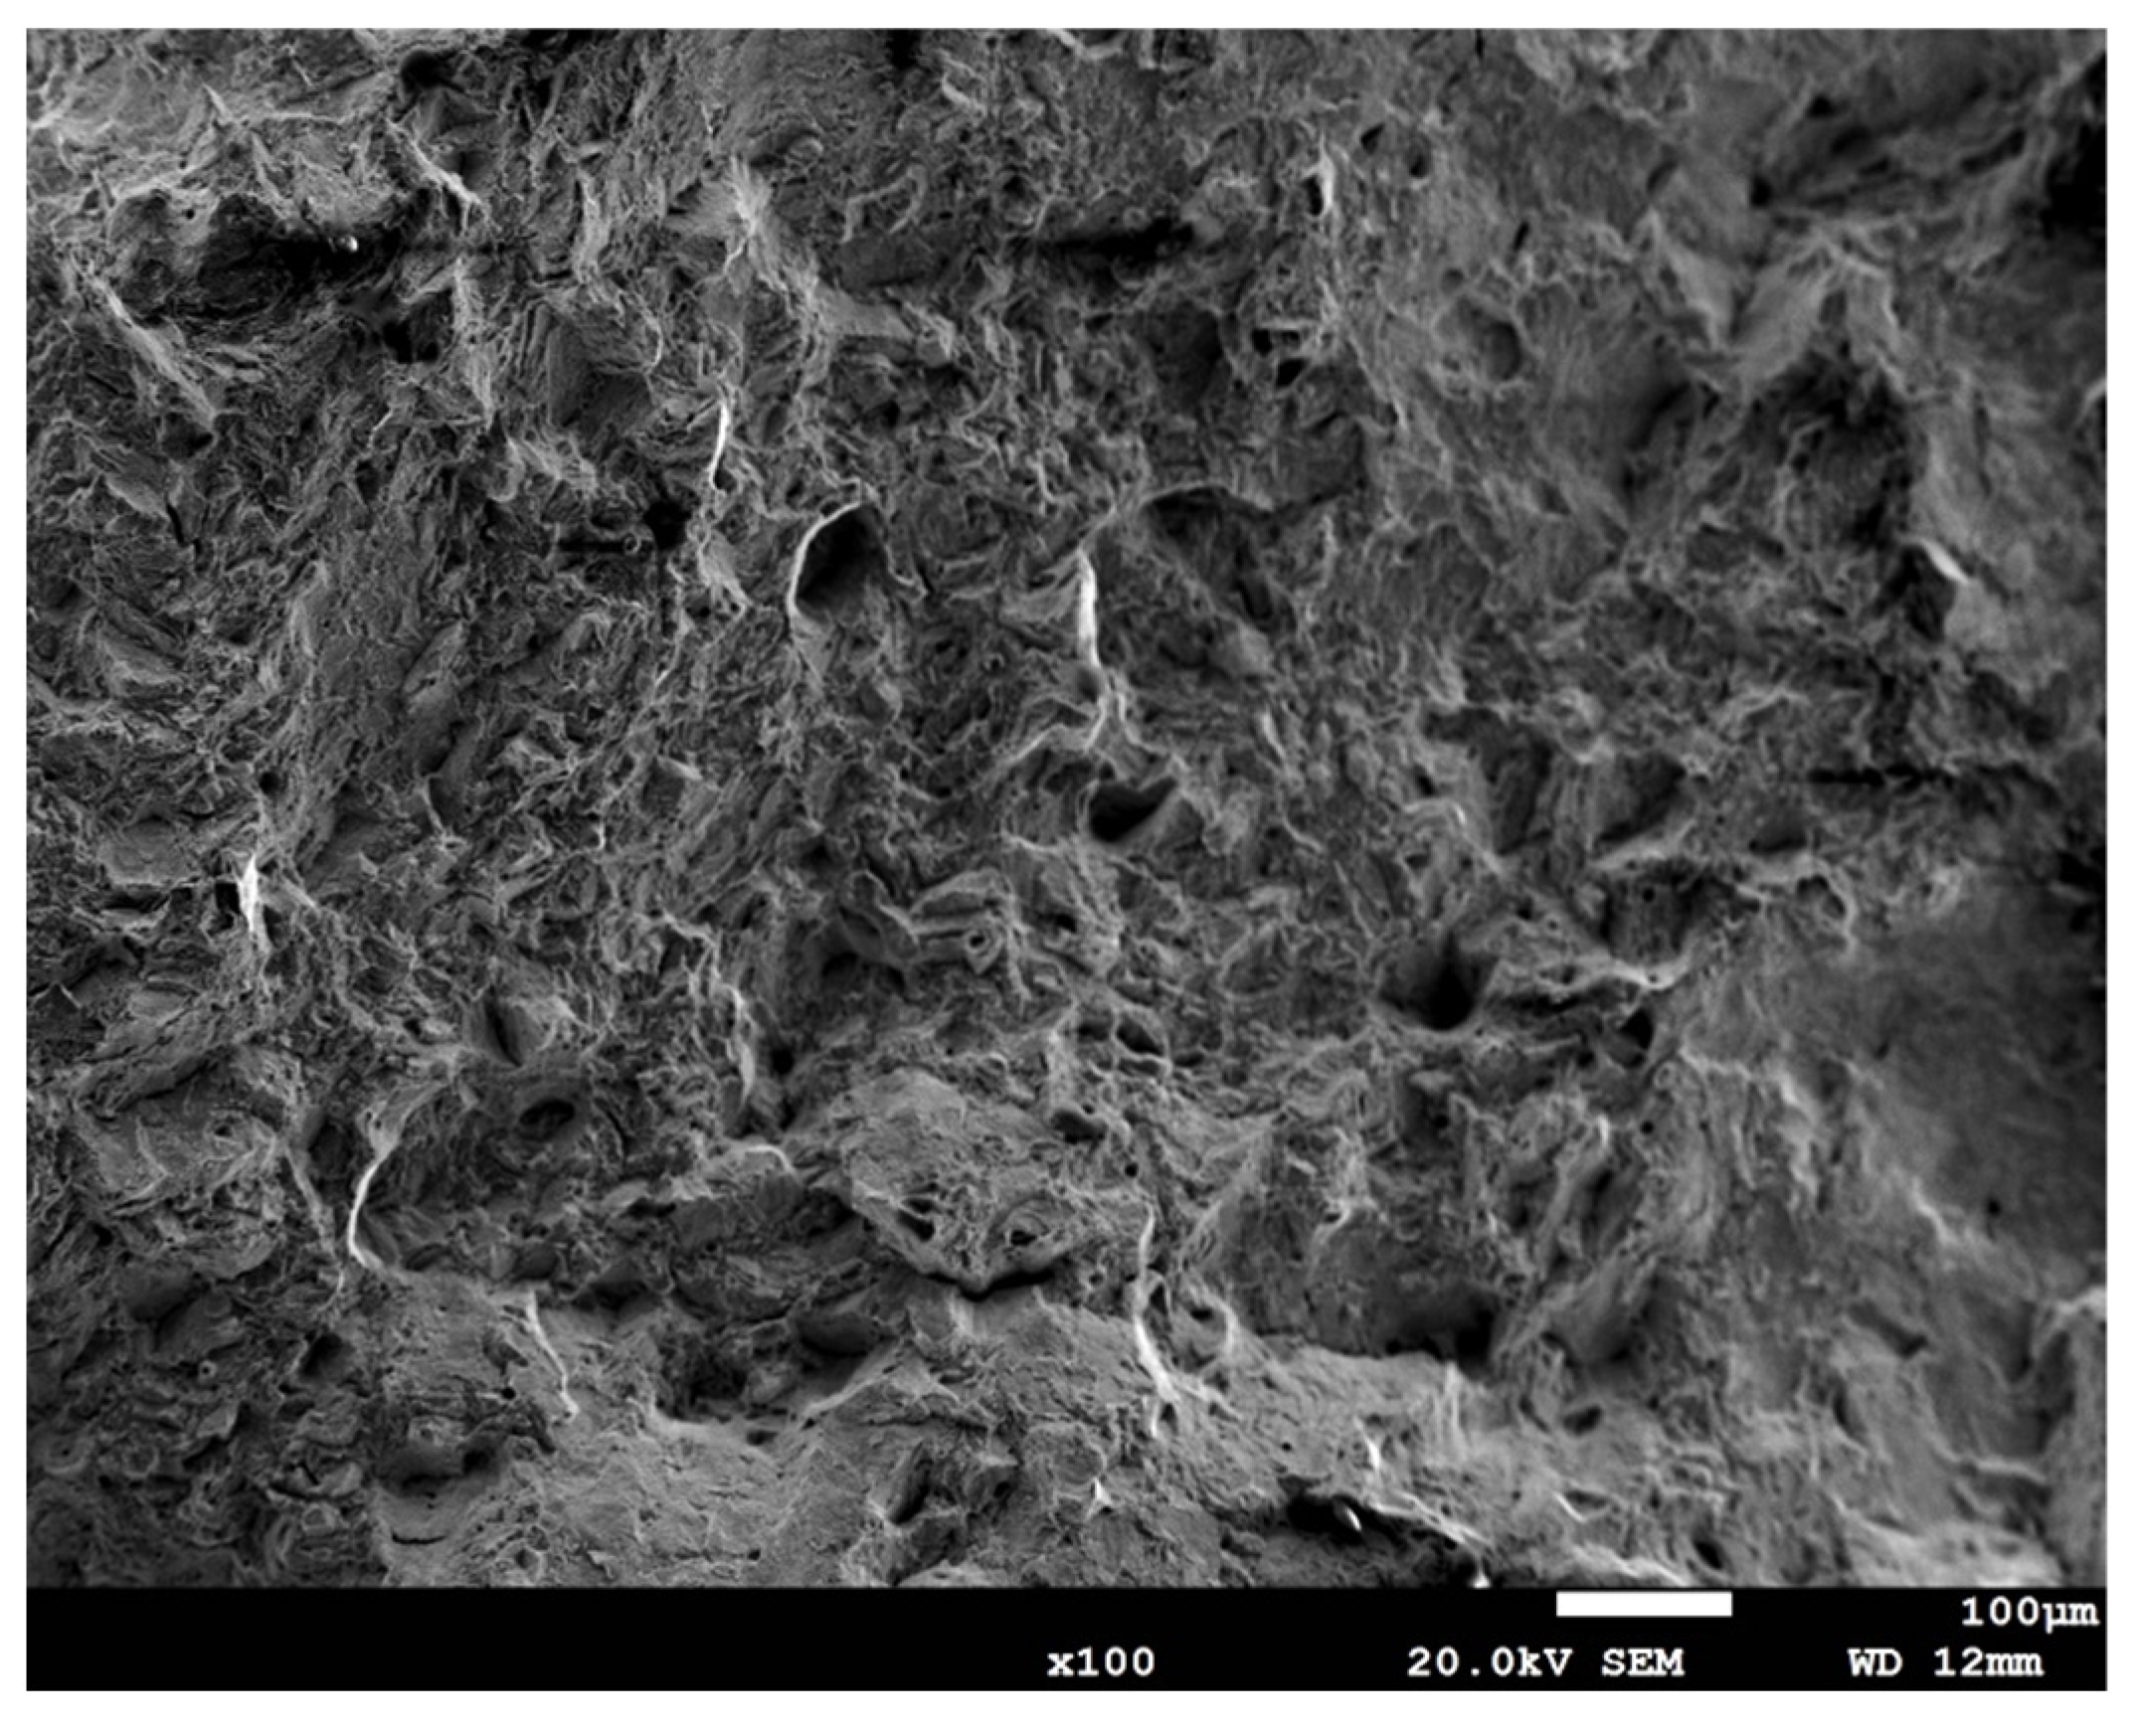
The porosity of a specimen was calculated based on the ratio of the pore area to the total area in a cross section. The porosity of specimen N1 (with the highest impact energy) is 0.137%, compared with 2.115% of specimen N3 (with the lowest impact energy), 0.101% of specimen N5 (with the highest tensile strength), and 0.347% of specimen N7 (with the lowest tensile strength). Figure 7 shows the appearance of pores in specimens N5 and N7, the latter having many large pores and the former having fewer pores. The elongated pore is caused by the partial heat penetration of the current melt pool up to the previously solidified layer [39].
The microstructures of the Inconel 718 alloy can be divided into γ, γ′, γ″, δ, and Laves phases [10], with their amounts indicating the manufacturing process. In addition to these main phases, the needle-shaped delta phase, scattered metal carbide particles [40], and the annular island-shaped Laves phase are also observed in metallography. The appearance of the Laves phase is usually irregular [41] due to the segregation of Nb and other alloy elements.
Figure 8 shows the metallographs of specimens N5 and N7. The process parameters of specimen N5 are given as follows: laser power of 150 W, scanning speed of 800 mm/s, hatching space of 80 μm, interlayer angle of 45°, and energy density of 78.1 J/mm3. The weld bead structure of specimen N5 overlaps layer by layer [42], as shown in Figure 8a, with each layer having a different melting pool width due to various scanning angles. There is a small amount of dendritic structure [43] formed near the layer boundary in a radial shape along the center of the laser scanning route, as shown in Figure 8a.
Figure 8b shows the metallographs of specimen N7, whose process parameters include laser power of 160 W, scanning speed of 900 mm/s, hatching space of 80 μm, interlayer angle of 0°, and energy density of 74.1 J/mm3. There is also an obvious weld bead structure. However, due to 0° scanning printing, there appears a long horizontal strip with a small number of pores. The microstructure in the form of a cell or lattice is unevenly distributed throughout the cross section and is judged to be the result of heat accumulation caused by a fixed scanning angle.
Microstructures with higher magnification (10,000) were observed with SEM, as shown in Figure 9. Specimens N5 and N7 have a similar processing volume energy density. However, the precipitation structure of specimen N5 is irregular, while that of specimen N7 is cellular with a fixed growth direction, as the latter adopts a higher scanning speed and higher energy in printing than the former, resulting in a higher cooling rate and insufficient holding time of the temperature. The larger cellular structure, shown in the middle of Figure 9b, is located at the layer boundary of specimen N7 due to heat accumulation caused by a fixed scanning angle. The precipitates in Figure 9 are put in the Laves phase, since most precipitates in Inconel 718 before heat treatment belong to the phase [41], which is detrimental to the mechanical properties of the Inconel 718 alloy. Due to excessive precipitates and higher porosity, specimen N7 has a weaker tensile strength.
Figure 10 shows the 3D metallographs of the optimal specimen obtained from three orthogonal planes. The upper surface of the 3D metallography is perpendicular to the build direction. It can be observed that each layer is stacked in the optimal specimen, and its structure is like a weld bead constantly stacked up to form. In terms of microstructure, the continuous stacking of powders leads to uneven thermal diffusion, resulting in a columnar structure that grows along the direction of powder stacking.

3.5. Fractograph

To study the mechanism of fracture, the fracture surfaces of the tensile specimens were examined with SEM. Figure 11 shows the transgranular characteristics of specimen N7 with the lowest tensile strength. A significant number of secondary cracks were observed possibly due to hot tearing or liquation cracking. Hot tearing is caused by high residual stress from a high cooling rate in processing, while liquation cracking results from the liquation of Laves/particles during manufacturing [44].
The fracture surface of the N5 specimen with a higher tensile strength contains a mixture of the transgranular zone and fibrous and dimple zone (Figure 12). There are regularly distributed deep holes and randomly distributed spherical pores. Figure 13 shows the ductile characteristics of the optimal specimen, whose fracture surface contains more fibrous and dichroism zones than specimen N5. The relatively flat surface is covered with fine dimples, indicating a mode of transgranular ductile failure due to microvoid coalescence [45].

4. Conclusions

Based on the findings, this study concluded that
(1)
The combination of optimal process parameters for tensile strength is laser power of 140 W, scanning speed of 800 mm/s, hatching space of 70 μm, and interlayer angle of 45°, which results in a tensile strength of 1167 MPa. The difference between the predicted and experimental average tensile strength is 1.2%.
(2)
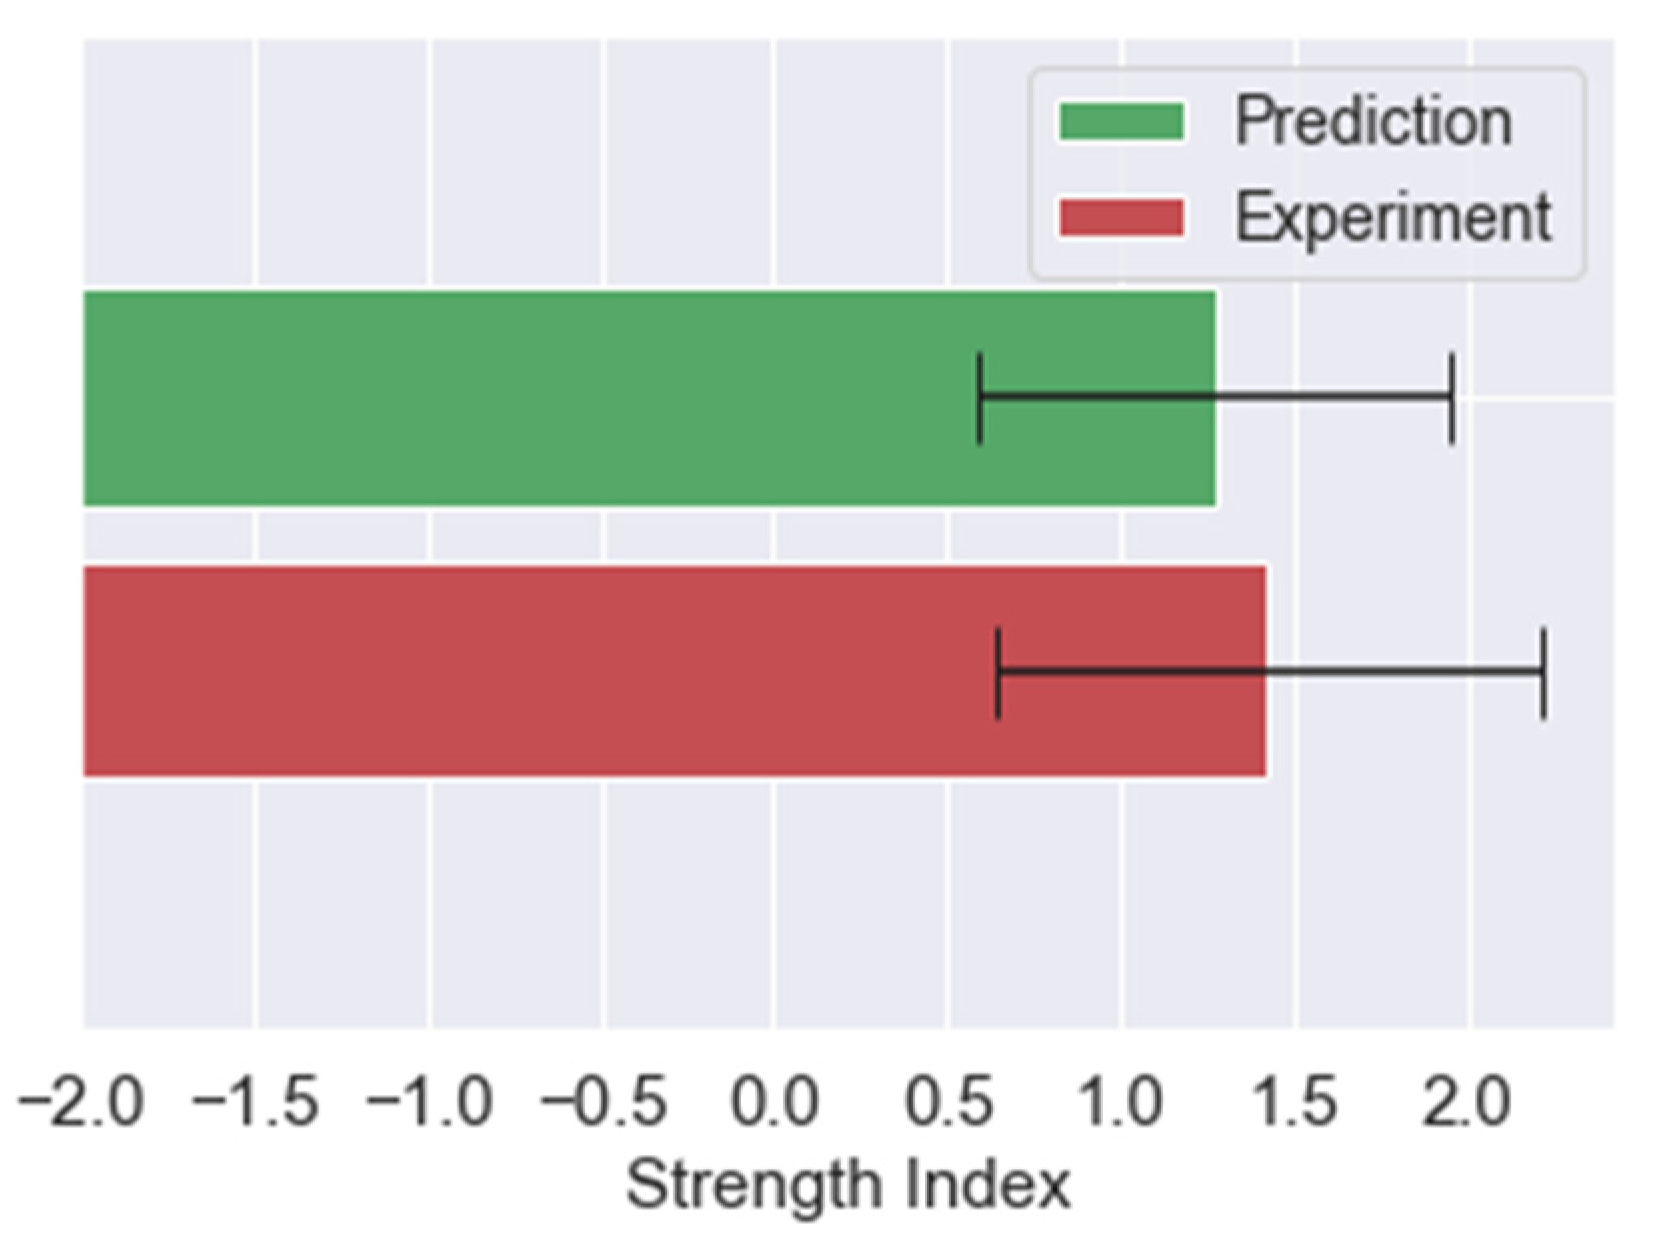
With tensile strength, elongation, impact energy, and hardness as targets in multiobjective optimization analysis, the combination of the optimal process is just the same as that of single-objective optimization with tensile strength as the target. The error of the predicted optimal strength index is 12.6%.
(3)
The most important control factor for tensile strength and multiple responses is the interlayer angle, with a contribution rate exceeding 90%.
(4)
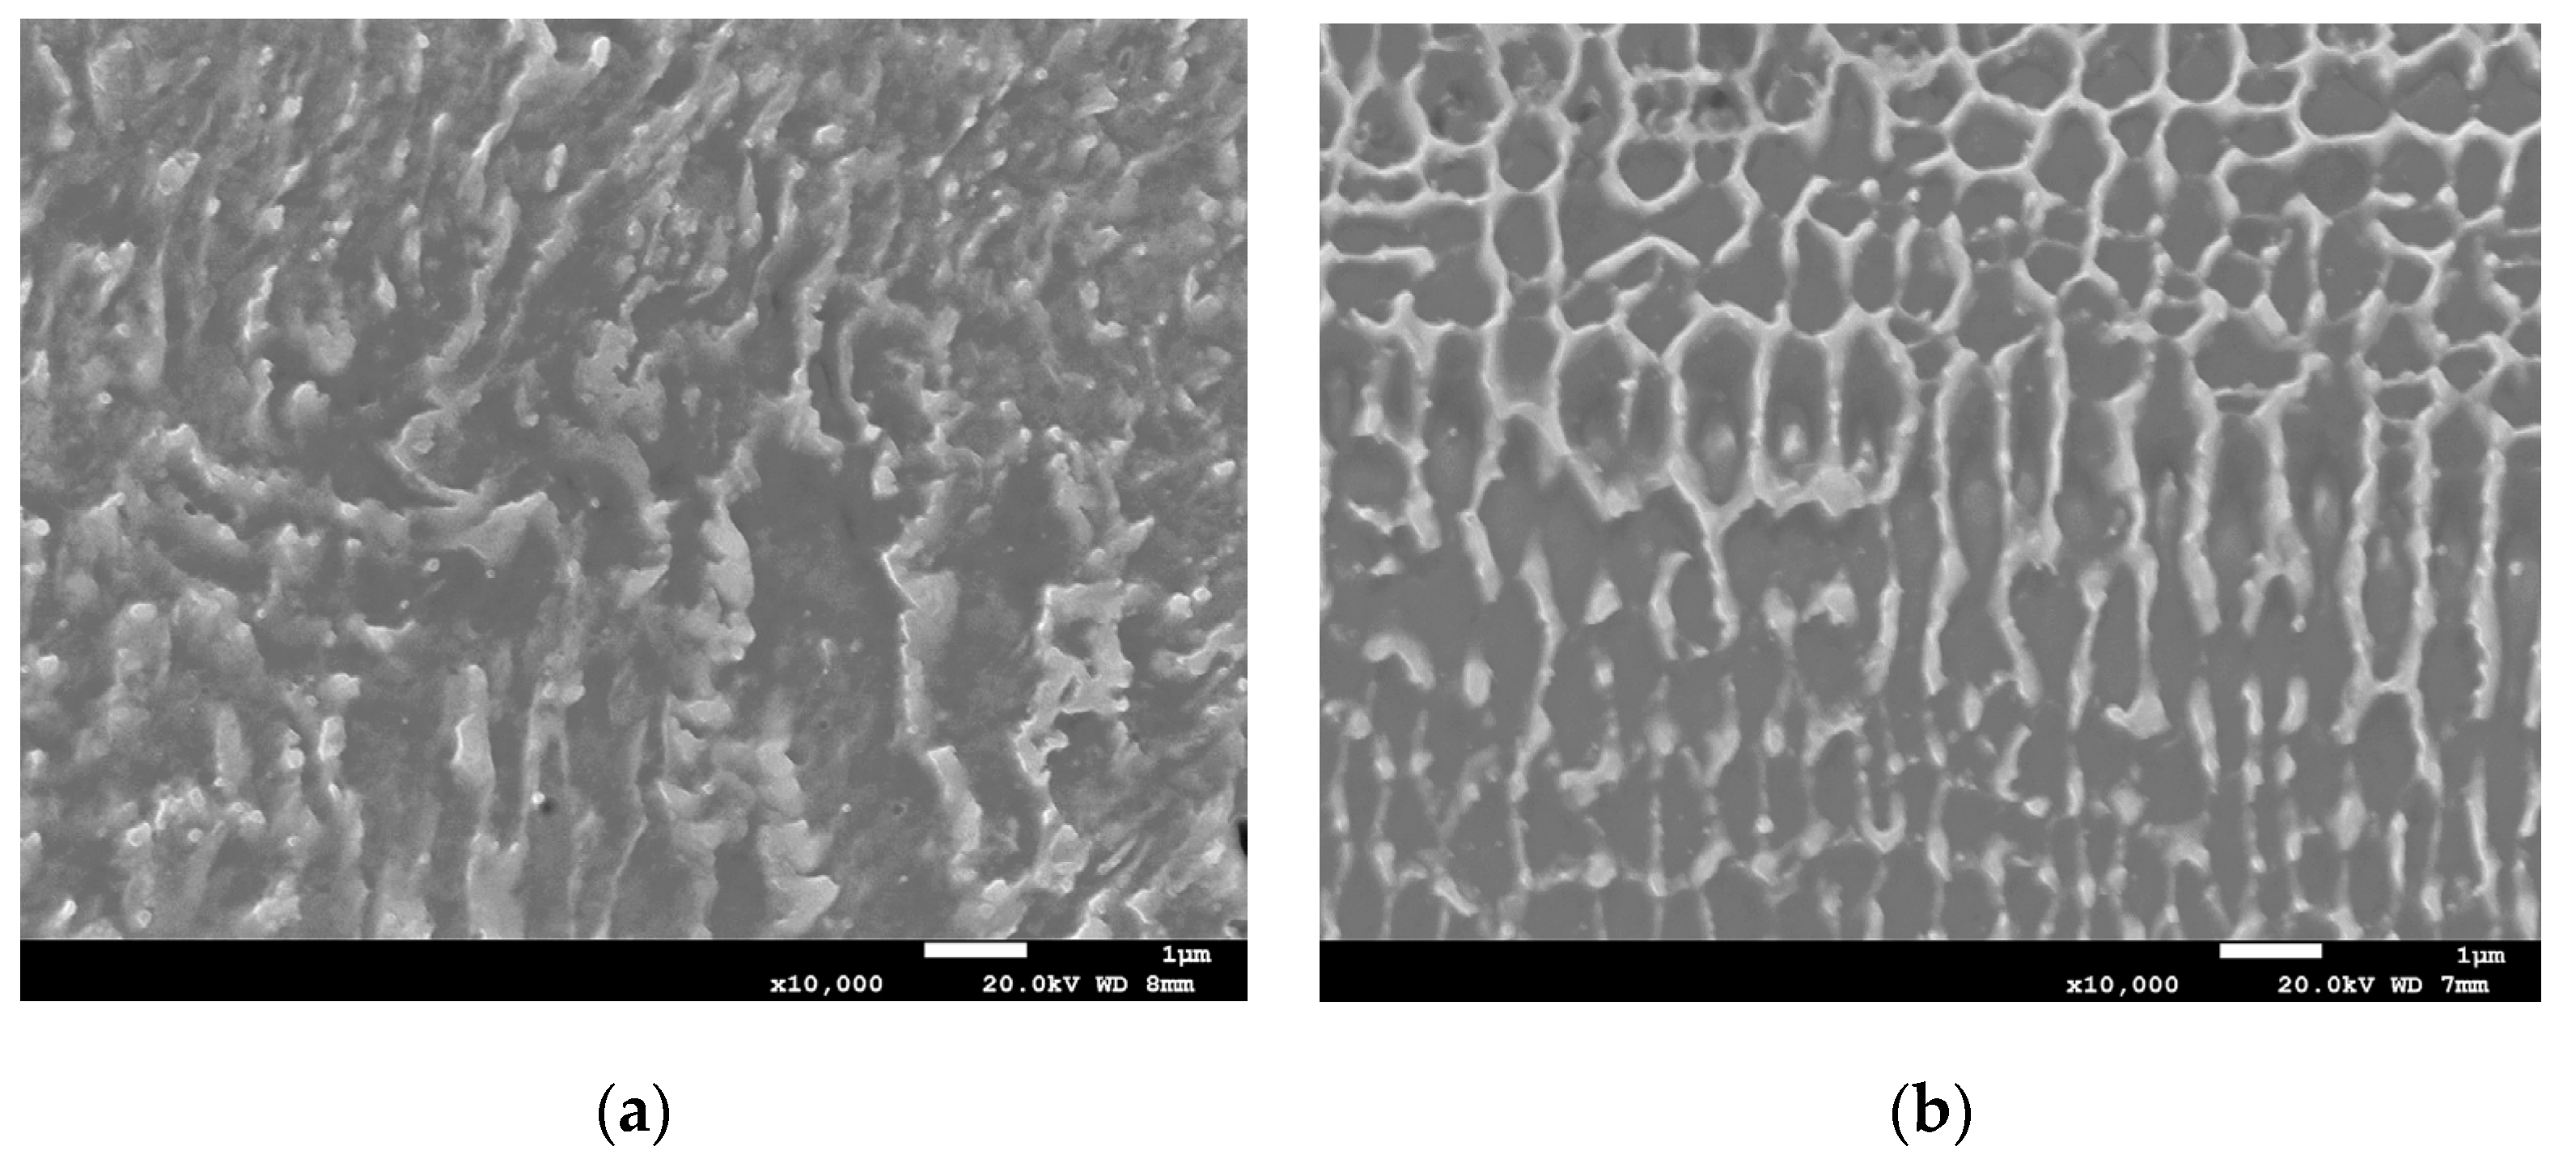
For Laves phase precipitates in an as-built Inconel 718 alloy, when the volume energy density of the LPBF process is similar, the higher the power and scanning speed that overaccumulates energy, the larger the amount of cellular crystals and the lower the tensile strength.
(5)
Both the transgranular cleavage and fibrous and dimple fracture appear in the tensile specimen fractograph. Under the optimal process condition, the fractograph is mainly composed of fibrous and dimple fracture.

Author Contributions

Conceptualization, J.-R.H. and J.-Y.Z.; methodology, J.-R.H. and J.-Y.Z.; software, C.-D.H.; validation, C.-D.H.; investigation, P.-C.K. and C.-P.F.; resources, J.-R.H.; data curation, J.-Y.Z.; writing—original draft preparation, J.-Y.Z. and P.-C.K.; writing—review and editing, J.-R.H. and C.-P.F.; supervision, J.-R.H. All authors have read and agreed to the published version of the manuscript.

Funding

This study was funded by the Ministry of Science and Technology, R.O.C. under contract no. MOST 108-2221-E-008-098.

Data Availability Statement

The data presented in this article are available at request from the corresponding author.

Conflicts of Interest

The authors declare no conflict of interest.

References

  1. Gu, D.; Meiners, W.; Hagedorn, Y.-C.; Wissenbach, K.; Poprawe, R. Bulk-form TiCx/Ti nanocomposites with controlled nanostructure prepared by a new method: Selective laser melting. J. Phys. D Appl. Phys. 2010, 43, 295402. [Google Scholar] [CrossRef]
  2. Kanazawa, M.; Iwaki, M.; Minakuchi, S.; Nomura, N. Fabrication of titanium alloy frameworks for complete dentures by selective laser melting. J. Prosthet. Dent. 2014, 112, 1441–1447. [Google Scholar] [CrossRef] [PubMed]
  3. Ford, S.L. Additive manufacturing technology: Potential implications for US manufacturing competitiveness. J. Int. Commer. Econ. 2014, 6, 40. [Google Scholar]
  4. Lopes, J.; Machado, C.M.; Duarte, V.R.; Rodrigues, T.A.; Santos, T.G.; Oliveira, J. Effect of milling parameters on HSLA steel parts produced by wire and arc additive manufacturing (WAAM). J. Manuf. Process 2020, 59, 739–749. [Google Scholar] [CrossRef]
  5. Mythreyi, O.V.; Raja, A.; Nagesha, B.K.; Jayaganthan, R. Corrosion study of selective laser melted IN718 alloy upon post heat treatment and shot peening. Metals 2020, 10, 1562. [Google Scholar] [CrossRef]
  6. Savinykh, A.S.; Garkushin, G.V.; Razorenov, S.V.; Atroshenko, S.A.; Klimova-Korsmik, O.G.; Kislov, N.G. Strength properties of the heat-resistant Inconel 718 superalloy additively manufactured by direct laser deposition method under shock compression. Metals 2022, 12, 967. [Google Scholar] [CrossRef]
  7. Chang, S.-H.; Hwang, J.-R.; Doong, J.-L. Manufacturing process optimization of short glass fiber reinforced polycarbonate composites in injection molding. J. Reinf. Plast. Compos. 2000, 19, 301–321. [Google Scholar] [CrossRef]
  8. Taguchi, G. Introduction to quality engineering, Tokyo. Asian Product. Organ. 1990, 4, 10–15. [Google Scholar]
  9. Tong, L.I.; Su, C.T. Optimizing multi-response problems in the Taguchi method by fuzzy multiple attribute decision making. Qual. Reliab. Eng. 1997, 13, 25–34. [Google Scholar] [CrossRef]
  10. Han, P. Additive design and manufacturing of jet engine parts. J. Eng. 2017, 3, 648–652. [Google Scholar] [CrossRef]
  11. Wang, F.; Del Bosque, H.; Hyder, J.; Corliss, M.; Hung, W.N. Experimental investigation of porosity distribution in selective laser melted Inconel 718. Procedia Manuf. 2020, 48, 807–813. [Google Scholar] [CrossRef]
  12. Yi, J.; Kang, J.; Wang, T.; Wang, X.; Hu, Y.; Feng, T.; Feng, Y.; Wu, P. Effect of laser energy density on the microstructure, mechanical properties, and deformation of Inconel 718 samples fabricated by selective laser melting. J. Alloys Compd. 2019, 786, 481–488. [Google Scholar] [CrossRef]
  13. Jia, Q.; Gu, D. Selective laser melting additive manufacturing of Inconel 718 superalloy parts: Densification, microstructure and properties. J. Alloys Compd. 2014, 585, 713–721. [Google Scholar] [CrossRef]
  14. Parida, R.P.; Senthilkumar, V. Experimental studies of defect generation in selective laser melted Inconel 718 alloy. Mater. Today Proc. 2021, 39, 1372–1377. [Google Scholar] [CrossRef]
  15. Borisov, E.; Popovich, V.; Popovich, A.; Sufiiarov, V.S.; Zhu, J.-N. Selective laser melting of Inconel 718 under high laser power. Mater. Today Proc. 2020, 30, 784–788. [Google Scholar] [CrossRef]
  16. Cao, Y.; Bai, P.; Liu, F.; Hou, X. Investigation on the precipitates of IN718 alloy fabricated by selective laser melting. Metals 2019, 9, 1128. [Google Scholar] [CrossRef]
  17. Wan, H.; Zhou, Z.; Li, C.; Chen, G.; Zhang, G. Effect of scanning strategy on mechanical properties of selective laser melted Inconel 718. Mater. Sci. Eng. A 2019, 753, 42–48. [Google Scholar] [CrossRef]
  18. Zhang, B.; Wang, P.; Chew, Y.; Wen, Y.; Zhang, M.; Wang, P.; Bi, G.; Wei, J. Mechanical properties and microstructure evolution of selective laser melting Inconel 718 along building direction and sectional dimension. Mater. Sci. Eng. A 2020, 794, 139941. [Google Scholar] [CrossRef]
  19. Yong, C.K.; Gibbons, G.J.; Wong, C.C.; West, G. A critical review of the material characteristics of additive manufactured IN718 for high-temperature application. Metals 2020, 10, 1576. [Google Scholar] [CrossRef]
  20. Schmiedel, A.; Burkhardt, C.; Henkel, S.; Weidner, A.; Biermann, H. Very high cycle fatigue investigations on the fatigue strength of additive manufactured and conventionally wrought Inconel 718 at 873 K. Metals 2021, 11, 1682. [Google Scholar] [CrossRef]
  21. Cheng, B.; Shrestha, S.; Chou, K. Stress and deformation evaluations of scanning strategy effect in selective laser melting. Addit. Manuf. 2016, 12, 240–251. [Google Scholar]
  22. Zhang, Y.; Wu, L.; Guo, X.; Kane, S.; Deng, Y.; Jung, Y.-G.; Lee, J.-H.; Zhang, J. Additive manufacturing of metallic materials: A review. J. Mater. Eng. Perform. 2018, 27, 1–13. [Google Scholar] [CrossRef]
  23. Pérez-Ruiz, J.D.; de Lacalle, L.N.L.; Urbikain, G.; Pereira, O.; Martínez, S.; Bris, J. On the relationship between cutting forces and anisotropy features in the milling of LPBF Inconel 718 for near net shape parts. Int. J. Mach. Tools Manuf. 2021, 170, 103801. [Google Scholar] [CrossRef]
  24. Pérez-Ruiz, J.D.; Marin, F.; Martínez, S.; Lamikiz, A.; Urbikain, G.; López de Lacalle, L.N. Stiffening near-net-shape functional parts of Inconel 718 LPBF considering material anisotropy and subsequent machining issues. Mech. Syst. Sig. Process. 2022, 168, 108675. [Google Scholar] [CrossRef]
  25. Ji, H.; Gupta, M.K.; Song, Q.; Cai, W.; Zheng, T.; Zhao, Y.; Liu, Z.; Pimenov, D.Y. Microstructure and machinability evaluation in micro milling of selective laser melted Inconel 718 alloy. J. Mater. Res. Technol. 2021, 14, 348–362. [Google Scholar] [CrossRef]
  26. Korkmaz, M.E.; Gupta, M.K.; Robak, G.; Moj, K.; Krolczyk, G.M.; Kuntoğlu, M. Development of lattice structure with selective laser melting process: A state of the art on properties, future trends and challenges. J. Manuf. Processes 2022, 81, 1040–1063. [Google Scholar] [CrossRef]
  27. Korkmaz, M.E.; Gupta, M.K.; Waqar, S.; Kuntoğlu, M.; Krolczyk, G.M.; Maruda, R.W.; Pimenov, D.Y. A short review on thermal treatments of Titanium & Nickel based alloys processed by selective laser melting. J. Mater. Res. Technol. 2022, 16, 1090–1101. [Google Scholar]
  28. Fayed, E.M.; Saadati, M.; Shahriari, D.; Brailovski, V.; Jahazi, M.; Medraj, M. Optimization of the post-process heat treatment of Inconel 718 superalloy fabricated by laser powder bed fusion process. Metals 2021, 11, 144. [Google Scholar] [CrossRef]
  29. Bassini, E.; Marchese, G.; Aversa, A. Tailoring of the microstructure of laser powder bed fused Inconel 718 using solution annealing and aging treatments. Metals 2021, 11, 921. [Google Scholar] [CrossRef]
  30. Zheng, J.Y. Optimization of Additive Manufacturing Parameters in Inconel 718 Alloy. Master’s Thesis, National Central University, Taoyuan, Taiwan, 2020. [Google Scholar]
  31. Pearson, K. LIII. On lines and planes of closest fit to systems of points in space. J. Sci. 1901, 2, 559–572. [Google Scholar] [CrossRef]
  32. Hotelling, H. Analysis of a complex of statistical variables into principal components. J. Educ. Psychol. 1933, 24, 417. [Google Scholar] [CrossRef]
  33. Huang, C.; Fung, C.; Chang, S.; Hwang, J.; Doong, J. Optimization study in manufacturing process for PC/ABS blends. Chin. J. Mech. Eng. 2003, 16, 233–236. [Google Scholar] [CrossRef]
  34. Ni, M.; Chen, C.; Wang, X.; Wang, P.; Li, R.; Zhang, X.; Zhou, K. Anisotropic tensile behavior of in situ precipitation strengthened Inconel 718 fabricated by additive manufacturing. Mater. Sci. Eng. A 2017, 701, 344–351. [Google Scholar] [CrossRef]
  35. Jia, H.; Sun, H.; Wang, H.; Wu, Y.; Wang, H. Scanning strategy in selective laser melting (SLM): A review. Int. J. Adv. Manuf. Technol. 2021, 113, 2413–2435. [Google Scholar] [CrossRef]
  36. Zhang, W.; Tong, M.; Harrison, N.M. Scanning strategies effect on temperature, residual stress and deformation by multi-laser beam powder bed fusion manufacturing. Addit. Manuf. 2020, 36, 101507. [Google Scholar] [CrossRef]
  37. Mei, X.; Wang, X.; Peng, Y.; Gu, H.; Zhong, G.; Yang, S. Interfacial characterization and mechanical properties of 316L stainless steel/Inconel 718 manufactured by selective laser melting. Mater. Sci. Eng. A 2019, 758, 185–191. [Google Scholar] [CrossRef]
  38. Popovich, V.A.; Borisov, E.V.; Popovich, A.A.; Sufiiarov, V.S.; Masaylo, D.V.; Alzina, L. Impact of heat treatment on mechanical behaviour of Inconel 718 processed with tailored microstructure by selective laser melting. Mater. Des. 2017, 131, 12–22. [Google Scholar] [CrossRef]
  39. Liu, S.Y.; Li, H.Q.; Qin, C.X.; Zong, R.; Fang, X.Y. The effect of energy density on texture and mechanical anisotropy in selective laser melted Inconel 718. Mater. Des. 2020, 191, 108642. [Google Scholar] [CrossRef]
  40. Huang, X.; Chaturvedi, M.; Richards, N. Effect of homogenization heat treatment on the microstructure and heat-affected zone microfissuring in welded cast alloy 718. Metall. Mater. Trans. 1996, 27, 785–790. [Google Scholar] [CrossRef]
  41. Radavich, J.F. The physical metallurgy of cast and wrought alloy 718. Superalloy 1989, 718, 229–240. [Google Scholar]
  42. Konečná, R.; Kunz, L.; Nicoletto, G.; Bača, A. Long fatigue crack growth in Inconel 718 produced by selective laser melting. Int. J. Fatigue 2016, 92, 499–506. [Google Scholar] [CrossRef]
  43. Karabulut, Y.; Tascioglu, E.; Kaynak, Y. Heat treatment temperature-induced microstructure, microhardness and wear resistance of Inconel 718 produced by selective laser melting additive manufacturing. Optik 2021, 227, 163907. [Google Scholar] [CrossRef]
  44. Watring, D.S.; Carter, K.C.; Crouse, D.; Raeymaekers, B.; Spear, A. Mechanisms driving high-cycle fatigue life of as-built Inconel 718 processed by laser powder bed fusion. Mater. Sci. Eng. A 2019, 761, 137993. [Google Scholar] [CrossRef]
  45. Zhang, Q.; Ren, P.; Tu, X.; Dai, Y.; Wang, X.; Li, W. Effect of heat treatment on microstructure evolution and mechanical properties of selective laser melted Inconel 718 alloy. J. Mater. Eng. Perform. 2019, 28, 5376–5386. [Google Scholar] [CrossRef]
Figure 1. Building direction, testing direction, and testing surface.
Metals 12 01494 g001
Figure 2. Tensile specimen configuration.
Metals 12 01494 g002
Figure 3. Main effects of S/N ratio for optimizing tensile strength.
Metals 12 01494 g003
Figure 4. Tensile strength with 95% confidence interval.
Metals 12 01494 g004
Figure 5. Main effects of S/N ratio for multiobjective optimization.
Metals 12 01494 g005
Figure 6. Strength index of multiple properties with 95% confidence interval.
Metals 12 01494 g006
Figure 7. Pores of specimens: (a) N5, (b) N7.
Metals 12 01494 g007
Figure 8. Metallographs of specimens: (a) N5, (b) N7.
Metals 12 01494 g008
Figure 9. Metallographs of specimens with a magnification of 10,000: (a) N5, (b) N7.
Metals 12 01494 g009
Figure 10. 3D metallograph of optimal specimen.
Metals 12 01494 g010
Figure 11. Fracture surface of specimen N7.
Metals 12 01494 g011
Figure 12. Fracture surface of specimen N5.
Metals 12 01494 g012
Figure 13. Fracture surface of optimal specimen.
Metals 12 01494 g013
Table 1. Control factors and their levels in LPBF process.
LevelControl Factor
ABCD
Laser Power
(W)
Scanning Speed
(mm/s)
Hatching Space
(µm)
Orientation
(degree)
114080060
21509007045°
316010008090°
Table 2. Orthogonal array L9 (34) and mechanical properties of each trial.
Specimen IDControl Factor and LevelMechanical Property
Tensile
Strength
(MPa)
Elongation
(%)
Impact
Energy
(J)
Hardness
(HRC)
N1A1B1C1D11021.9 ± 2.828.2 ± 0.683.2 ± 2.232.2 ± 1.7
N2A1B2C2D21128.5 ± 11.922.5 ± 0.973.8 ± 1.033.0 ± 0.1
N3A1B3C3D31070.3 ± 2.523.8 ± 0.861.1 ± 3.433.4 ± 0.3
N4A2B3C2D11006.4 ± 6.125.7 ± 1.568.7 ± 2.928.5 ± 0.8
N5A2B1C3D21129.6 ± 15.023.1 ± 2.178.5 ± 1.630.8 ± 0.3
N6A2B2C1D31042.1 ± 9.925.8 ± 1.271.5 ± 2.133.3 ± 0.5
N7A3B2C3D1979.9 ± 14.326.9 ± 0.178.9 ± 0.831.3 ± 0.3
N8A3B3C1D21106.5 ± 9.422.3 ± 0.875.2 ± 1.430.0 ± 0.4
N9A3B1C2D31064.3 ±12.625.6 ± 0.977.5 ± 3.527.5 ± 1.1
Table 3. Signal-to-noise ratio and ANOVA for optimization of tensile strength.
FactorS/N Ratio (dB)FContribution
(%)
Level 1Level 2Level 3
A60.6160.4960.416.4113.8
B60.6060.4160.515.6943.4
C60.4760.5560.491.0000.6
D60.0260.9960.50156.4592.2
Table 4. Comparison between experimental and predicted optimal tensile strength.
Tensile Strength (MPa)S/N Ratio (dB)Error
(%)
#1#2#3PredictedExperimental
11401177118461.2361.330.1
Table 5. Eigenvectors for multiobjective optimization.
EigenvectorTensile StrengthElongationImpact
Energy
Hardness
V10.635−0.674−0.3120.212
V20.329−0.1930.618−0.688
V30.2130.1010.6850.689
V40.6660.706−0.227−0.083
Table 6. Signal-to-noise ratio and ANOVA for multiobjective optimization.
FactorS/N Ratio (dB)FContribution
(%)
Level 1Level 2Level 3Mean Square
A0.128−0.049−0.0790.0754.7121.3
B0.076−0.0970.0210.0472.9570.8
C−0.0560.0460.0100.0161.0000.3
D−0.8701.023−0.1545.483345.297.6
Table 7. Results of verification test for multiobjective optimization.
FactorSpecimenAverage
#1#2#3
Tensile Strength (MPa)1140117711841167
Elongation (%)27.421.224.524.4
Impact Energy (J)82.279.482.281.3
Hardness (HRC)32.531.931.632.0
Publisher’s Note: MDPI stays neutral with regard to jurisdictional claims in published maps and institutional affiliations.

