Article

The Effect of the Shear Flow on Columnar Crystal Growth in an Undercooled Melt

1
School of Mathematics and Physics, University of Science and Technology Beijing, Beijing 100083, China
2
School of Materials Science and Engineering, University of Science and Technology Beijing, Beijing 100083, China
*
Authors to whom correspondence should be addressed.
Metals 2022, 12(9), 1487; https://doi.org/10.3390/met12091487
Submission received: 30 July 2022 / Revised: 5 September 2022 / Accepted: 6 September 2022 / Published: 8 September 2022
(This article belongs to the Special Issue Microstructure and Mechanical Properties of Nanocrystalline Metals)

Abstract

:
Herein, the effect of the shear flow on the growth of columnar crystals in an undercooled melt is studied. The asymptotic method is used to solve the dynamic model for the growth of a columnar crystal. The resulting asymptotic solution shows that the shear flow significantly changes the interface morphology of the columnar crystal. With the shear effect of the forced flow, the growth rate of the columnar interface increases in the shear direction of the shear flow. As the shear rate of the shear flow further increases, the interface of the columnar crystal is seriously deformed and distorted. The shear flow causes the columnar crystal in the undercooled melt to tend to evolve into smaller crystals in the initial stage of crystal growth. The analytical result provides a prediction of the formation of interface microstructures during solidification through the change of processing parameters.

1. Introduction

The formation of morphological patterns with respect to the solidification of microstructures is of fundamental significance in materials science and processing engineering. Extensive experimental and theoretical works have been undertaken by the inclusion of various small-scale effects such as interface kinetics, anisotropy, etc., among which convection effects of the forced flow are of utmost importance regarding morphological pattern formation [1,2,3,4,5,6,7]. The treatment of generating convection in experimental frames and practical applications is performed to exert mechanical stirring or electro-magnetic stirring on the melt. The induced convection by the forced flow in the undercooled melt strongly alters the solidification kinetics, which in turn changes the morphological pattern formation of microstructures. As a result, a great number of crystals with micro and even nanometer scales form in the melt and significantly improve the grain refinement and second phase particle microstructures and consequently the physical and mechanical properties of solidified materials [8,9,10,11].
The morphological pattern formation of microstructures is a nonlinear dynamic problem, in which the growing interface’s shape is a part of the solution. Generally, it is hard to obtain the exact solution and for a solution to apply numerical approaches accurately. During crystal growth, the interface is always moving. The division and allocation of the upper and lower meshes of the interface in numerical approaches have some inevitably artificial assumptions. Hence, although they handle many large and complex systems, numerical methods have inherent defects in revealing the physical essence. They are effective means to seek the approximate analytical solution, which has a concise mathematical expression and unambiguous physical nature [1,3,4]. Convection in the melt is complex; however, the fluid velocity near the crystal can be decomposed into a superposition of a uniform flow and a linear flow, among which it has been demonstrated that the shear flow of a forced flow on crystal growth dominates in the solidification of microstructures [12,13,14]. The morphological patterns of spherical particles growing from a supersaturated solution or from a supercooled melt have widely been studied [15,16,17,18]. As perhaps the simplest case of the spherical particles, we investigate the shear effect of the forced flow on the growth of columnar crystals in the supercooled melt [19,20]. Using the asymptotic method, we find the asymptotic solution of the dynamic model for the growth of the columnar crystal and show the prediction of the formation of interface microstructures during solidification through the change of the processing parameters.

2. The Mathematical Model

Consider the growth of a right infinite columnar crystal with an initial radius of a circular column r ¯ 0 in a convective undercooled melt. It is assumed that the melt is undercooled to a temperature T ( T < T M ,   T M is the melting equilibrium temperature of a pure substance; the melt undercooling is defined as Δ T = T M T ). The convection in the undercooled melt is driven by a forced flow when the melt is placed on a rotational disk. The convection velocity near the columnar crystal can be decomposed into a superposition of uniform flow and linear flow, in which it is assumed that the convection velocity U ¯ of the flow field is driven by the shear flow, U ¯ ~ A y ¯ i + B x ¯ j , where i and j are represented as unit vectors in the rectangular coordinate system, x and y are the rectangular coordinates ( x , y ) , A and B are the constant shear rates and the bars over U ¯ , and x ¯ and y ¯ denote the dimensional quantities. The growing interface of the columnar crystal is expressed as R ¯ = R ¯ ( θ , t ¯ ) in the polar coordinate system (r,θ), where θ is the polar angle, t ¯ is the dimensional time, and the bars over R ¯ and t ¯ denote the dimensional quantities. The interface of the column crystal separates the solid phase ( r ¯ < R ¯ ( θ , t ¯ ) ) from the liquid phase ( r ¯ > R ¯ ( θ , t ¯ ) ).
Let U ¯ and P ¯ denote the velocity and reduced pressure in the liquid phase, respectively, and T ¯ L and T ¯ S denote the temperatures in the liquid phase and solid phase, respectively. The growth of the columnar crystal satisfies the following equations. The continuity equation
U ¯ = 0   ( r ¯ > R ¯ ( θ , t ¯ ) ) ,
the Navier–Stokes equation
( U ¯ ) U ¯ + 1 ρ L P ¯ = υ 2 U ¯   ( r ¯ > R ¯ ( θ , t ¯ ) ) ,
where 2 is the Laplace operator, is the gradient operator, P ¯ is the reduced pressure, υ is dynamic viscosity of the melt, and ρ L is the density of the melt. The densities of the solid and liquid phases are assumed to be equal.
The temperature equations are given as follows:
T ¯ L t ¯ + ( U ¯ ) T ¯ L = κ L 2 T ¯ L   ( r ¯ > R ¯ ( θ , t ¯ ) ) ,
T ¯ S t ¯ = κ S 2 T ¯ S ( r ¯ < R ¯ ( θ , t ¯ ) ) ,
where κ L and κ S are the thermal diffusion coefficients of the liquid phase and solid phase, respectively.
At the interface R ¯ = R ¯ ( θ , t ¯ ) , the total mass conservation and tangential non slip of the interface hold that
U ¯ n = 0 , U ¯ τ = 0 ,
where n and τ are the unit normal vector and unit tangent vector of the interface, respectively.
At the interface R ¯ = R ¯ ( θ , t ¯ ) , the Gibbs–Thomson condition and energy conservation condition hold that
T ¯ L = T ¯ S ,
T ¯ S = T M [ 1 + 2 K ¯ Δ H ( γ + 2 γ θ 2 ) ] 1 μ U ¯ I ,
Δ H U ¯ I = k S T ¯ S n k L T ¯ L n ,
where U ¯ I is the moving velocity of the interface; K ¯ is the mean curvature of the interface; Δ H is the crystalline latent heat per unit volume; γ is the anisotropic interface energy, γ ( θ ) = γ 0 ( 1 + α m cos m θ ) , in which γ 0 is the isotropic interface energy that gives the average magnitude of interface energy; α m is the anisotropy parameter; and m is a positive integer, where m = 2 , 3 , 4 , 6 , . In this paper, α 4 for m = 4 is taken and μ is the interface kinetics parameter, and k L and k S are the thermal conductivity coefficients of the liquid phase region and the solid phase region, respectively.
For the asymptotic analysis of the above problem in Equations (1)–(8), we introduce the nondimensionalization transformation
U = U ¯ V p ,   P = P ¯ ρ L V p κ L / r ¯ 0 ,   T L = T ¯ L T M Δ H / ( c p ρ L ) ,   T S = T ¯ S T M Δ H / ( c p ρ L ) ,   r = r ¯ r ¯ 0 , t = t ¯ r ¯ 0 / V p ,
where c p is the constant pressure specific heat, V p is the velocity scale from the characteristic velocity of the interface, V p = k L Δ T / r ¯ 0 Δ H , r ¯ 0 / V p is the time scale, ρ L V p κ L / r ¯ 0 is the pressure scale, and Δ H / ( c p ρ L ) is the temperature scale. Equations (1)–(4) are transferred into the dimensionless governing equations:
U = 0 ,
ε ( U ) U + P = Pr 2 U ,
ε T L t + ε ( U ) T L = 2 T L ,
ε λ S T S t = 2 T S ,
where ε is the relative undercooling parameter, Pr is the Prandtl number, and λ S is the ratio of the thermal diffusivity in the liquid phase to the thermal diffusivity in the solid phase
ε = Δ T Δ H / ( c L ρ L ) ,   Pr = υ κ L ,   λ S = κ L κ S .
The crystal–melt interface conditions (5)–(8) are transferred into the dimensionless interface conditions:
U n = 0 , U τ = 0 ,
T L = T S ,
T S = 4 ε Γ K ( 1 ( m 2 1 ) α m cos m θ ) ε E 1 M k U I ,
ε U I = k T S n T L n ,
where Γ is the interface energy parameter
Γ = γ 0 T M 2 r ¯ 0 Δ H Δ T ,   E = Δ T T M ,   M k = V p μ T M ,   k = k S k L .
The far-field condition is that, as r
T L ε .
In the cylindrical coordinate system, U = u r e r + u θ e θ , in which e r and e θ act as the basis vectors, and u r and u θ are the two components. The shear flow is expressed as r ,
u ~ r ( A 0 + B 0 ) sin θ cos θ e r + r ( B 0 cos 2 θ A 0 sin 2 θ ) e θ ,
where
A 0 = A r ¯ 0 V p ,   B 0 = B r ¯ 0 V p .
Finally, the initial condition for the interface is that at time t = 0 ,
R ( θ , t ) | t = 0 = 1 .
For the sake of simplicity, it is assumed that the buoyancy effects are neglected.

3. Asymptotic Solution and Analysis

For typical metals, the quantity Δ H / ( c p ρ L ) is of a magnitude from tens to several hundred degrees. The relative undercooling parameter ε is practically small, ε < < 1 . With the slow variable ρ = ε r introduced
r r + ε ρ ,
2 r 2 2 r 2 + 2 ε 2 r ρ + ε 2 2 ρ 2 ,
the equations in Equations (10)–(13) become
U + ε u r ρ = 0 ,
ε ( U ) U + ε 2 u r U ρ + p + ε p ρ = Pr ( 2 U + 2 ε 2 U r ρ + ε 2 2 U ρ 2 + ε r U ρ ) ,
ε T L t + ε ( U ) T L + ε 2 u r T L ρ = 2 T L + 2 ε 2 T L r ρ + ε r T L ρ + ε 2 2 T L ρ 2 ,
ε λ S T S t = 2 T S + 2 ε 2 T S r ρ + ε r T S ρ + ε 2 2 T S ρ 2 .
The interface conditions in Equations (14)–(17) become
U n = 0 , U τ = 0 ,
T L = T S ,
T S = 4 ε Γ K ( 1 ( m 2 1 ) α m cos m θ ) ε E 1 M k U I ,
ε U I = k T S n T L n + ε ρ ( k T S T L ) .
The far-field conditions in Equations (18) and (19) and the initial condition for the interface in Equation (20) maintain the same values.
Taking ε as a small parameter and writing α m = P ε temporally, we seek the asymptotic solution of the form
U = U 0 + ε U 1 + ,   p = p 0 + ε p 1 + ,
T L = ε T L 0 + ε 2 T L 1 + ,
T S = ε T S 0 + ε 2 T S 1 + ,
R = R 0 + ε R 1 + .
The columnar interface is expanded into
Q = Q 0 + ε Q 1 + ε 2 Q 2 + ,
where Q = ε R , Q 0 = ε R 0 , Q 1 = ε R 1 , ⋯. The interface curvature is expanded into
2 K = 1 R 0 + ε R 0 2 ( 1 + 2 θ 2 ) R 1 + .
Substituting (29) into Equations (21)–(28) together with Equations (18)–(20), and equating the coefficients of the like terms ε n in the power series of ε , we derive the equations for each order approximation. The leading order approximations for the flow field and the temperature fields satisfy the equations
U 0 = 0 ,
Pr 2 U 0 p 0 = 0 .
2 T L 0 = 0 ,
2 T S 0 = 0 .
which are subject to the interface conditions, namely, at the interface R 0 = R 0 ( t ) ,
U 0 n = 0 , U 0 τ = 0 ,
T L 0 = T S 0 ,
T S 0 = 2 Γ R 0 E 1 M k d R 0 d t ,
d R 0 d t = k T S 0 r T L 0 r .
The far-field temperature condition is, as r , ρ ,
T L 0 1 .
The flow driven condition
U 0 ~ r ( A 0 + B 0 ) sin θ cos θ e r + r ( B 0 cos 2 θ A 0 sin 2 θ ) e θ .
The initial condition for the interface is that at time t = 0 ,
R 0 ( 0 ) = 1 .
For the flow field, when the shear flow is superimposed, the flow field throughout the melt is modified by the additional fluid velocities. After carrying out some algebra, we have the leading order approximations U 0 = ( u r , u θ ) and p 0 :
u r = ( A 0 + B 0 ) ( r 2 R 0 2 r + R 0 4 r 3 ) sin θ cos θ ,
u θ = ( A 0 r + ( A 0 B 0 ) R 0 2 2 r + ( A 0 + B 0 ) R 0 4 2 r 3 ) sin 2 θ
+ ( B 0 r + ( A 0 B 0 ) R 0 2 2 r ( A 0 + B 0 ) R 0 4 2 r 3 ) cos 2 θ ,
p 0 = Pr 4 ( A 0 + B 0 ) R 0 2 r 2 sin θ cos θ .
The leading order approximation solutions for the temperature fields are expressed as
T L 0 = 1 + R 0 d R 0 d t ( R 0 ln r ) e Q 0 ρ ,
T S 0 = 1 + R 0 ( R 0 ln R 0 ) d R 0 d t ,
where the leading order interface R 0 satisfies the ordinary differential equation
d R 0 d t = R 0 2 Γ R 0 2 ( R 0 ln R 0 ) + E 1 M k R 0 .
With the initial condition in Equation (40), Equation (46) has the implicit solution t = t ( R 0 )
t = ( R 0 1 ) [ 1 3 ( R 0 2 + R 0 + 1 ) + 1 + 4 Γ 4 ( R 0 + 1 ) + 2 Γ ( 1 + 2 Γ ) + E 1 M k ] 1 2 ( R 0 2 + 4 Γ R 0 ) ln R 0 + 2 Γ ( 4 Γ 2 + E 1 M k ) ln R 0 2 Γ 1 2 Γ 4 Γ 2 1 R 0 ln R 0 R 0 2 Γ d R 0 .
From Equation (46), as R 0 < 2 Γ , d R 0 d t < 0 , the columnar crystal decays, whereas as R 0 > 2 Γ , d R 0 d t > 0 , the columnar crystal grows. Setting d R 0 d t = 0 yields a critical value of R 0 = 2 Γ . Returning to the dimensional quantity of the critical value R 0 = 2 Γ , we define the critical nucleation radius of the columnar crystal R * as
R * = γ T M Δ H Δ T .
The first order approximation solutions for the temperature fields satisfy the equations
T L 0 t + ( U 0 ) T L 0 = 2 T L 1 + 2 2 T L 0 r ρ + 1 r T L 0 ρ ,
λ S T S 0 t = 2 T S 1 + 2 2 T S 0 r ρ + 1 r T S 0 ρ ,
which are subject to the interface conditions at the interface R 0 = R 0 ( t ) ,
T L 1 = T S 1 + d R 0 d t R 1 + R 0 ( R 0 ln R 0 ) d R 0 d t Q 1 ,
T S 1 = 2 Γ ( R 1 R 0 2 + 1 R 0 2 2 R 1 θ 2 + 15 P cos 4 θ R 0 ) E 1 M k d R 1 d t ,
d R 1 d t = k T S 1 r T L 1 r 1 R 0 d R 0 d t R 1 d R 0 d t Q 1 + R 0 ( R 0 ln R 0 ) d R 0 d t .
The far-field temperature condition is that as r , ρ ,
T L 1 0 ,
The initial condition for the interface is that
R 1 ( θ , 0 ) = 0 .
From Equations (48) and (49) and the interface condition in Equation (51), the first order approximation solutions of Equations (48) and (49) are in the following forms with three modes: n = 0 , n = 2 , and n = 4 .
T L 1 = A L 0 + B L 2 sin 2 θ + A L 4 cos 4 θ ,
T S 1 = A S 0 + B S 2 sin 2 θ + A S 4 cos 4 θ ,
R 1 = g 0 ( t ) + g 2 ( t ) sin 2 θ + f 4 ( t ) cos 4 θ .
where the derivation of the notations A L 0 , B L 2 , A L 4 , A S 0 , B S 2 , A S 4 , g 0 , g 2 , and f 4 are listed in Appendix A. In summary, the asymptotic solution of the columnar crystals is obtained as:
U = U 0 + O ( ε ) ,   p = p 0 + O ( ε ) ,
T L = ε T L 0 + ε 2 ( A L 0 + B L 2 sin 2 θ + A L 4 cos 4 θ ) + O ( ε 3 ) ,
T S = ε T S 0 + ε 2 ( A S 0 + B S 2 sin 2 θ + A S 4 cos 4 θ ) + O ( ε 3 ) ,
R = R 0 + ε ( g 0 + g 2 sin 2 θ + f 4 cos 4 θ ) + O ( ε 2 ) .
The growth velocity of the columnar crystal is
U I = d R 0 d t + ε ( d g 0 d t + d g 2 d t sin 2 θ + d f 4 d t cos 4 θ ) + O ( ε 2 ) ,
where the notations d g 0 d t , d g 2 d t and d f 4 d t are listed in the Appendix A.
It is easily testified that the asymptotic solution in (59)–(61) does not satisfy the initial conditions for the temperature fields. This is caused by the early-time behavior of crystal growth from the assumption / t = O ( 1 ) . In order to solve for the early-time behavior, we introduce the fast time variable t ^ = t / ε and seek the inner solution with respect to time (see Appendix B). Consequently, we can match the inner solution with the solution in Equations (58)–(62) and obtain the uniformly valid asymptotic solution of the columnar crystal growth in the whole melt region. Since the phase transformation occurs near the interface, the asymptotic solution in (59)–(61) shows the variations in the temperature and the interface of the columnar crystal during the growth of the columnar crystal.
With the asymptotic solution in (58)–(62), we use the following physical parameters of a Cu–Fe alloy with face-centered cubic (f.c.c) structures and analyze the interface morphologies of the columnar crystal under the influence of an anisotropic interface energy and the shear effect of the forced flow.
The physical parameters of a Cu–Fe alloy are as follows: T M = 1812 K (Fe), k L = 386 J s−1m−1 K−1 (Cu), k S = 80.4 J s−1m−1 K−1 (Fe), c p = 390 J kg−1 K−1 (Cu), c p S = 477.3 J kg−1 K−1 (Fe), γ = 0.1010 J m−1 (Fe), Δ H = 2.409 J m−3 (Fe), ρ L = 8930 kg m−3 (Cu), and ρ S = 7874 kg m−3 (Fe).
Figure 1, Figure 2, Figure 3 and Figure 4 show the interface morphologies of a columnar crystal growing in an undercooled melt under the influence of an anisotropic interface energy and forced flow. 
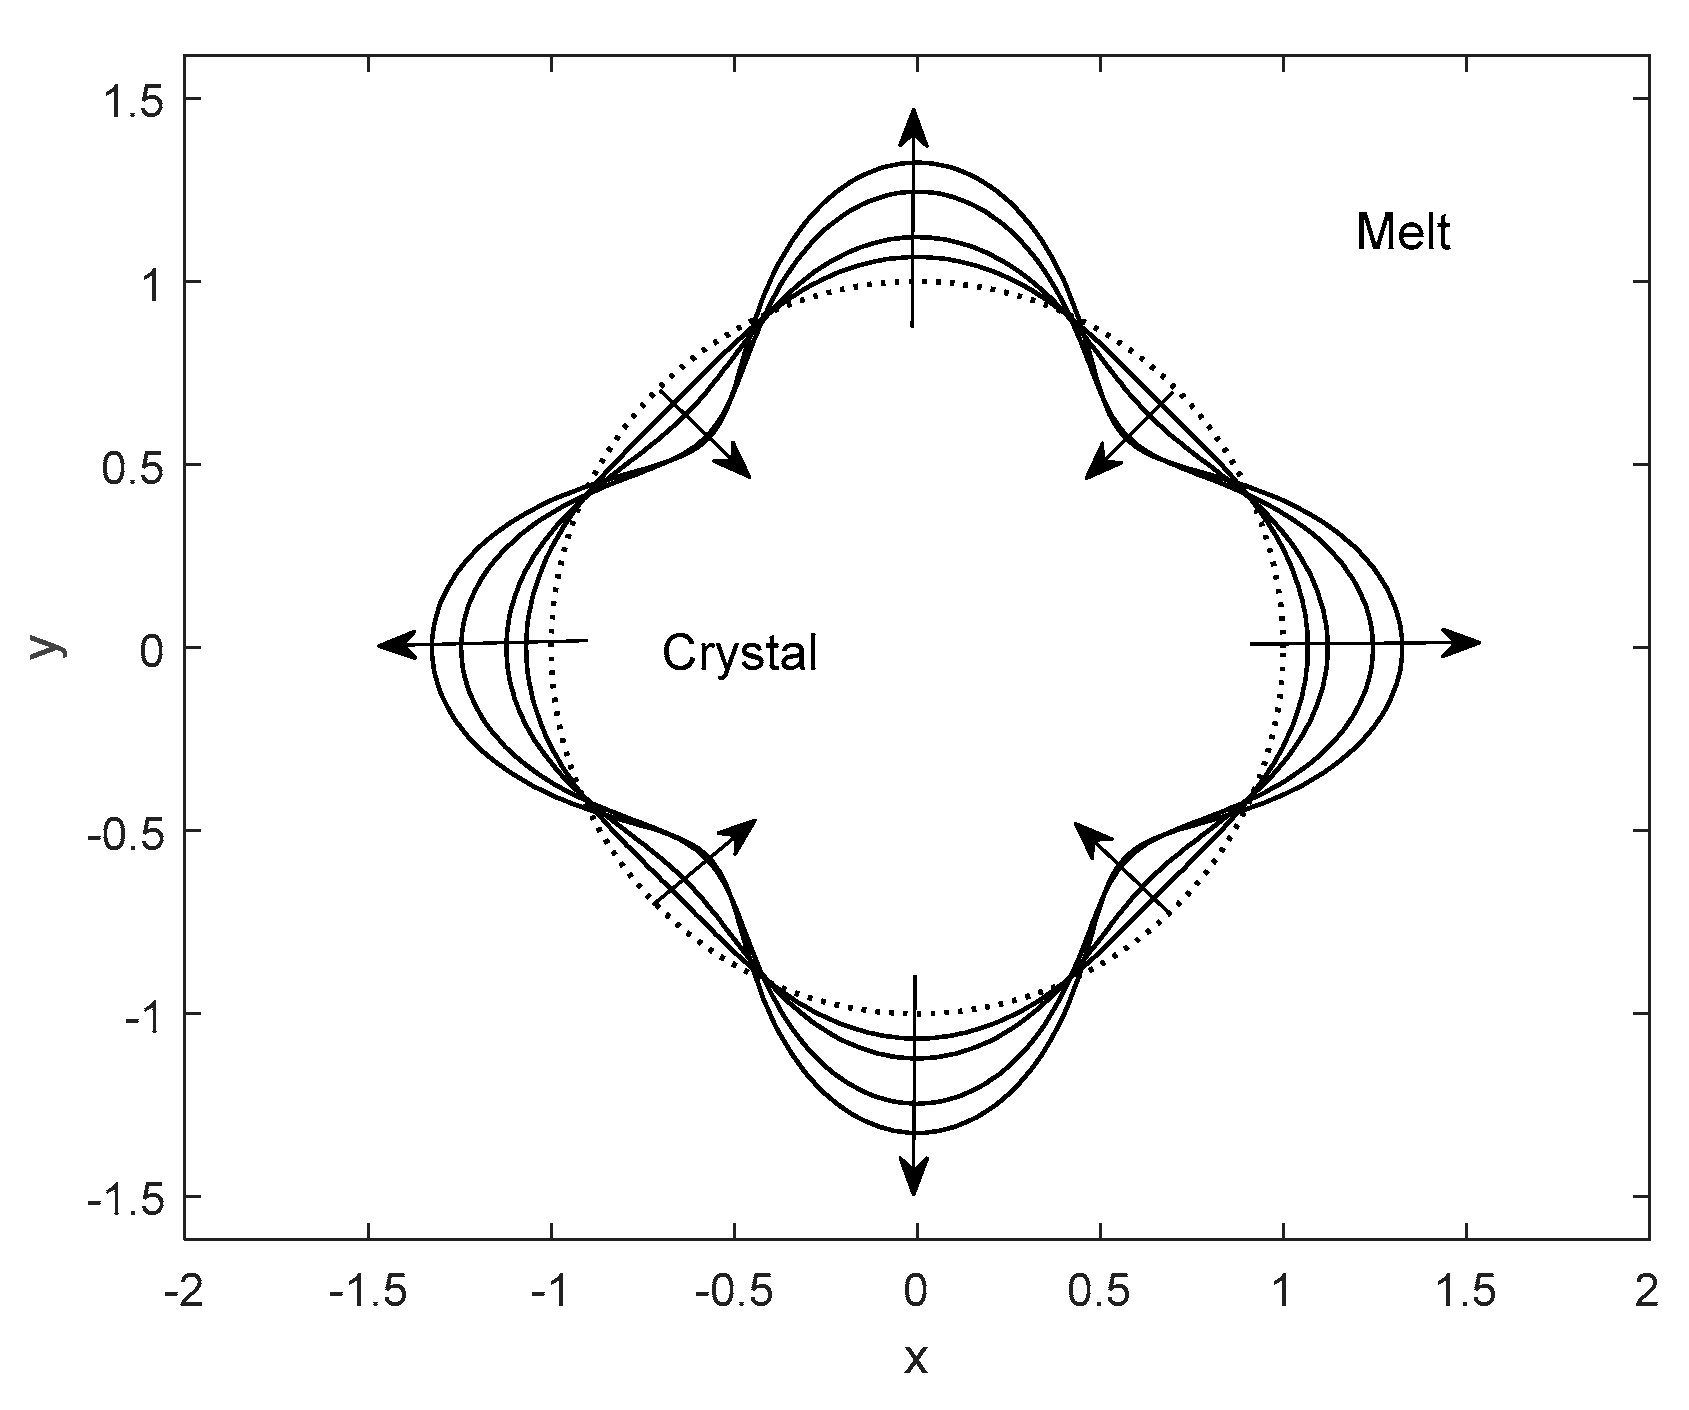
Figure 1 shows the cross-sectional curves of the interface morphology of a columnar crystal growing in an undercooled melt under the influence of anisotropic interface energy. It is seen that during the initial growth times from t = 0 to t 0.6 , some part of the interface of the columnar crystal in the <110> growth directions decays inwardly, whereas the other part of the interface grows outwardly in the <100> preferred growth directions.
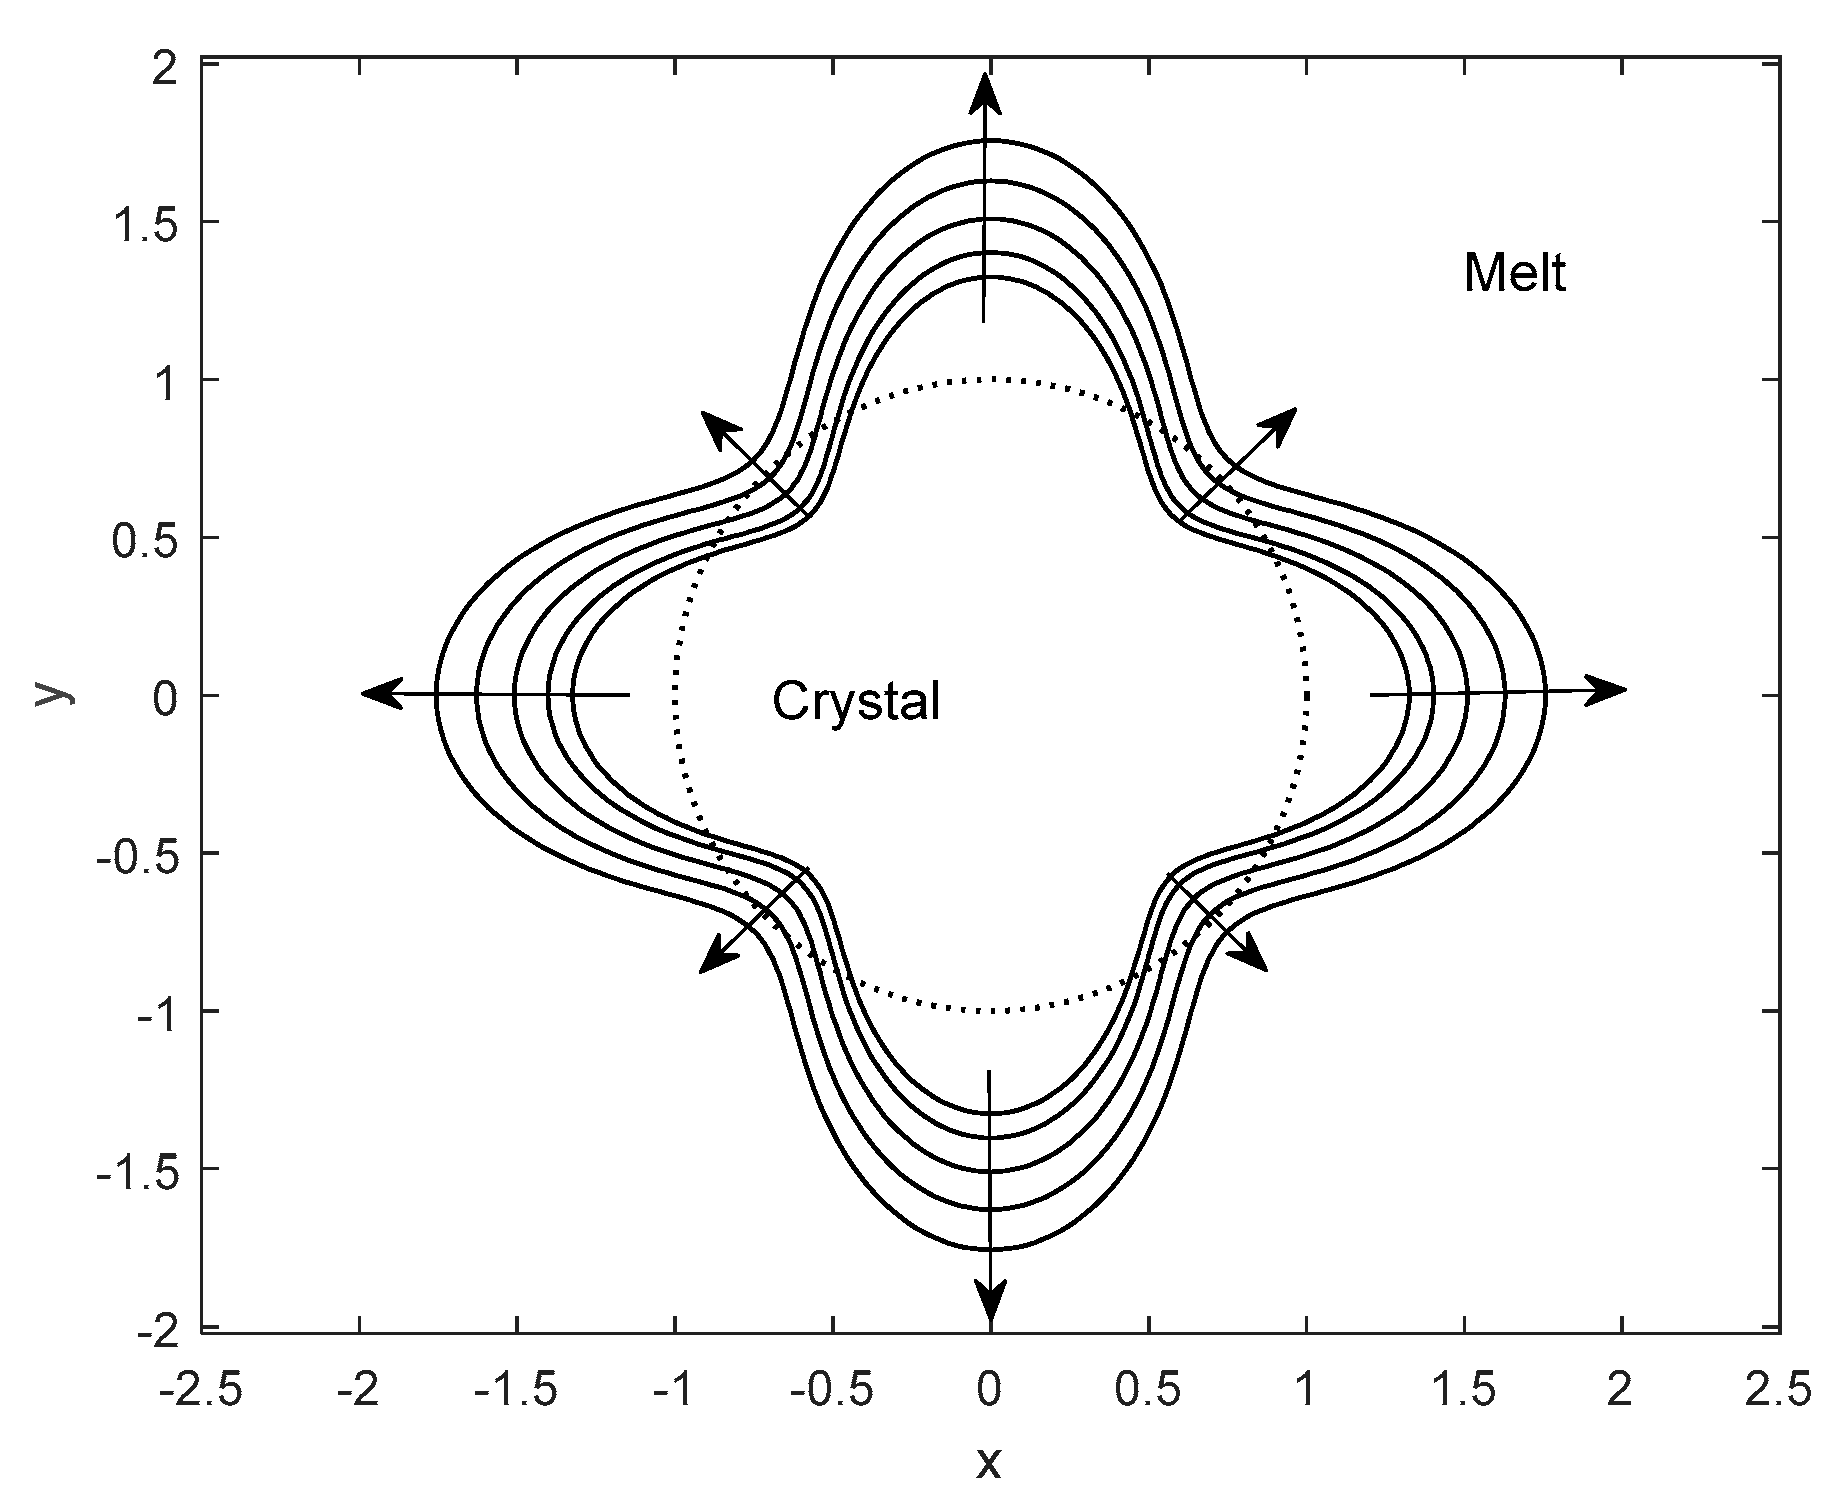
Figure 2 shows that when the inward decay proceeds up to a certain distance, the parts of the interface of the columnar crystal in the <110> growth directions begin to grow outwardly. During the initial growth process, the inward decay of the part of the interface induced by the anisotropic interface energy results in the smaller inner radius, which is less than the critical nucleation radius R * . The local inward growth and outward growth of the columnar crystal deforms the interface of the columnar crystal and forms the remarkable ear-like interface shape with some parts concave and other parts convex. As the anisotropic interface energy parameters increase, the interface increases in the <100> preferred growth directions and decreases in the <110> growth directions. The columnar crystal with a smaller inner radius than the critical nucleation radius R * tends to be locally re-melted or broken.
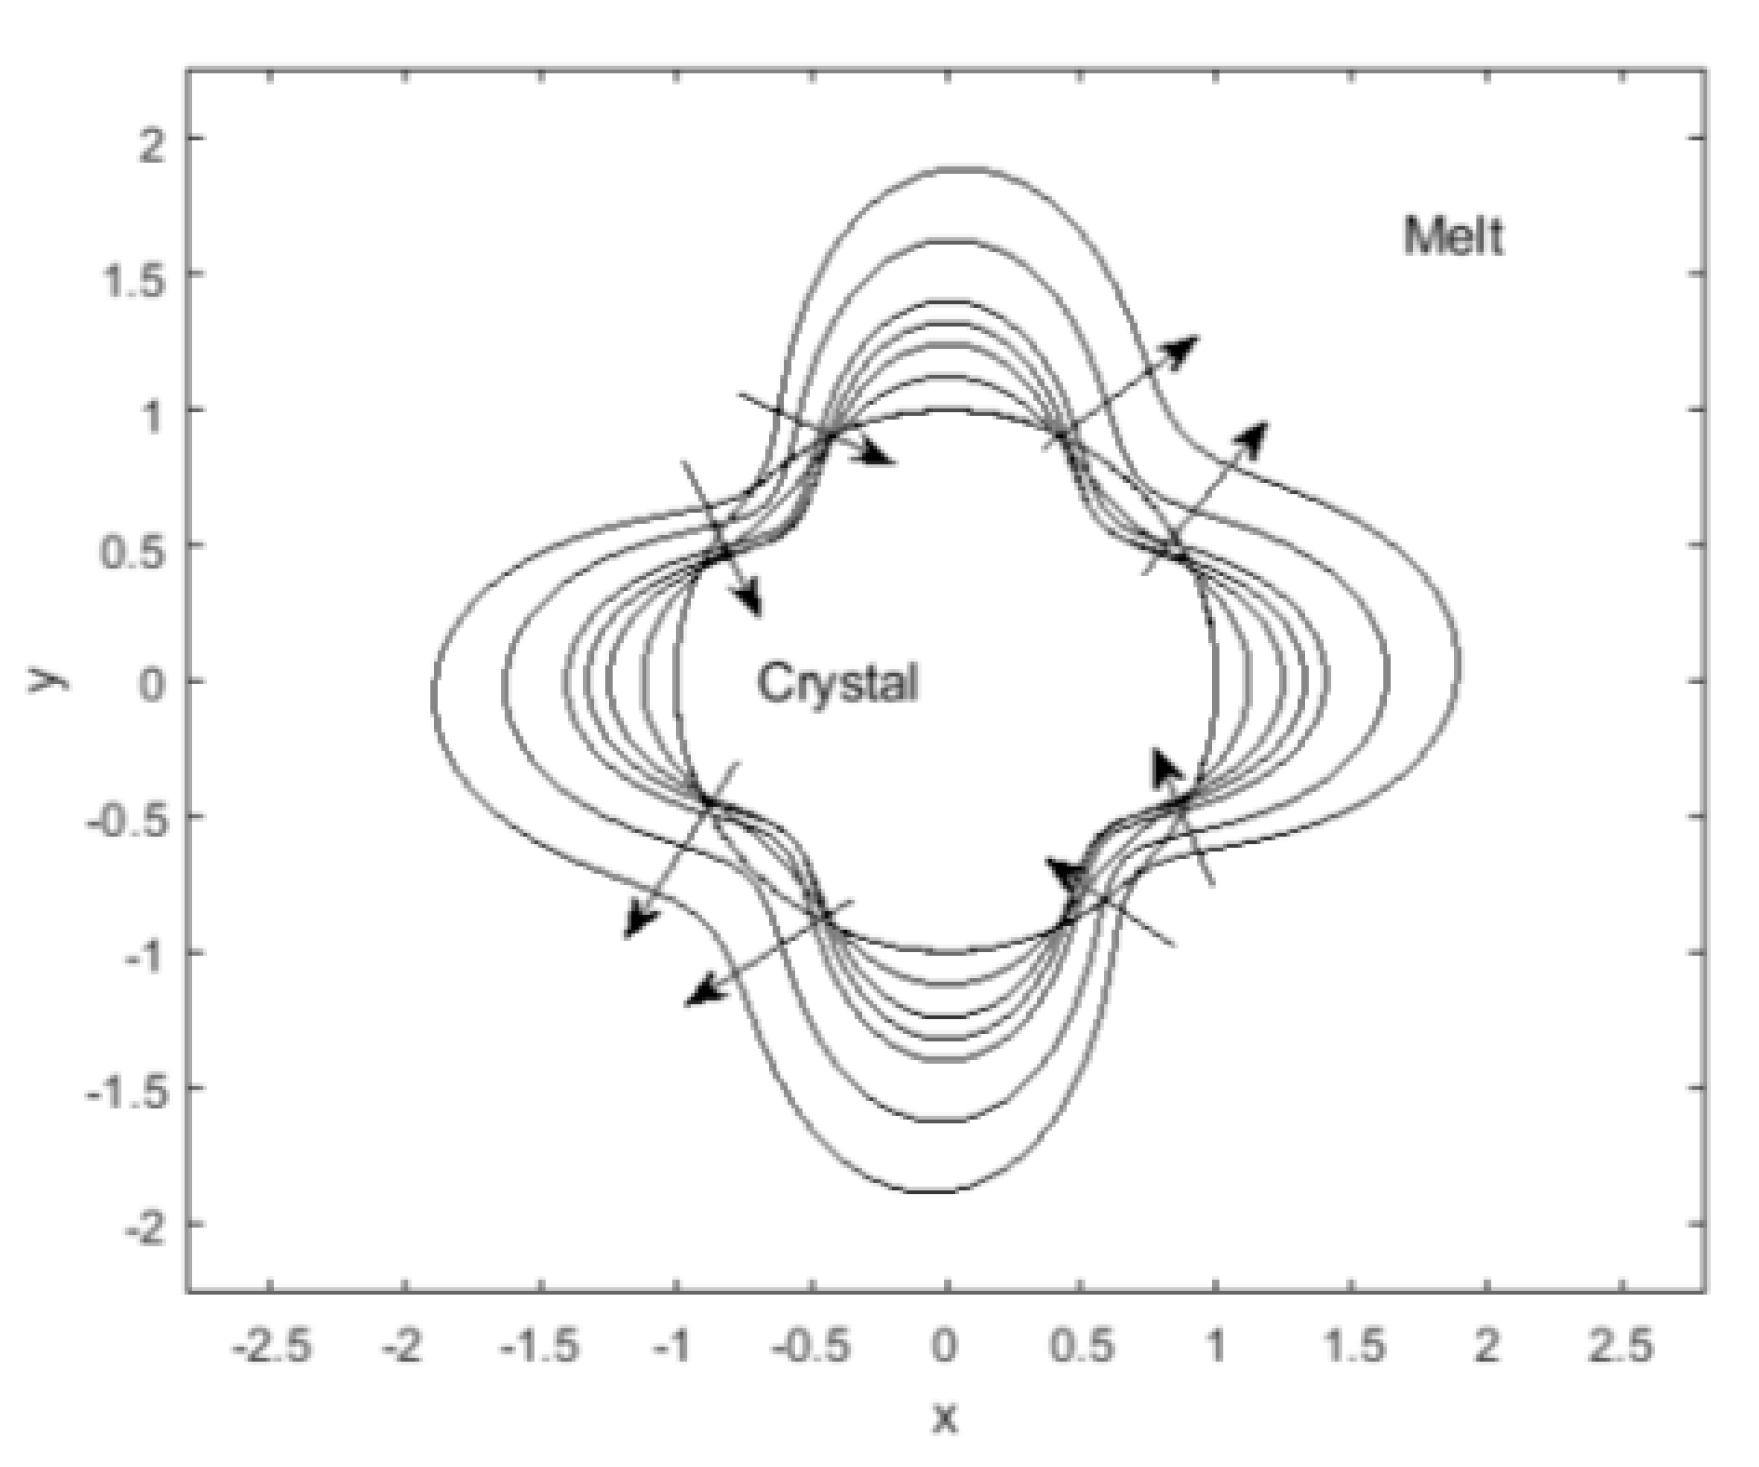
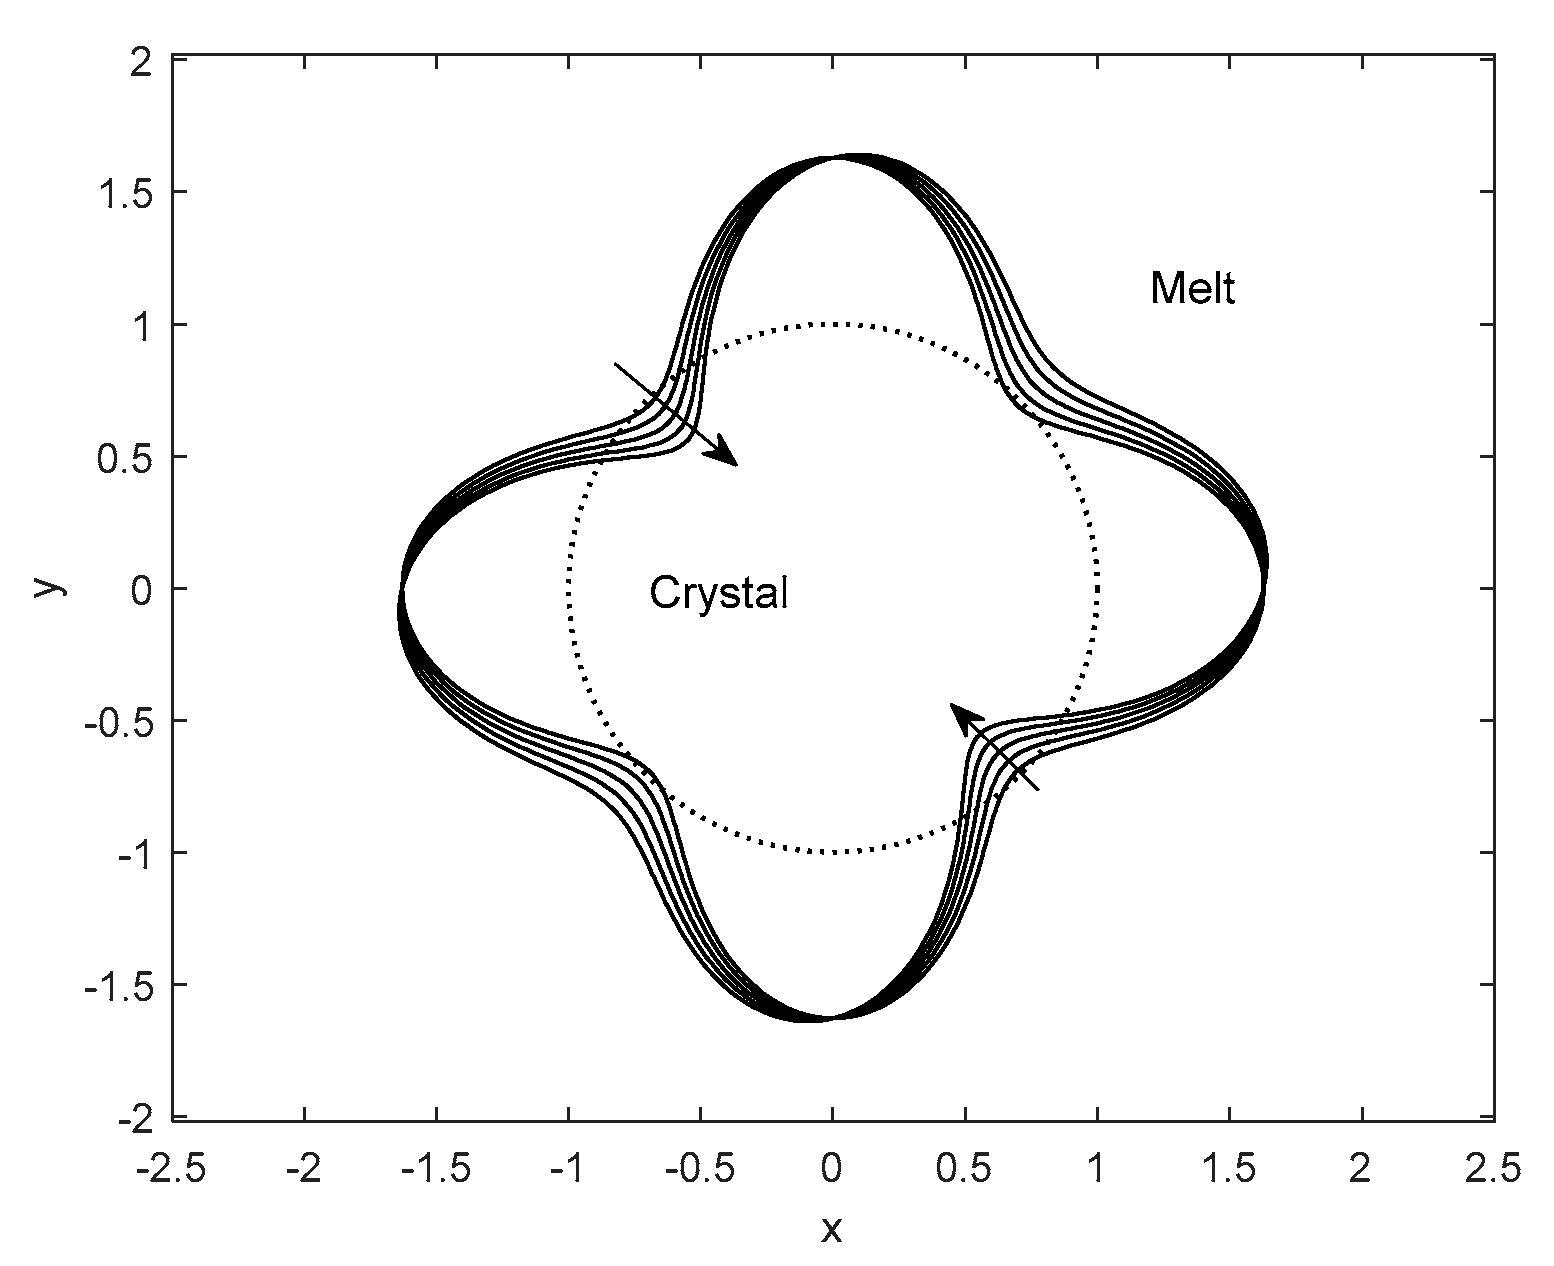
Figure 3 shows the interface morphology of the columnar crystal under the influence of the forced flow. When affected by the shear flow, the ‘ear-like’ interface shape of the columnar crystal induced by the anisotropic effect of the interface energy is deformed. As the shear rate increases, the ‘ear-like’ interface of the columnar crystal is distorted and recedes further inward near the angles of θ = 3 π / 4 , leading to the splitting tendency of the columnar crystal (as seen in Figure 4). This phenomenon implies that the shear effect of the forced flow aggravates the local melting tendency that was caused by the possession of a smaller inner radius than the critical nucleation radius R * , leading to the splitting of the distorted columnar crystal during the initial crystal growth to form finer crystals.
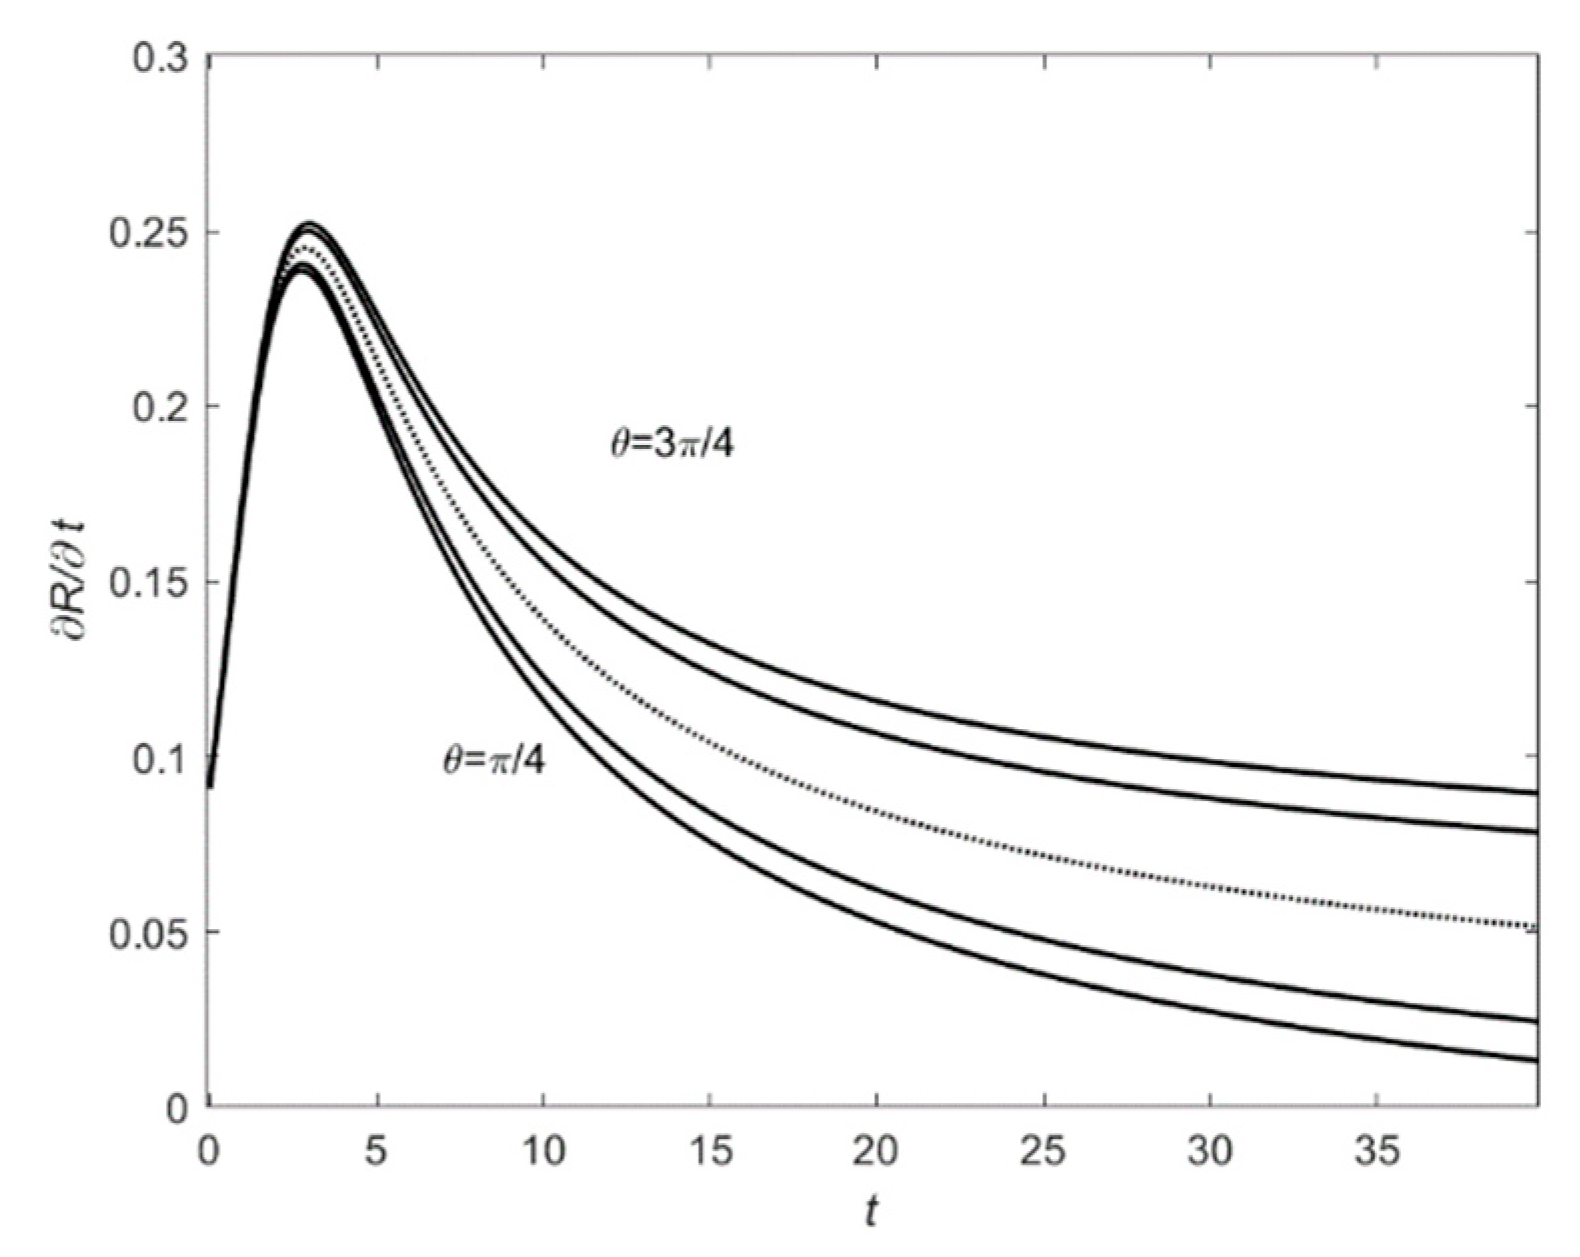
Figure 5 shows the variations in the interface growth velocity along different growth directions under the shear effect of the forced flow. The shear flow causes the different growth velocity of the interface at different growth directions, leading to the distortion of the interface. With the growth of the columnar crystal, the interface of the columnar crystal is further distorted. As a result, the interface of the columnar crystal tends to split into several smaller crystals.
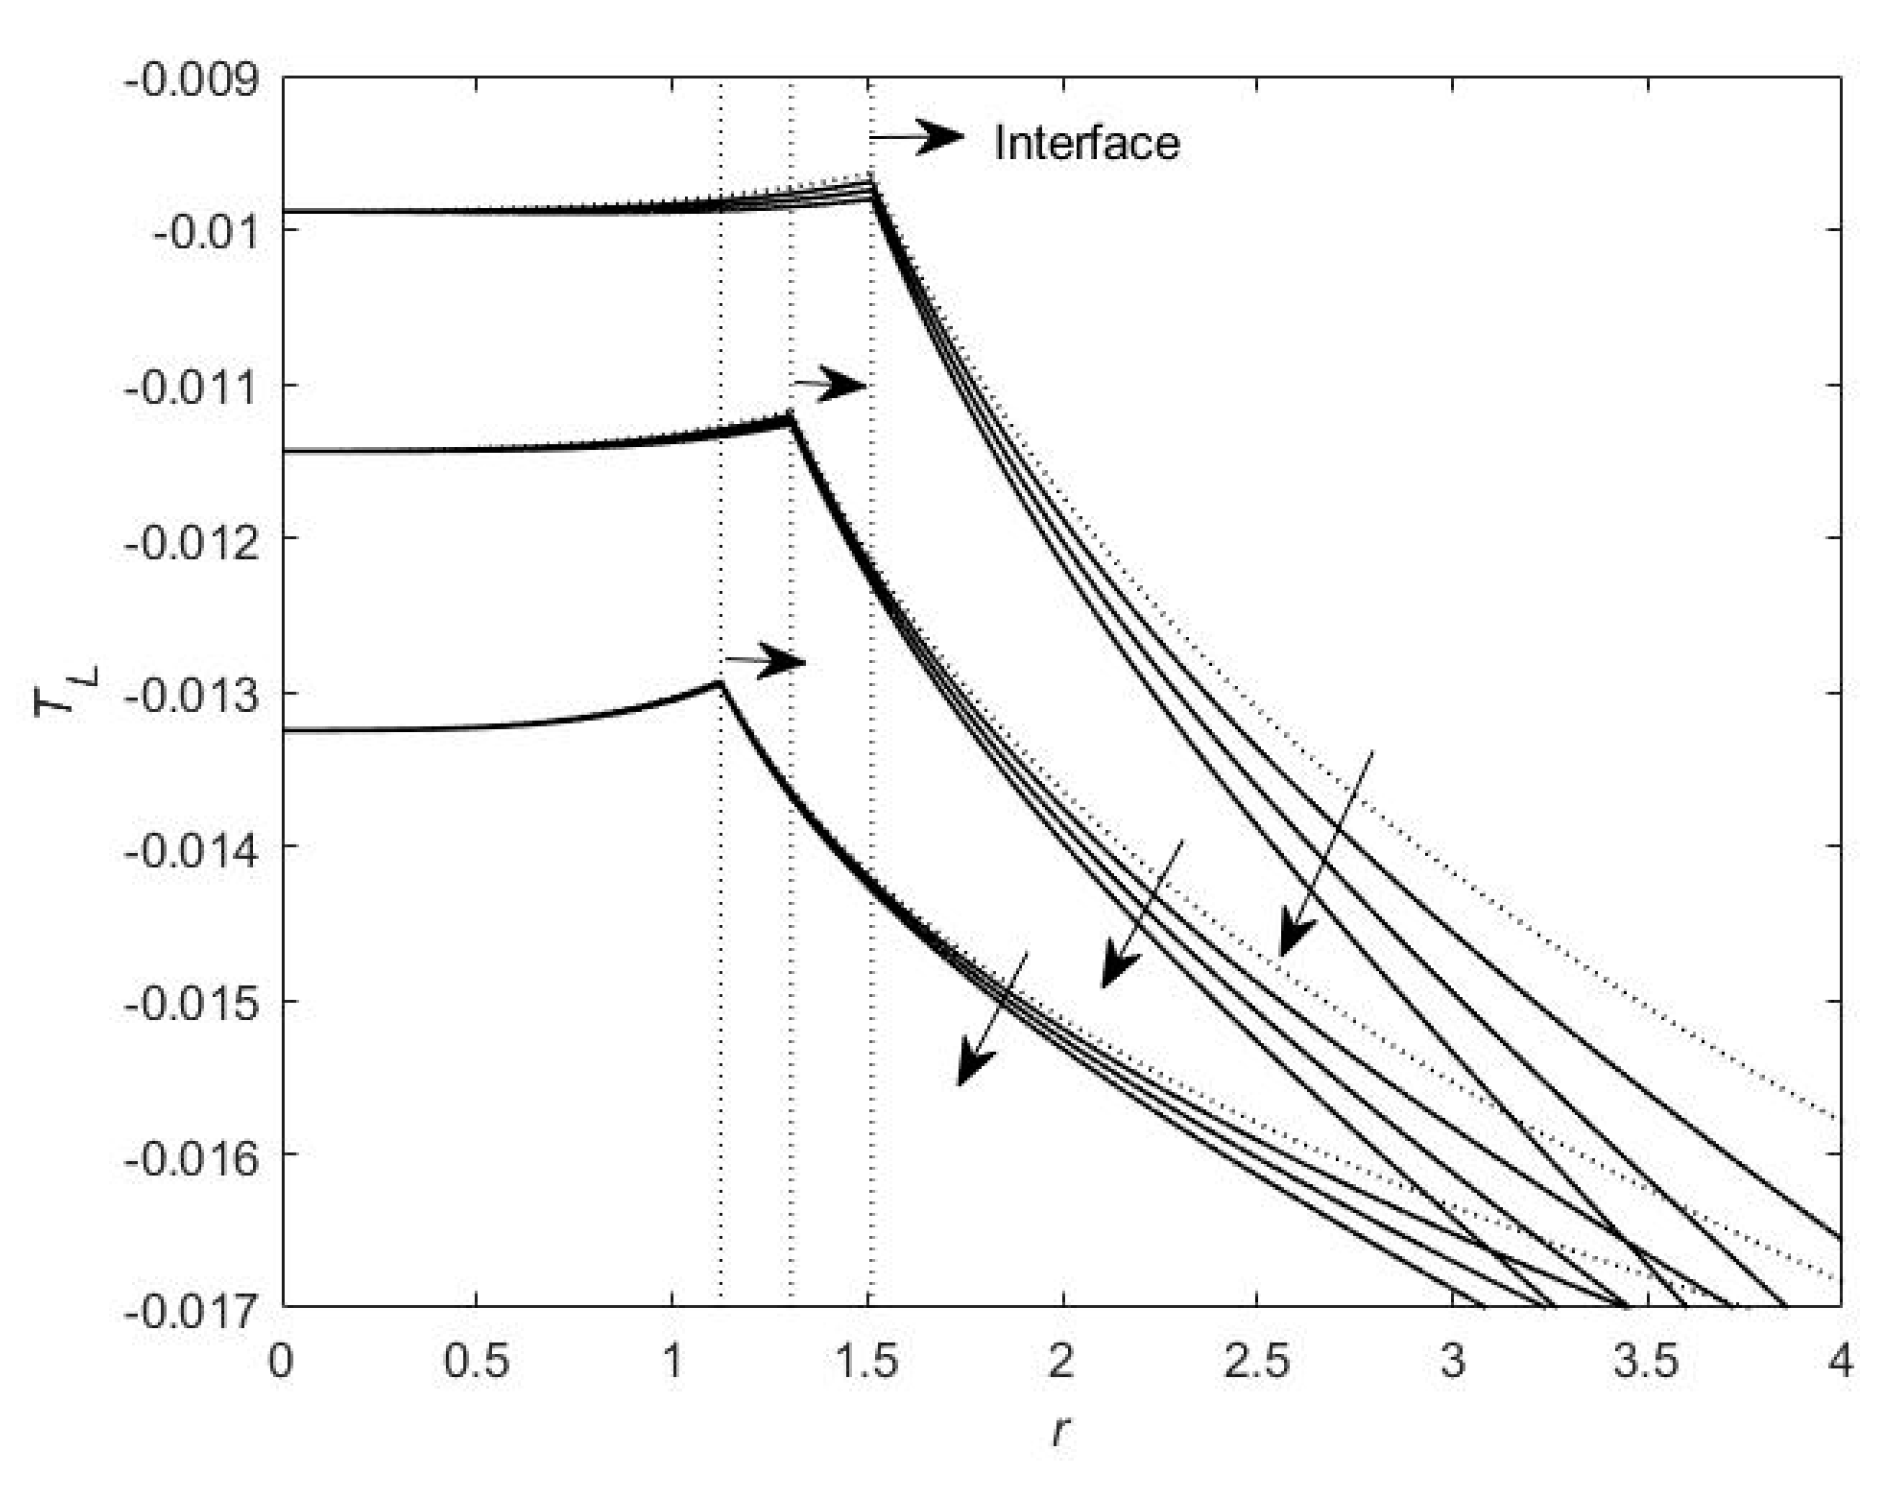
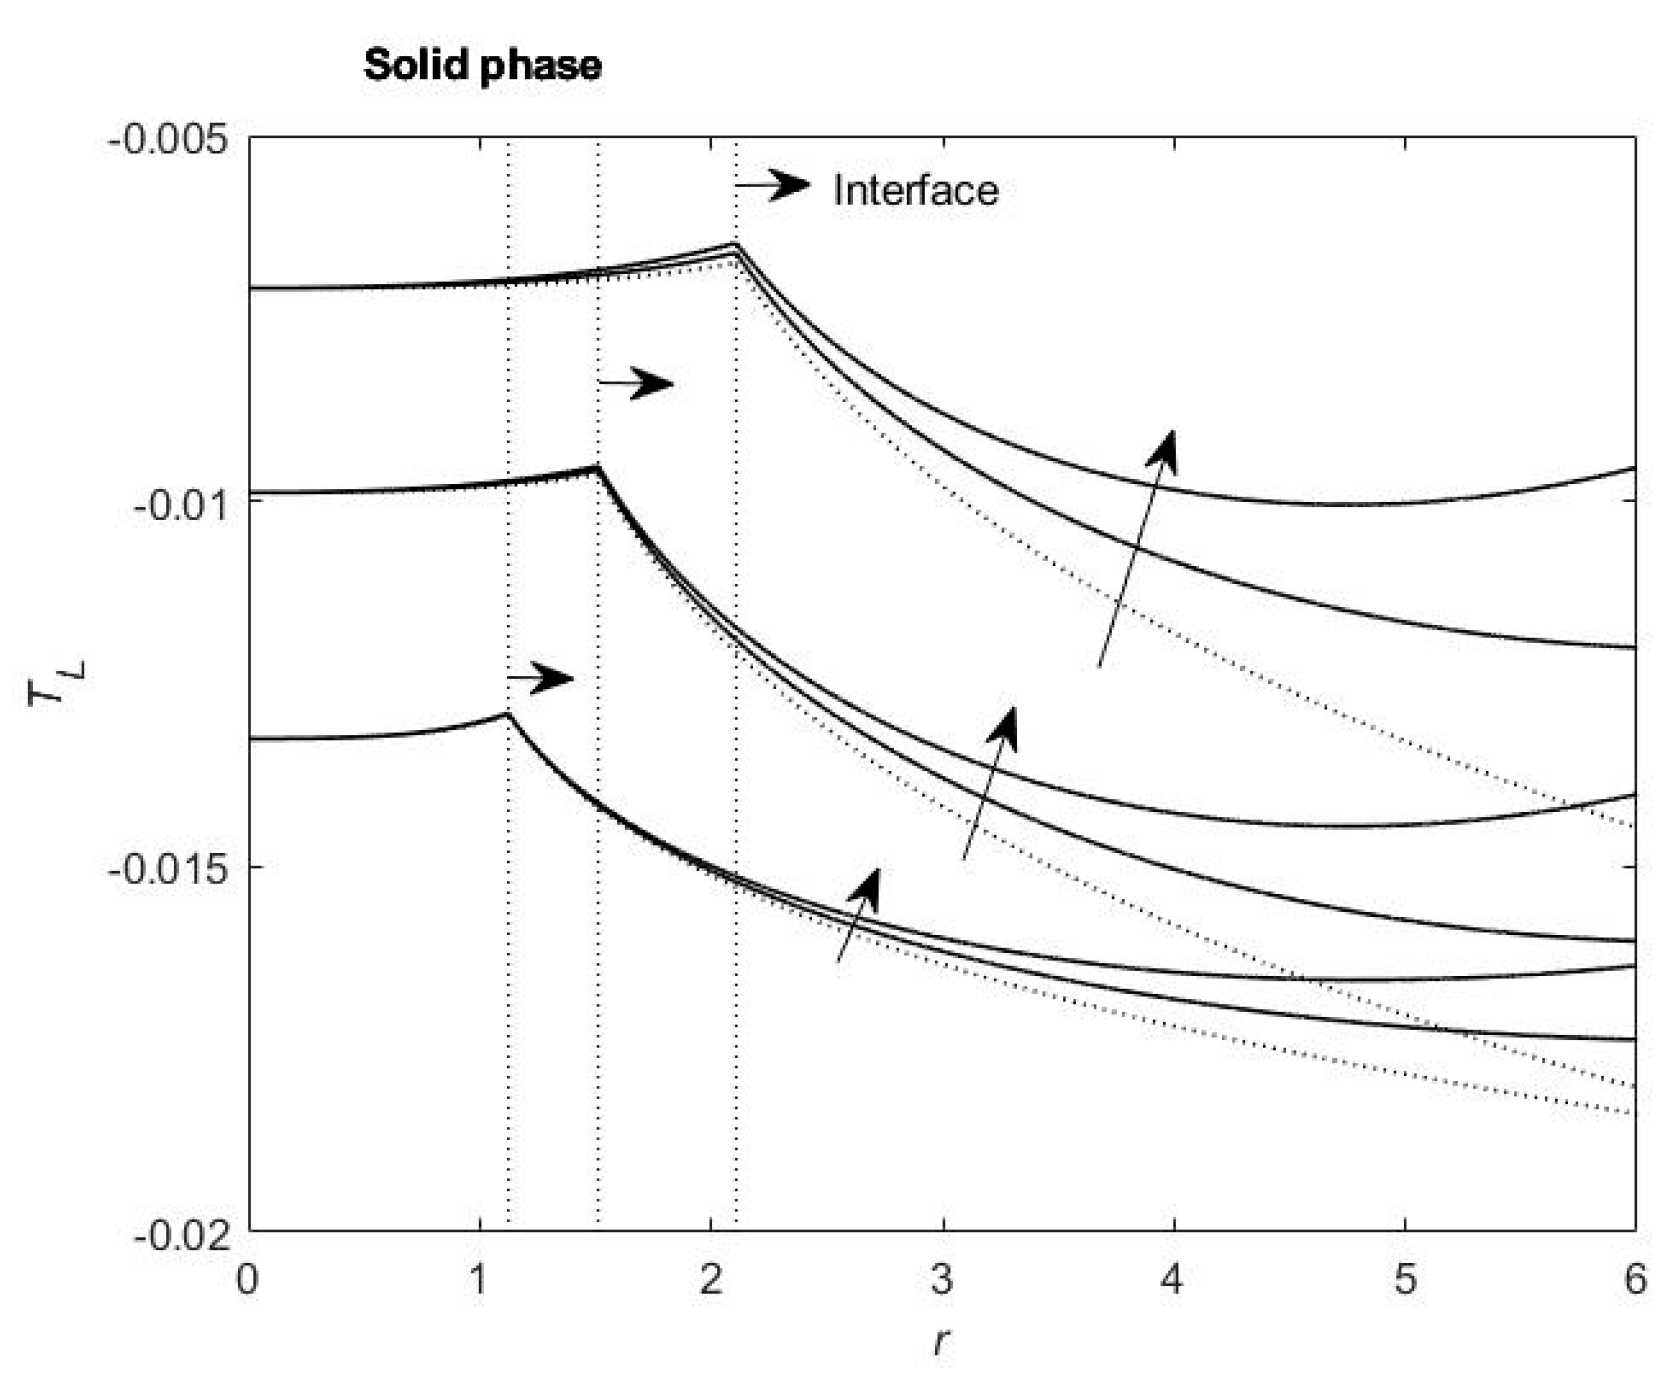
Figure 6 and Figure 7 show the variations in the temperature near the interface along different growth directions under the shear effect of the forced flow at different times. It can be observed that along some growth directions (Figure 6), the shear flow induces the larger interface temperature gradient, whereas along other growth directions (Figure 7), it decreases the interface temperature gradient. The increase in the interface temperature gradient enhances the growth velocity of the interface, but the decrease in the interface temperature gradient depresses the growth velocity of the interface. Due to the shear flow around the columnar crystal, the temperature gradient along the direction from the polar angle causes the accelerated growth of some parts of the interface but the accelerated extrusion of other parts of the interface. When the growth of the columnar crystal (the interface where the arrows point) is oriented to the right, the interface of the columnar crystal is distorted. Since the inward growth of the interface in the initial stage of crystal growth led to a smaller inner radius than the critical nucleation radius of the columnar crystal R * , the interface of the columnar crystal splits into multiple smaller crystals in the initial stage of crystal growth. Each split particle is of the same order of magnitude in the initial stage of crystal growth. Under the shear effect of the forced flow, they will continuously split until the end of solidification to refine the microstructures
As an application, we have conducted the calculation of the microstructural formation of the second phase nanoparticles in a centrifugal casting experiment of as-cast Cu–Fe–Co alloys [6,7,9]. The relevant physical parameters are as follows: the equilibrium temperature of Fe T M = 1728  K, the solidification equilibrium temperature of Cu is taken as T = 1356 K, the latent heat per unit volume of Fe Δ H = 2.404 × 10 9 J m−3, the surface tension of Fe is γ 0 = 0.1010 J m−2, the density of Fe ρ L = 7874 kg m−3, the specific heat of Fe c p = 477.3 J kg−1 K−1, the sound velocity V 0 = 4970 m s−1, the mole mass fraction of Fe M 0 = 56 kg mol−1, the gas constant R g = 8.314 J kg−1 K−1, the kinetic coefficient of Fe: μ = 3.09 m s−1 K−1, the anisotropy parameter of interface kinetics is taken as β = 0.25; and the melt on a disk below it rotates at 300 rpm. From the heat preservation to the end of solidification, the undercooling near the surface of the Fe particles in the matrix of a Cu alloy is in the range of 110~375 K; the critical radius for nucleation R * is in the range of 0.33~0.85 nm. According to our theoretical result, the relative undercooling parameter ε is in the range of 0.20~0.58; the nanoparticles formed in the Cu–Fe–Co alloy melt are of the same order of magnitude as the critical radius for nucleation. Since the anisotropy of the interface kinetics induces the local inward growth of the nuclei after nucleation, the nuclei have radii less than the critical radius of nucleation R * and thus tend to split. Under the shear effect of the forced flow, the nuclei are deformed and distorted. As a result, the interface of the particle splits or is broken into multiple finer particles in the initial stage of growth after nucleation. The finer particles repeat the same process to form particles at a nano scale. We should understand that even if one nucleus has split into several smaller particles in the melt, it is hard to judge whether these smaller particles have just split from this particle. By contrast, it was observed that if the shear flow is not exerted in the melt, the dispersed iron nano particles’ second phase and nano grains are difficult to obtain in the Cu–Fe–Co alloy matrix [6,9].

4. Conclusions

We have studied the shear effect of the forced flow on the growth of the columnar crystal interface in an undercooled melt. By using the asymptotic method, we solved the asymptotic solution of the dynamic model for the columnar crystal. The asymptotic solution of the temperature and interface morphology reveals that the shear flow significantly changes the interface morphology of the columnar crystal in the initial stage of crystal growth. As the shear rate of the forced flow shear rate increases, the growth velocity of the columnar interface increases in the shear direction of the forced flow. With the further increase in the shear rate, the interface of the columnar crystal seriously deforms and distorts, eventually evolving into smaller crystals in the initial stage of crystal growth. Each split particle is of the same order of magnitude in the initial stage of crystal growth. Under the shear effect of the forced flow, they will continuously split. The split crystals repeat the same process until the end of solidification to refine their microstructures. The analytical solution of the dynamic model for columnar crystal growth contains the relevant processing parameters during solidification and suggests definite physical explanations. The splitting mechanism of the nuclei revealed by the solution has been evidenced in our experiment involving Cu alloys. The analytical solution provides a prediction of the formation of interface microstructures during solidification through the change in processing parameters. Future work is expected to extend the model for multi-component alloy systems and applications in a wide variety of alloys such as aluminum alloys and nickel base alloys.

Author Contributions

Literature search, research design and manuscript writing, M.C.; Research design, chart making and manuscript writing, J.J.; Research design and manuscript writing, L.L. and Z.W. All authors have read and agreed to the published version of the manuscript.

Funding

This research was funded by the National Natural Science Foundation of China (Grant No. 51971031, Grant No. 52071012).

Data Availability Statement

The data of this article refer to the data of the following three articles, and their DOI numbers are 10.1088/0957-4484/20/7/075605, 10.1016/j.actamat.2018.10.013 and 10.1016/j.jcrysgro.2013.11.099.

Conflicts of Interest

The authors declare no conflict of interest. The funders had no role in the design of the study; in the collection, analyses, or interpretation of data; in the writing of the manuscript; or in the decision to publish the results.

Appendix A

The notations A L 0 , B L 2 , A L 4 , A S 0 , B S 2 , A S 4 , g 0 , g 2 , f 4 , d g 0 d t , d g 2 d t and d f 4 d t are derived as follows.
Substituting Equations (55)–(57) into Equations (48) and (49), we gain the first-order approximation solutions. For mode n = 0 , A L 0 and A S 0 satisfy the ordinary differential equations:
2 A L 0 r 2 + 1 r A L 0 r = e Q 0 ρ [ R 0 r d R 0 d t ( 2 + R 0 ln r ) ] + e Q 0 ρ [ ( R 0 ln r ) ( d d t ( R 0 d R 0 d t ) + R 0 d R 0 d t d Q 0 d t ) + R 0 ( d R 0 d t ) 2 ] ,
2 A S 0 r 2 + 1 r A S 0 r = λ S d d t [ R 0 ( R 0 ln R 0 ) d R 0 d t ] .
The solutions of Equations (A1) and (A2), which obey the vanishing condition (53), are of the forms
A L 0 = a L 0 + [ R 0 ( r R 0 r ln r ) d R 0 d t + 1 4 R 0 ( d R 0 d t ) 2 r 2 + 1 4 ( d d t ( R 0 d R 0 d t ) + R 0 d R 0 d t d Q 0 d t ) ( r 2 r 2 ln r + R 0 r 2 ) ] e Q 0 ρ ,
A S 0 = a S 0 + 1 4 λ S [ ( R 0 ln R 0 ) d d t ( R 0 d R 0 d t ) + ( R 0 1 ) ( d R 0 d t ) 2 ] r 2 .
With the interface conditions in Equations (50)–(52), a L 0 and a S 0 are determined,
a L 0 = ( 2 Γ R 0 2 + d R 0 d t ) g 0 E 1 M k d g 0 d t + R 0 2 4 ( ln R 0 1 R 0 ) [ d d t ( R 0 d R 0 d t ) + R 0 d R 0 d t d Q 0 d t ] R 0 2 ( R 0 ln R 0 ) d R 0 d t R 0 3 4 ( d R 0 d t ) 2 + R 0 ( R 0 ln R 0 ) d R 0 d t g ¯ 0 ,
a S 0 = 2 Γ R 0 2 g 0 E 1 M k d g 0 d t R 0 2 4 λ S [ ( R 0 ln R 0 ) d d t ( R 0 d R 0 d t ) + ( R 0 1 ) ( d R 0 d t ) 2 ] ,
where g 0 satisfies the first-order ordinary differential equation
d g 0 d t = 1 R 0 2 ( 0 , R 0 ) g 0 + 1 2 k λ S R 0 ( R 0 1 ) ( d R 0 d t ) 2 1 2 R 0 2 ( d R 0 d t ) 2 + 1 2 R 0 [ k λ S ( R 0 ln R 0 ) + ln R 0 R 0 1 2 ] d d t ( R 0 d R 0 d t ) + R 0 d R 0 d t d R 0 d t g ¯ 0 + 1 2 R 0 2 d R 0 d t ( ln R 0 R 0 1 2 ) d Q 0 d t ,
in which
( n , R 0 ) = R 0 2 d R 0 d t 2 n ( n + 1 ) ( k + 1 ) Γ R 0 + n ( k + 1 ) E 1 M k .
For mode n = 2 , B L 2 and B S 2 satisfy the following ordinary differential equations:
2 B L 2 r 2 + 1 r B L 2 r 4 B L 2 r 2 = R 0 r d R 0 d t u r e Q 0 ρ ,
2 B S 2 r 2 + 1 r B S 2 r 4 B S 2 r 2 = 0 .
The solutions of Equations (A9) and (A10), which obey the vanishing condition (53), are of the forms
B L 2 = b L 2 r 2 + ( A 0 + B 0 ) R 0 4 [ ( r 2 ( 1 8 1 2 ln r ) R 0 2 + R 0 4 r 2 ( 1 2 ln r + 1 8 ) ] d R 0 d t e Q 0 ρ ,
B S 2 = b S 2 r 2 ,
With the interface conditions in Equations (50)–(52), b L 2 and b S 2 are determined as
b L 2 = ( 6 Γ + R 0 2 d R 0 d t ) g 2 E 1 M K R 0 2 d g 2 d t + 3 ( A 0 + B 0 ) 16 R 0 5 d R 0 d t + R 0 3 ( R 0 ln R 0 ) d R 0 d t g ¯ 2 ,
b S 2 = 6 Γ R 0 4 g 2 E 1 M k R 0 2 d g 2 d t ,
where g 2 satisfies the first-order ordinary differential equation
d g 2 d t = ( 2 , R 0 ) R 0 2 g 2 + ( A 0 + B 0 ) R 0 3 ( ln R 0 + 3 4 ) 2 ( R 0 + 2 ( k + 1 ) E 1 M k ) d R 0 d t + R 0 [ 2 ( R 0 ln R 0 ) 1 ] R 0 + 2 ( k + 1 ) E 1 M k d R 0 d t g ¯ 2 .
For mode n = 4 , A L 4 and A S 4 satisfy the ordinary differential equations:
2 A L 4 r 2 + 1 r A L 4 r 16 A L 4 r 2 = 0 ,
2 A S 4 r 2 + 1 r A S 4 r 16 A S 4 r 2 = 0 .
The solutions of Equations (A16) and (A17), which obey the vanishing condition (53), are of the forms
A L 4 = a L 4 r 4 ,
A S 4 = a S 4 r 4 ,
With the interface conditions in Equations (50)–(52), a L 4 and a S 4 are determined as
a L 4 = ( 30 Γ R 0 2 + R 0 4 d R 0 d t ) f 4 + 30 P Γ R 0 3 E 1 M k R 0 4 d f 4 d t + ( R 0 ln R 0 ) R 0 5 d R 0 d t f ¯ 4 ,
a S 4 = 30 Γ ( f 4 + R 0 P ) R 0 6 E 1 M k R 0 4 d f 4 d t ,
where f4 satisfies the first-order ordinary differential equation
d f 4 d t = 3 ( 4 , R 0 ) R 0 2 f 4 + 120 ( k + 1 ) Γ P R 0 2 + 4 ( k + 1 ) E 1 M k R 0 + R 0 [ 4 ( R 0 ln R 0 ) 1 ] R 0 + 4 ( k + 1 ) E 1 M k d R 0 d t f ¯ 4 .
With the initial condition in Equation (54), the solutions of Equation (A7), Equations (A15) and (A22) are obtained:
g 0 = 1 3 R 0 2 + 1 2 R 0 k λ S 1 R 0 R 0 2 ( R 0 1 ) d R 0 d t d R 0 1 2 R 0 1 R 0 R 0 3 d R 0 d t d R 0 + 1 2 R 0 1 R 0 R 0 2 d t d R 0 d d t ( R 0 d R 0 d t ) [ k λ S ( R 0 ln R 0 ) + ln R 0 R 0 1 2 ] d R 0 + 1 2 R 0 1 R 0 R 0 3 ( ln R 0 R 0 1 2 ) d Q 0 d t d R 0 1 R 0 1 R 0 R 0 g ¯ 0 d R 0 ,
g 2 = ( A 0 + B 0 ) H ( 2 , R 0 ) 1 R 0 R 0 3 ( ln R 0 + 3 4 ) H ( 2 , R 0 ) 2 R 0 + 4 ( k + 1 ) E 1 M k d R 0 + 1 H ( 2 , R 0 ) 1 R 0 R 0 [ 2 ( R 0 ln R 0 ) 1 ] H ( 2 , R 0 ) R 0 + 2 ( k + 1 ) E 1 M k g ¯ 2 d R 0 ,  
f 4 = 120 P ( k + 1 ) Γ H ( 4 , R 0 ) 1 R 0 H ( 4 , R 0 ) R 0 2 + 4 ( k + 1 ) E 1 M k R 0 d t d R 0 d R 0 + 1 H ( 4 , R 0 ) 1 R 0 R 0 [ 4 ( R 0 ln R 0 ) 1 ] H ( 4 , R 0 ) R 0 + 4 ( k + 1 ) E 1 M k f ¯ 4 d R 0 ,
where
H ( n , R 0 ) = 1 [ R 0 + n ( k + 1 ) E 1 M k ] n 1 exp ( 1 R 0 2 n ( n 2 1 ) ( k + 1 ) Γ [ R 0 ( R 0 ln R 0 ) + E 1 M k ] R 0 ( R 0 + n ( k + 1 ) E 1 M k ) ( R 0 2 Γ ) d R 0 ) .

Appendix B

In order to solve for the early-time behavior, we introduce the fast time variable t ^ = t / ε and seek the inner solution with respect to time. We can derive the asymptotic solution of the inner solution { T L ( i ) , T S ( i ) , R ( i ) } :
T L ( i ) = ε T L 0 ( i ) + ε 2 T L 1 ( i ) + ,
T S ( i ) = ε T S 0 ( i ) + ε 2 T S 1 ( i ) + ,
R ( i ) = R 0 ( i ) + ε R 1 ( i ) + ,
where the superscript i represents the inner solution according to the variable ( r , θ , t ^ ) .
After some tedious algebraic calculations, by matching the inner solution with the above solution, we obtain a solution which obeys the initial conditions for the temperature fields
T L 0 ( i ) = 1 + ( 1 2 Γ ) [ 1 2 n = 1 e μ n 2 τ J 0 ( μ n r ) ω n J 1 ( μ n ) ] ,  
T S 0 ( i ) = 2 Γ + n = 1 C S n e 1 λ S n 2 π 2 τ J 0 ( μ n r ) ,
where J 0 ( r ) and J 1 ( r ) are the Bessel functions of zero and the first order, respectively. μ n ( n = 1 , 2 , ) are the eigenvalues of J 0 ( r ) = 0 .
C S n = 2 J 1 2 ( μ n ) 0 1 ( T S ( r ) W S 0 ) r J 0 ( μ n r ) d r .
The inner solution in Equations (A27)–(A29) shows that the solution satisfies the initial conditions of the problem.

References

  1. Davis, S.H. Theory of Solidification; Cambridge University Press: Cambridge, UK, 2001. [Google Scholar]
  2. Mullins, W.W.; Sekerka, R.F. Morphological stability of a particle growing by diffusion or heat flow. J. Appl. Phys. 1963, 34, 323–329. [Google Scholar] [CrossRef]
  3. Xu, J.J. Interfacial wave theory of pattern formation: Selection of dendritic growth and viscous fingering in Hele-Shaw flow. In A Selection of Volumes in the Springer Series in Synergetics; Springer Publishers: Berlin/Heidelberg, Germany, 1998. [Google Scholar]
  4. Xu, J.J. Dynamical Theory of Dendritic Growth in Convective Flow; Kluwer Academic Publishers: Boston, MA, USA; Dordrecht, The Netherlands; London, UK, 2004. [Google Scholar]
  5. Lan, C.W. Recent progress of crystal growth modeling and growth control. Chem. Eng. Sci. 2004, 59, 1437–1457. [Google Scholar] [CrossRef]
  6. Liu, S.; Sun, Q.; Asselin, E.; Li, Z. Crystallization kinetics of large-sized columnar α-hemihydrate gypsum by reaction of waste CaCl2 and Al2(SO4)3 without crystal modifiers. J. Cryst. Growth 2022, 596, 126817. [Google Scholar] [CrossRef]
  7. Samanta, R.; Chattopadhyay, H.; Guha, C. A review on the application of lattice Boltzmann method for melting and solidification problems. Comput. Mater. Sci. 2022, 206, 111288. [Google Scholar] [CrossRef]
  8. Wang, Z.D.; Wang, X.W.; Wang, Q.S.; Shih, I.; Xu, J.J. Fabrication of a nanocomposite from in situ iron nanoparticle reinforced copper alloy. Nanotechnology 2009, 20, 075605. [Google Scholar] [CrossRef] [PubMed]
  9. Chen, K.X.; Korzhavyi, P.A.; Demange, G.; Zapolsky, H.; Patte, R.; Boisse, J.; Wang, Z.D. Morphological instability of iron-rich precipitates in Cu-Fe-Co alloys. Acta Mater. 2019, 163, 55–67. [Google Scholar] [CrossRef]
  10. Wang, T.; Chen, X.H.; Luo, X.; Jiang, H.; Chen, M.W.; Wang, Z.D. Formation of Si nanoparticle in Al matrix for Al-7wt.%Si alloy during complex shear flow casting. J. Alloys Compd. 2017, 739, 30–34. [Google Scholar] [CrossRef]
  11. Zhang, X.; Wang, Y.; Liu, D.; Ji, Z.; Xu, H.; Hu, M.; Cui, P. Effect of stirring rate on grain morphology of Mg-Al alloy semi-solid structure by phase field lattice Boltzmann simulation. J. Cryst. Growth 2020, 543, 125704. [Google Scholar] [CrossRef]
  12. Chen, M.W.; Ji, X.J.; Xu, X.H.; Zheng, Y.H.; Qian, P.; Wang, Z.D. The Effect of the shear flow on particle growth in the undercooled melt. J. Cryst. Growth 2014, 401, 116–119. [Google Scholar] [CrossRef]
  13. Coriell, S.R.; Parker, R.L. Stability of the shape of a solid cylinder growing in a diffusion field. J. Appl. Phys. 1965, 36, 632–637. [Google Scholar] [CrossRef]
  14. Chen, B.; Zhang, Q.; Sun, D.; Wang, Z. Effects of shear flows on columnar dendritic microstructure during rapid solidification of IN718 alloy: A cellular automaton-lattice Boltzmann modeling study. J. Cryst. Growth 2022, 585, 126583. [Google Scholar] [CrossRef]
  15. Hardy, S.C.; Coriell, S.R. Morphological stability of cylindrical ice crystals. J. Cryst. Growth 1969, 5, 329–337. [Google Scholar] [CrossRef]
  16. Yang, Z.C.; Chen, M.W.; Wang, Y.L.; Wang, Z.D. The effect of anisotropic surface tension on the interface morphology of column crystals. Chin. J. Eng. 2015, 37, 1313–1318. [Google Scholar]
  17. Ji, X.J.; Chen, M.W.; Xu, X.H.; Wang, Z.D. The effect of far field flow on a columnar crystal in the undercooled melt. Chin. Phys. B 2015, 24, 016401. [Google Scholar] [CrossRef]
  18. Brush, L.N.; Sekerka, R.F. A numerical study of two-dimensional crystal growth forms in the presence of anisotropic growth kinetics. J. Cryst. Growth 1989, 96, 419–441. [Google Scholar] [CrossRef]
  19. Chen, M.W.; Liu, W.N.; Wang, Z.D. The asymptotic solution for the particle growth in the undercooled melt driven by a straining flow. Mod. Phys. Lett. B 2019, 33, 1950398. [Google Scholar] [CrossRef]
  20. Yang, C.M.; Chen, M.W.; Zheng, G.J.; Wang, Z.D. Melting of micro/nanoparticles considering anisotropy of surface energy. Sci. Rep. 2021, 11, 19297. [Google Scholar] [CrossRef] [PubMed]
Figure 1. The cross-sectional curves of the interface morphology of the columnar crystal under the influence of anisotropic interface energy at different times t = 0 , 0.05 , 0.10 , 0.30 , 0.60 , where α 4 = 0.25 , r ¯ 0 = 1.1 R * , Γ = 0.4545 , and Δ T = 10 . By contrast, the dashed line denotes the columnar crystal without the anisotropic effect of interface energy. Arrows indicate crystal growth trends.
Metals 12 01487 g001
Figure 2. The cross-sectional curves of the interface morphology of the columnar crystal under the influence of anisotropic interface energy at different times t = 0.6 , 1.0 , 1.5 , 2.0 , 2.5 , where α 4 = 0.25 , r ¯ 0 = 1.1 R * , Γ = 0.4545 , and Δ T = 10 . By contrast, the dashed line denotes the columnar crystal without the anisotropic effect of interface energy. Arrows indicate crystal growth trends.
Metals 12 01487 g002
Figure 3. The cross-sectional curves of the interface morphology of the columnar crystal affected by shear rate of the forced flow at different times t = 0 , 0.10 , 0.30 , 0.60 , 1.0 , 2.0 , 3.0 , where A 0 = B 0 = 40 , α 4 = 0.25 , r ¯ 0 = 1.1 R * , Γ = 0.4545 , and Δ T = 10 . By contrast, the dashed line (the circular line) denotes the columnar crystal without the shear effect of the forced flow. Arrows indicate crystal growth trends.
Metals 12 01487 g003
Figure 4. The cross-sectional curves of the interface morphology of the columnar crystal affected by the shear flow at different shear rates A 0 = B 0 = 0 , 40 , 80 , 120 , 160 at time t = 2 , where α 4 = 0.25 , r ¯ 0 = 1.1 R * , Γ = 0.4545 , and Δ T = 10 . By contrast, the dashed line denotes the columnar crystal without the anisotropic effect of interface energy. Arrows indicate crystal growth trends.
Metals 12 01487 g004
Figure 5. The variations in the interface growth velocity along different directions θ = π / 4 , 5 π / 12 , 7 π / 12 , and 3 π / 4 (from bottom to top) for shear rate of the forced flow A 0 = B 0 = 1.2 , where α 4 = 0.25 , r ¯ 0 = 1.1 R * , Γ = 0.4545 , and Δ T = 10 . By contrast, the dashed line denotes the columnar crystal growth velocity without the shear flow.
Metals 12 01487 g005
Figure 6. The variations in the temperature near the interface along the growth direction θ = π / 12 under the different shear rates A 0 = B 0 = 0 , 3.0 , 6.0 (from top to bottom) at different times t = 1.0 , 2.0 , 3.0 , where α 4 = 0.25 , r ¯ 0 = 1.1 R * , Γ = 0.4545 , and Δ T = 10 . By contrast, the dashed line denotes the columnar crystal growth velocity without the shear flow. Arrows indicate trends as the crystal growth temperature changes.
Metals 12 01487 g006
Figure 7. The variations in the temperature near the interface along the growth direction θ = 7 π / 12 under the different shear rates A 0 = B 0 = 0 , 3.0 , 6.0 (from bottom to top) at different times t = 1.0 , 2.0 , 3.0 , where α 4 = 0.25 , r ¯ 0 = 1.1 R * , Γ = 0.4545 , and Δ T = 10 . By contrast, the dashed line denotes the columnar crystal growth velocity without the shear flow. Arrows indicate trends as the crystal growth temperature changes.
Metals 12 01487 g007
Publisher’s Note: MDPI stays neutral with regard to jurisdictional claims in published maps and institutional affiliations.

