
A Study on Heat Input Control and a Quality Evaluation Algorithm to Prevent Toughness Deterioration of the Heat-Affected Zone in the Fiber Laser Welding Process of ASTM A553-1 (9% Nickel Steel) Material


Abstract
:1. Introduction
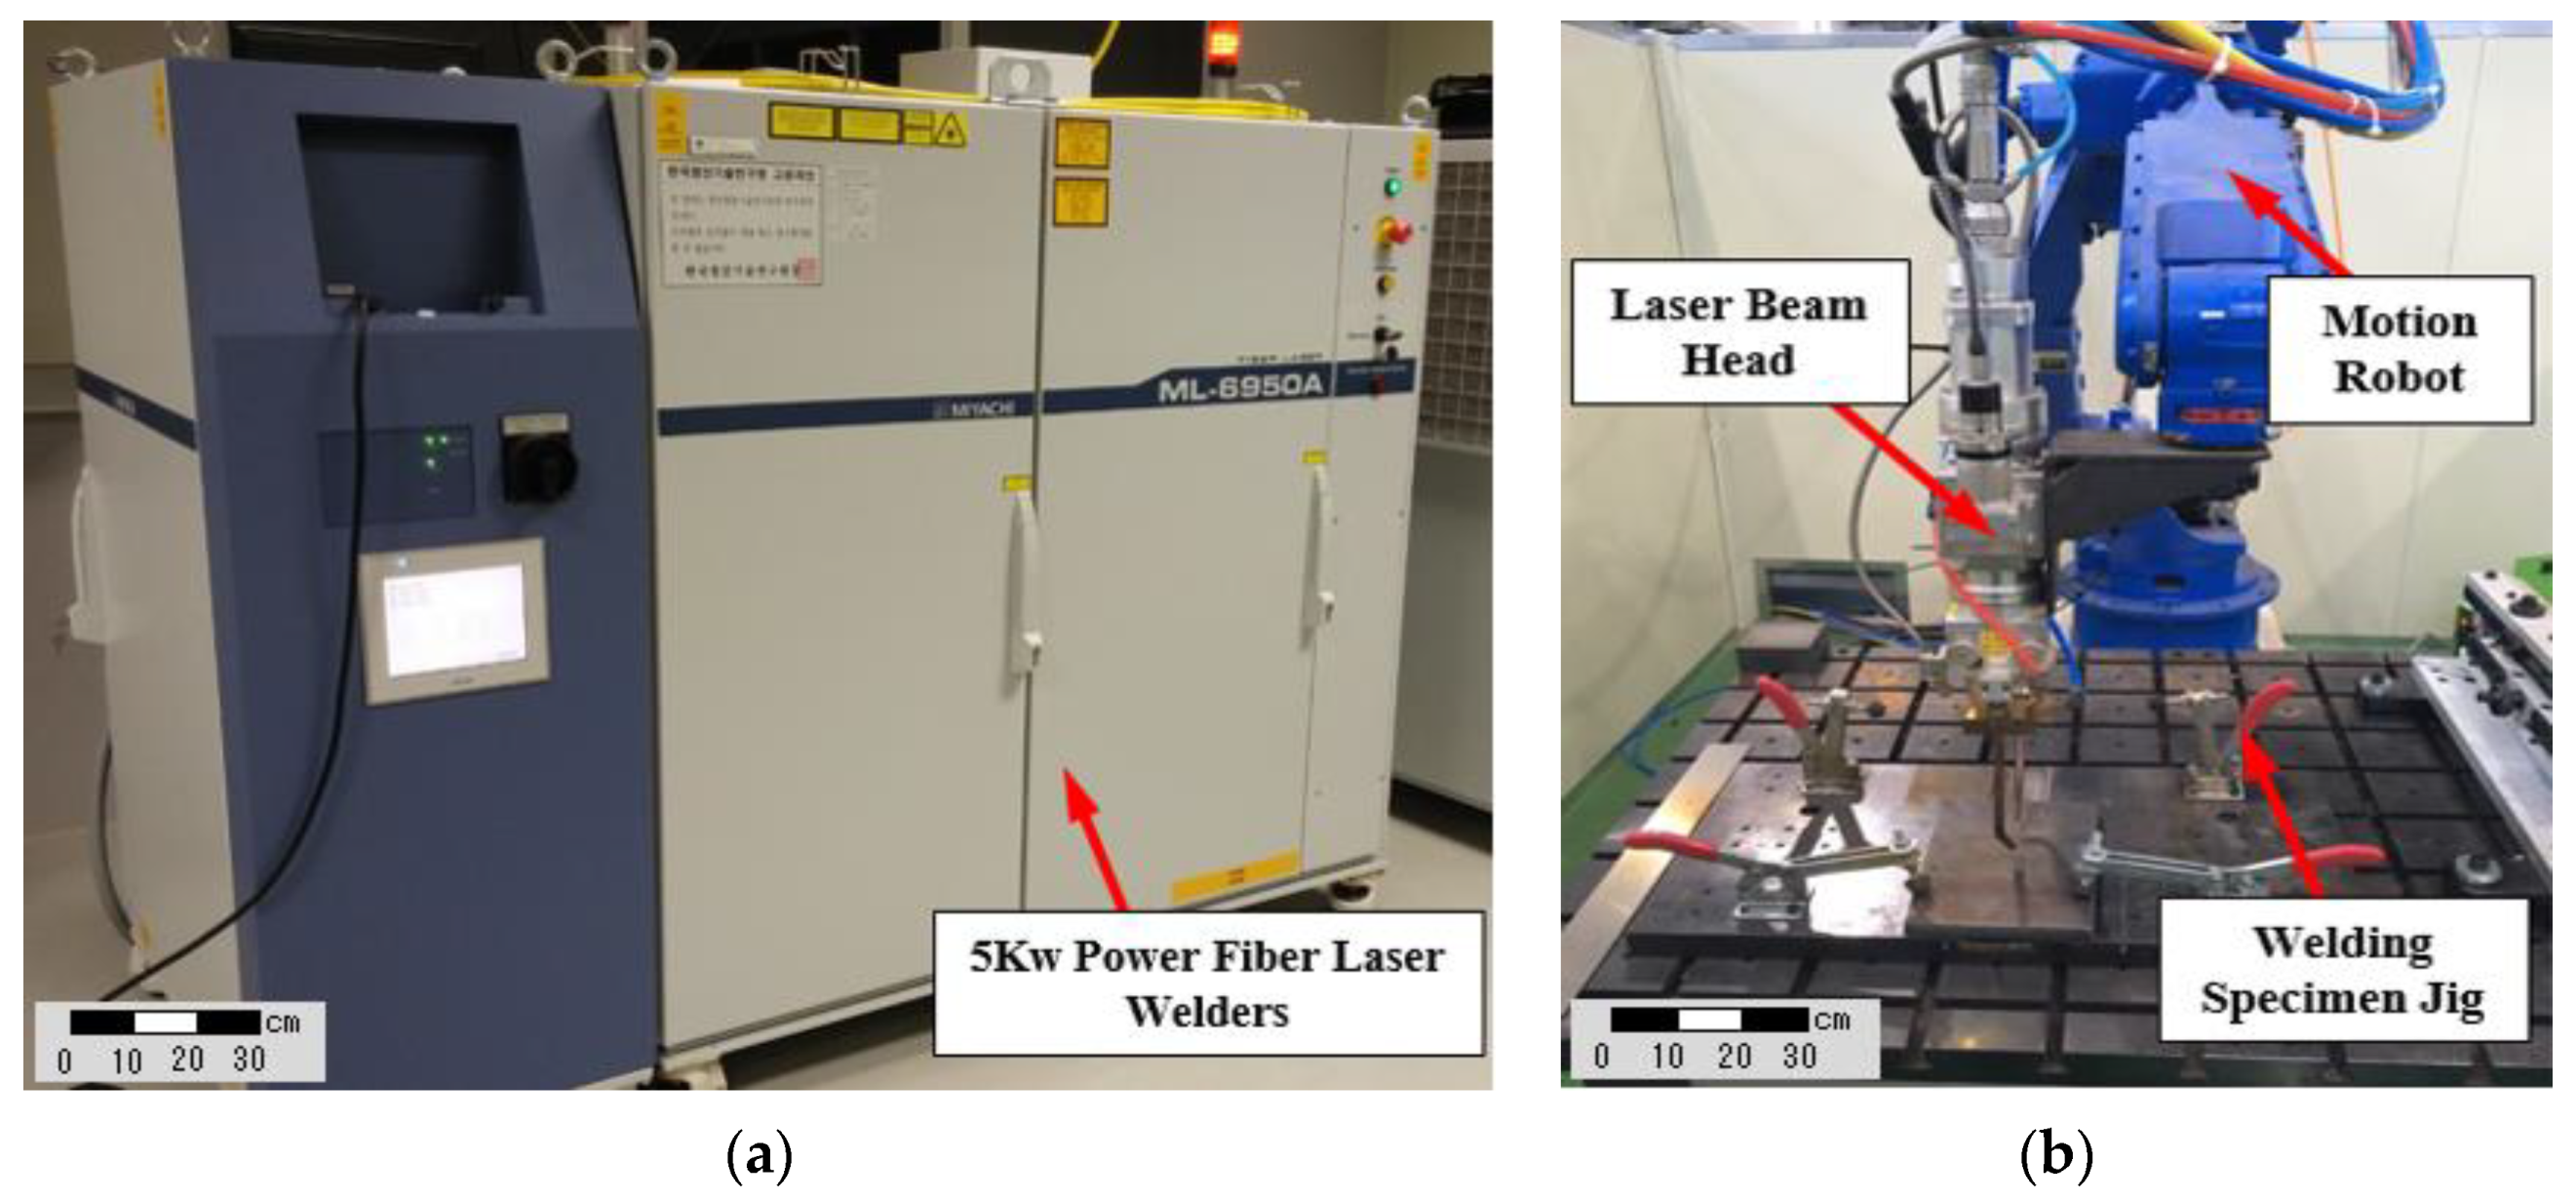
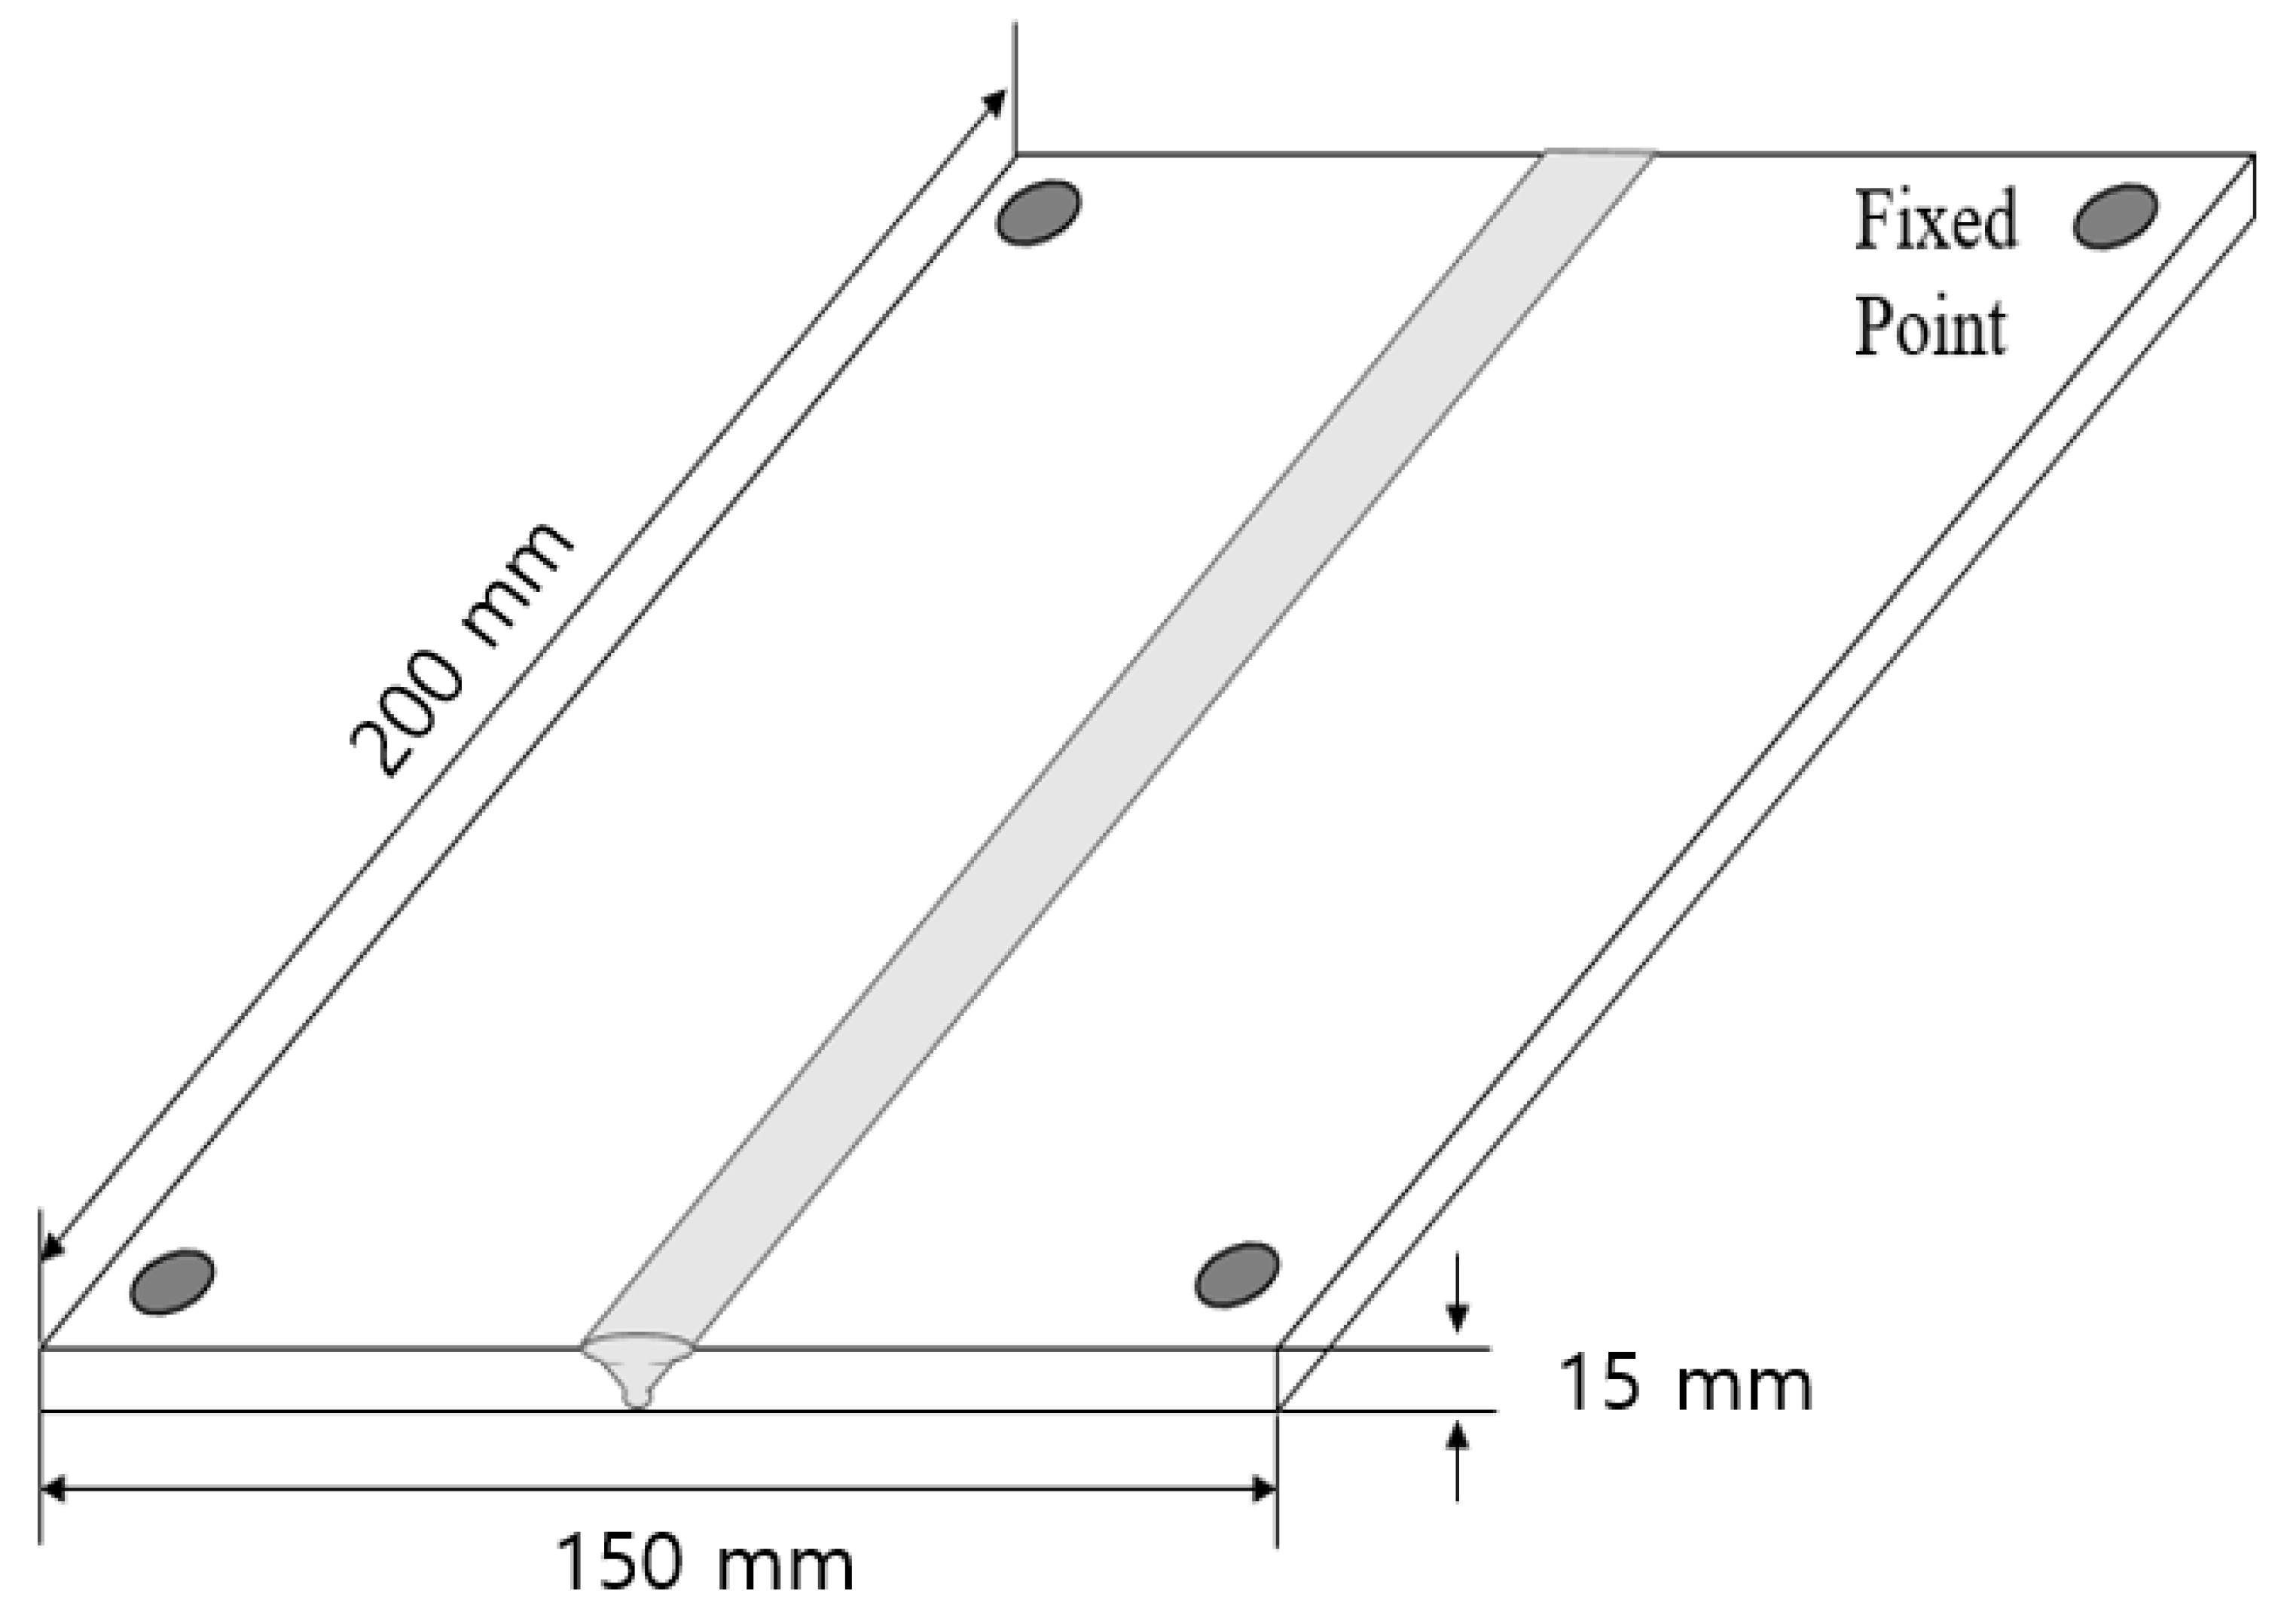
2. Experimental Works
3. Results of Fiber Laser Welding
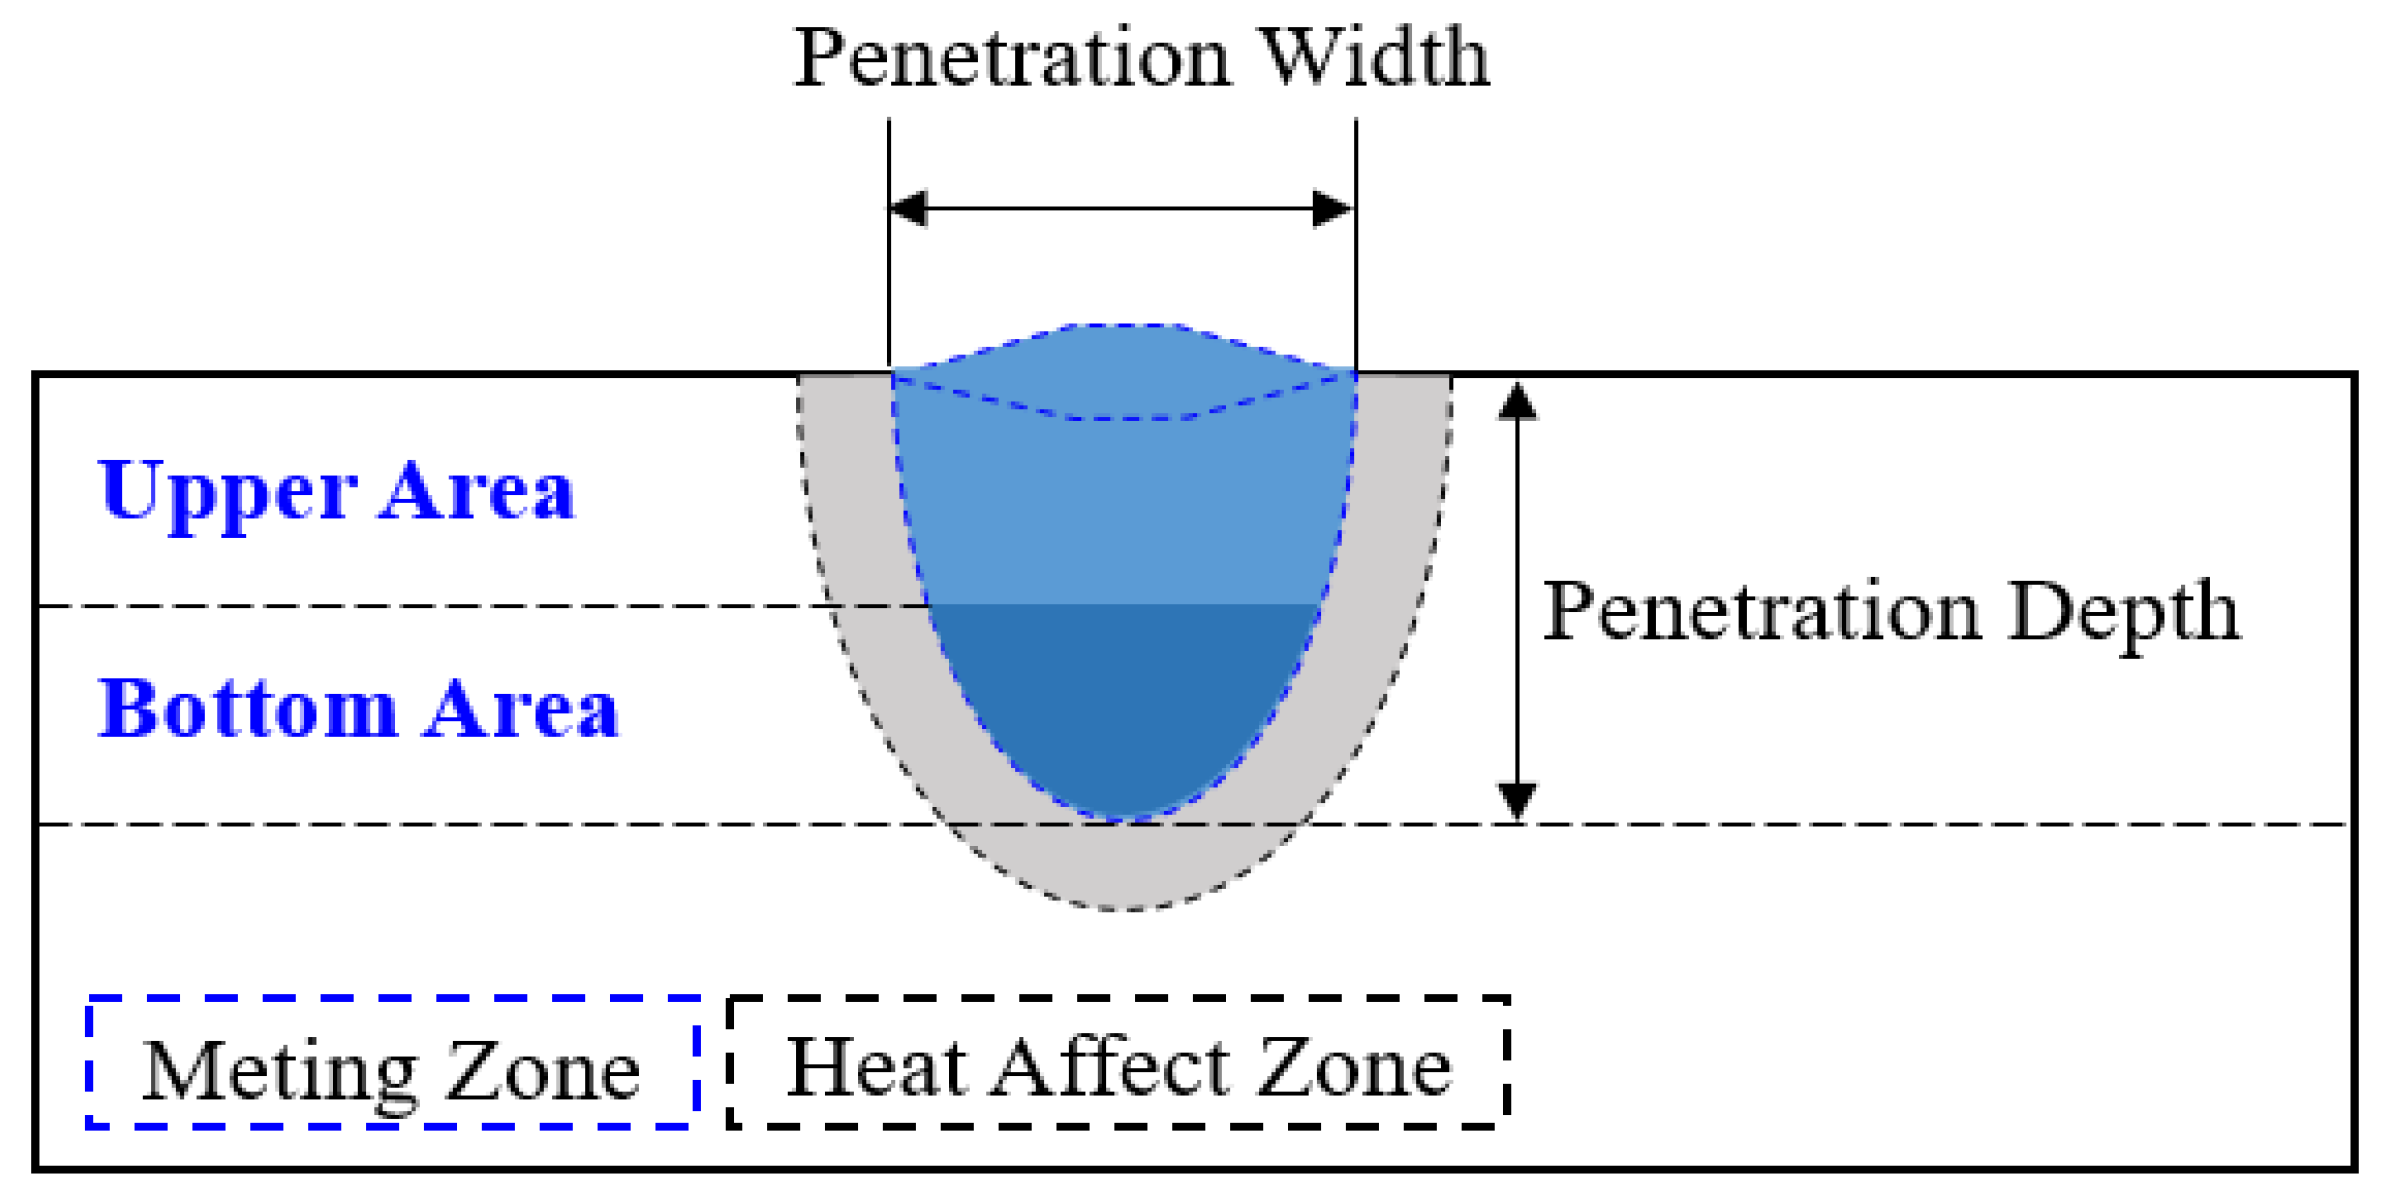
3.1. Measurement of Penetration Geometry
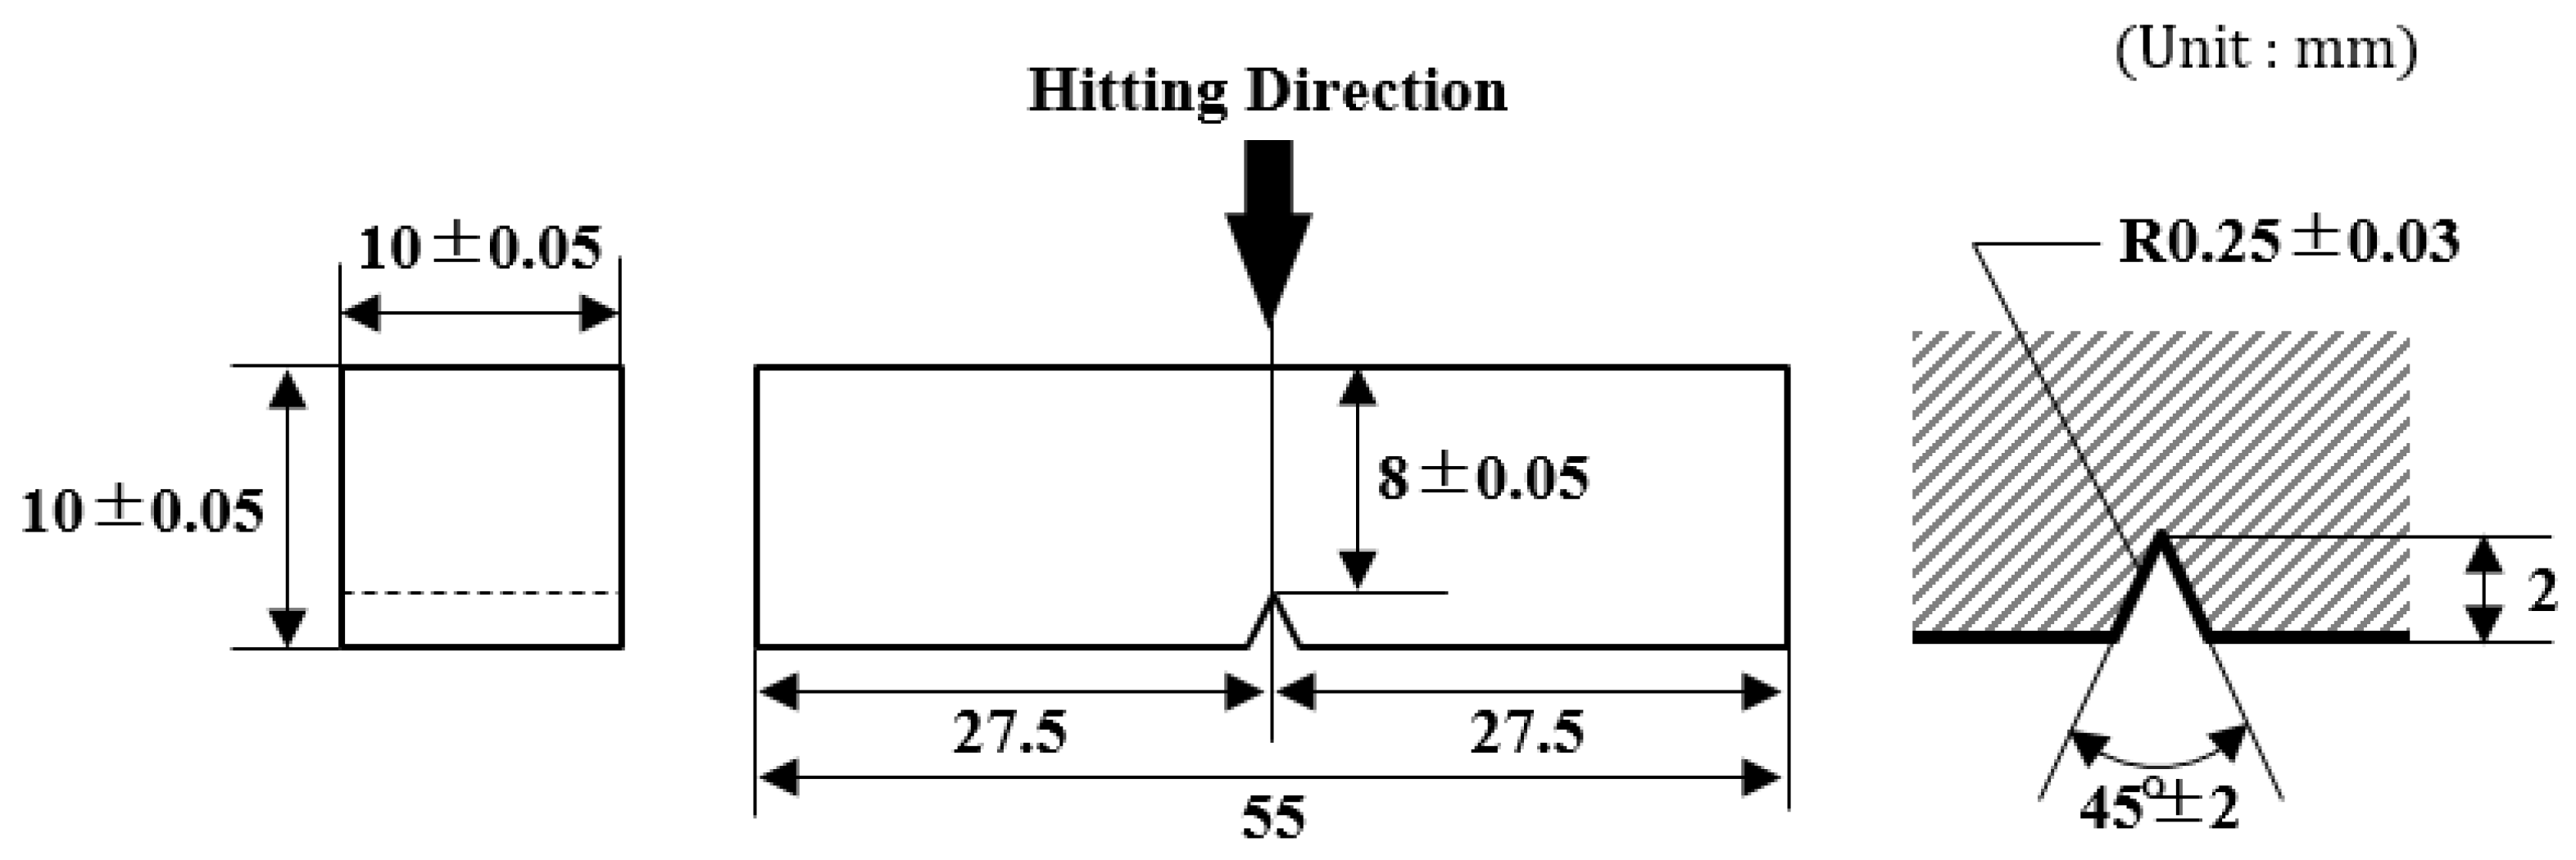
3.2. Measurement of Impact Energy
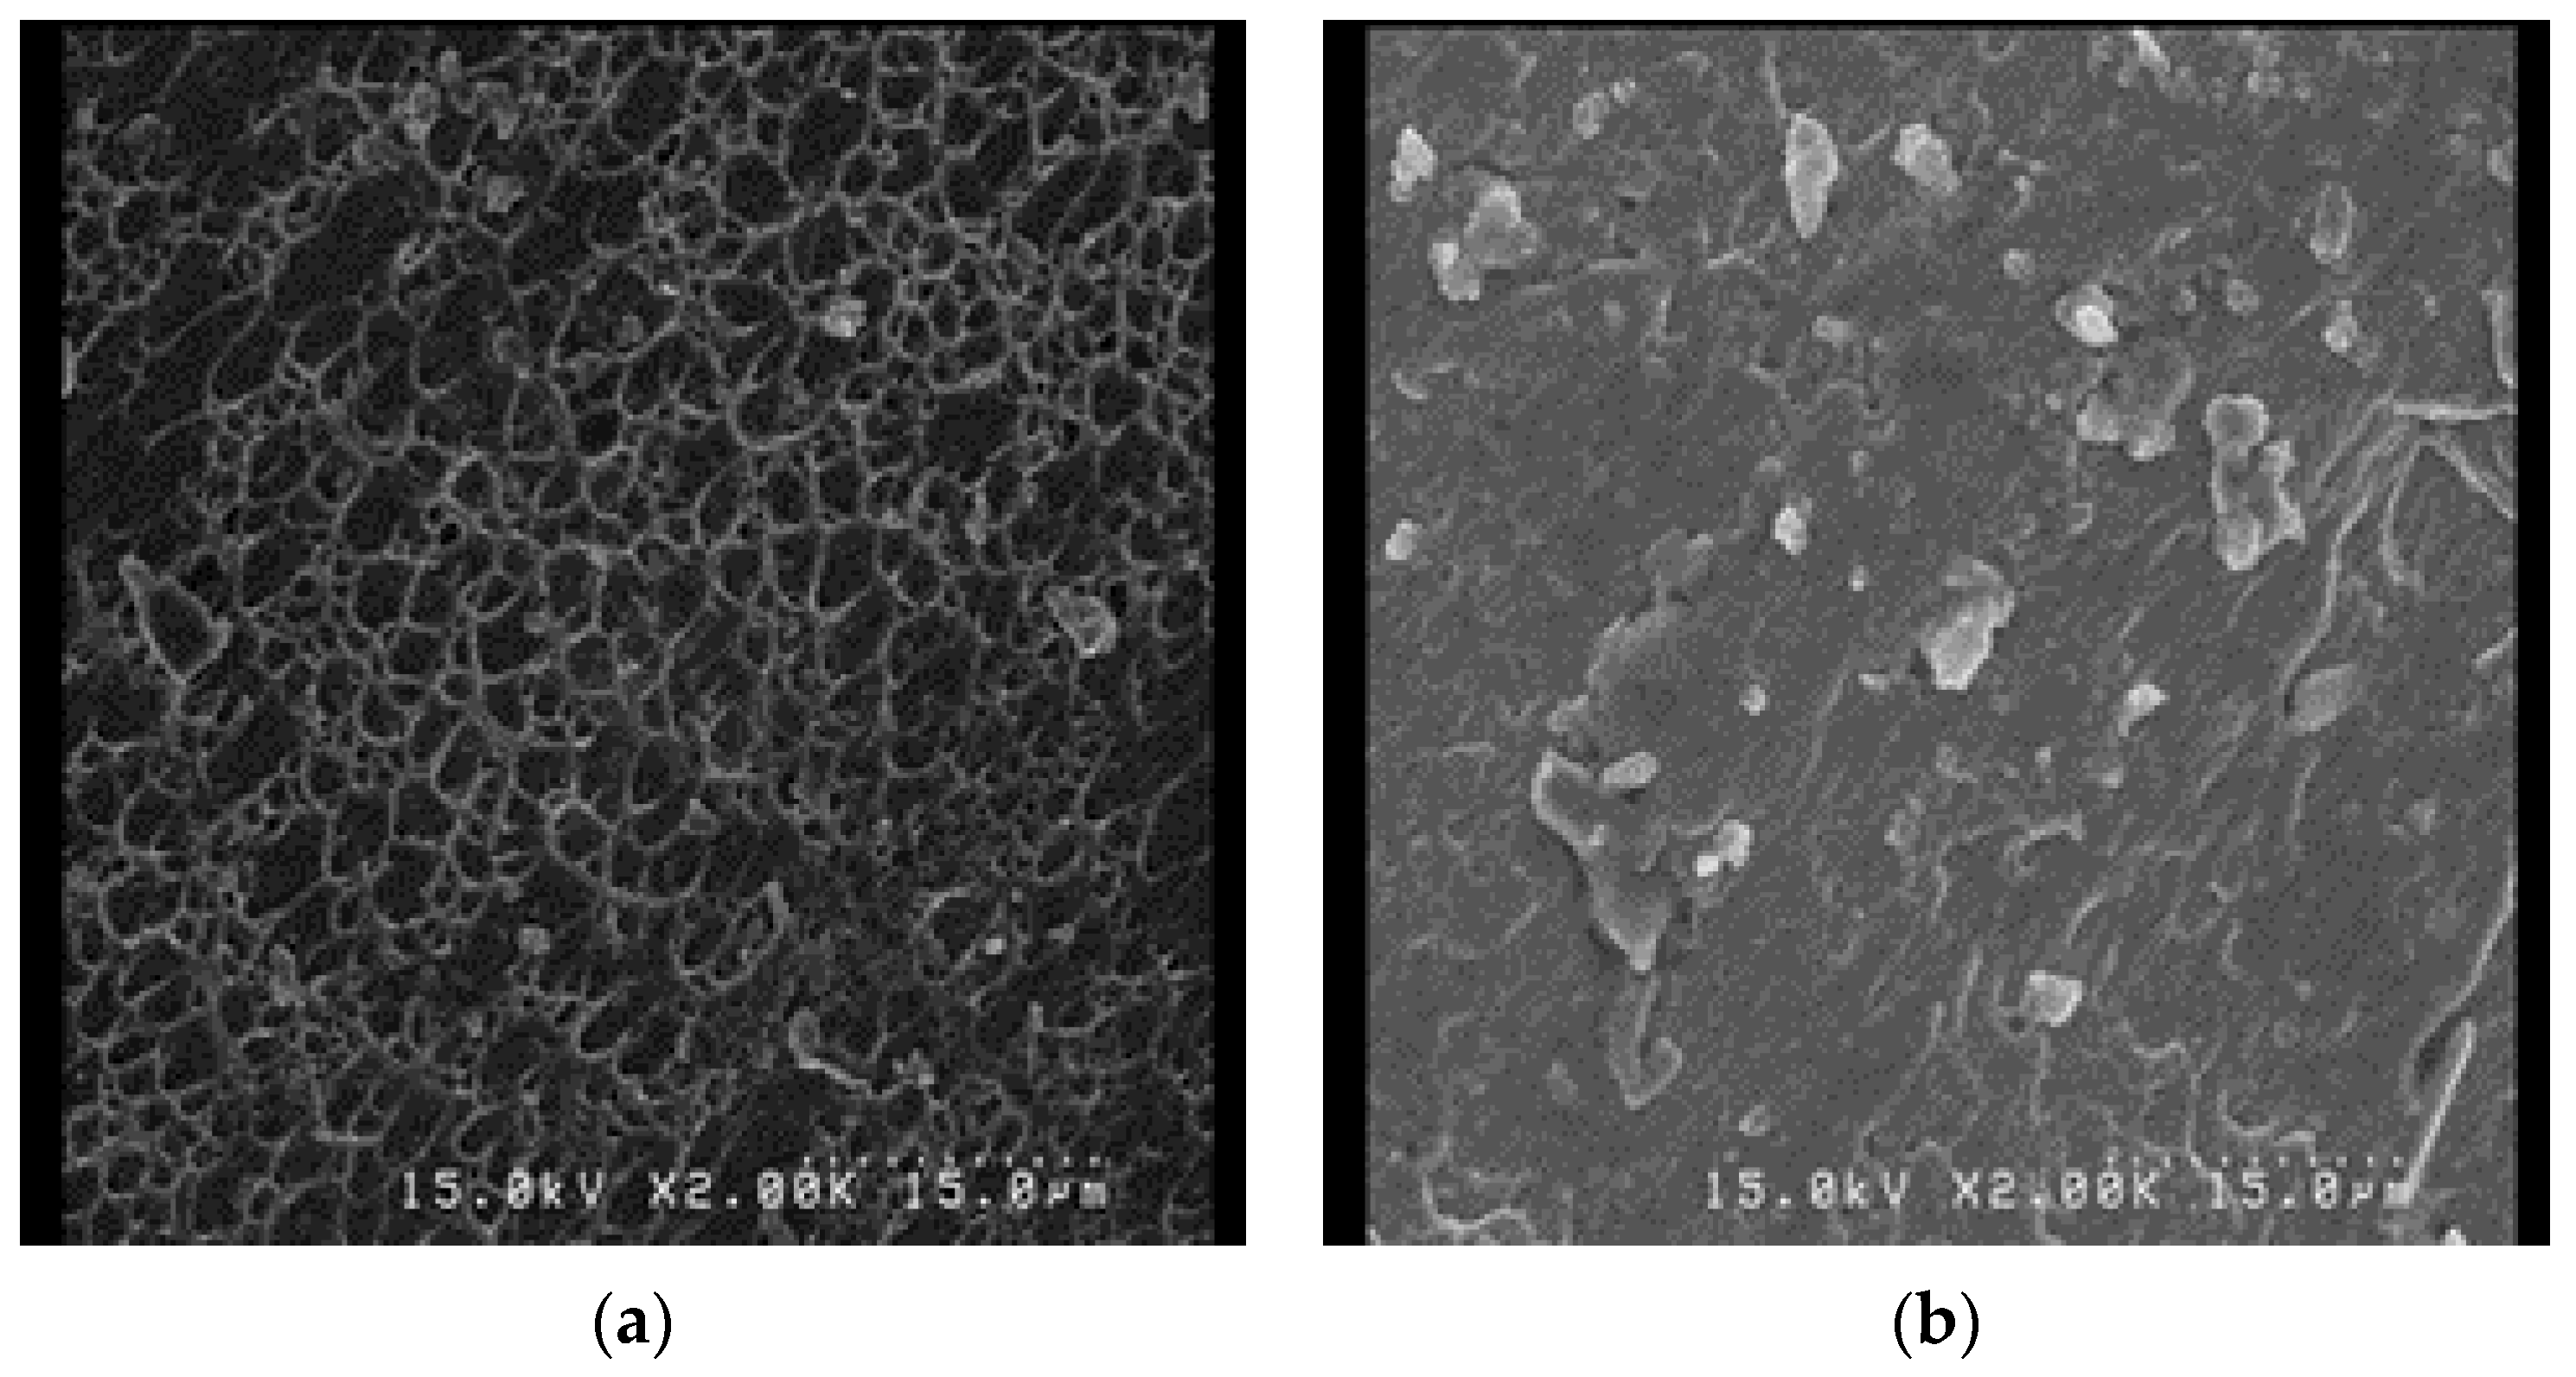
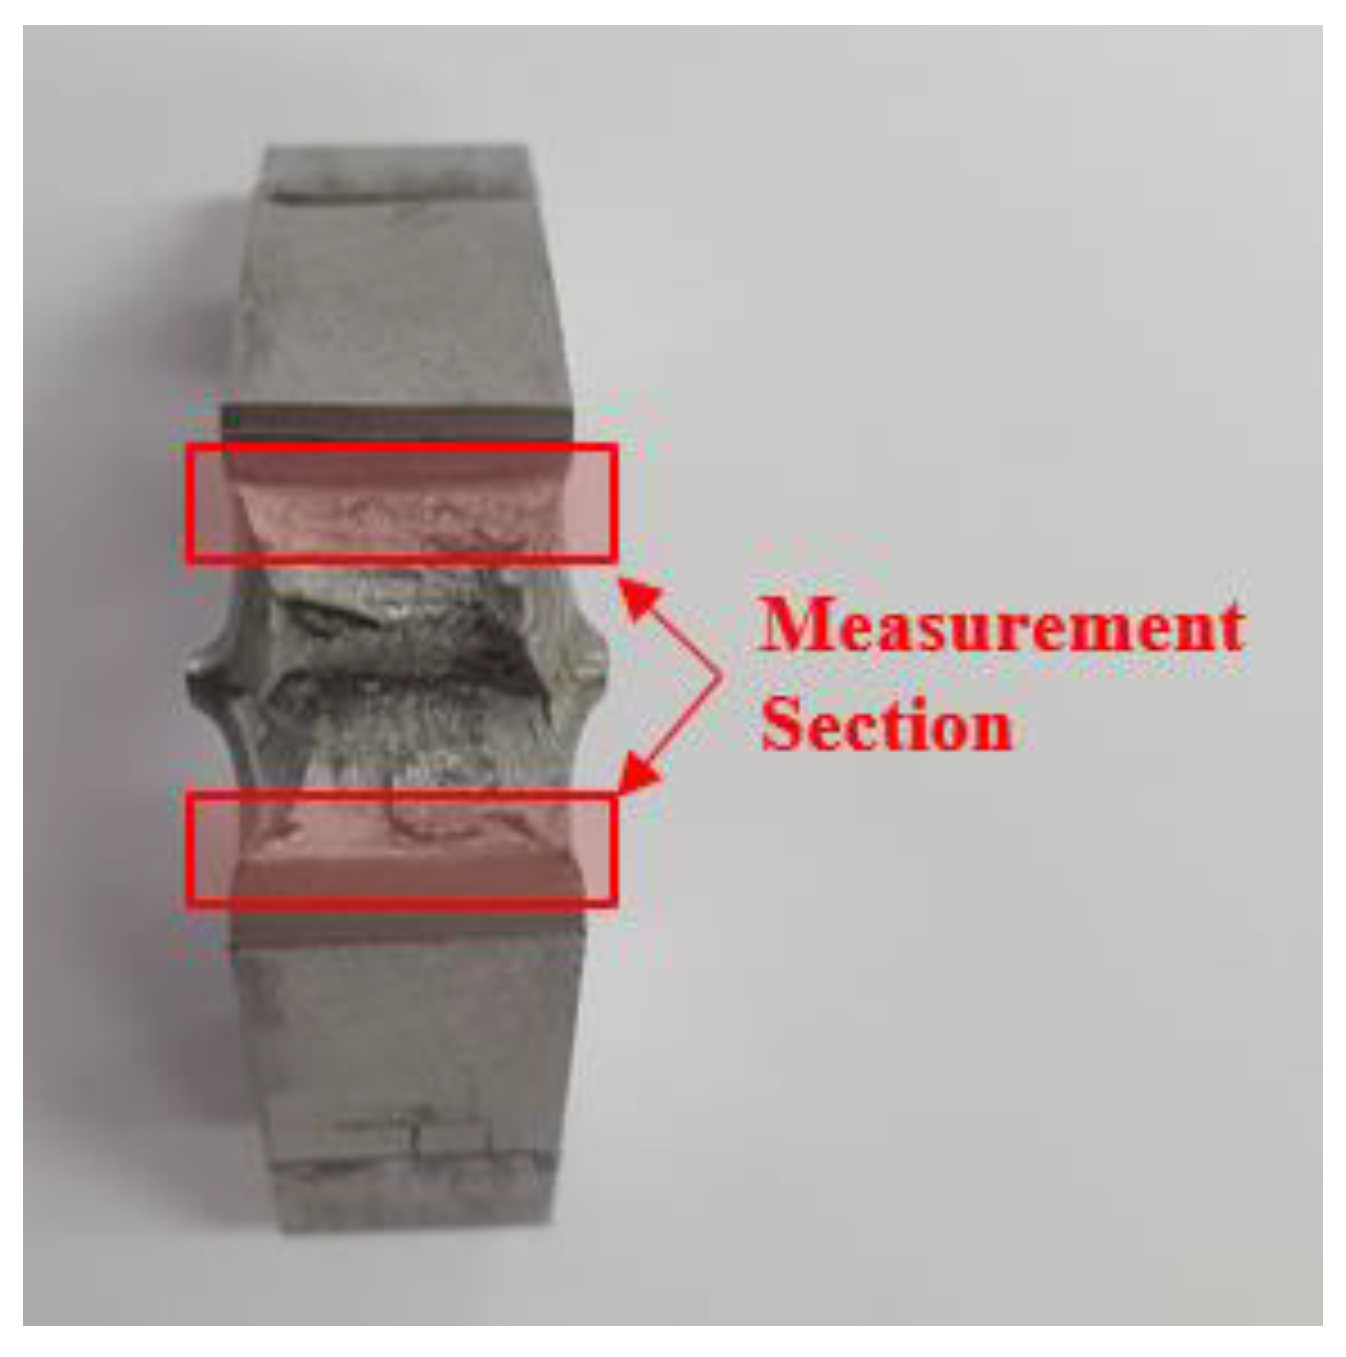
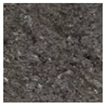
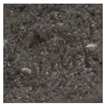
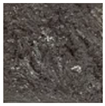
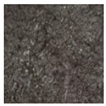
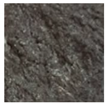
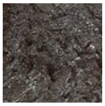
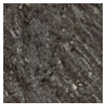
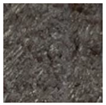
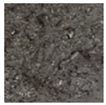
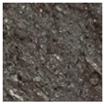
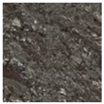
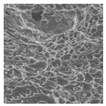
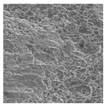
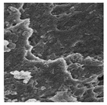
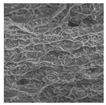
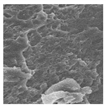
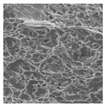
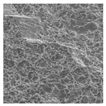
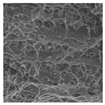
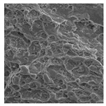
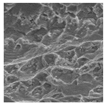
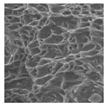
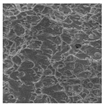
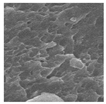
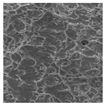
3.3. Analysis of Brittle Fracture of Heat-Affected Zone
4. Discussion
4.1. Brittle Fracture Behavior
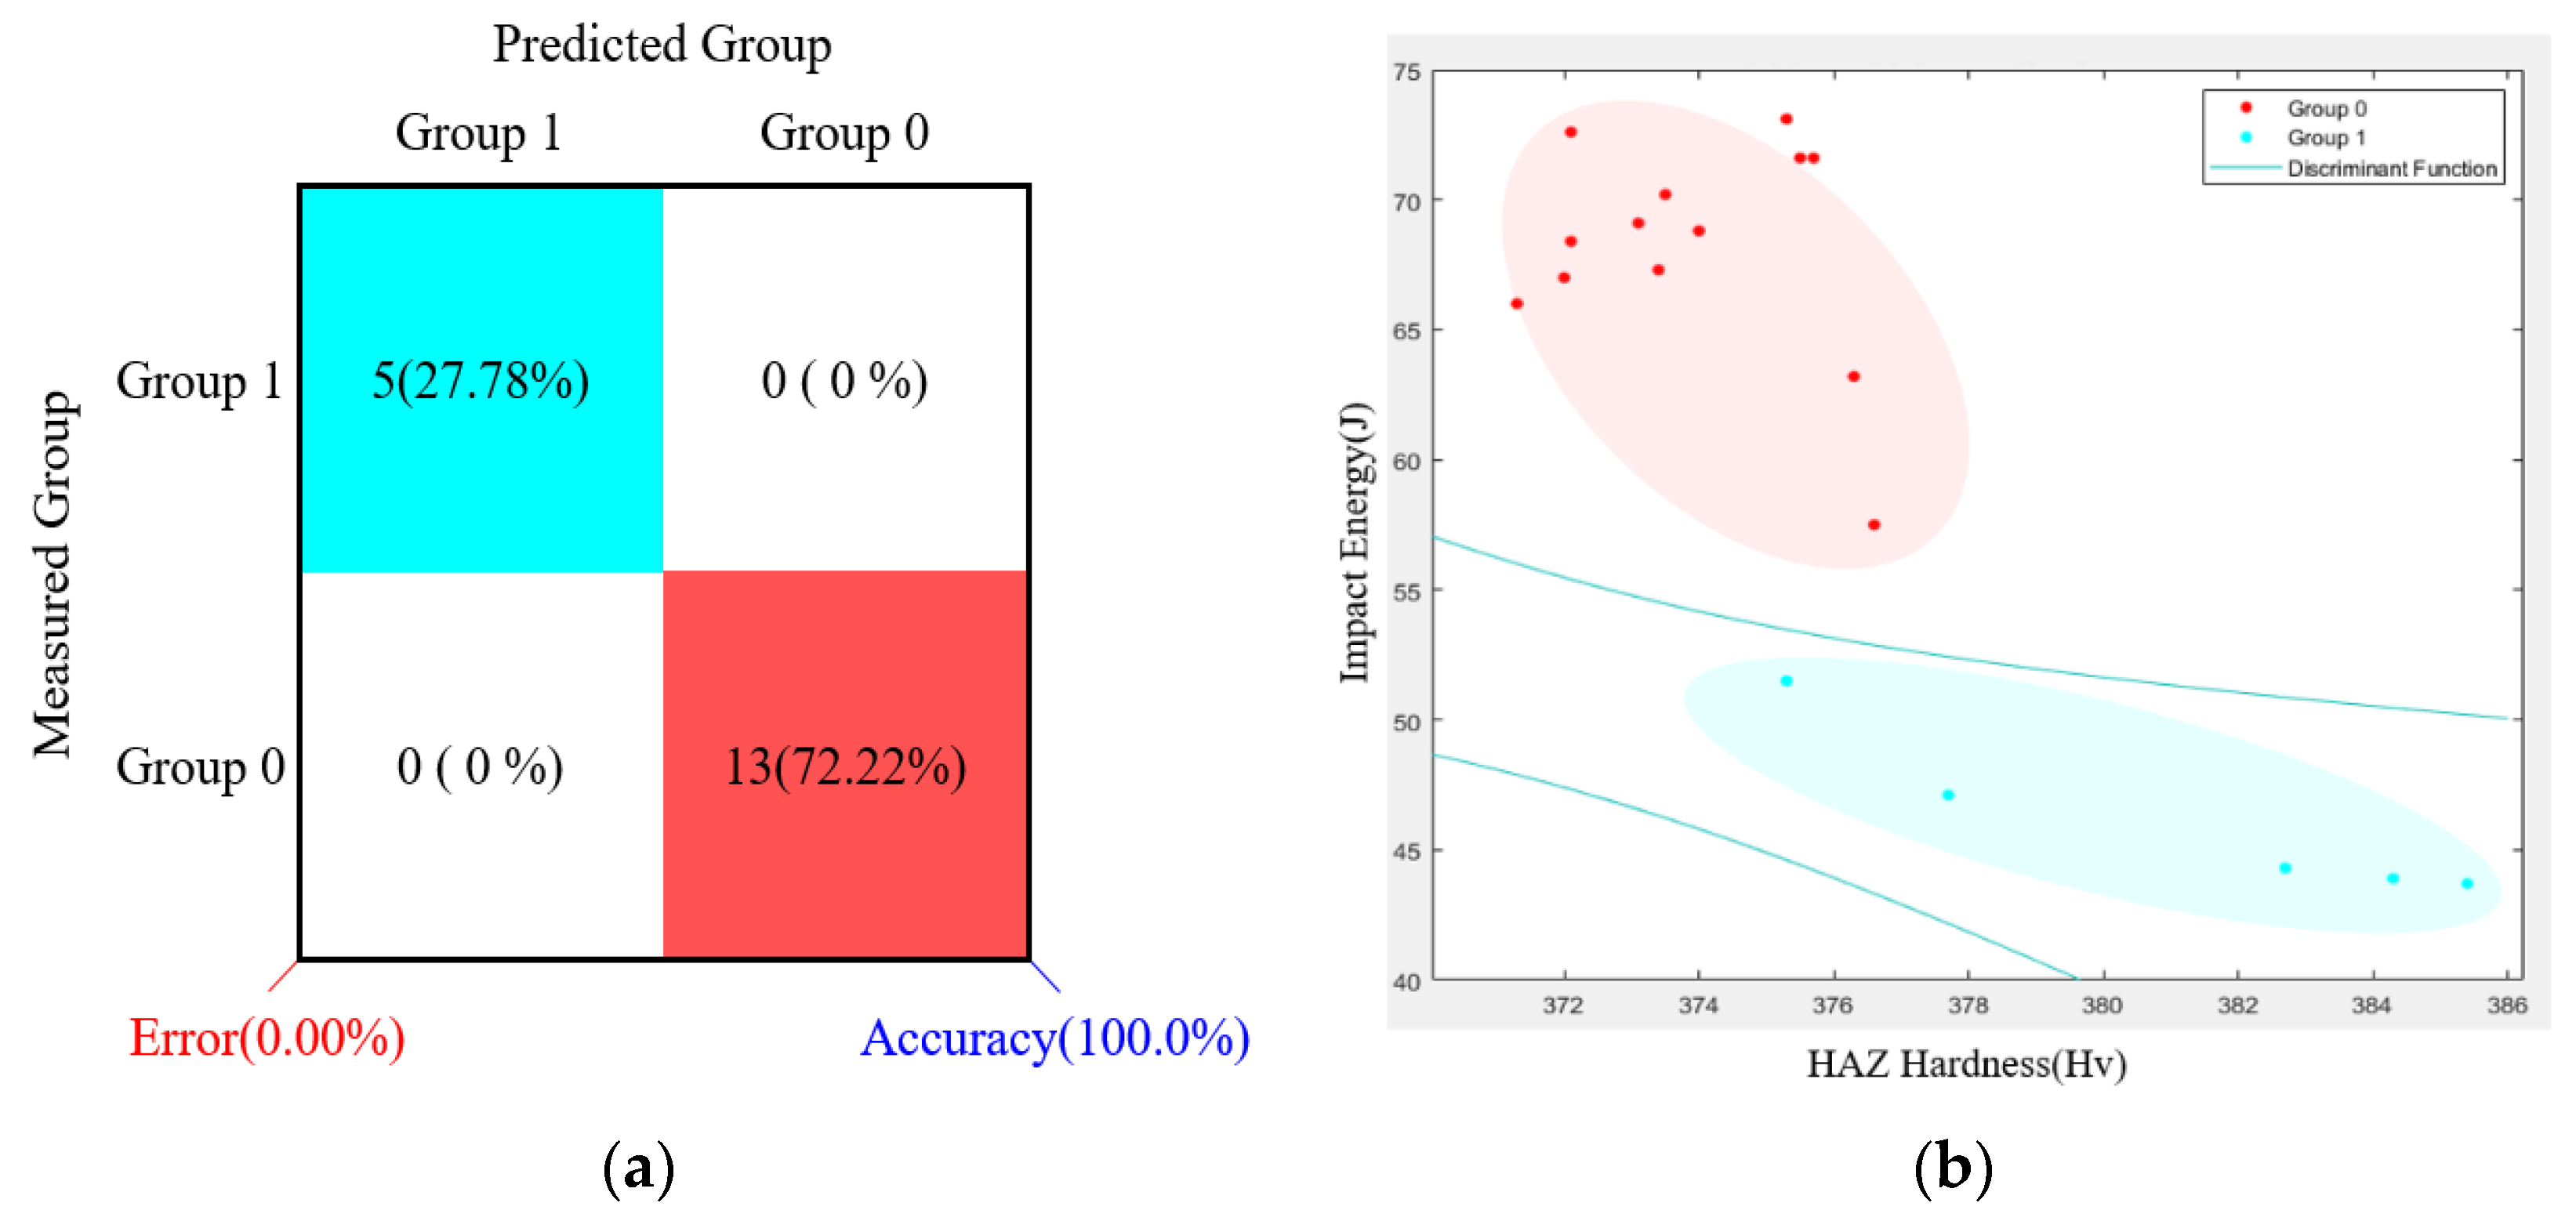
4.2. Discriminant Analysis
5. Optimization of Fiber Laser Welding of 9% Ni Steel
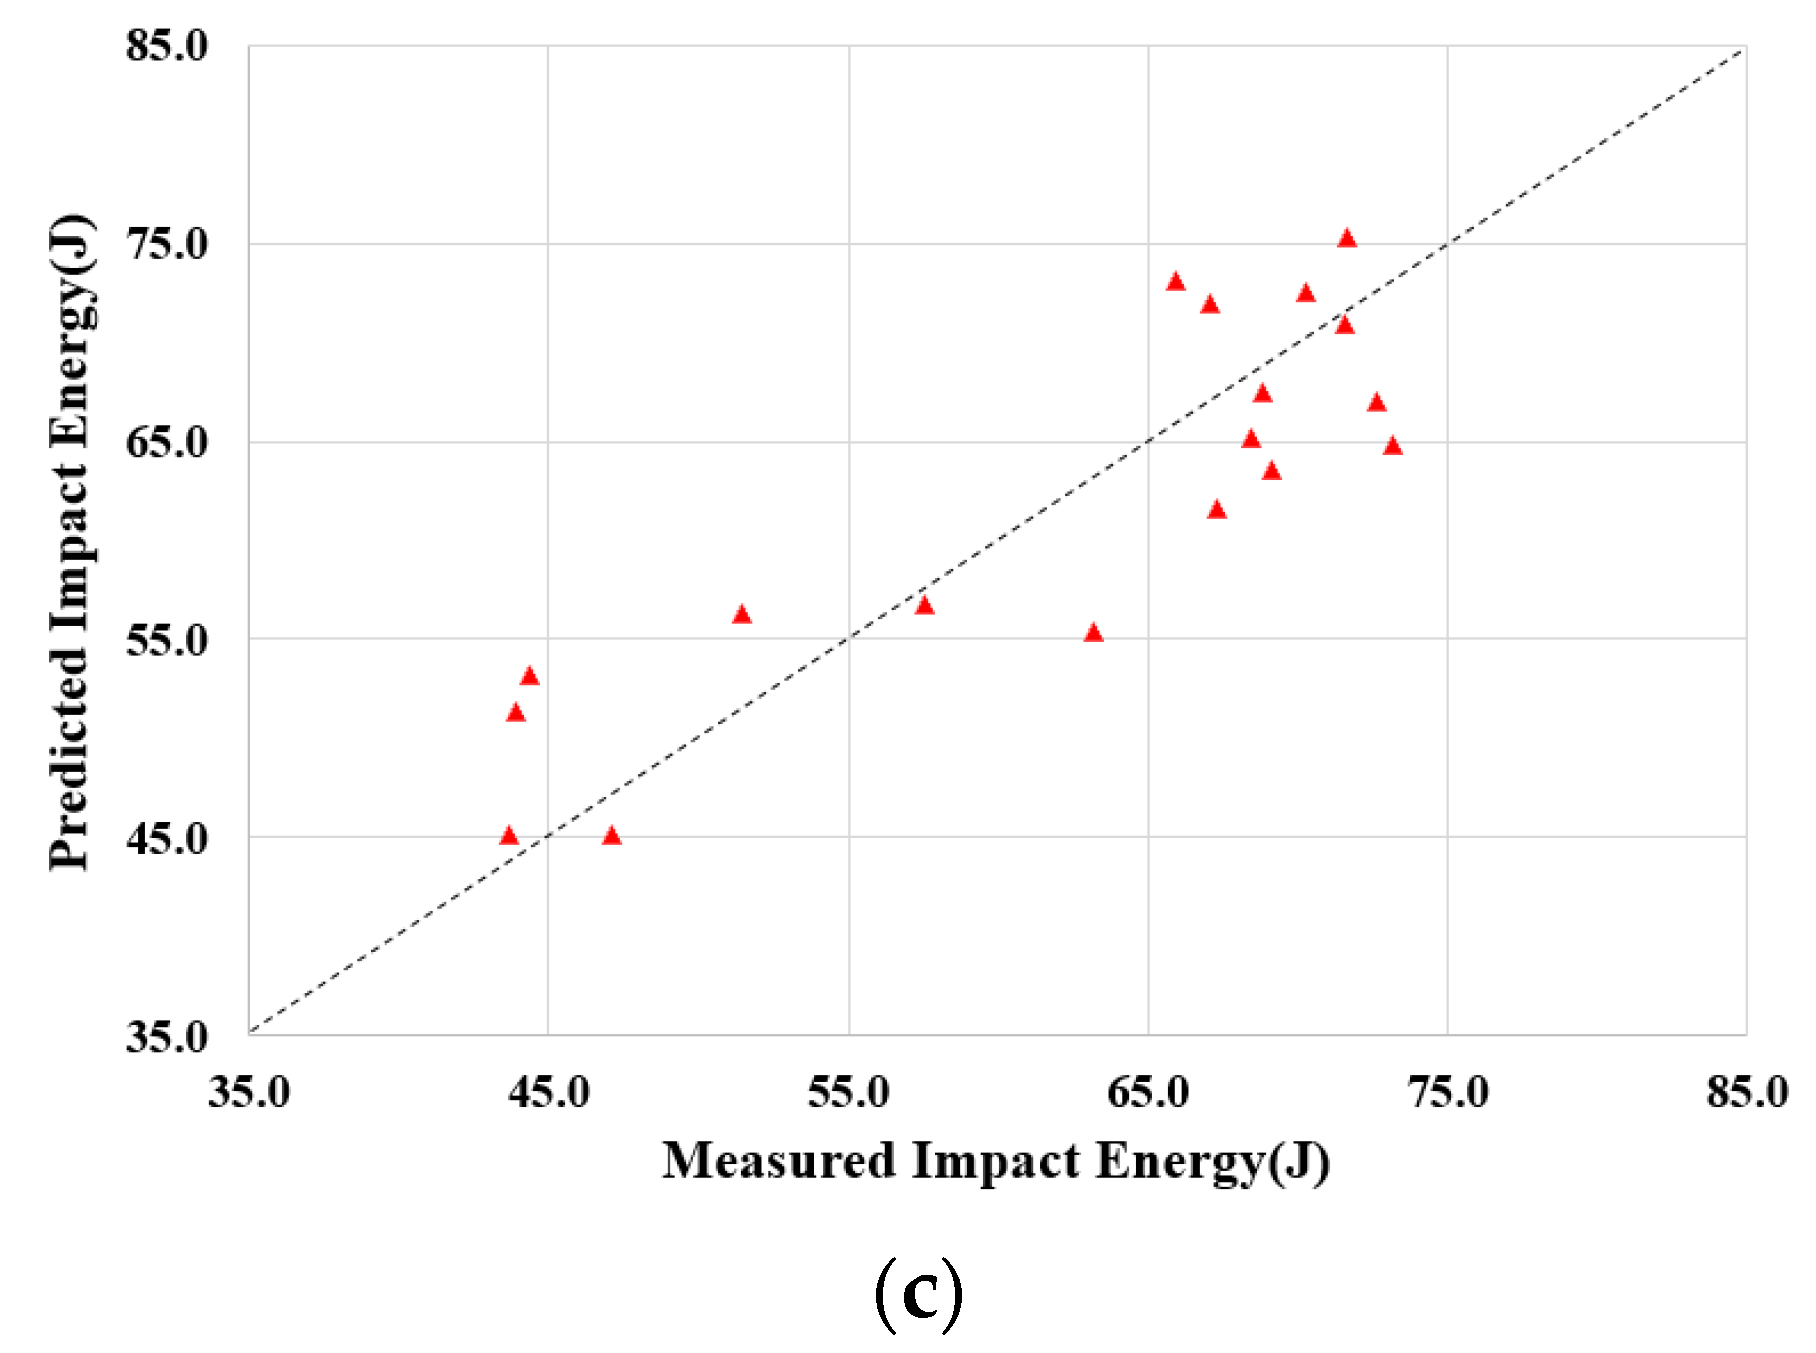
5.1. Development of Mathematical Model Welding Parameters
5.2. Optimization for Welding Process of 9% Ni Steel
6. Conclusions
- (1)
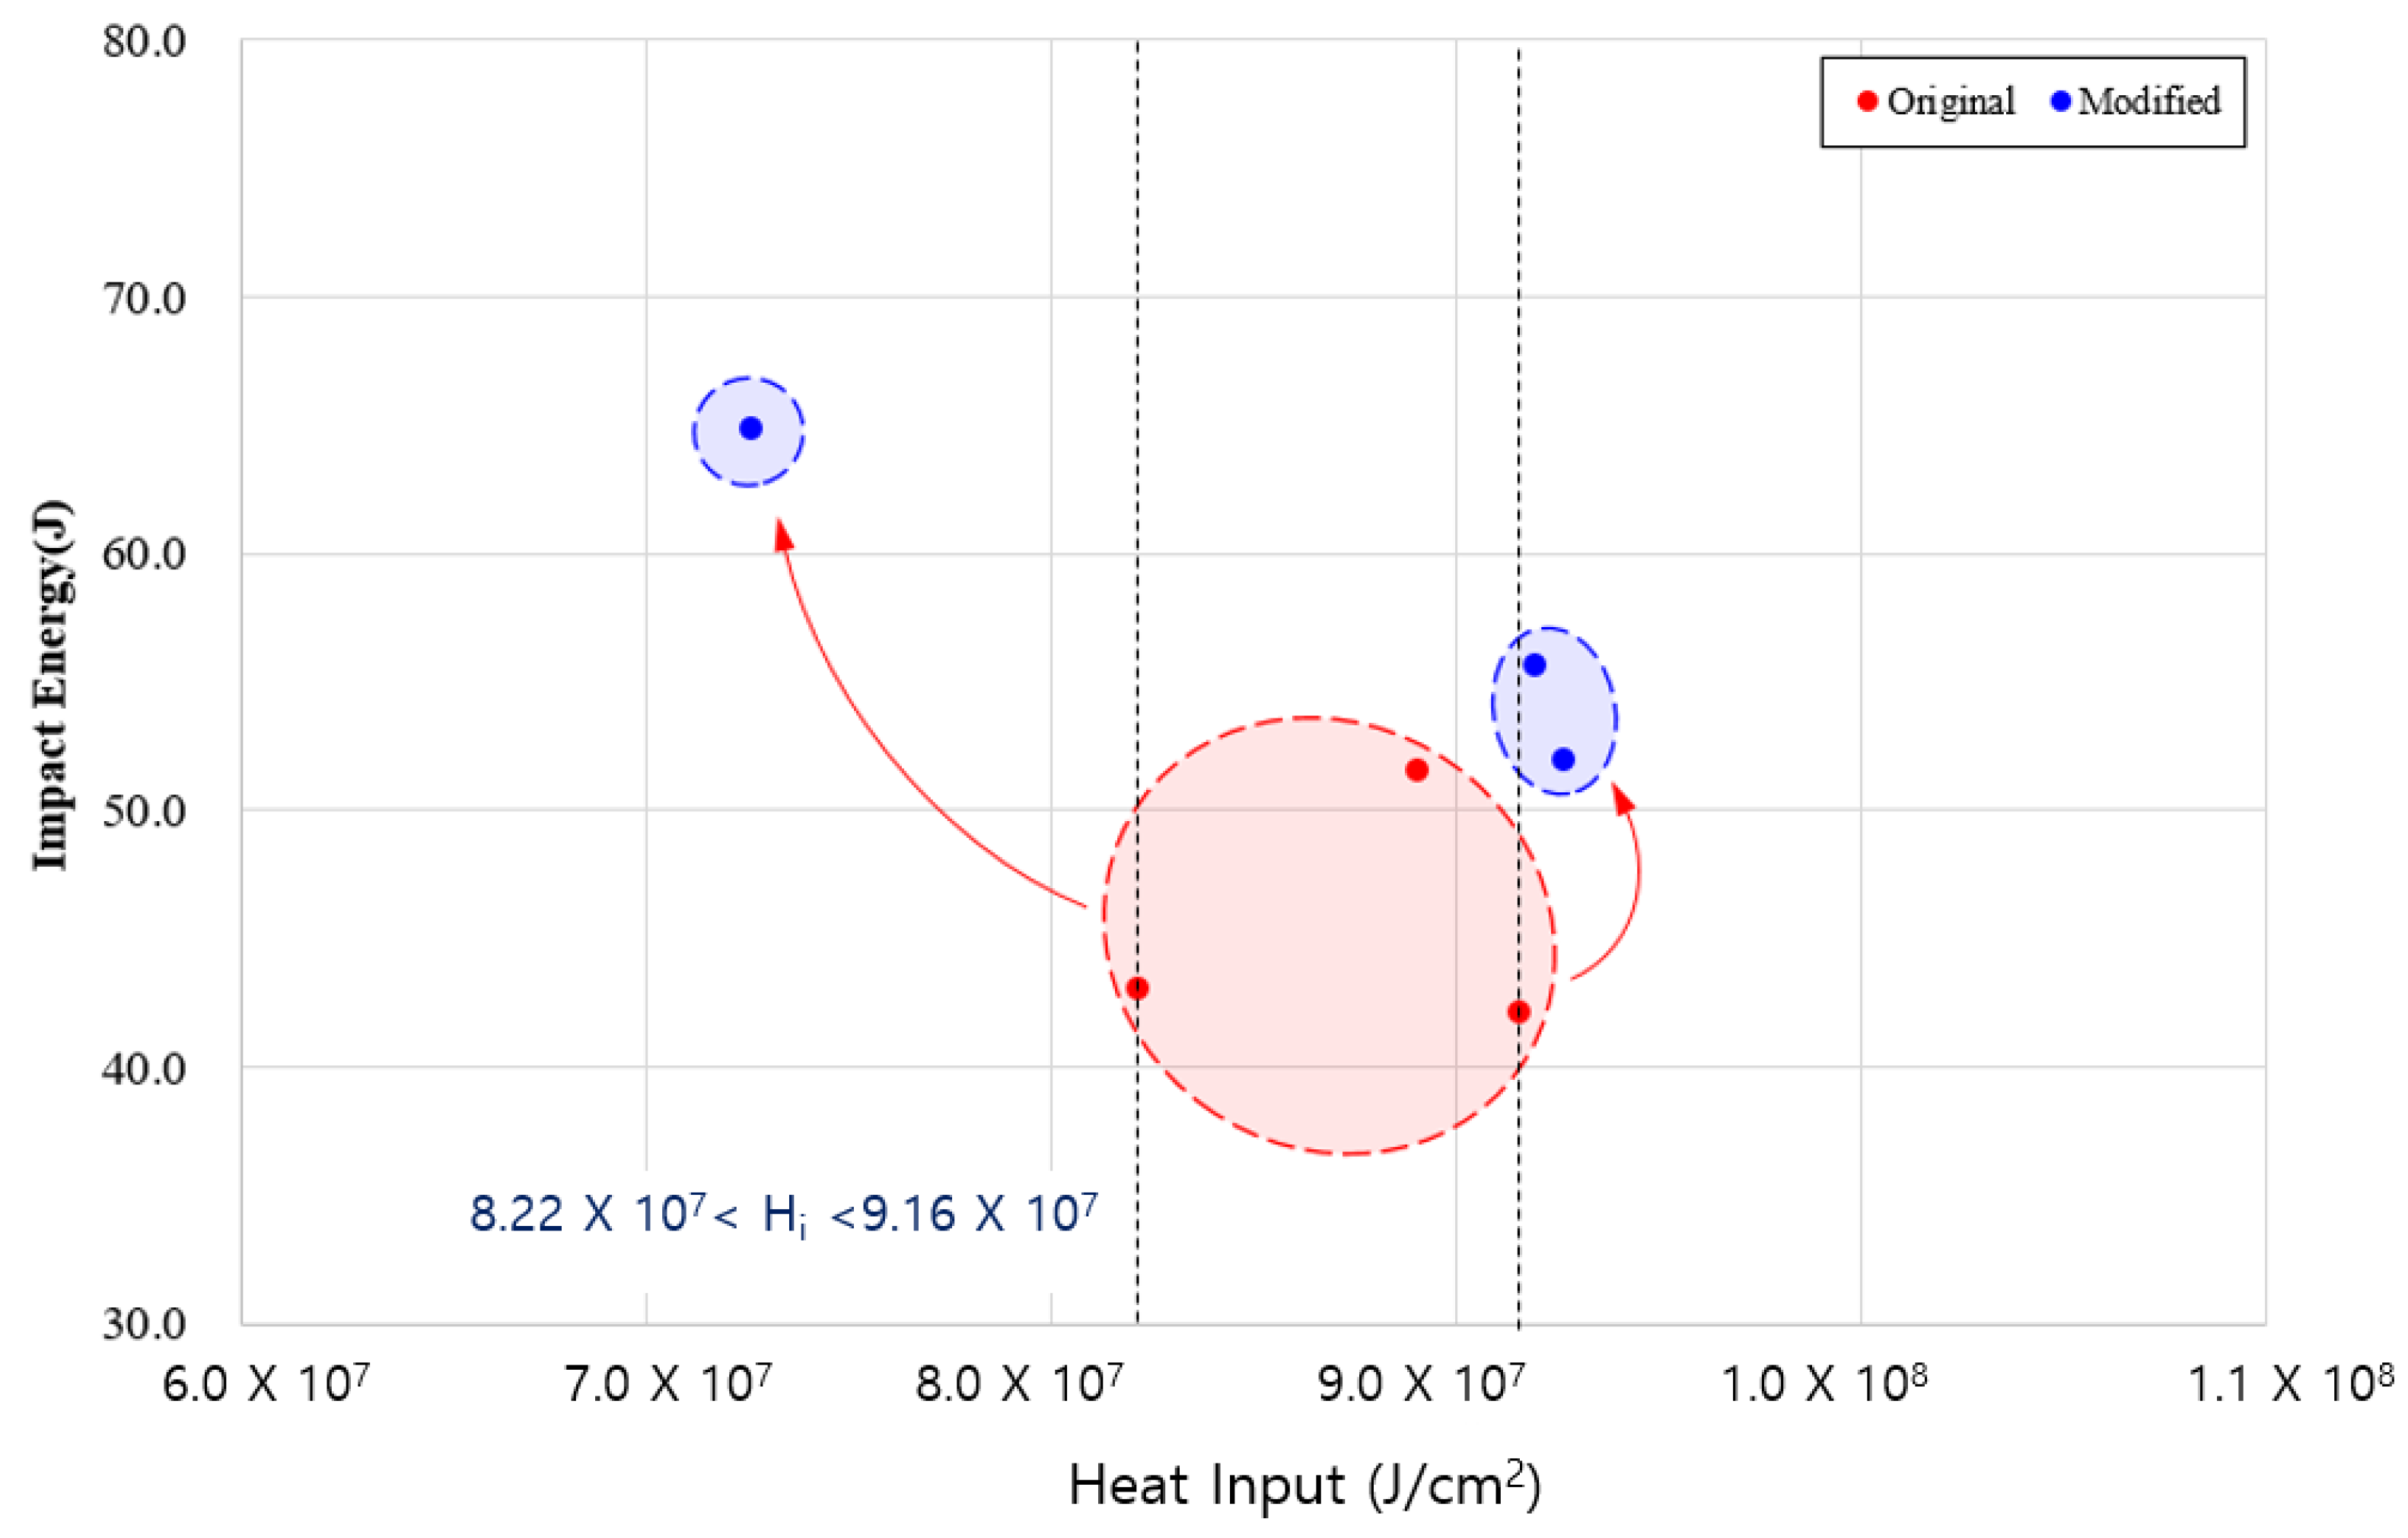
- An appropriate weld ability was verified by measuring the welding characteristics of a weld obtained from the fiber laser welding experiment, and it was established that the decrease in toughness occurred ((8.22 × 10⁷~9.16 × 10⁷) J/cm2) due to excessive heat input.
- (2)
- To determine the brittle fracture characteristics of 9% Ni steel according to the welding process variables and the amount of heat applied by a penetration shape, the data of the input and output variables of the welding process were learned through the SVM technique, and it was verified whether a brittle fracture group with deteriorated quality was accurately identified. As a result, it was confirmed that 100% of the group that determined the hardening of the weld could be identified using the learned system.
- (3)
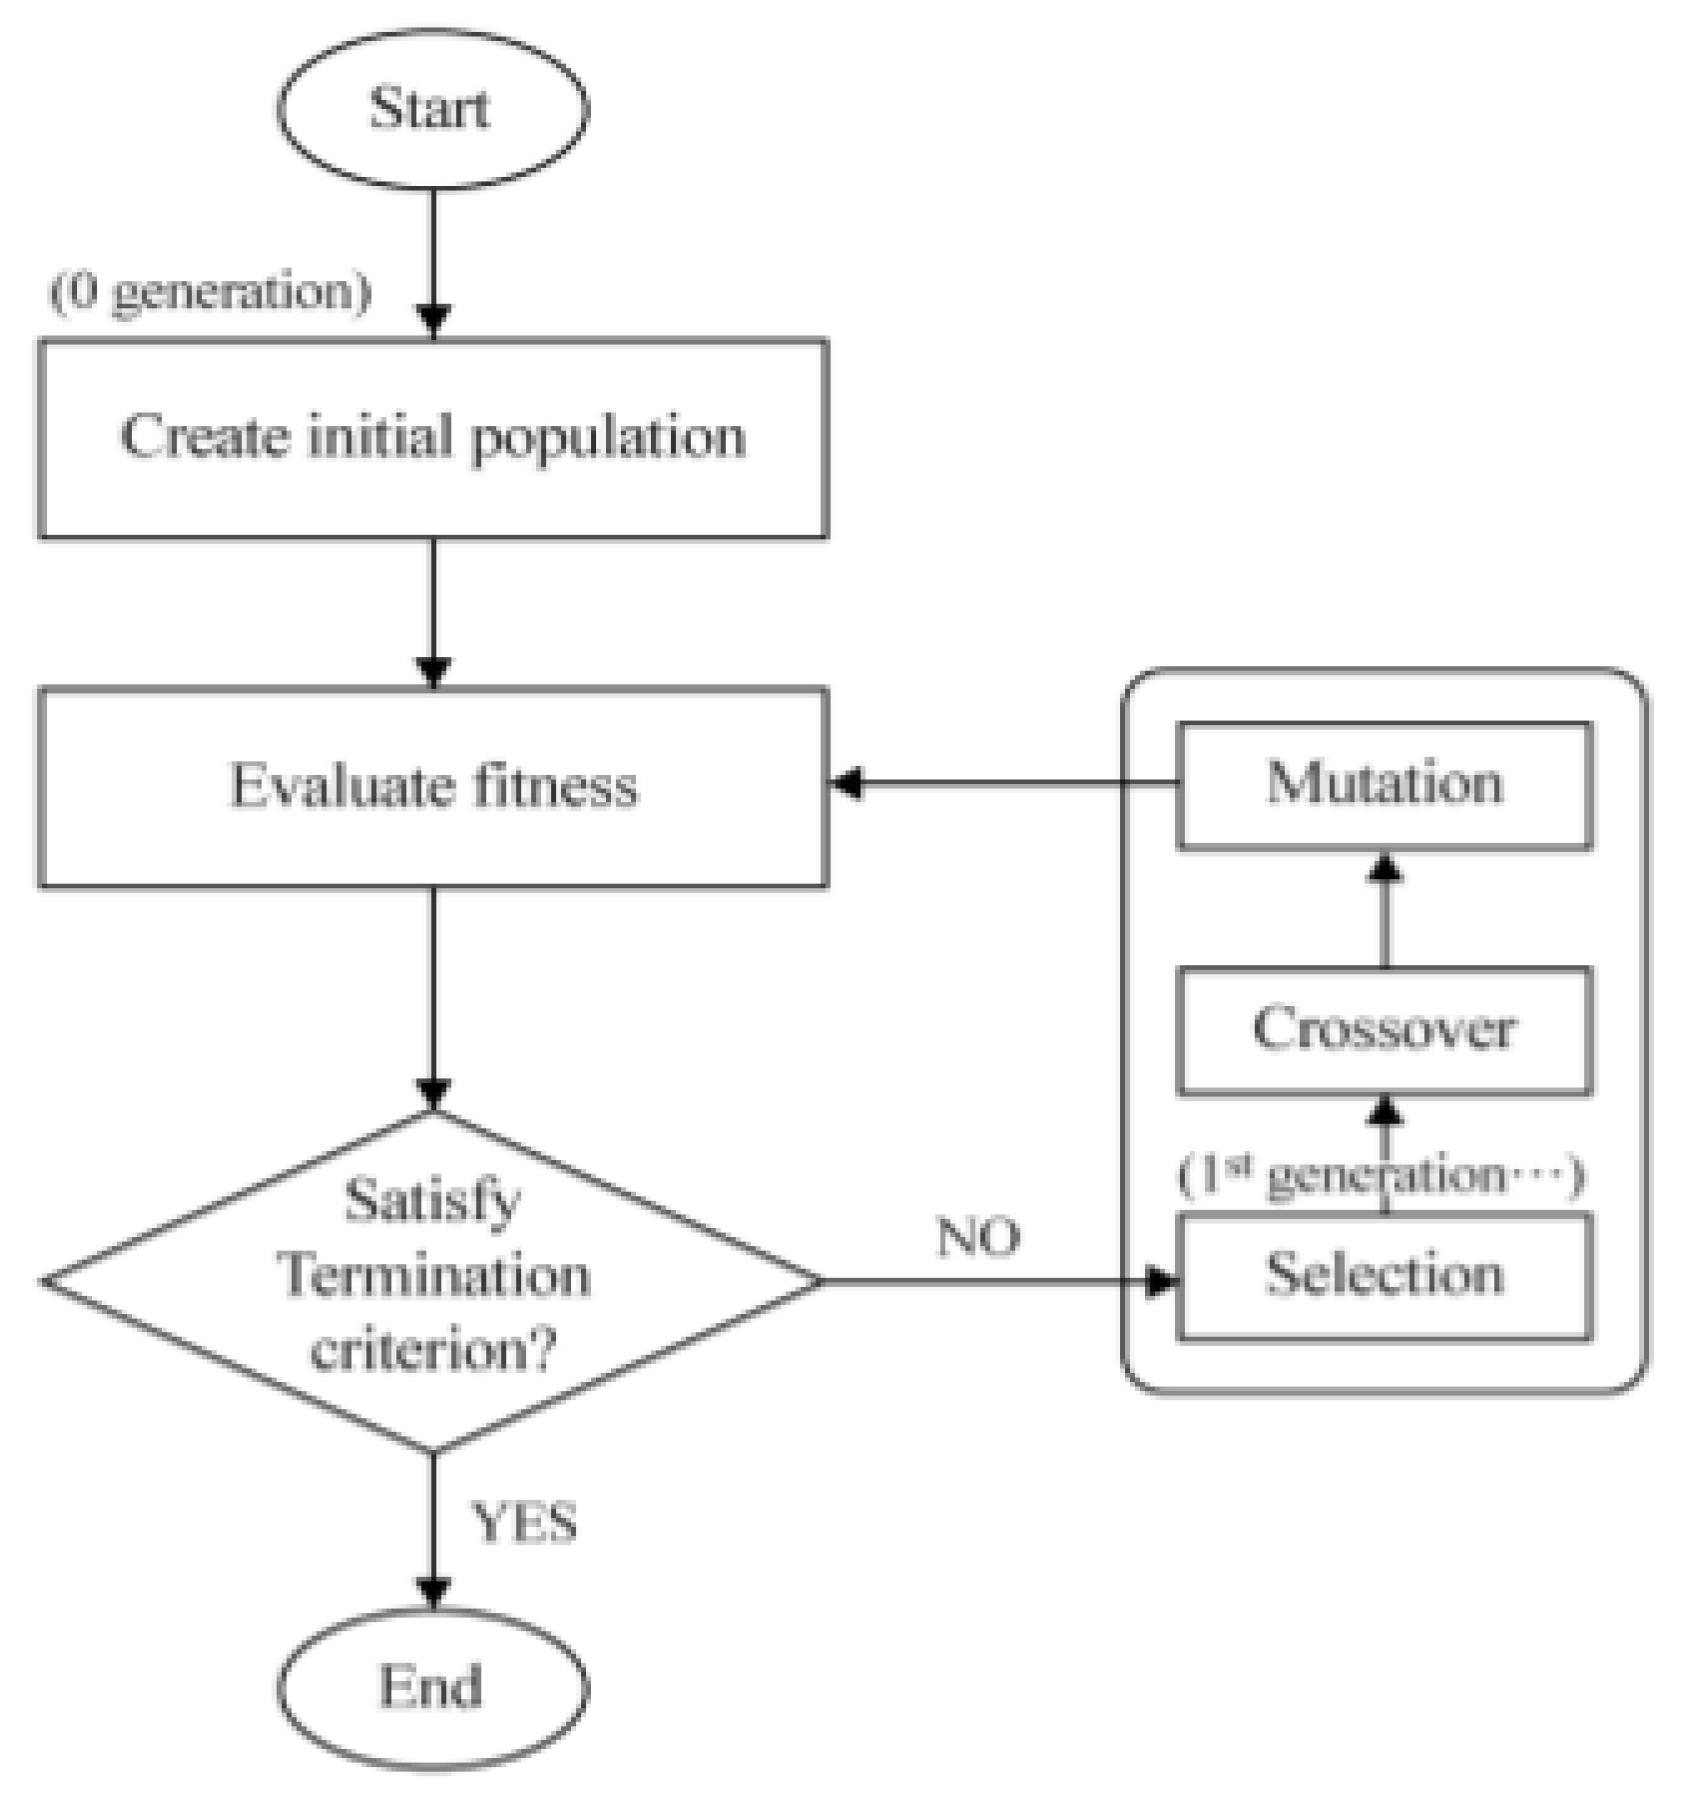
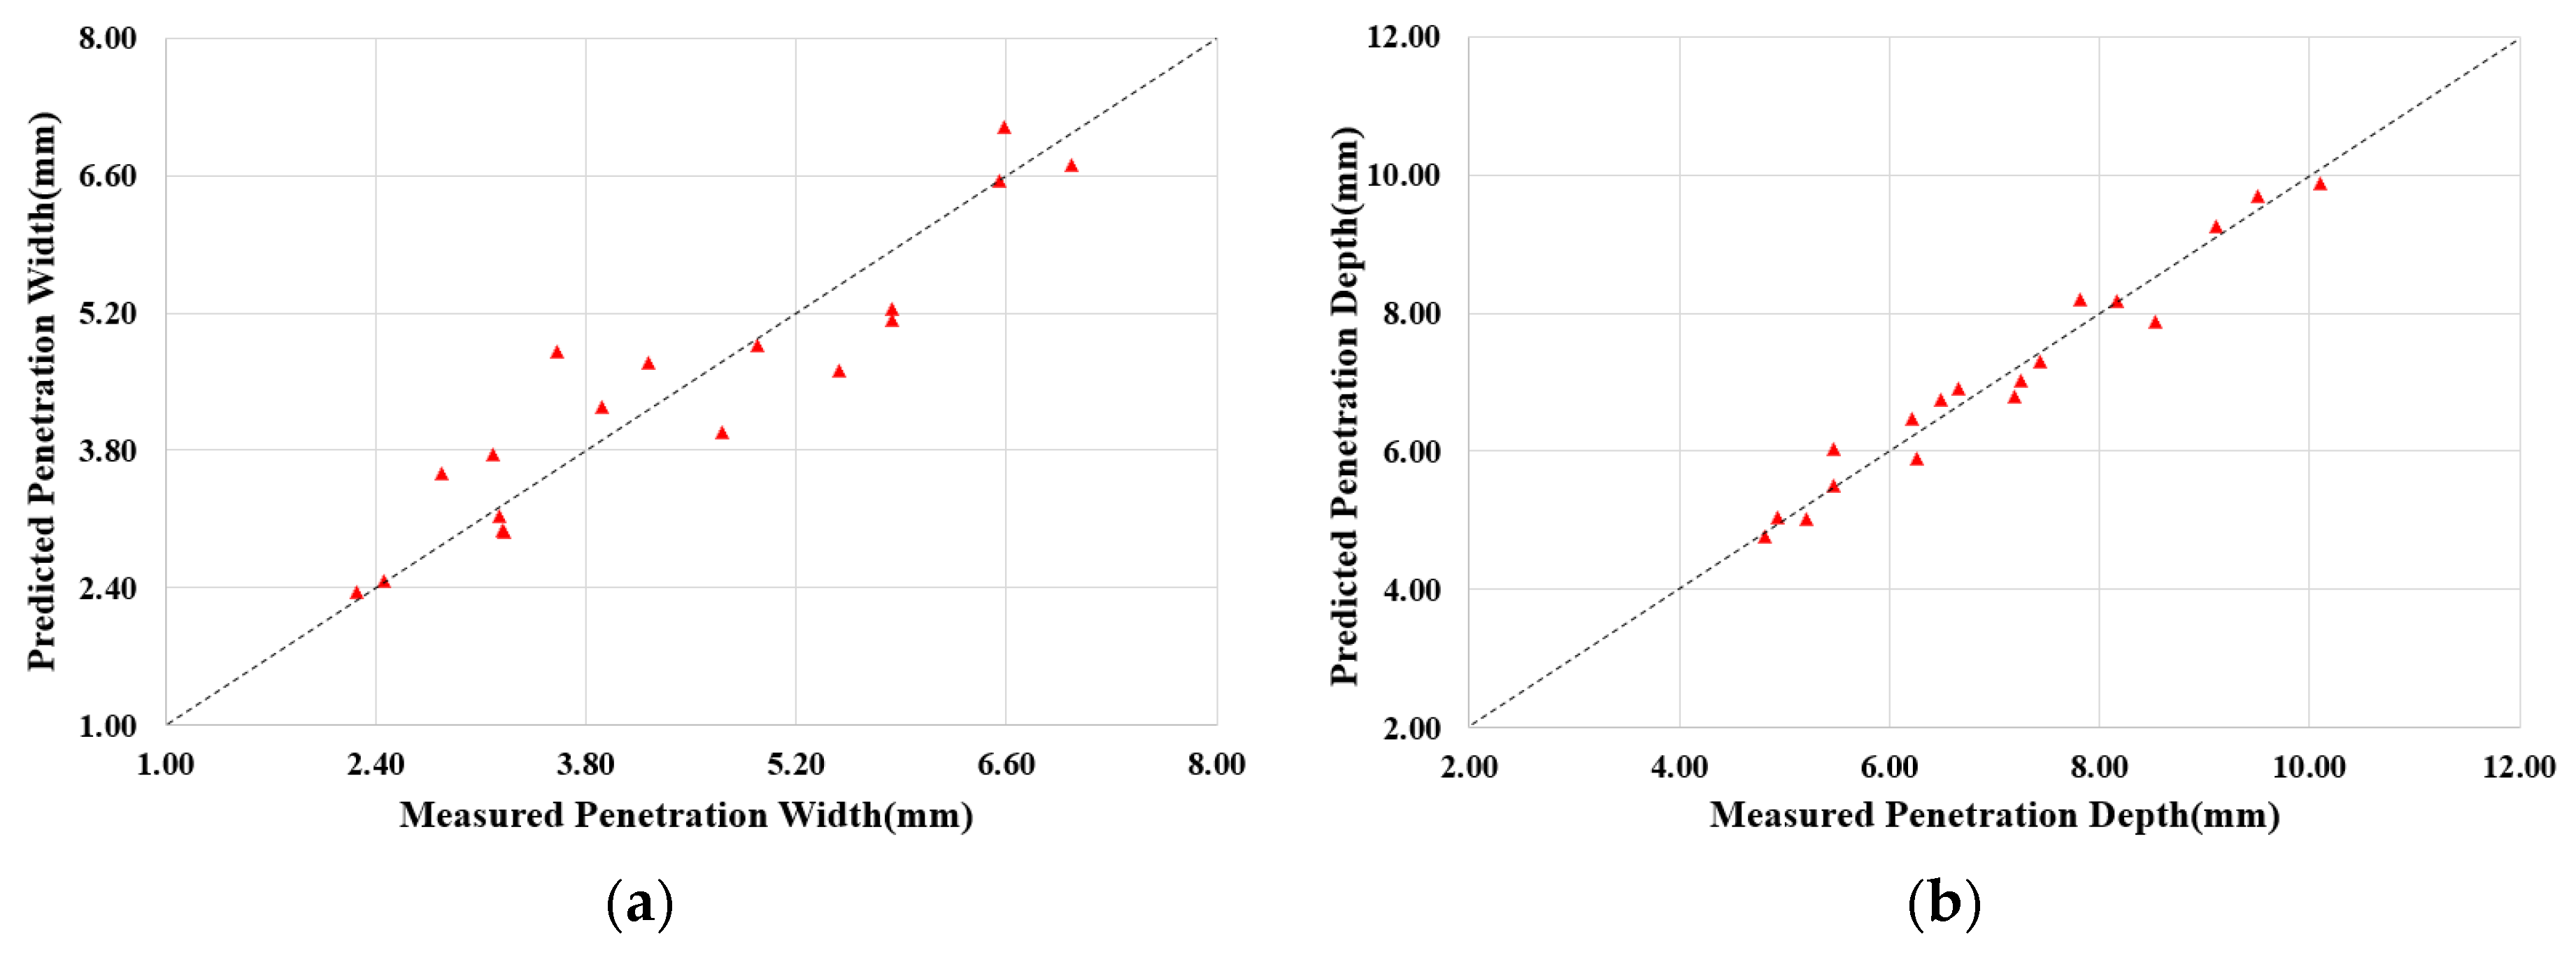
- To optimize the specific welding process parameters with which brittle fracture characteristics occur, a mathematical model that can predict the penetration shape and impact energy was developed and applied to a multipurpose optimization algorithm. After inputting the process variables in the three cases (test Nos. 4, 8, and 17) in which quality degradation occurs, the revised process variables were re-experimented. As a result, the condition for brittle fracture characteristics was eliminated by avoiding the limited heat input section in which the toughness decrease occurred.
Author Contributions
Funding
Institutional Review Board Statement
Informed Consent Statement
Data Availability Statement
Conflicts of Interest
References
- Assche, R. LNG Bunkering in Europe. Port of Rotterdam Authority. In Proceedings of the 3rd Annual LNG Bunkering Conference, Singapore, 29–31 July 2015. [Google Scholar]
- Schinas, O.; Butler, M. Feasibility and commercial considerations of LNG-fueled ships. Ocean Eng. 2016, 122, 84–96. [Google Scholar] [CrossRef]
- Unseki, T. Environmentally Superior LNG-Fueled Vessels. Mitsubishi Heavy Ind. Tech. Rev. 2013, 50, 37–43. [Google Scholar]
- Azzara, A.; Rutherford, D.; Wang, H. Feasibility of IMO annex VI Tier III implementation using selective catalytic reduction. Int. Counc. Clean Transp. 2014, 4, 1–9. [Google Scholar]
- Kim, J.H.; Shim, K.T.; Kim, Y.K.; Ahn, B.W. Fatigue Crack Growth Characteristics of 9% Ni Steel Welded Joint for LNG Storag Tank at Low Temperature. J. Weld. Join. 2010, 28, 537–542. [Google Scholar]
- Lee, S.H.; Lee, S.R.; Lee, Y.S. Interpretation for Band-Type Indication on Radiography of 9% Ni Steel Welds for LNG Storage Tanks. J. Korean Soc. Nondestruct. Test. 2010, 30, 479–483. [Google Scholar]
- Chang, W.S.; Kim, K.C.; Kim, Y.C.; Kim, S.R.; Kim, W.S. Ni alloy welding consumables for 9% Nickel steel. J. Korean Weld. Soc. 1998, 16, 25–37. [Google Scholar]
- R&B Inc. ASTM E23-07 Standard Test Methods for Notched Bar Impact Testing of Metallic Materials. Am. Soc. Test. Mater. 2007, 7, 1–6. [Google Scholar]
- Yun, T.J.; Oh, W.B.; Lee, B.R.; Lee, C.W.; Na, H.H.; Choi, J.S.; Kim, I.S. A Study on Optimization of Fillet in Laser Welding Process for 9% Ni Steel Using Gradient-Based Optimization Algorithm. J. Weld. Join. 2020, 38, 485–492. [Google Scholar] [CrossRef]
- Lee, S.H.; Lee, D.O.; Park, K.S.; Jeon, H.C.; Kim, S.T.; Park, J.U. Laser Welding Deformation Control of STS304 Cylindrical Steel Sheet Structure. J. Weld. Join. 2020, 38, 521–527. [Google Scholar] [CrossRef]
- Go, B.S.; You, H.Y.; Bang, H.S.; Kim, C.H. Penetration Depth Modeling and Process Parameter Maps for Laser Welds Using Machine Learning. J. Weld. Join. 2021, 39, 392–401. [Google Scholar] [CrossRef]
- Welding and bonding hand book—Process and thermal processing. Int. J. Korean Weld. Soc. 2007, 3, 26–33.
- El-Shabasy, A.; Lewandowski, J. Effects of load ratio, R, and test temperature on fatigue crack growth of fully pearlitic eutectoid steel (fatigue crack growth of pearlitic steel). Int. J. Fatigue 2004, 26, 305–309. [Google Scholar] [CrossRef]
- Yoon, Y.K.; Kim, J.H.; Shim, K.T. Mechanical Characteristics of 9% Ni Steel Welded Joint for LNG Storage Tank at Cryogenic. Int. J. Mod. Phys. Con. Ser. 2012, 6, 355–360. [Google Scholar] [CrossRef]
- Macek, K. Fracture Surface Formation of Notched 2017A-T4 Aluminium Alloy under Bending Fatigue. Int. J. Fract. 2022, 234, 141–157. [Google Scholar] [CrossRef]
- Tang, W.; Wang, Y. Fractal Characterization of Impact Fracture Surface of Steel. Appl. Surf. Sci. 2012, 258, 4777–4781. [Google Scholar] [CrossRef]
- Ai, Y.; Liu, X.; Huang, Y.; Yu, L. Numerical analysis of the influence of molten pool instability on the weld formation during the high speed fiber laser welding. Int. J. Heat Mass Transfer 2020, 160, 120103. [Google Scholar] [CrossRef]
- Ai, Y.; Yu, L.; Huang, Y.; Liu, X. The investigation of molten pool dynamic behaviors during the “∞” shaped oscillating laser welding of aluminum alloy. Int. J. Therm. Sci. 2022, 173, 1073507. [Google Scholar] [CrossRef]
- Kim, Z.H. A Comparative Study of Classification Techniques Using Forest Cover Type Data: Discriminant Analysis, Logistic Regression, Neural Network, Decision Tree. Unpublished. Master’s Thesis, Chung-Ang University, Seoul, Korea, 2012. [Google Scholar]
- Amrine, D.E.; White, B.J.; Larson, R.L. Comparison of classification algorithms to predict outcomes of feedlot cattle identified and treated for bovine respiratory disease. Comput. Electron. Agric. 2014, 105, 9–19. [Google Scholar] [CrossRef] [Green Version]
- Knowles, J.D.; Corne, D.W. Approximating the nondominated front using the pareto archived evolution strategy. Evol. Comput. 2000, 8, 149–172. [Google Scholar] [CrossRef]
- Vapnik, V.N. The Nature of Statistical Learning Theory; Springer: Berlin/Heidelberg, Germany, 1999. [Google Scholar]
- Rheem, I.S.; Rheem, S.S. Response Surface Analysis of the Experimental Data from a Cubic Central Composite Design in the Presence of the Lack of Fit of the Second-Order Polynomial Regression Model. J. Korean Data Anal. Soc. 2020, 22, 121–129. [Google Scholar] [CrossRef]
- Kim, Y.G. Evolutionary Algorithms; Chonnam National University Press: Gwangju, Korea, 2011. [Google Scholar]
- Deb, K.; Agrawal, S.; Pratap, A.; Meyarivan, T. A fast elitist non-dominated sorting genetic algorithm for multi-objective optimization: NSGA-II. Lect. Notes Comput. Sci. 2000, 1917, 849–858. [Google Scholar]
- Zitzler, E.; Deb, K.; Thiele, L. Comparison of multiobjective evolutionary algorithms: Empirical results. Evol. Comput. 2000, 8, 173–195. [Google Scholar] [CrossRef] [PubMed] [Green Version]
- Veldjuizen, D.A.V.; Lamont, G.B. On measuring multiobjective evolutionary algorithm performance. Evol. Comput. 2000, 1, 204–211. [Google Scholar]
- Deb, K.; Pratap, A.; Agarwal, S.; Meyarivan, T.A. A fast and elitist multi objective genetic algorithm: NSGA-II. IEEE Trans. Evol. Comput. 2002, 6, 182–197. [Google Scholar] [CrossRef] [Green Version]


| Steel | C | Si | Mn | S | P | Ni | Fe |
|---|---|---|---|---|---|---|---|
| A553-1 | 0.05 | 0.67 | 0.004 | 0.003 | 0.25 | 9.02 | Bal. |
| Steel | Yield Strength (MPa) | Tensile Strength (MPa) | Elongation (%) | Hardness (HV) |
|---|---|---|---|---|
| A553-1 | 651.6 | 701.1 | 26.6 | 243 |
| Test No. | Laser Power (kW) | Defocusing (mm) | Welding Speed (m/min) | Test No. | Laser Power (kW) | Defocusing (mm) | Welding Speed (m/min) |
|---|---|---|---|---|---|---|---|
| 1 | 3.0 | −0.5 | 0.5 | 10 | 3.0 | −0.5 | 0.8 |
| 2 | 3.0 | 0.0 | 0.5 | 11 | 3.0 | 0.0 | 0.8 |
| 3 | 3.0 | 0.5 | 0.5 | 12 | 3.0 | 0.5 | 0.8 |
| 4 | 4.0 | −0.5 | 0.5 | 13 | 4.0 | −0.5 | 0.8 |
| 5 | 4.0 | 0.0 | 0.5 | 14 | 4.0 | 0.0 | 0.8 |
| 6 | 4.0 | 0.5 | 0.5 | 15 | 4.0 | 0.5 | 0.8 |
| 7 | 5.0 | −0.5 | 0.5 | 16 | 5.0 | −0.5 | 0.8 |
| 8 | 5.0 | 0.0 | 0.5 | 17 | 5.0 | 0.0 | 0.8 |
| 9 | 5.0 | 0.5 | 0.5 | 18 | 5.0 | 0.5 | 0.8 |
| Fixed Parameter | Wavelength: 1070 nm | ||||||
| Optical Fiber Diameter: 200 µm | |||||||
| Shielding Gas Flow Rate: 18 L/min, (L/min) | |||||||
| Test No. | Penetration Width (mm) | Penetration Depth (mm) | Penetration Geometry | ||||||
|---|---|---|---|---|---|---|---|---|---|
| 1st | 2nd | 3rd | Average | 1st | 2nd | 3rd | Average | ||
| 1 | 3.93 | 3.90 | 3.90 | 3.91 | 6.49 | 6.47 | 6.51 | 6.49 |  |
| 2 | 3.19 | 3.18 | 3.17 | 3.18 | 6.64 | 6.66 | 6.64 | 6.65 |  |
| 3 | 4.73 | 4.72 | 4.69 | 4.71 | 7.21 | 7.22 | 7.15 | 7.19 |  |
| 4 | 5.82 | 5.86 | 5.84 | 5.84 | 8.52 | 8.51 | 8.55 | 8.53 |  |
| 5 | 5.48 | 5.49 | 5.49 | 5.49 | 8.17 | 8.15 | 8.15 | 8.16 |  |
| 6 | 3.61 | 3.71 | 3.5 | 3.61 | 7.84 | 7.82 | 7.79 | 7.82 |  |
| 7 | 6.59 | 6.58 | 6.58 | 6.58 | 9.11 | 9.12 | 9.11 | 9.11 |  |
| 8 | 6.54 | 6.55 | 6.55 | 6.55 | 9.49 | 9.51 | 9.53 | 9.51 |  |
| 9 | 7.01 | 7.03 | 7.04 | 7.03 | 10.09 | 10.09 | 10.11 | 10.1 |  |
| 10 | 2.51 | 2.47 | 2.37 | 2.45 | 4.86 | 4.78 | 4.79 | 4.81 |  |
| 11 | 2.21 | 2.28 | 2.32 | 2.27 | 4.95 | 4.89 | 4.95 | 4.93 |  |
| 12 | 3.26 | 3.27 | 3.22 | 3.25 | 5.19 | 5.23 | 5.21 | 5.21 |  |
| 13 | 3.25 | 3.23 | 3.17 | 3.22 | 5.49 | 5.48 | 5.44 | 5.47 |  |
| 14 | 3.22 | 3.30 | 3.20 | 3.24 | 6.25 | 6.24 | 6.29 | 6.26 |  |
| 15 | 2.82 | 2.84 | 2.86 | 2.84 | 5.43 | 5.44 | 5.54 | 5.47 |  |
| 16 | 4.94 | 4.97 | 4.91 | 4.94 | 6.18 | 6.24 | 6.21 | 6.21 |  |
| 17 | 4.25 | 4.19 | 4.21 | 4.22 | 7.26 | 7.24 | 7.24 | 7.25 |  |
| 18 | 5.84 | 5.83 | 5.85 | 5.84 | 7.47 | 7.41 | 7.44 | 7.44 |  |
| Test No. | 1st (J) | 2nd (J) | 3rd (J) | Average (J) |
|---|---|---|---|---|
| 1 | 70.46 | 69.54 | 70.71 | 70.24 |
| 2 | 69.92 | 68.72 | 67.87 | 68.84 |
| 3 | 74.89 | 72.16 | 72.36 | 73.14 |
| 4 | 42.86 | 44.12 | 44.76 | 43.91 |
| 5 | 45.97 | 42.14 | 44.92 | 44.34 |
| 6 | 58.56 | 57.12 | 56.89 | 57.52 |
| 7 | 65.42 | 62.16 | 61.91 | 63.16 |
| 8 | 42.71 | 44.56 | 43.87 | 43.71 |
| 9 | 48.09 | 46.21 | 47.02 | 47.11 |
| 10 | 69.08 | 65.21 | 66.84 | 67.04 |
| 11 | 66.41 | 63.12 | 68.33 | 65.95 |
| 12 | 73.71 | 71.69 | 72.52 | 72.64 |
| 13 | 70.36 | 68.50 | 68.44 | 69.10 |
| 14 | 67.62 | 66.12 | 68.24 | 67.33 |
| 15 | 68.23 | 68.91 | 68.12 | 68.42 |
| 16 | 73.41 | 68.83 | 72.64 | 71.63 |
| 17 | 54.96 | 48.22 | 51.26 | 51.48 |
| 18 | 72.12 | 71.60 | 71.01 | 71.58 |
| Test No. | |||||
|---|---|---|---|---|---|
| Facets | |||||
| 1 | 2 | 3 | 4 | 5 | 6 |
 |  |  |  |  |  |
| 7 | 8 | 9 | 10 | 11 | 12 |
 |  |  |  |  |  |
| 13 | 14 | 15 | 16 | 17 | 18 |
 |  |  |  |  |  |
| Test No. | |||||
|---|---|---|---|---|---|
| Facets | |||||
| 1 | 2 | 3 | 4 | 5 | 6 |
| Dimple | Dimple | Dimple | Cleavage | Cleavage | Dimple |
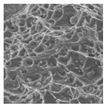 |  |  |  |  |  |
| 7 | 8 | 9 | 10 | 11 | 12 |
| Dimple | Cleavage | Cleavage | Dimple | Dimple | Dimple |
 |  |  |  |  |  |
| 13 | 14 | 15 | 16 | 17 | 18 |
| Dimple | Dimple | Dimple | Dimple | Cleavage | Dimple |
 |  |  |  |  |  |
| Test No. | Laser Power (kW) | Defocusing (mm) | Welding Speed (m/min) | Penetration Width (mm) | Penetration Depth (mm) | Heat Input (J/cm2) | Impact Energy (J) | Fracture Behavior |
|---|---|---|---|---|---|---|---|---|
| 1 | 3.0 | −0.5 | 0.5 | 3.91 | 6.49 | 9.21 × 10⁷ | 70.24 | Dimple |
| 2 | 3.0 | 0.0 | 0.5 | 3.18 | 6.65 | 1.13 × 10⁸ | 68.84 | Dimple |
| 3 | 3.0 | 0.5 | 0.5 | 4.71 | 7.19 | 7.64 × 10⁷ | 73.14 | Dimple |
| 4 | 4.0 | −0.5 | 0.5 | 5.84 | 8.53 | 8.22 × 10⁷ | 43.91 | Cleavage |
| 5 | 4.0 | 0.0 | 0.5 | 5.49 | 8.16 | 8.74 × 10⁷ | 44.34 | Cleavage |
| 6 | 4.0 | 0.5 | 0.5 | 3.61 | 7.82 | 1.33 × 10⁸ | 57.52 | Dimple |
| 7 | 5.0 | −0.5 | 0.5 | 6.58 | 9.11 | 9.12 × 10⁷ | 63.16 | Dimple |
| 8 | 5.0 | 0.0 | 0.5 | 6.55 | 9.51 | 9.16 × 10⁷ | 43.71 | Cleavage |
| 9 | 5.0 | 0.5 | 0.5 | 7.03 | 10.1 | 8.55 × 10⁷ | 47.11 | Cleavage |
| 10 | 3.0 | −0.5 | 0.8 | 2.45 | 4.81 | 9.18 × 10⁷ | 67.04 | Dimple |
| 11 | 3.0 | 0.0 | 0.8 | 2.27 | 4.93 | 9.91 × 10⁷ | 65.95 | Dimple |
| 12 | 3.0 | 0.5 | 0.8 | 3.25 | 5.21 | 6.92 × 10⁷ | 72.64 | Dimple |
| 13 | 4.0 | −0.5 | 0.8 | 3.22 | 5.47 | 9.35 × 10⁷ | 69.10 | Dimple |
| 14 | 4.0 | 0.0 | 0.8 | 3.24 | 6.26 | 9.26 × 10⁷ | 67.33 | Dimple |
| 15 | 4.0 | 0.5 | 0.8 | 2.84 | 5.47 | 1.06 × 10⁸ | 68.42 | Dimple |
| 16 | 5.0 | −0.5 | 0.8 | 4.94 | 6.21 | 7.59 × 10⁷ | 71.63 | Dimple |
| 17 | 5.0 | 0.0 | 0.8 | 4.22 | 7.25 | 8.91 × 10⁷ | 51.48 | Cleavage |
| 18 | 5.0 | 0.5 | 0.8 | 5.84 | 7.44 | 6.42 × 10⁷ | 71.58 | Dimple |
| Test No. | Heat Input (J/cm2) | Impact Energy (J) | Fracture Behavior | Test No. | Heat Input (J/cm2) | Impact Energy (J) | Fracture Behavior |
|---|---|---|---|---|---|---|---|
| 1 | 9.21 × 10⁷ | 70.24 | Dimple | 10 | 9.18 × 10⁷ | 67.04 | Dimple |
| 2 | 1.13 × 10⁸ | 68.84 | Dimple | 11 | 9.91 × 10⁷ | 65.95 | Dimple |
| 3 | 7.64 × 10⁷ | 73.14 | Dimple | 12 | 6.92 × 10⁷ | 72.64 | Dimple |
| 4 | 8.22 × 10⁷ | 43.91 | Cleavage | 13 | 9.35 × 10⁷ | 69.10 | Dimple |
| 5 | 8.74 × 10⁷ | 44.34 | Cleavage | 14 | 9.26 × 10⁷ | 67.33 | Dimple |
| 6 | 1.33 × 10⁸ | 57.52 | Dimple | 15 | 1.06 × 10⁸ | 68.42 | Dimple |
| 7 | 9.12 × 10⁷ | 63.16 | Dimple | 16 | 7.59 × 10⁷ | 71.63 | Dimple |
| 8 | 9.16 × 10⁷ | 43.71 | Cleavage | 17 | 8.91 × 10⁷ | 51.48 | Cleavage |
| 9 | 8.55 × 10⁷ | 47.11 | Cleavage | 18 | 6.42 × 10⁷ | 71.58 | Dimple |
| Test No. | L | D | S | PW | PD | Hi | I | Group |
|---|---|---|---|---|---|---|---|---|
| 1 | 3.0 | −0.5 | 0.5 | 3.91 | 6.49 | 9.21 × 10⁷ | 70.24 | Dimple |
| 2 | 3.0 | 0.0 | 0.5 | 3.18 | 6.65 | 1.13 × 10⁸ | 68.84 | Dimple |
| 3 | 3.0 | 0.5 | 0.5 | 4.71 | 7.19 | 7.64 × 10⁷ | 73.14 | Dimple |
| 4 | 4.0 | −0.5 | 0.5 | 5.84 | 8.53 | 8.22 × 10⁷ | 43.91 | Cleavage |
| 5 | 4.0 | 0.0 | 0.5 | 5.49 | 8.16 | 8.74 × 10⁷ | 44.34 | Cleavage |
| 6 | 4.0 | 0.5 | 0.5 | 3.61 | 7.82 | 1.33 × 10⁸ | 57.52 | Dimple |
| 7 | 5.0 | −0.5 | 0.5 | 6.58 | 9.11 | 9.12 × 10⁷ | 63.16 | Dimple |
| 8 | 5.0 | 0.0 | 0.5 | 6.55 | 9.51 | 9.16 × 10⁷ | 43.71 | Cleavage |
| 9 | 5.0 | 0.5 | 0.5 | 7.03 | 10.1 | 8.55 × 10⁷ | 47.11 | Cleavage |
| 10 | 3.0 | −0.5 | 0.8 | 2.45 | 4.81 | 9.18 × 10⁷ | 67.04 | Dimple |
| 11 | 3.0 | 0.0 | 0.8 | 2.27 | 4.93 | 9.91 × 10⁷ | 65.95 | Dimple |
| 12 | 3.0 | 0.5 | 0.8 | 3.25 | 5.21 | 6.92 × 10⁷ | 72.64 | Dimple |
| 13 | 4.0 | −0.5 | 0.8 | 3.22 | 5.47 | 9.35 × 10⁷ | 69.10 | Dimple |
| 14 | 4.0 | 0.0 | 0.8 | 3.24 | 6.26 | 9.26 × 10⁷ | 67.33 | Dimple |
| 15 | 4.0 | 0.5 | 0.8 | 2.84 | 5.47 | 1.06 × 10⁸ | 68.42 | Dimple |
| 16 | 5.0 | −0.5 | 0.8 | 4.94 | 6.21 | 7.59 × 10⁷ | 71.63 | Dimple |
| 17 | 5.0 | 0.0 | 0.8 | 4.22 | 7.25 | 8.91 × 10⁷ | 51.48 | Cleavage |
| 18 | 5.0 | 0.5 | 0.8 | 5.84 | 7.44 | 6.42 × 10⁷ | 71.58 | Dimple |
| Test No. | Measured Group | Predicted Group | Test No. | Measured Group | Predicted Group |
|---|---|---|---|---|---|
| 1 | 0 | 0 (0.00) | 10 | 0 | 0 (0.00) |
| 2 | 0 | 0 (0.00) | 11 | 0 | 0 (0.00) |
| 3 | 0 | 0 (0.00) | 12 | 0 | 0 (0.00) |
| 4 | 0 | 0 (0.00) | 13 | 0 | 0 (0.00) |
| 5 | 1 | 1 (1.00) | 14 | 0 | 0 (0.00) |
| 6 | 1 | 1 (1.00) | 15 | 0 | 0 (0.00) |
| 7 | 1 | 1 (1.00) | 16 | 0 | 0 (0.00) |
| 8 | 1 | 1 (1.00) | 17 | 0 | 0 (0.00) |
| 9 | 1 | 1 (1.00) | 18 | 0 | 0 (0.00) |
| Design Parameter | Predicted Model | SE (Standard Error) | R2 (Coefficient of Determination, %) |
|---|---|---|---|
| PW | Response Surface Analysis | 0.769 | 86.4 |
| PD | Response Surface Analysis | 0.423 | 96.3 |
| I | Response Surface Analysis | 7.411 | 75.6 |
| Optimal Method | MOO (Multi-Objective Optimization) | |
|---|---|---|
| Range of Local Parameters | L (Laser Power) | [−0.5 ≤ Input ≤ +0.5] kW |
| D (Defocusing) | [−0.25 ≤ Input ≤ +0.25] mm | |
| S (Welding Speed) | [−0.15 ≤ Input ≤ +0.15] m/min | |
| Range of Constraints | Hi (Heat Input) | Hi ≥ 9.16 × 10⁷ J/cm2, Hi ≤ 8.22 9.16 × 10⁷ J/cm2 |
| Fitness Factor | Population Size | 50, 60, 70, 80, 90, 100 |
| Solver | Constrained nonlinear minimization | |
| Algorithm | Trust region reflective algorithm | |
| Derivatives | Gradient supplied | |
| Test No. | Original | Modified | Welding Factors | Group | |||||||
|---|---|---|---|---|---|---|---|---|---|---|---|
| C | V | S | C | V | S | W | H | Hi | I | ||
| 4 | 4.0 | −5.0 | 0.5 | 3.91 | −0.51 | 0.51 | 5.0 | 7.7 | 9.20 × 10⁷ | 55.6 | Dimple |
| 8 | 5.0 | 0.0 | 0.5 | 5.25 | −0.25 | 0.43 | 7.9 | 10.6 | 9.27 × 10⁷ | 51.9 | Dimple |
| 17 | 5.0 | 0.0 | 0.8 | 5.23 | 0.24 | 0.92 | 4.7 | 6.4 | 7.26 × 10⁷ | 64.8 | Dimple |
Publisher’s Note: MDPI stays neutral with regard to jurisdictional claims in published maps and institutional affiliations. |
© 2022 by the authors. Licensee MDPI, Basel, Switzerland. This article is an open access article distributed under the terms and conditions of the Creative Commons Attribution (CC BY) license (https://creativecommons.org/licenses/by/4.0/).
Share and Cite
Park, M.; Kim, J.; Pyo, C. A Study on Heat Input Control and a Quality Evaluation Algorithm to Prevent Toughness Deterioration of the Heat-Affected Zone in the Fiber Laser Welding Process of ASTM A553-1 (9% Nickel Steel) Material. Metals 2022, 12, 1195. https://doi.org/10.3390/met12071195
Park M, Kim J, Pyo C. A Study on Heat Input Control and a Quality Evaluation Algorithm to Prevent Toughness Deterioration of the Heat-Affected Zone in the Fiber Laser Welding Process of ASTM A553-1 (9% Nickel Steel) Material. Metals. 2022; 12(7):1195. https://doi.org/10.3390/met12071195
Chicago/Turabian StylePark, Minho, Jaewoong Kim, and Changmin Pyo. 2022. "A Study on Heat Input Control and a Quality Evaluation Algorithm to Prevent Toughness Deterioration of the Heat-Affected Zone in the Fiber Laser Welding Process of ASTM A553-1 (9% Nickel Steel) Material" Metals 12, no. 7: 1195. https://doi.org/10.3390/met12071195
APA StylePark, M., Kim, J., & Pyo, C. (2022). A Study on Heat Input Control and a Quality Evaluation Algorithm to Prevent Toughness Deterioration of the Heat-Affected Zone in the Fiber Laser Welding Process of ASTM A553-1 (9% Nickel Steel) Material. Metals, 12(7), 1195. https://doi.org/10.3390/met12071195