Article

Use of Numerical Methods for the Design of Thermal Protection of an RFID-Based Contactless Identification System of Ladles

1
Department of Thermal Engineering, Faculty of Materials Science and Technology, VSB-Technical University of Ostrava, 17. listopadu 2172/15, 708 00 Ostrava, Czech Republic
2
Liberty Ostrava a.s., Vratimovská 689/117, 719 00 Ostrava, Czech Republic
*
Author to whom correspondence should be addressed.
Metals 2022, 12(7), 1163; https://doi.org/10.3390/met12071163
Submission received: 15 June 2022 / Revised: 30 June 2022 / Accepted: 5 July 2022 / Published: 8 July 2022
(This article belongs to the Special Issue Applications of Intelligent Process Systems in Metallurgy)

Abstract

:
A method of contactless identification is proposed for steel ladles to eliminate manual inputs that negatively affect the monitoring system of ladles. It is an RFID (Radio Frequency Identification) method based on the principle of radio data transmission between the sensor and a moving object (in our case, a ladle), which is equipped with a so-called transponder (RFID tag). The RFID tag was part of the ladle; it was placed on its shell, reaching a temperature often exceeding 250 °C. The temperature limit for using an RFID transponder is 120 °C. For this reason, thermal insulation protection was made for the RFID transponder. Its design was preceded by simulations of temperature fields using numerical methods. The aim was to compare the resulting values obtained from numerical simulations with the actually measured temperatures and, on this basis, to subsequently perform a numerical simulation for conditions that are not operationally measurable.

1. Introduction

Every steel company strives to ensure seamless communication between the control system and the higher level of control in which the ladle cycle model operates. However, the correct function of the model is often negatively affected by manual inputs and inaccurate input of modelling parameters [1]. Ensuring the correct inputs to the ladle enthalpy model will lead to better control of the ladle’s high-temperature heating, with consequent natural gas savings and, together with ladle insulation, optimization of the final steel casting temperature, reducing ladle furnace electricity consumption and minimizing heat loss by maintaining the accumulated heat in the ladle lining [2].
Based on this experience, a non-contact RFID method was designed for the more accurate and reliable identification and operation of ladles, which completely eliminates manual inputs. The RFID technology is currently one of the most progressively growing identification technologies. The positive impact of its implementation can be seen in the rationalization of processes; it has therefore become the main basis of the Industry 4.0 concept. This technology is currently widely used in industrial practice, and its application is constantly being improved in laboratory testing. In experiments, the qualitative properties of the RFID transponder are verified by employing regression analysis and the creation of regression models having an impact on external factors affecting the readability of the RFID transponder [3]. The generation of multi-source matrix signals is a new research subject in the multi-source identification of dynamic signal characteristics. This method can be widely used in industrial system fault diagnosis [4]. By using RFID transponders, it is possible to monitor the production process, achieve a more efficient production of individual parts, shorten the duration of the entire process, save energy and material resources [5], and locate failures of the production system in time [6]. There is also huge potential in the field of energy use in buildings [7]. This system can quickly identify where the building deformation threshold has been set to provide a timely warning signal for early intervention [8]. The RFID system can also be used in the field of environmental protection, e.g., for monitoring the presence of gaseous pollutants in the air and temperature and relative humidity values [9] or in operations at the municipal level [10].
RFID transponders for ladles can be of various designs, mainly depending on the nature of the application. They are located on the shell of the ladle, thus being exposed to the conditions to which the ladle surface is constantly exposed. These are extremely high temperatures, often exceeding 250 °C [11]. Closely related to this is the transponder temperature field, whose calculation is necessary to determine if the transponder will withstand these extreme conditions.
Direct contact and non-contact temperature measurement in these operationally demanding conditions is virtually impossible. Because the process involves non-stationary heat conduction, the solution of temperature fields was performed using numerical methods. These methods are commonly used in cases where finding an accurate analytical solution is very complicated or impossible [12]. The numerical methods for solving differential equations include the finite difference methods (FDM), finite element method (FEM), finite volume methods (FVM), Runge–Kutta methods, and Adams methods. Differential methods can be further divided into explicit, implicit, and explicit–implicit, the so-called Crank–Nicolson method (C–N) [13]. A relatively new numerical method is the finite analytical method [14].
The semi-analytical solution method can be used to monitor the temperatures in a multilayer lining. This technique is based on local analytical solutions for individual material layers combined with a numerical solution scheme for material temperature limits [15]. To optimize energy consumption in the steelmaking process, it is necessary to estimate the temperature at the transition between the steel and the lining using a dynamic ladle model [16]. The Eulerian–Lagrangian model is used for a comprehensive assessment of heat and mass transfers, which monitors other phenomena, including erosion at the liquid–solid interface [17]. Another possibility is to use the finite volume method (FVM) to create a 3D model of liquid–solid heat transfer for online preheating and a 3D model of liquid–solid heat transfer for heat transfer in a ladle [18]. Other models are focused on heat loss through the side walls of the basin, which confirmed the primary source of heat leakage and showed that the surface temperature distribution in the vertical direction of the ladle shows a large gradient [19]. The finite element method FEM can also be used to simulate thermal shock damage to the refractory lining caused by a large temperature gradient [20].

2. Materials and Methods

Contactless identification systems are based on the principle of radio data transmission between a sensor (transmitter) and a moving object (in our case, a ladle). The building must be equipped with a so-called transponder (RFID tag), an electronic circuit consisting of a receiving/transmitting antenna, charging capacitor, and memory. It is not necessary to power the entire system with batteries. The whole system works as a dual antenna, where one antenna is in the transponder, and the other is connected to the sensor.
The antenna system is connected by cable to the control systems of the respective production units, from where the information is transmitted to the information system of the steel plant, where the automatic reporting of the ladle is subsequently performed at the relevant station (see Figure 1).
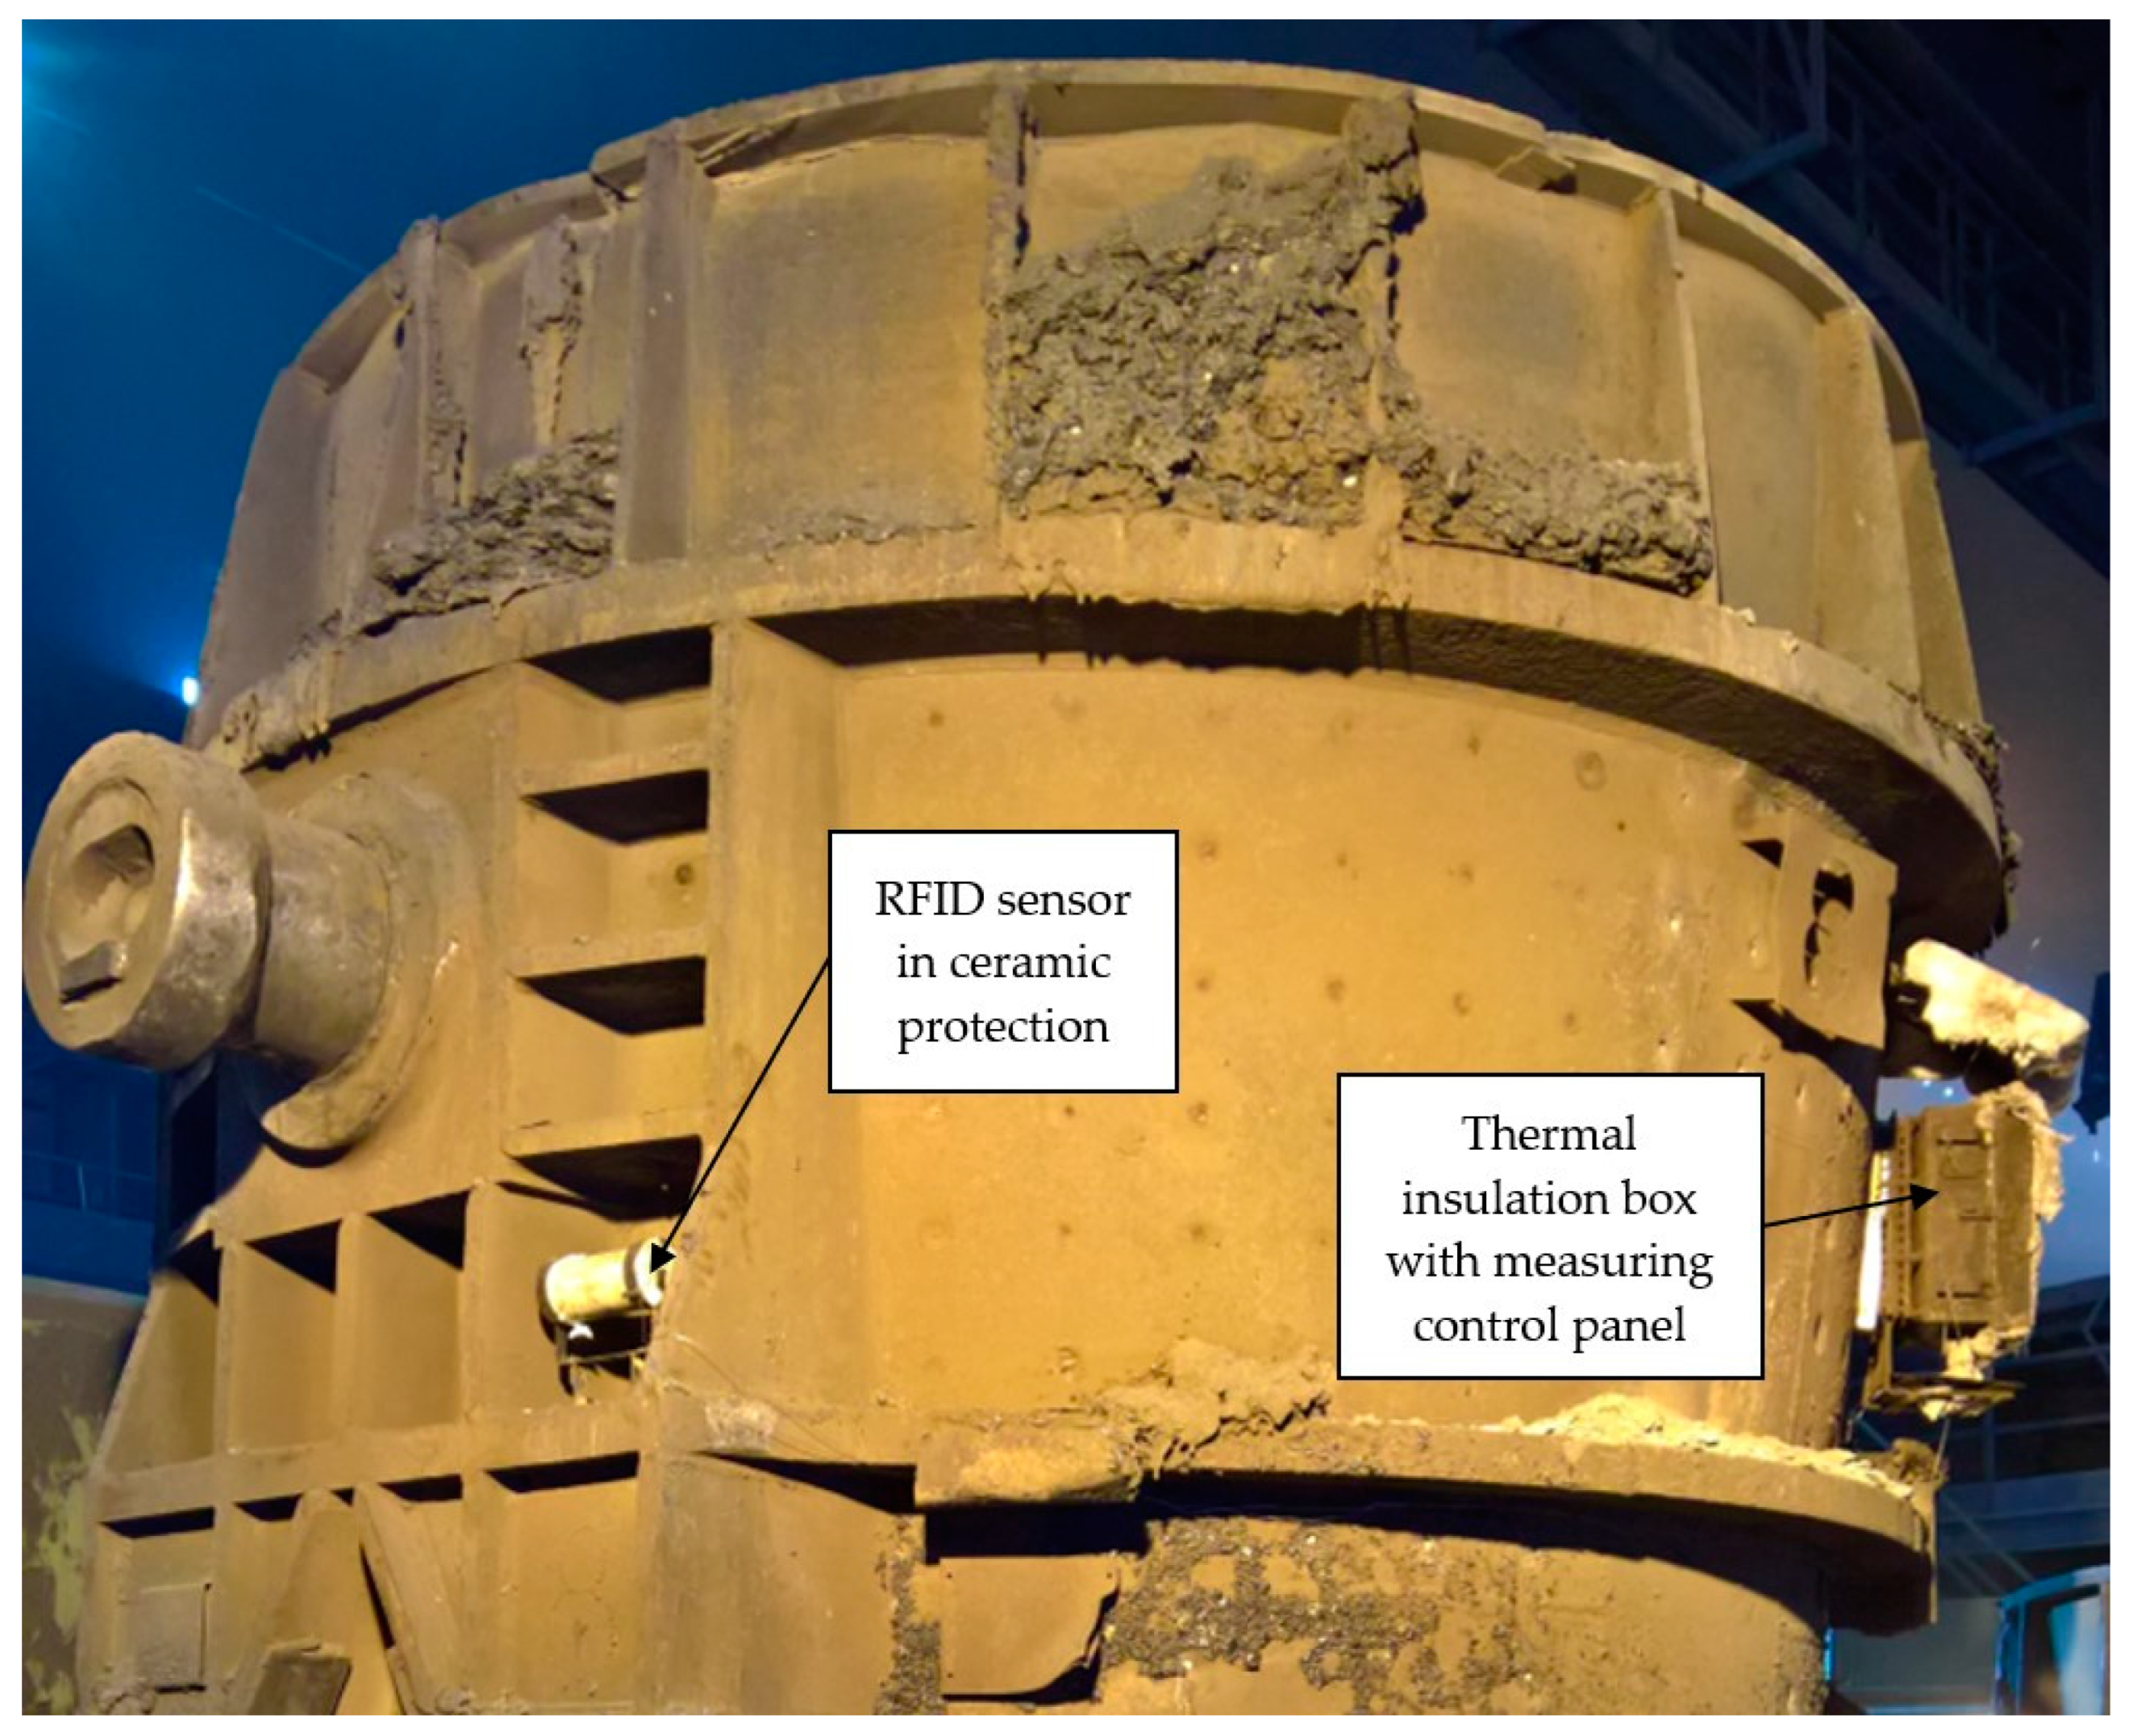
As shown in Figure 1, the RFID transponder is located on the shell of the ladle and is therefore exposed to temperatures prevailing on the surface of the ladle, exceeding 250 °C. The temperature limit of the RFID transponder is 120 °C, and therefore thermal insulation protection of the RFID tag has been proposed [11].
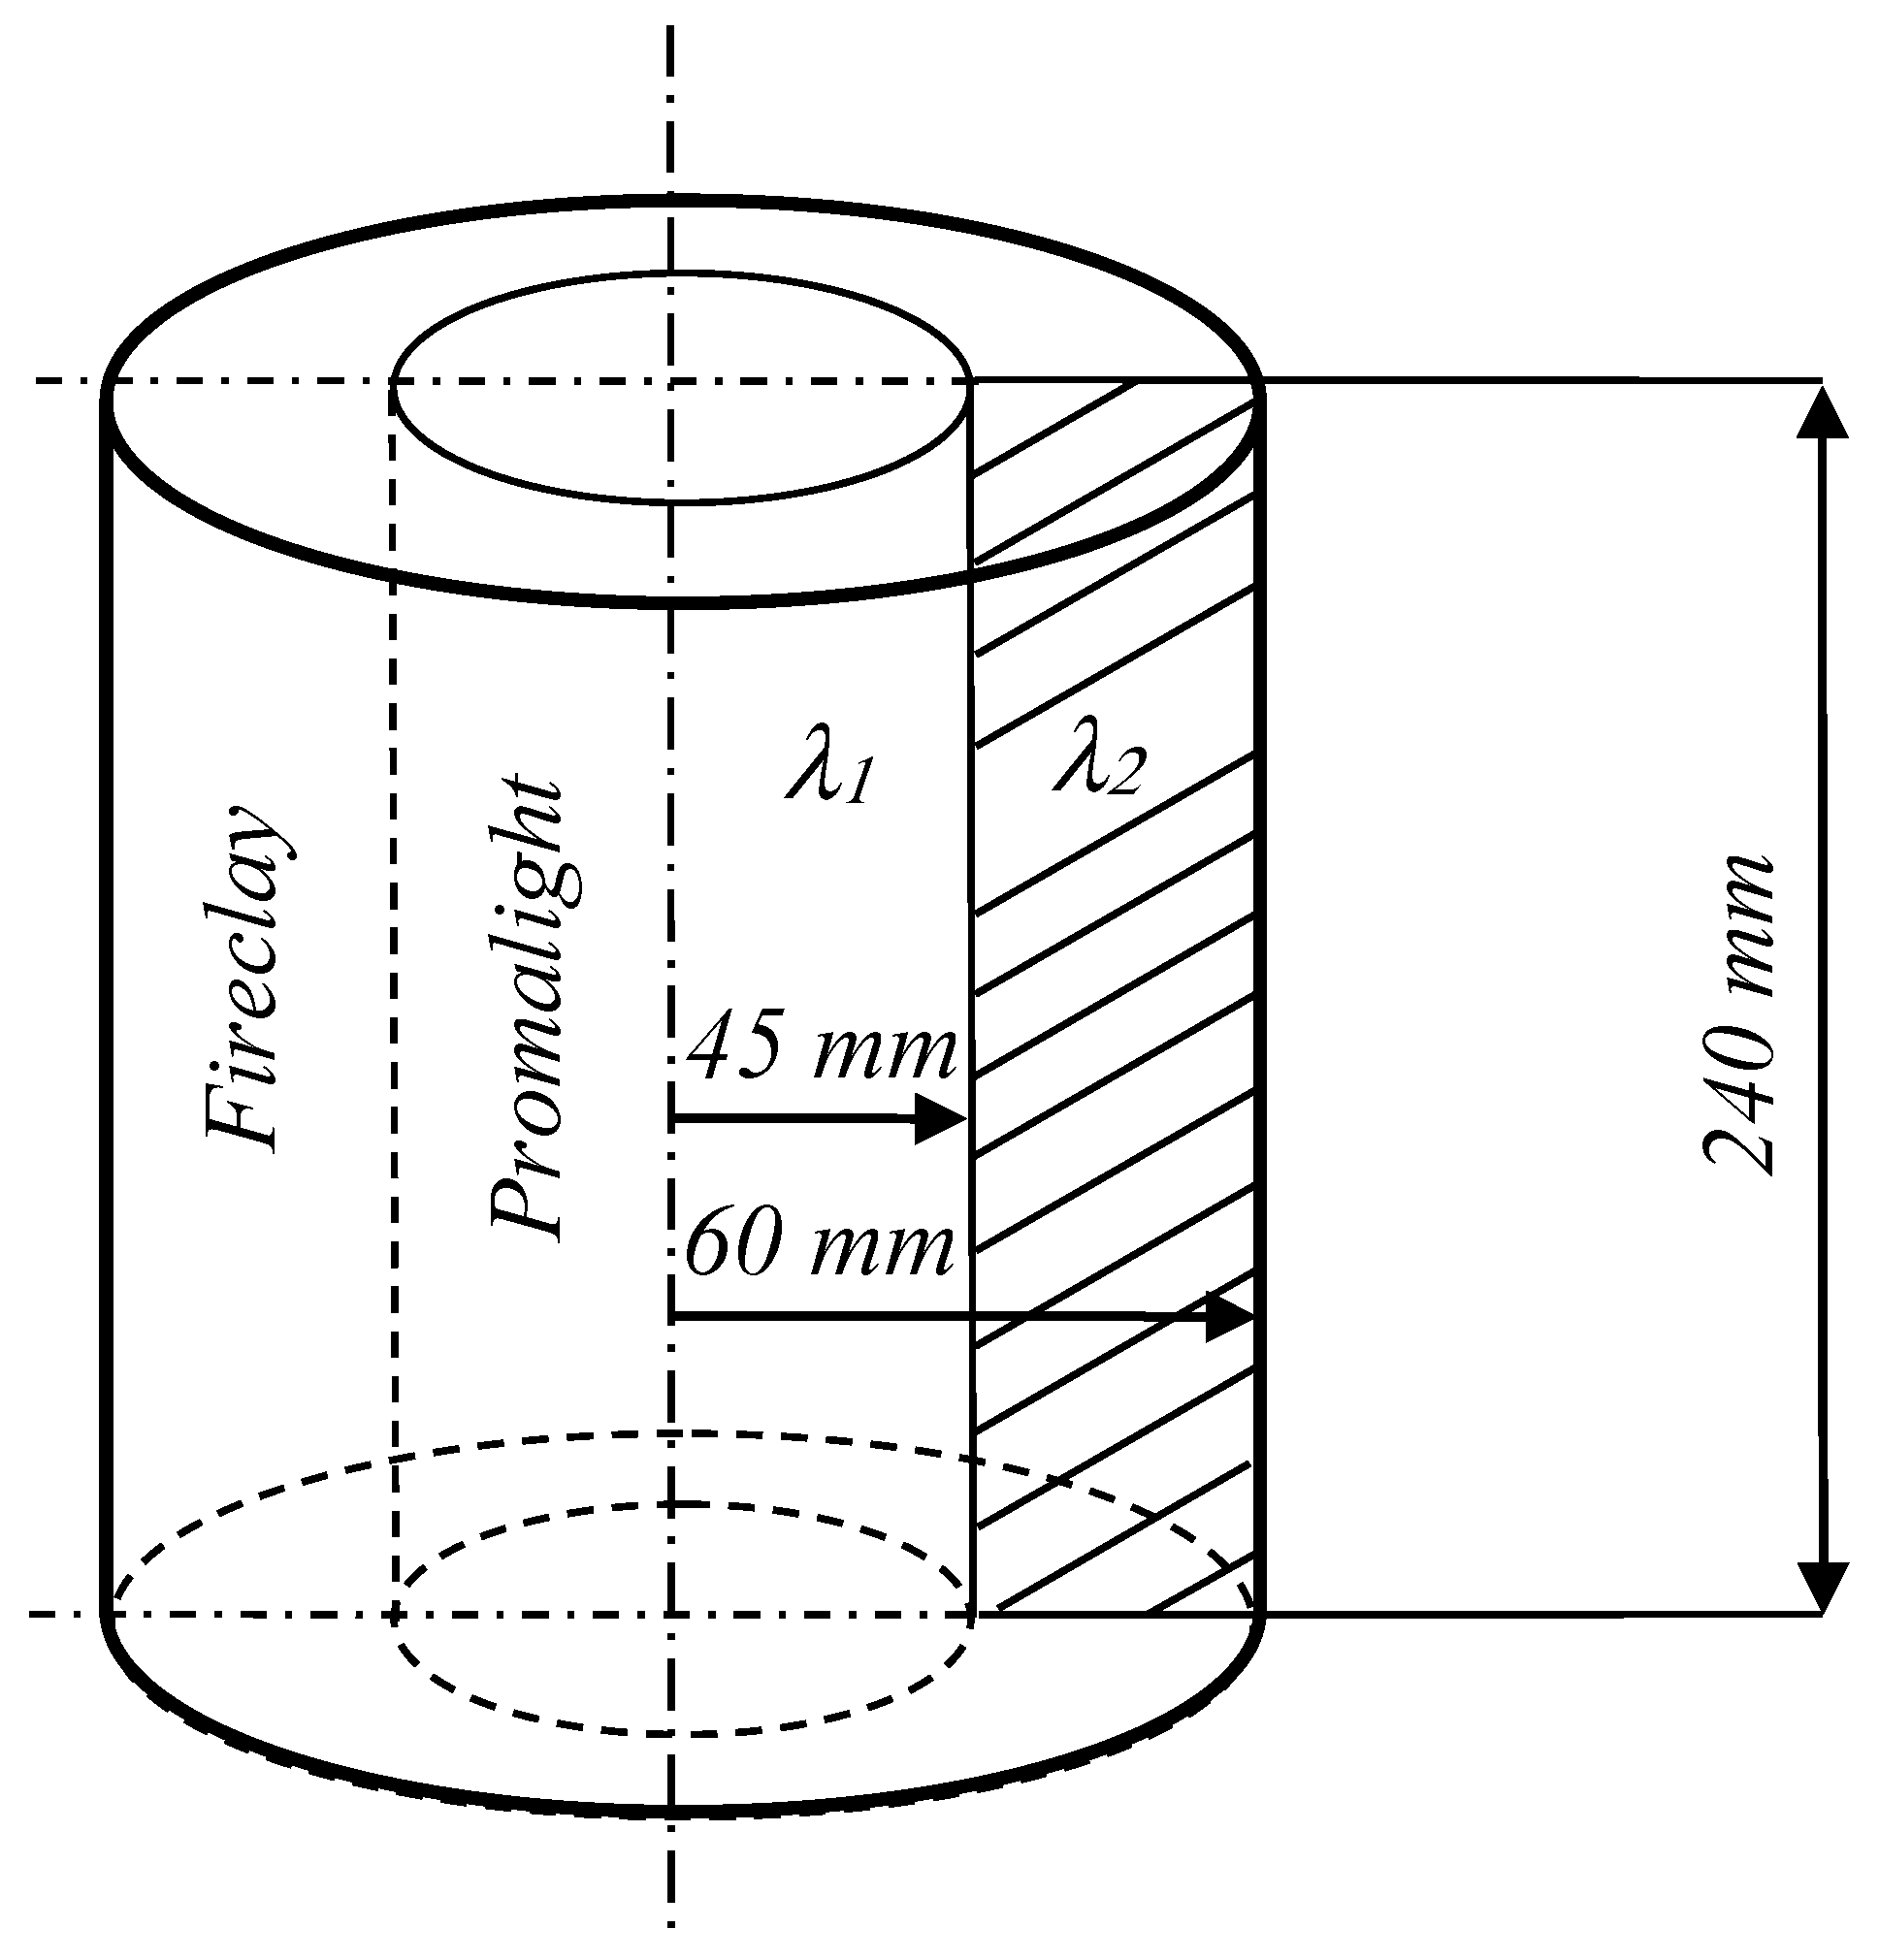
After many numerical simulations, thermo-mechanical protection was designed in the form of a ceramic cylinder with a diameter d = 120 mm and a height h = 220 mm, as shown in Figure 2. This dimensions was chosen based on the size of the hole in the crucible shell that the ceramic cylinder will be located in. It is important that the ceramic protection is as large as possible, but at the same time, that a gap remains between the surfaces of the shell and the ladle ribs, allowing air to flow around the ceramic cylinder.
The primary insulating material of which the ceramic cylinder is composed is Promalight microporous insulation. The surface of the cylinder is fireclay. Fireclay does not have as high an insulating capacity as Promalight but has much higher mechanical strength, which is very important for this type of protection. Its higher thermal conductivity is also favorable, allowing it to cool down more quickly. The properties of the materials of which the cylindrical ceramic protection is composed are reported in Table 1.
If the shape of the analyzed area is complex and the conditions at the edge of the area change with time and place, it is almost impossible to use any of the known analytical methods—variable separation method, classical or generalized integral transformation technique, or Green’s function method [21,22]. The existing mathematical tools are often not sufficient to find the exact solution (and, sometimes, even an approximate solution) to most practical problems [23,24]. By a numerical problem, we mean a clear and unambiguous description of the relationship between the finite number of input and output data (real numbers). The discrete nature of the input and output file is essential and in turn allows the use of a computer in the solution. Procedures for solving numerical problems are called numerical or computer methods. Numerical problems belong to the group of discrete problems [14]. However, mathematical models are often formulated as continuous problems, in which there are continuous functions between input or output data. If we want to solve such problems by numerical methods, we must first convert them to discrete problems, i.e., discretize them [25].
In our case, this involves a numerical solution of an equation of parabolic type with a given initial condition and boundary conditions. The non-stationary problem in cylindrical coordinates can be solved by the Crank–Nicholson method (C–N) and the finite volume method (FVM).
The temperature field was calculated using the finite difference method with the Crank–Nicholson discretization scheme, a combination of explicit and implicit methods. Compared with the explicit or implicit method alone, this method is numerically stable in all circumstances and provides more accurate results [14].
The area was divided into a system of external and interior nodes, spaced apart in the coordinate r by ∂r and the direction of the coordinate z by ∂z. Each internal node lay in the center of the element. Figure 3 shows the interior and external nodes (i, j) and their connection with other grid nodes.
When internal volume sources are not present in the body or can be neglected, we proceed from the following equation when solving non-stationary axisymmetric heat conduction in cylindrical coordinates:
t τ = a ( 2 t r 2 + 1 r t r + 2 t z 2 )   ( K · s 1 )
where a is the thermal diffusivity coefficient (m2·s−1), t is the temperature (°C), τ is the time (s), r is the radius of the cylinder (m), and z is the height of the cylinder (m).
Applying the Crank–Nicolson method, in which one half of the right side of the heat conduction equation is approximated as a function of temperatures tn and the other half as a function of temperatures tn+1, the following equation is obtained [25]:
( t n + 1 t n Δ τ ) = 1 2 ( a 2 t r 2 + a r t r + a 2 t z 2 ) n + 1 + 1 2 ( a 2 t r 2 + a r t r + a 2 t z 2 ) n   ( K · s 1 )
By modifying Equation (2), the resulting Equation is:
( t Δ τ a 2 2 t r 2 a 2 r t r + a 2 2 t z 2 ) n + 1 = ( a 2 2 t r 2 a 2 r t r + a 2 2 t z 2 + t Δ τ ) n   ( K · s 1 )
The right side of the equation can be denoted by the letter A.
To discretize the partial derivatives of the first order, the following central finite differences of first order will be used:
t z = t i + 1 , j t i 1 , j 2 Δ z   ( K · m 1 )
t r = t i , j + 1 t i , j 1 2 Δ r   ( K · m 1 )
To discretize the partial derivatives of the second order, the following central finite differences of second order will be used:
2 t z 2 = t i + 1 , j 2 t i , j t i 1 , j Δ z 2   ( K · m 1 )
2 t r 2 = t i , j + 1 2 t i , j t i , j 1 Δ r 2   ( K · m 1 )
Substituting Equations (6) and (7) into Equation (3) leads to Equation (8):
[ t i , j Δ τ a 2 ( t i , j + 1 2 t i , j t i , j 1 Δ r 2 ) a 2 r ( t i , j + 1 t i , j 1 2 Δ r ) a 2 ( t i + 1 , j 2 t i , j t i 1 , j Δ z 2 ) ] n + 1 = A ( K · s 1 )
The classical finite difference method, in which the partial derivatives in the differential equations are approximated utilizing difference quotients, has similar limitations with respect to the body’s shape as the solution by analytical methods. The finite difference method allows the analysis of different boundary conditions, but the body’s shape should be regular, e.g., a rectangle, block, cylinder, sphere or a flat, cylindrical, or spherical surface. In contrast, the finite volume method (FVM) allows finding solutions in structural elements or areas with complex shapes [26,27].
The finite volume method is one of the methods for converting partial differential equations to a set of algebraic equations for a finite number of unknowns. The main idea of the method is the division of the numerical region into a finite number of so-called control volumes before we use the integral form of the equations, in which we approximate the individual members in a suitable way. The variable field replaces the average values for the given control volumes, in contrast to the finite difference methods, in which the values of the variables at the network points are used [28].
Many excellent software packages allow quickly solving many problems with the FVM, both in body mechanics and in the field of heat transfer and fluid mechanics [29].
The physical parameters of the investigated material were determined from the material sheets of the materials used. These are the coefficient of thermal conductivity k, the specific heat capacity cp, and the bulk density ρ [30].
For the accuracy of the model calculation, it is helpful to know how these physical parameters change with increasing temperature. The values of the coefficient of thermal conductivity k and specific heat capacity cp were obtained from the material sheets. Subsequently, they were transformed by the method of least squares into the regression equation used in modelling the temperature field of the ceramic protection of the RFID sensor. Since the bulk density changes only slightly with temperature, the calculation error was minimal.

3. Results

To find the solution of a temperature field, it is necessary to determine the boundary conditions; therefore, measurements were performed during the operation of the steel plant. Using ambient thermocouple probes (TECTRA a. s., Prague, The Czech Republic) and a thermal imaging camera FLIR (Teledyne FLIR LLC, Wilsonville, OR, USA), the ambient temperature, the temperature of the ladle shell, and the surface temperature of the heat-insulating ceramic cylinder were measured. The temperature at the center of the cylinder through which the RFID transponder passed was also measured. Thermocouple sensors were built into the ceramic cylinder, and then the temperature was continuously measured. A 230 ton ladle was selected for the operational experiment. The sensors for measuring the lining temperature were made of K-type jacketed thermocouples. The GRANT Squirell memory system (24-bit Squirrel 2010, Grant Instruments (Cambridge) Ltd., Cambridgeshire, UK) was used to record the measurement results.
The measuring control panel was stored in a cooled thermal insulation box mounted on the surface of the steel shell of the ladle (see Figure 4). Figure 4 shows thermocouple sensors which were built into the ceramic cylinder of the RFID protection, closer to its edge to the ladle shell.

3.1. Verification of the Usability of the Numerical Simulations in Operating Conditions

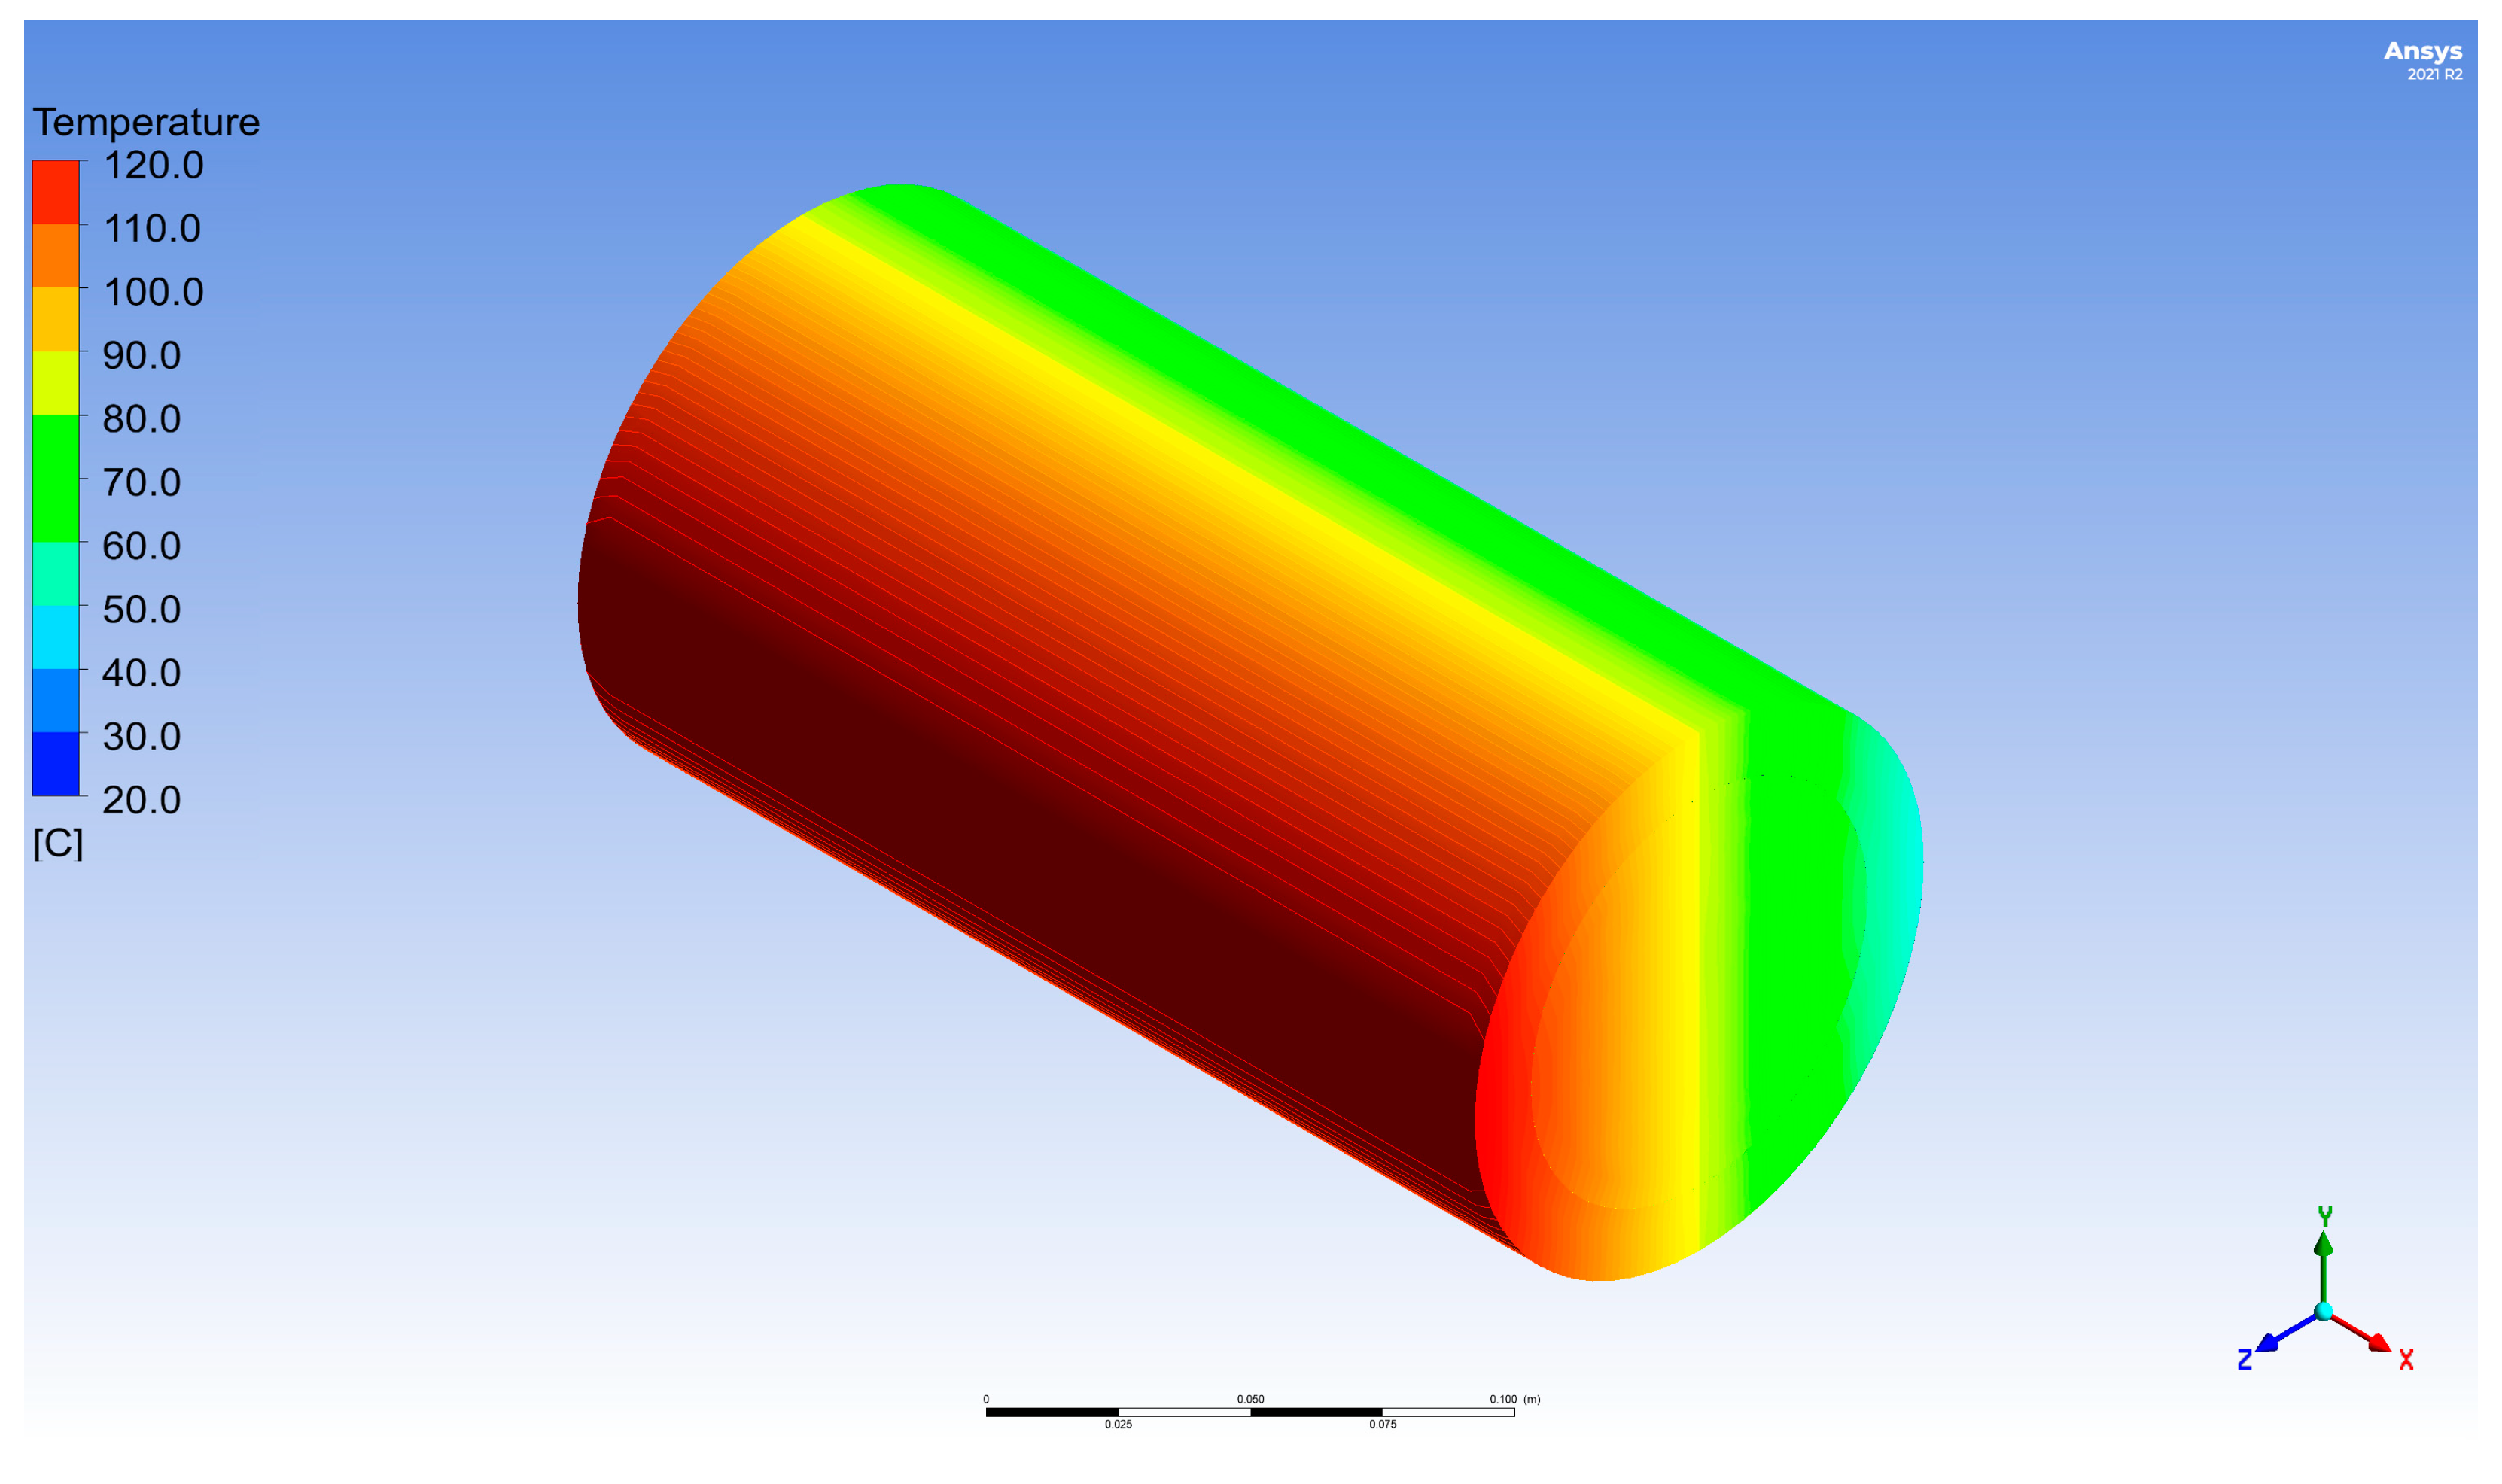
In order to verify the numerical methods, operational measurements of the steel plant were performed. Based on the boundary conditions, the temperature field was calculated using the C–N method and the finite element method, and the results were compared with the operational measurements. For our purposes, the time step of the calculation was chosen to be 30 s. The mesh was divided in cells 5 mm apart, thus creating 49 cells in z the axis direction and 25 cells in the r axis direction. The entire temperature field of the solved ceramic protection then contained 1225 elements, whose the temperatures were determined. The C–N method calculation was performed in the MS Excel spreadsheet using the Visual Basic for Application (VBA) programming language. Since the core of the calculation is based on an explicit–implicit method, the stability condition, which describes the interdependence between the fineness of the computer network and the time step of the calculation, did not have to be checked. The finite element calculation was performed in the simulation software ANSYS Fluent (Ansys CFD Premium, Ansys, Inc., Canonsburg, PA, USA) in double precision mode with a mesh consisting of hexagonal elements with a maximum side length of 5 mm. The temperature distribution at the beginning of the simulation is shown in Figure 5.
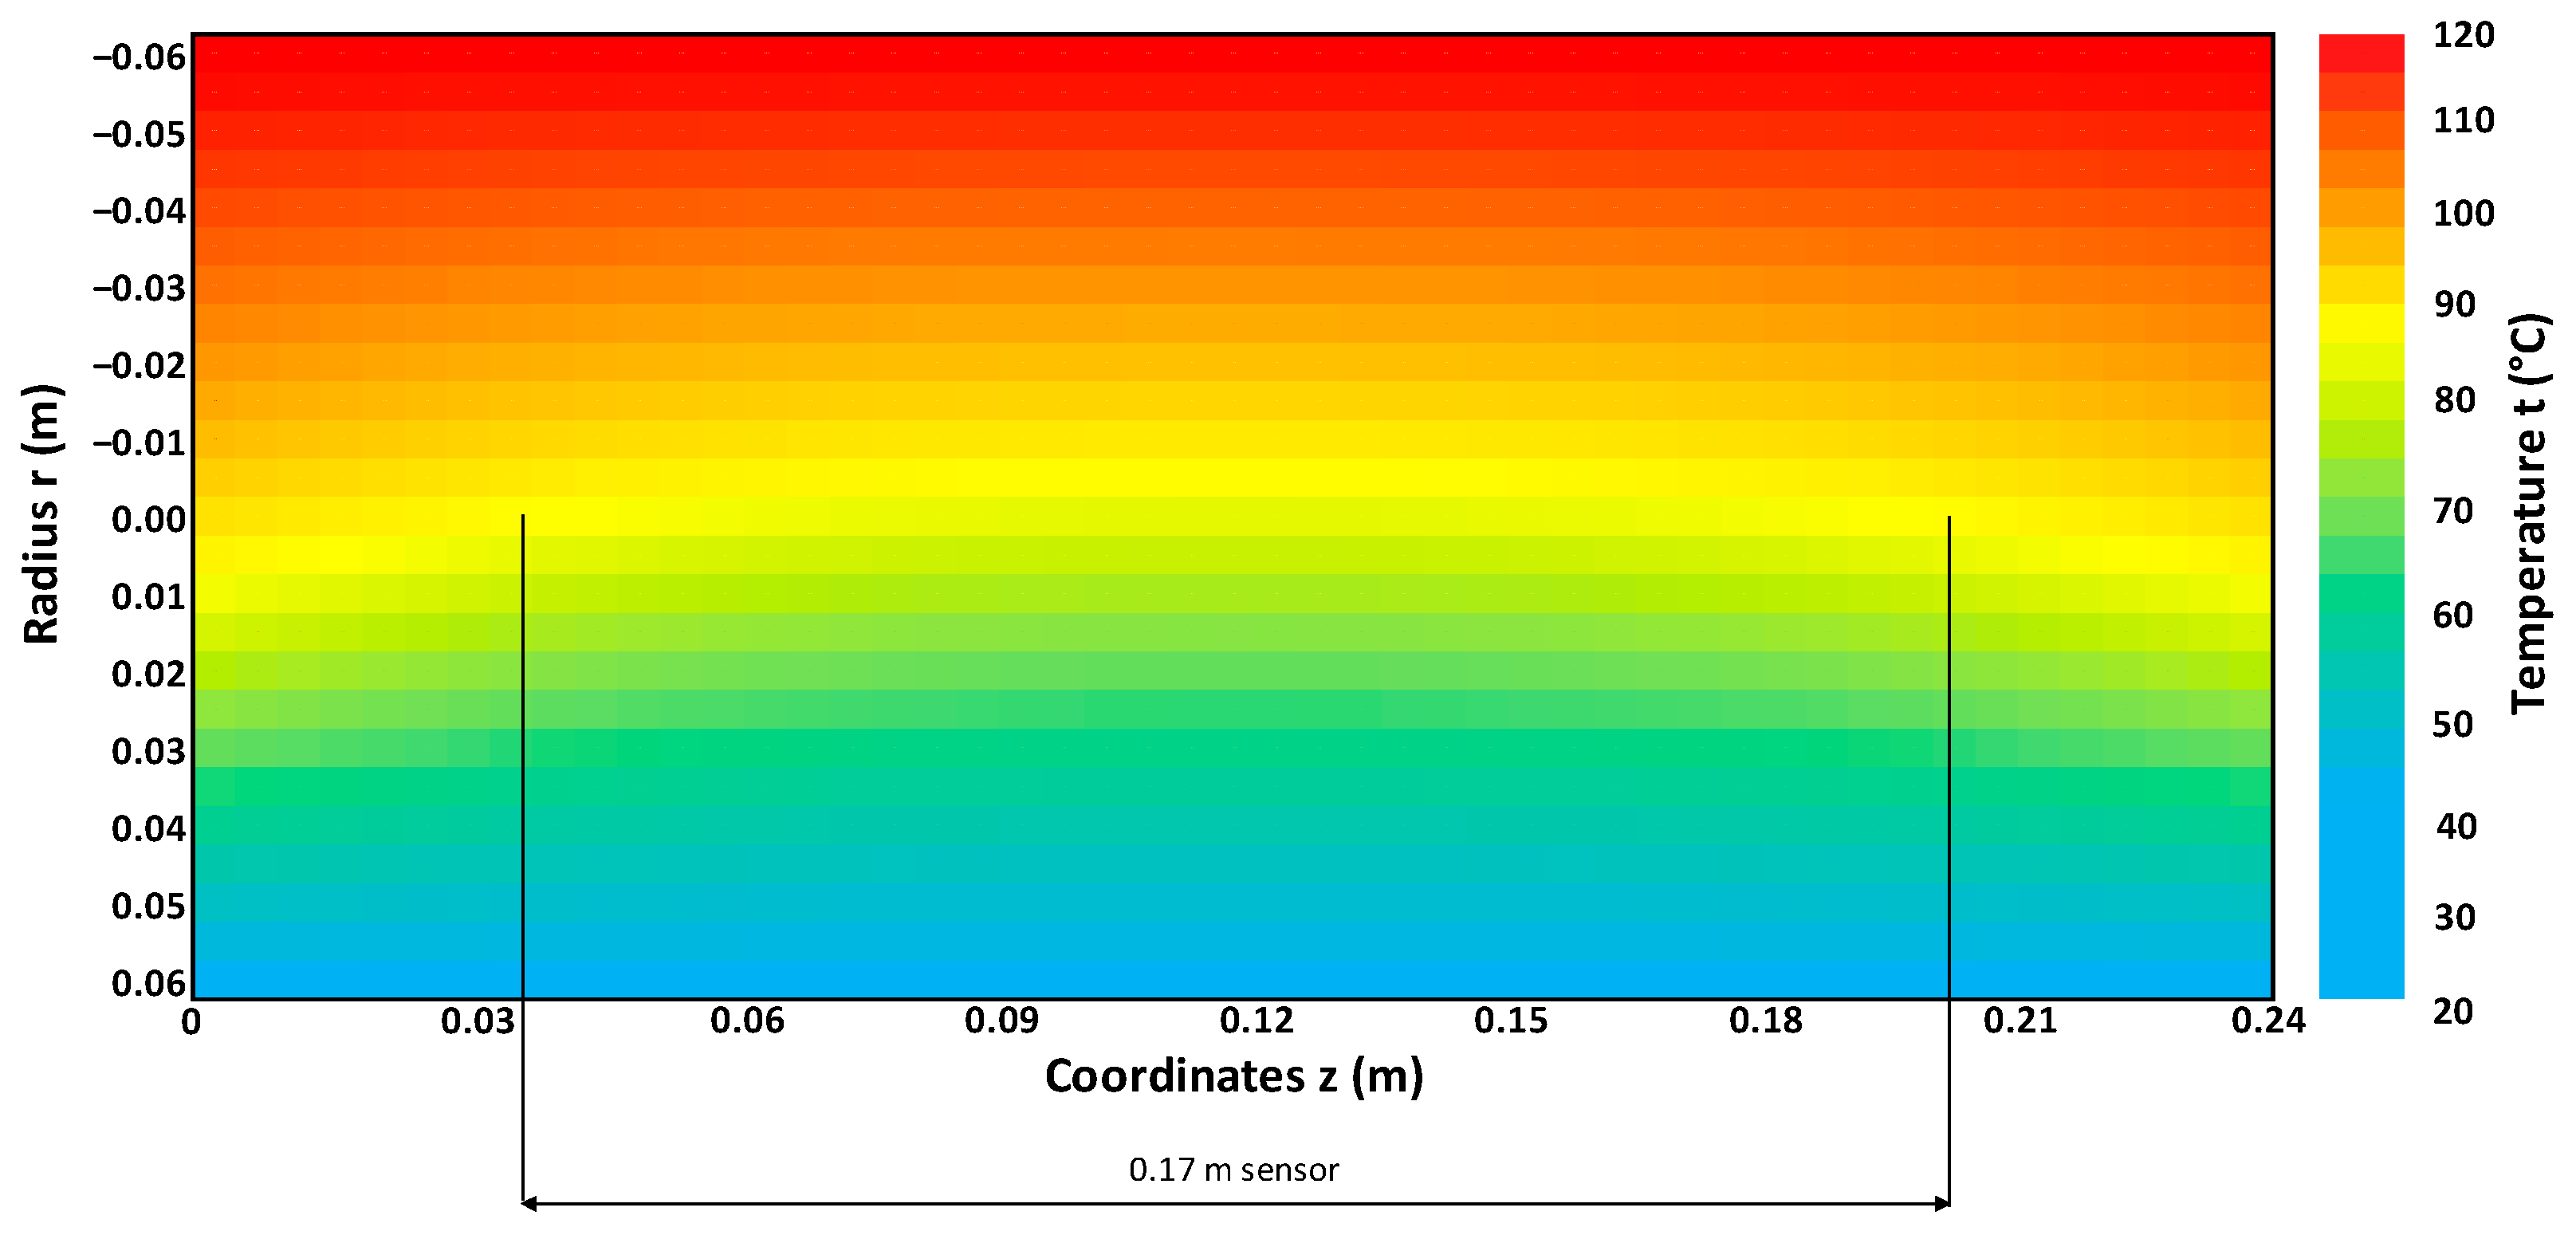
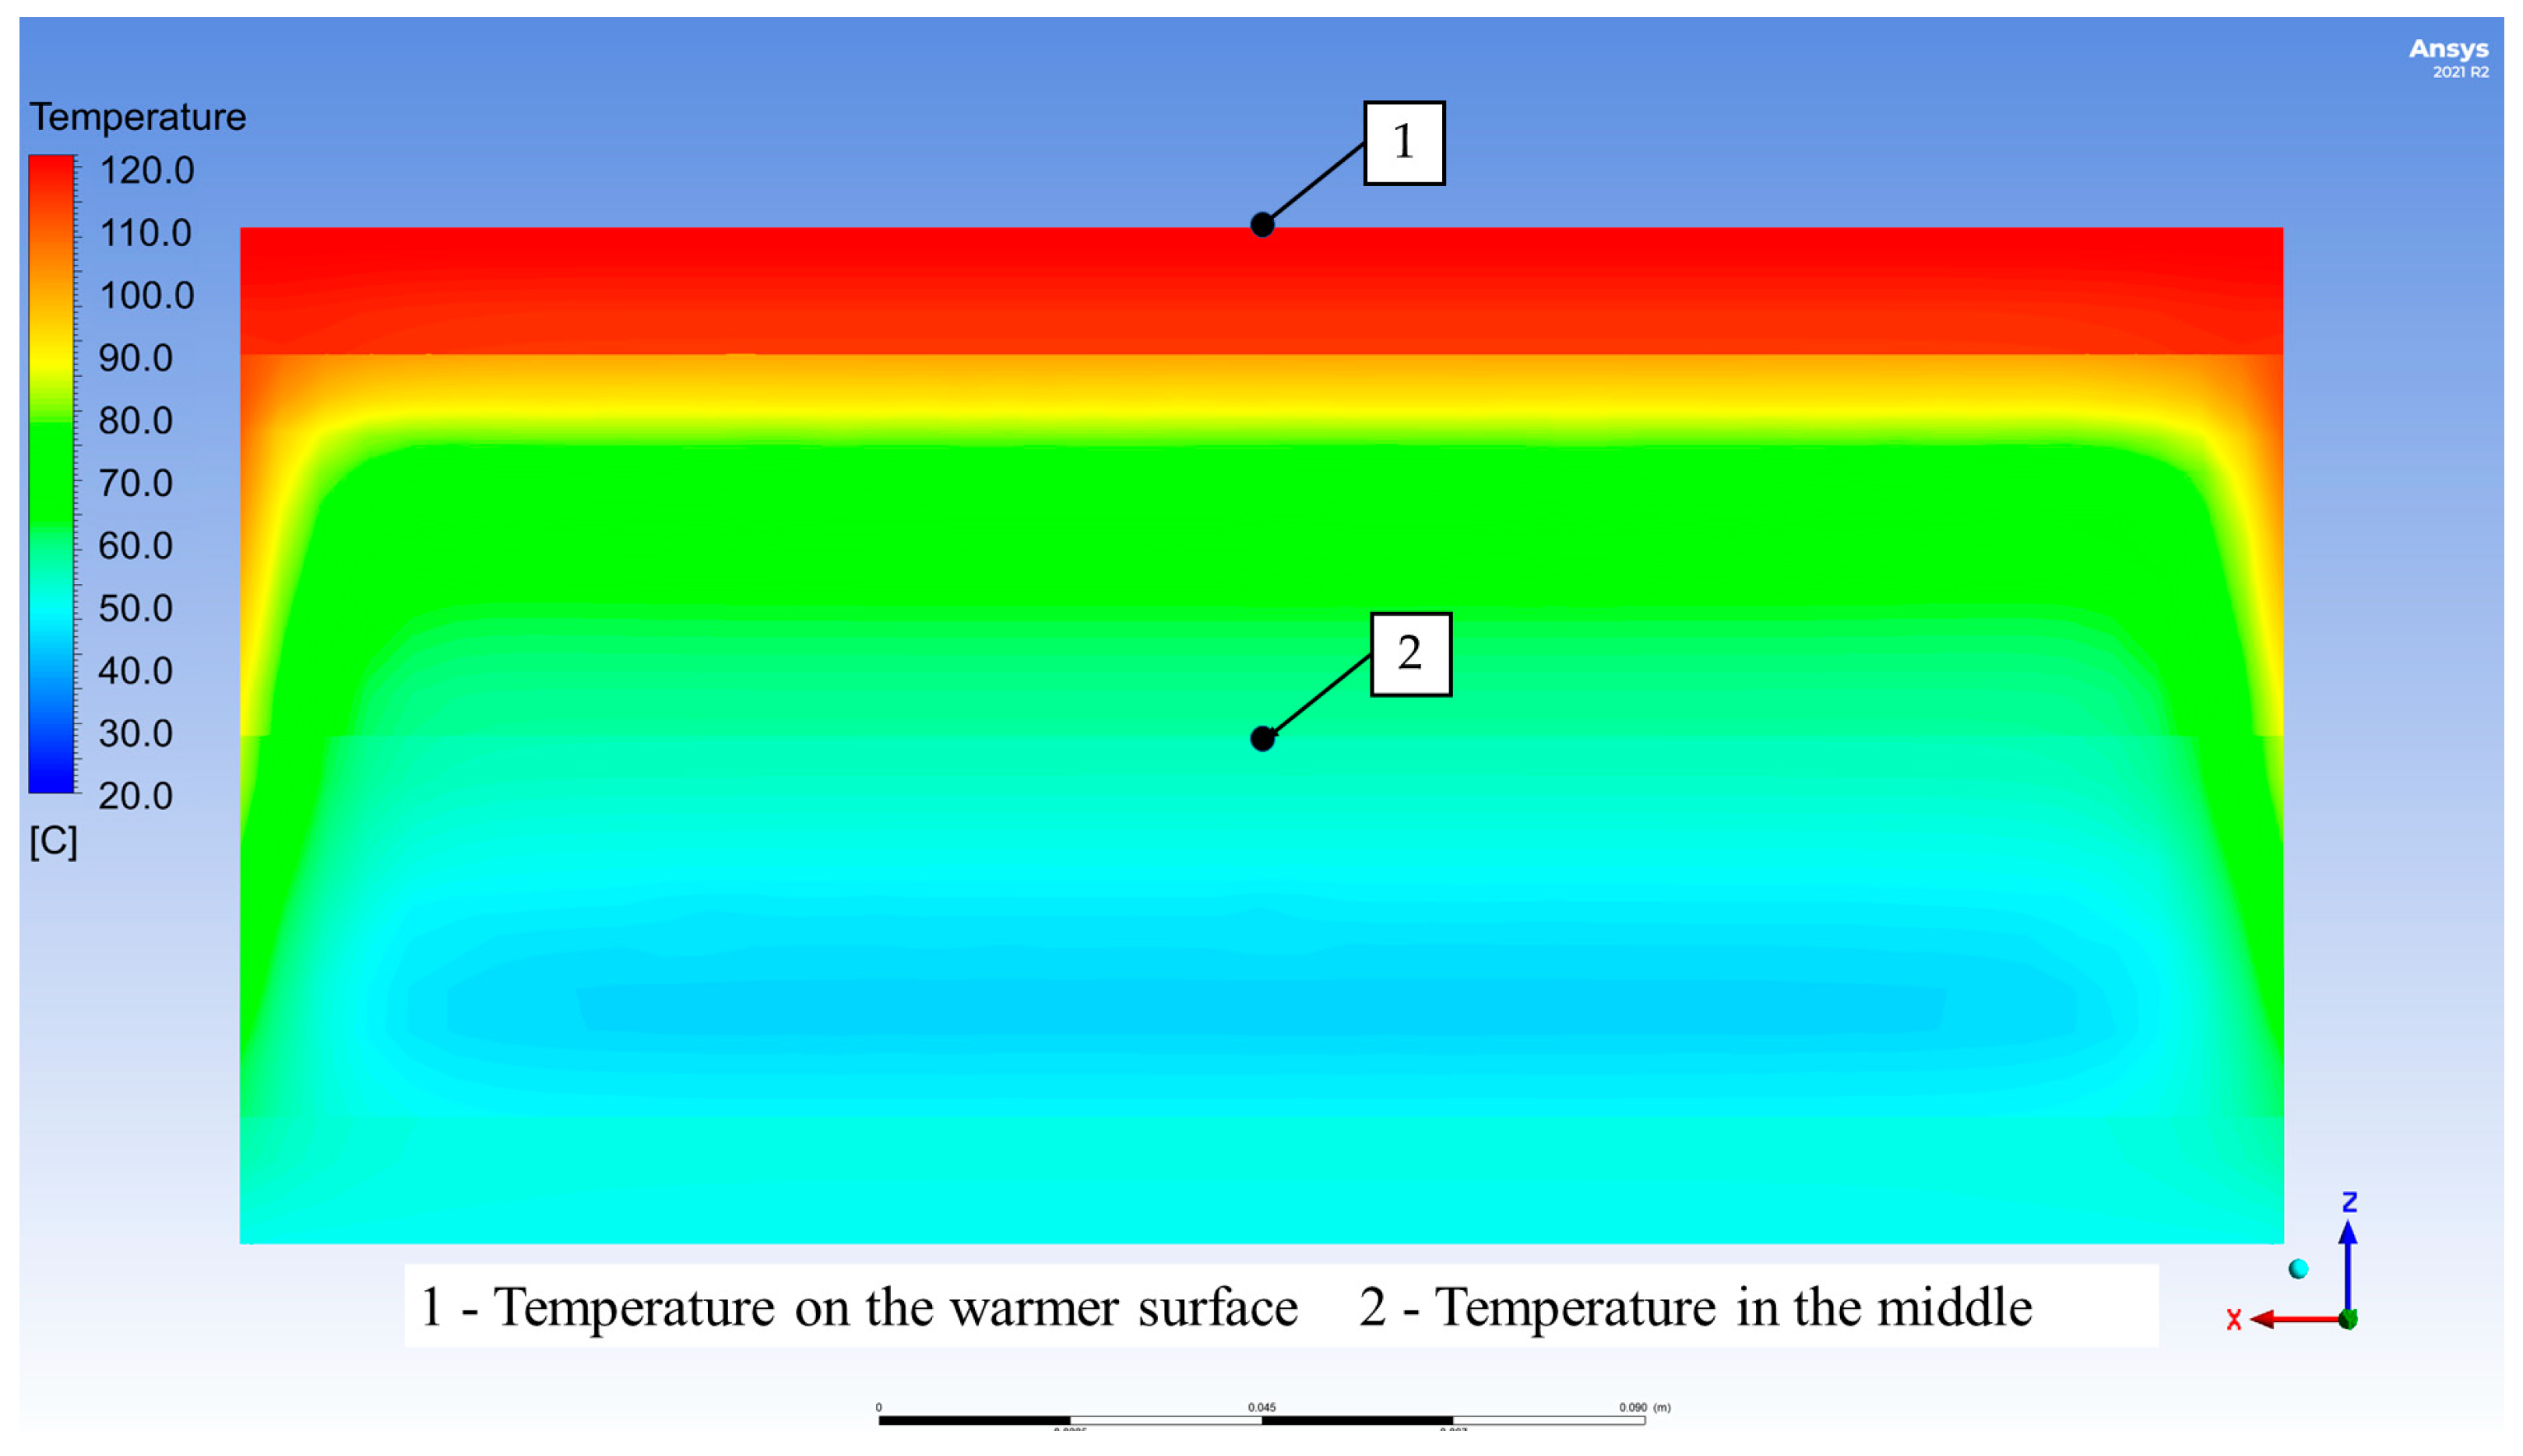
The temperature field after 5 h of heating according to the C–N method is shown in Figure 6, and the temperature field calculated by the finite element method using ANSYS software is shown in Figure 7.
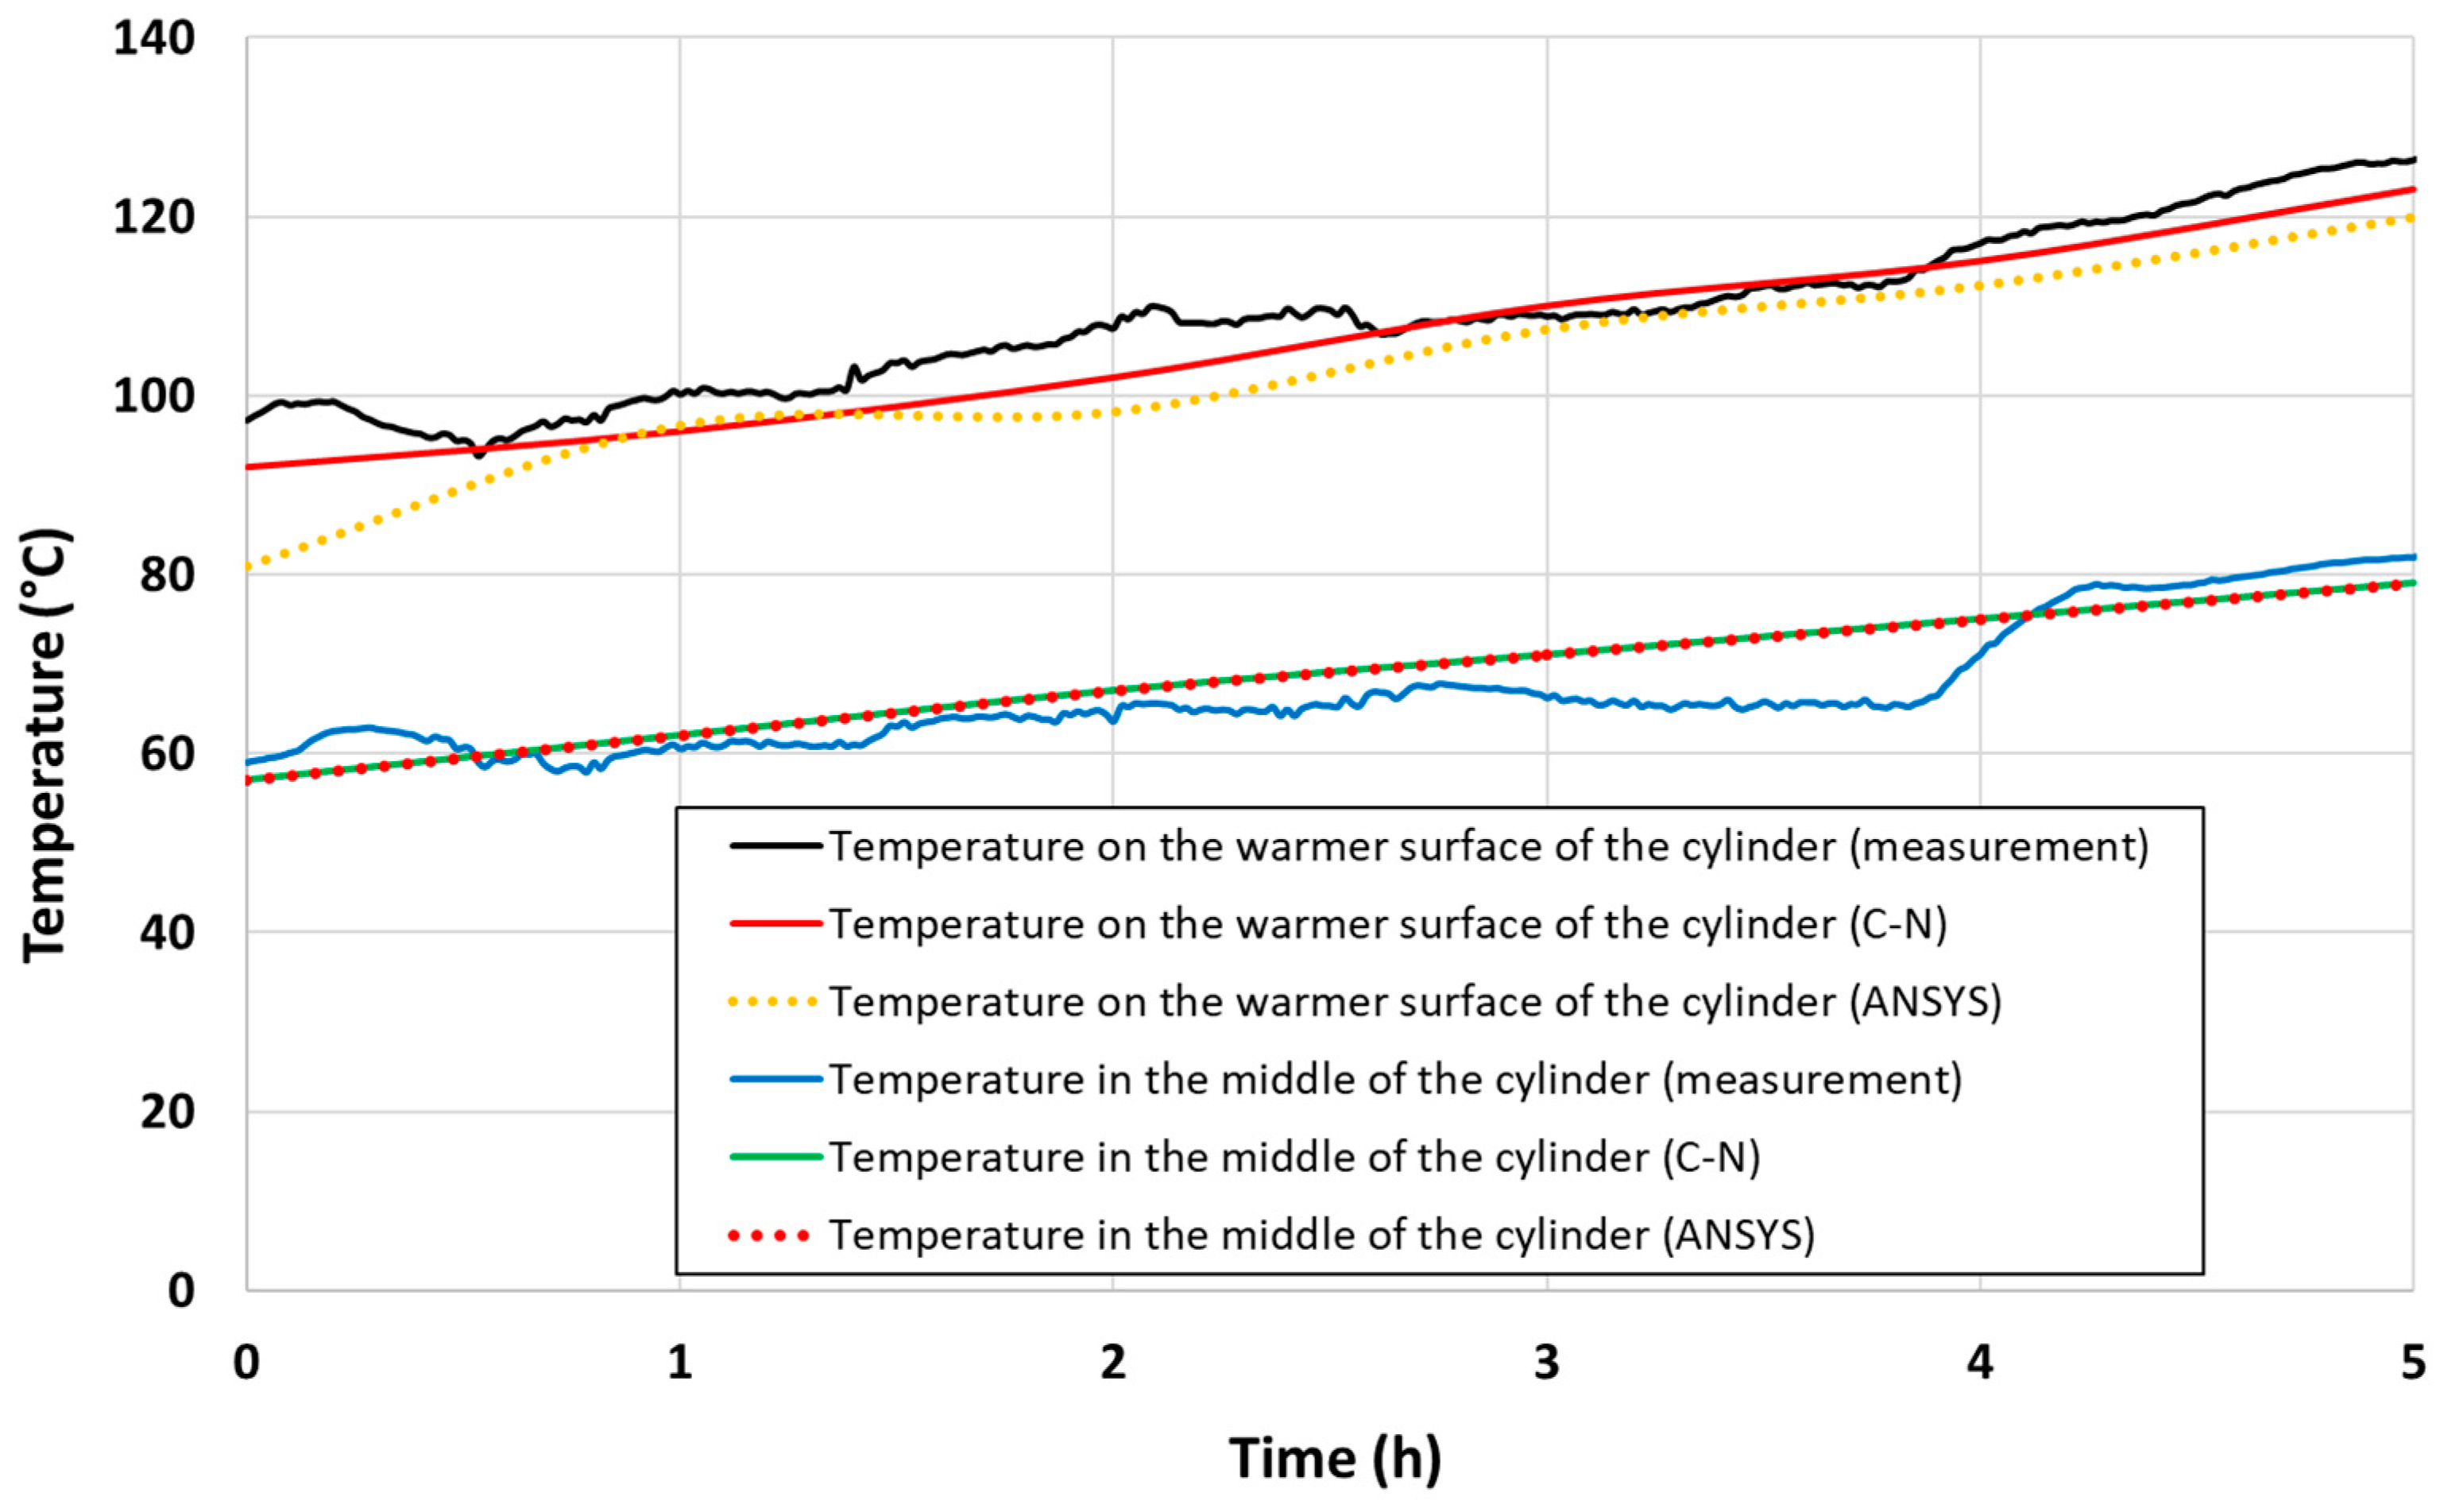
The values of the measured temperatures from the operational measurements and the temperature results obtained by the numerical methods (C–N and FVM) are shown in Figure 8. The specific locations in which these temperatures were obtained are shown in Figure 7. The graph compares the temperatures on the warmer surface of the ceramic cylinder with those at its center, through which the RFID transponder passed. It can be seen that both methods (C–N method and FVM) provided measurements corresponding with great accuracy to the real data obtained using thermocouple probes and thermal imaging cameras; therefore, they can calculate temperatures that are unmeasurable in real operation.
The temperature field for much higher temperatures that can act on the ceramic cylinder sensor was calculated to verify that the proposed protection can protect the RFID transponder from damage, see Section 3.2.

3.2. Numerical Simulations during the Ladle Work Campaign

Since the resulting values from both numerical methods (C–N and FVM) corresponded very accurately to the real data, only one method was used for the following simulations. All subsequent simulations were performed using the Crank–Nicolson method.
The temperature field was calculated using the C–N method based on the measured boundary conditions, which were as follows: the surface temperature of the cylinder at the shell of the ladle was 250 °C, the temperature on the opposite side was 50 °C. On the side walls of the cylinder there was a parabolic temperature profile at a temperature from 250 °C to 50 °C.
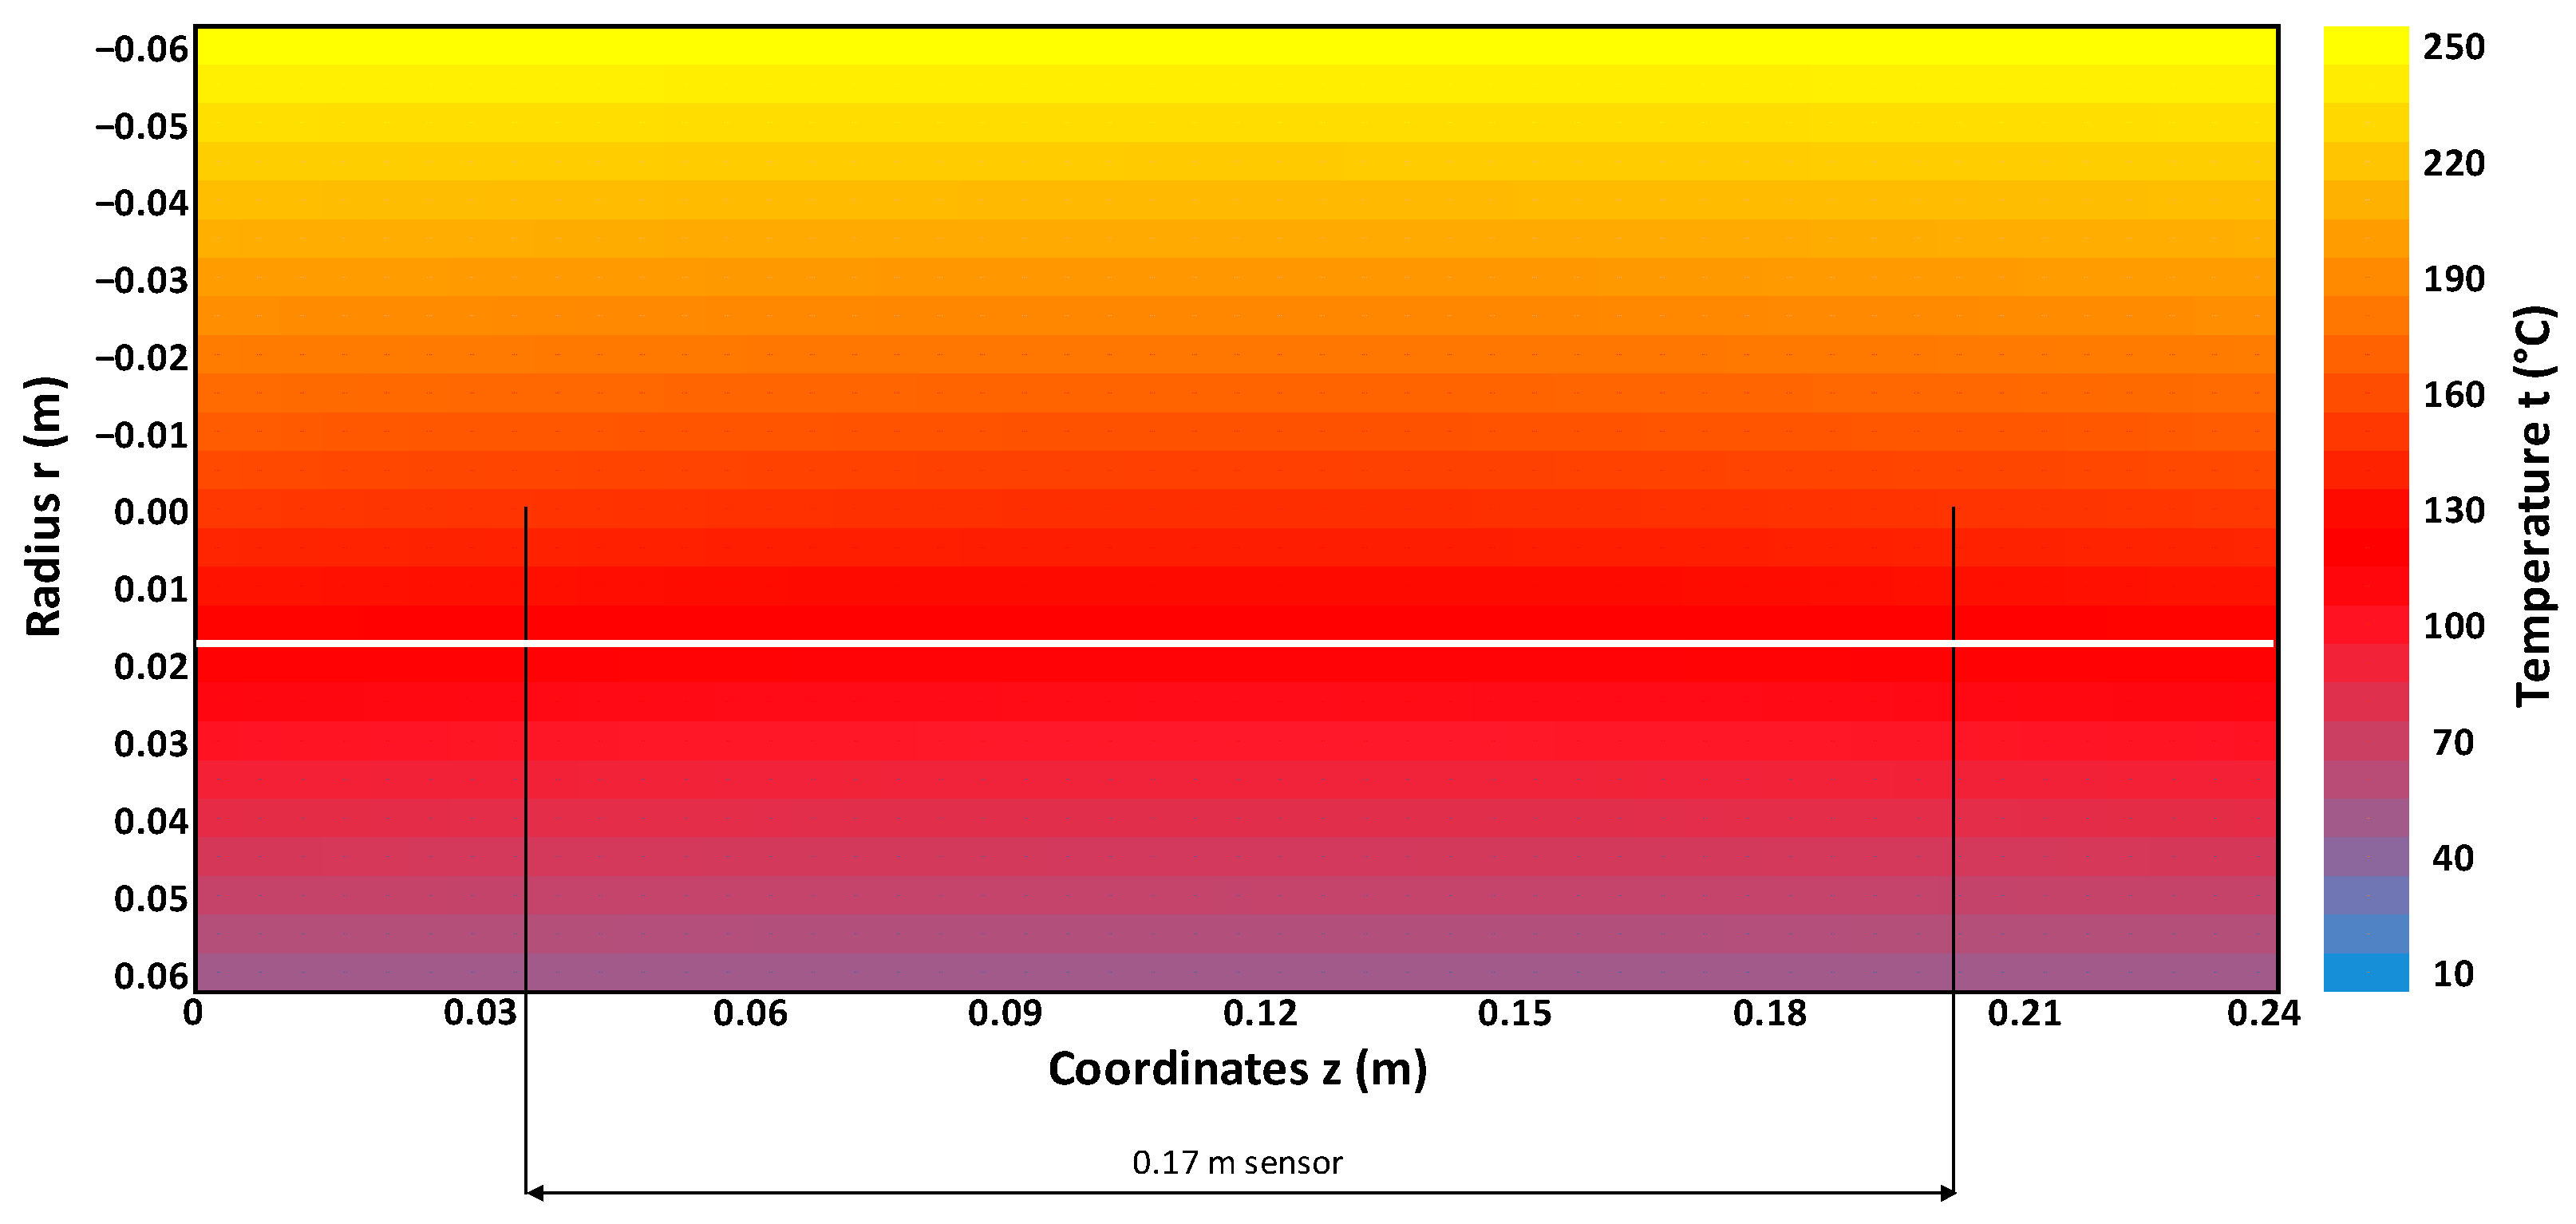
Figure 9 shows the results after 7 h of thermal simulation, after which there were no significant temperature changes, and therefore the simulation was stopped.
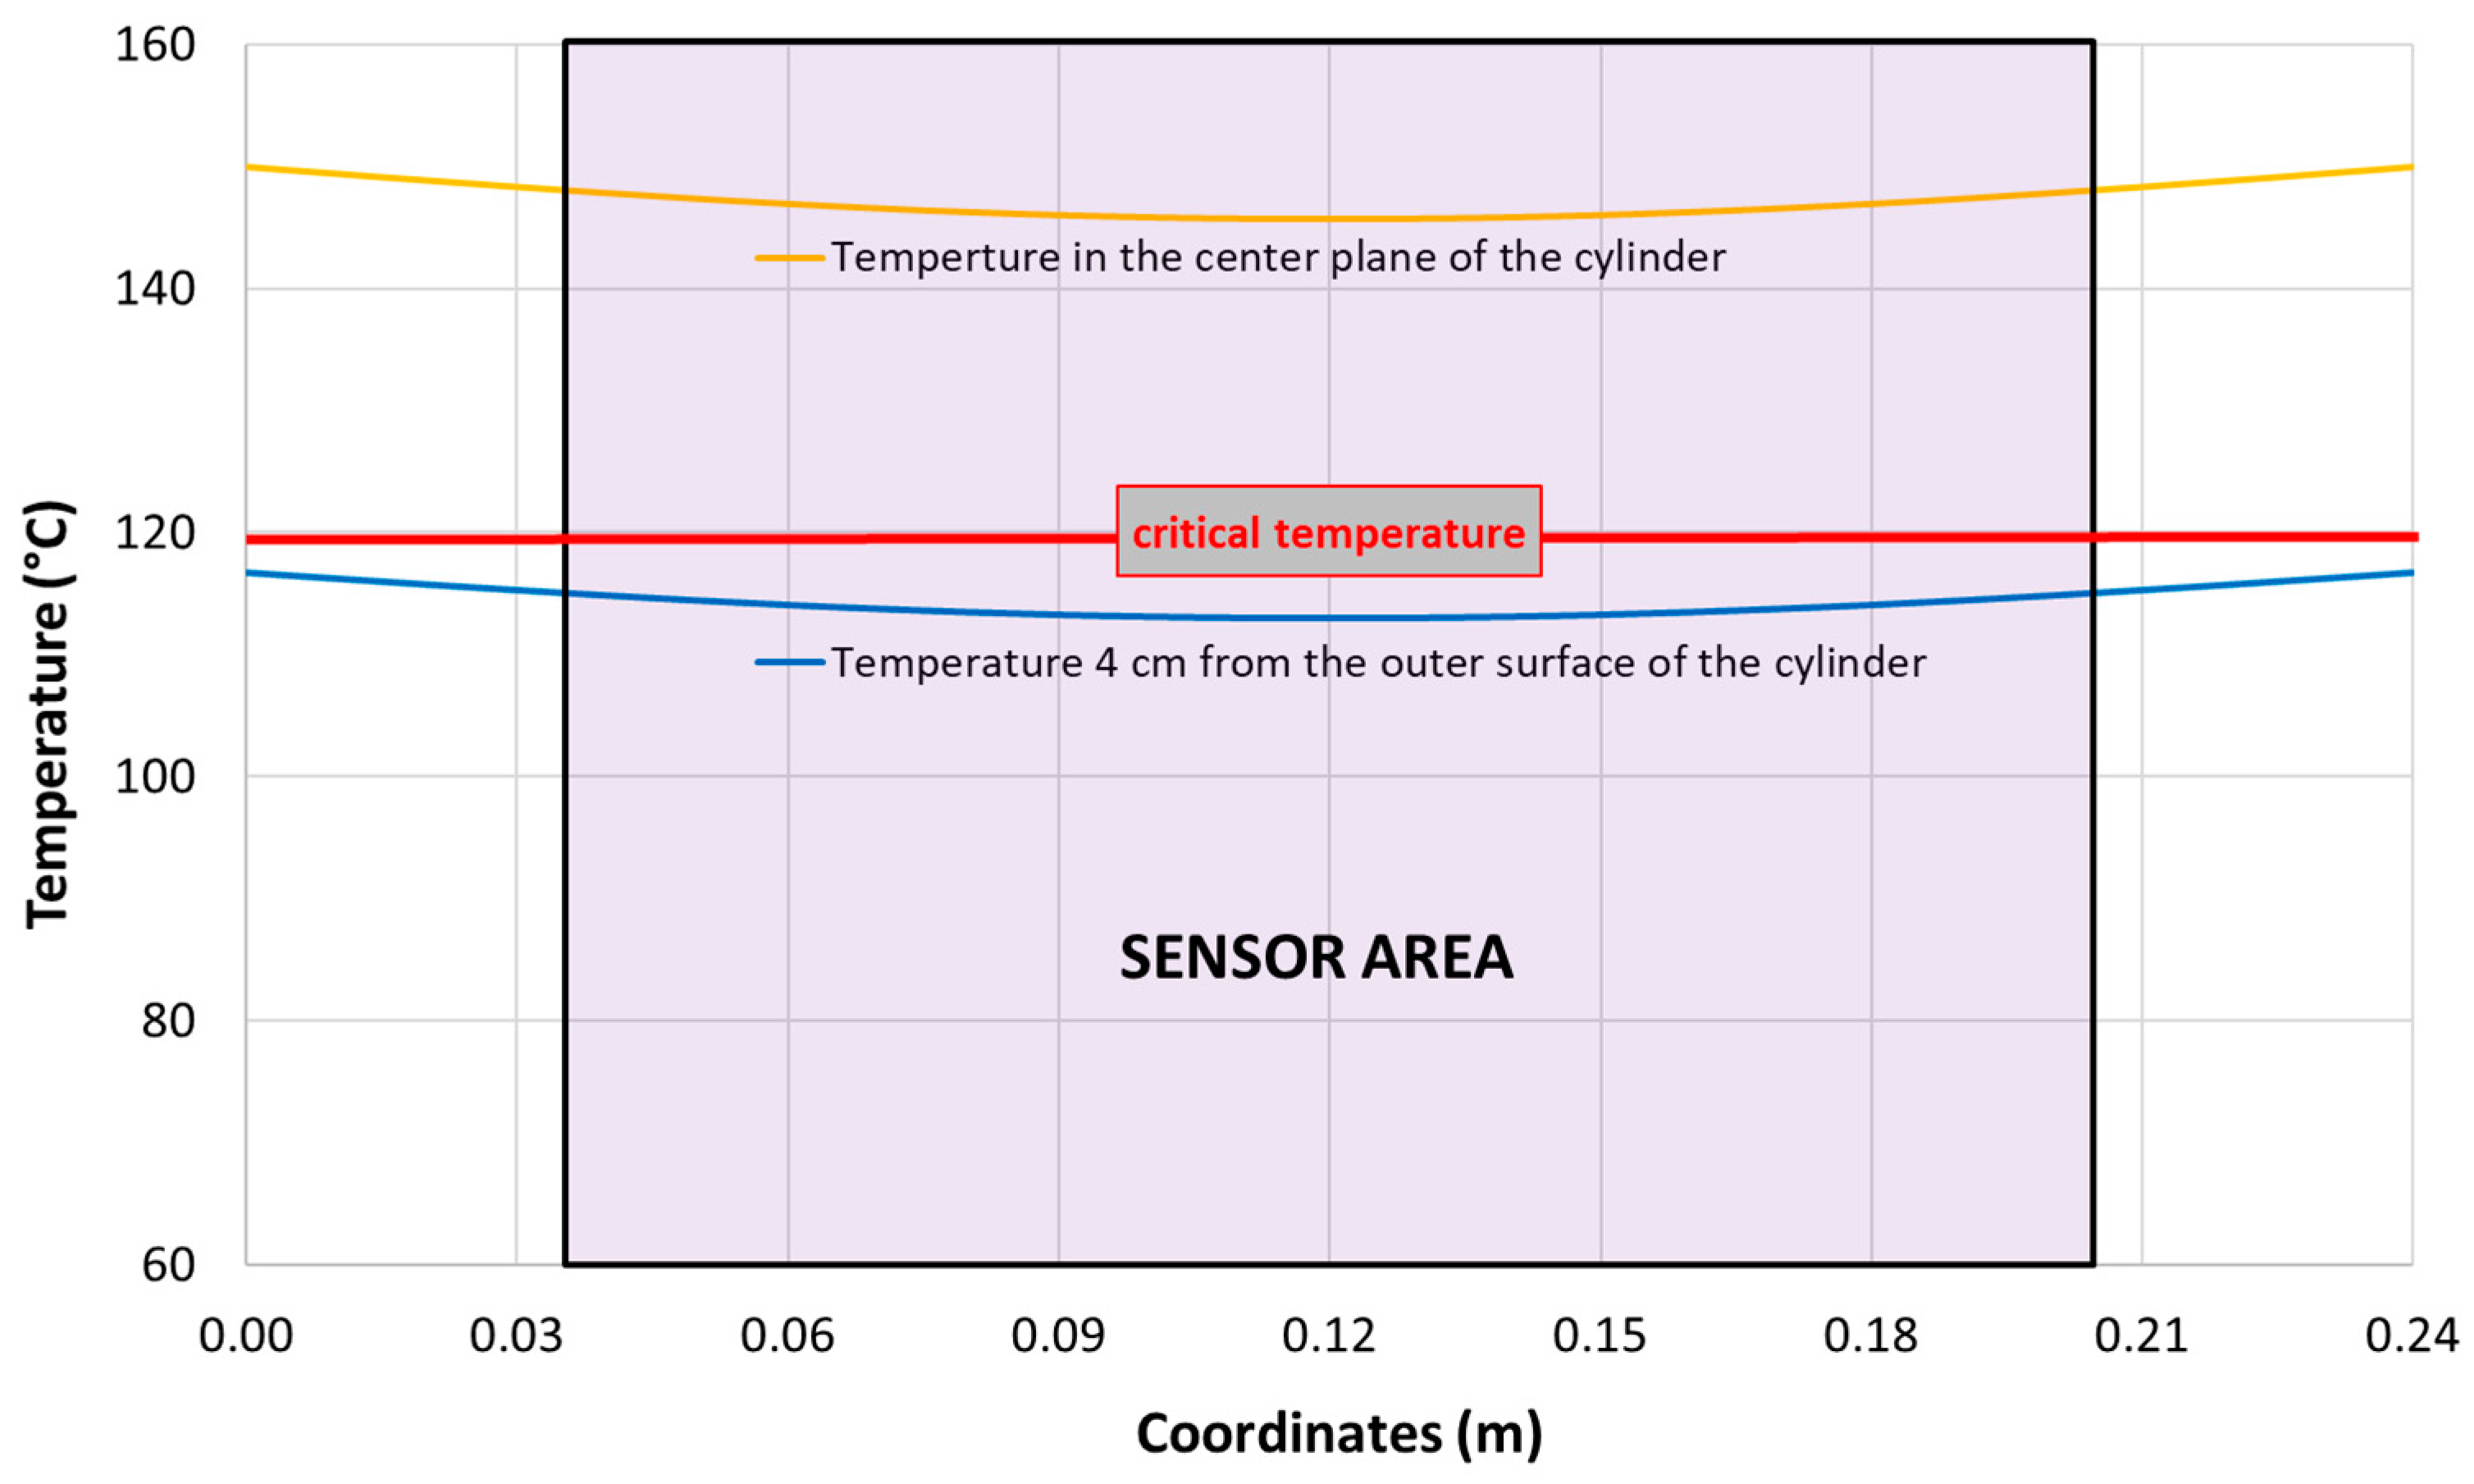
The safe area (temperatures at which the RFID sensor will function) and the dangerous area (temperatures at which the RFID sensor will burn) is divided by a white line in the figure. It follows, observing the temperature field, that the colder area, shown below the line, was shifted more towards the outer edge of the ceramic cylinder (further from the shell of the ladle). For this reason, it was decided to install the sensor eccentrically. It was therefore located 2 cm from the central axis of the cylinder towards the outer edge (4 cm from the outer surface of the cylinder).
The temperature in the center plane of the cylinder (cylinder axis) and the temperature in a plane 4 cm from the outer surface of the cylinder are shown in Figure 10. Closer to the outer edge of the cylinder, where temperatures were even lower than on the latter plane, it was not suitable to install the sensor, as it would be exposed to higher temperatures from the outside (e.g., radiant heat from the shell of a nearby ladle, caisson vacuum station).

3.3. Numerical Simulations for Caisson Vacuum Stations

For this design, a calculation was made for the most extreme conditions that may occur during operation. This is a state where the ladle will have a vacuum station lasting 30 min in the production cycle. In these conditions, the ladle is enclosed in the caisson of the vacuum station, and the heat accumulated in the ladle lining is enclosed in this space and heats the ceramic cylinder from all sides. Inside the vacuum station, temperatures can reach around 400 °C.
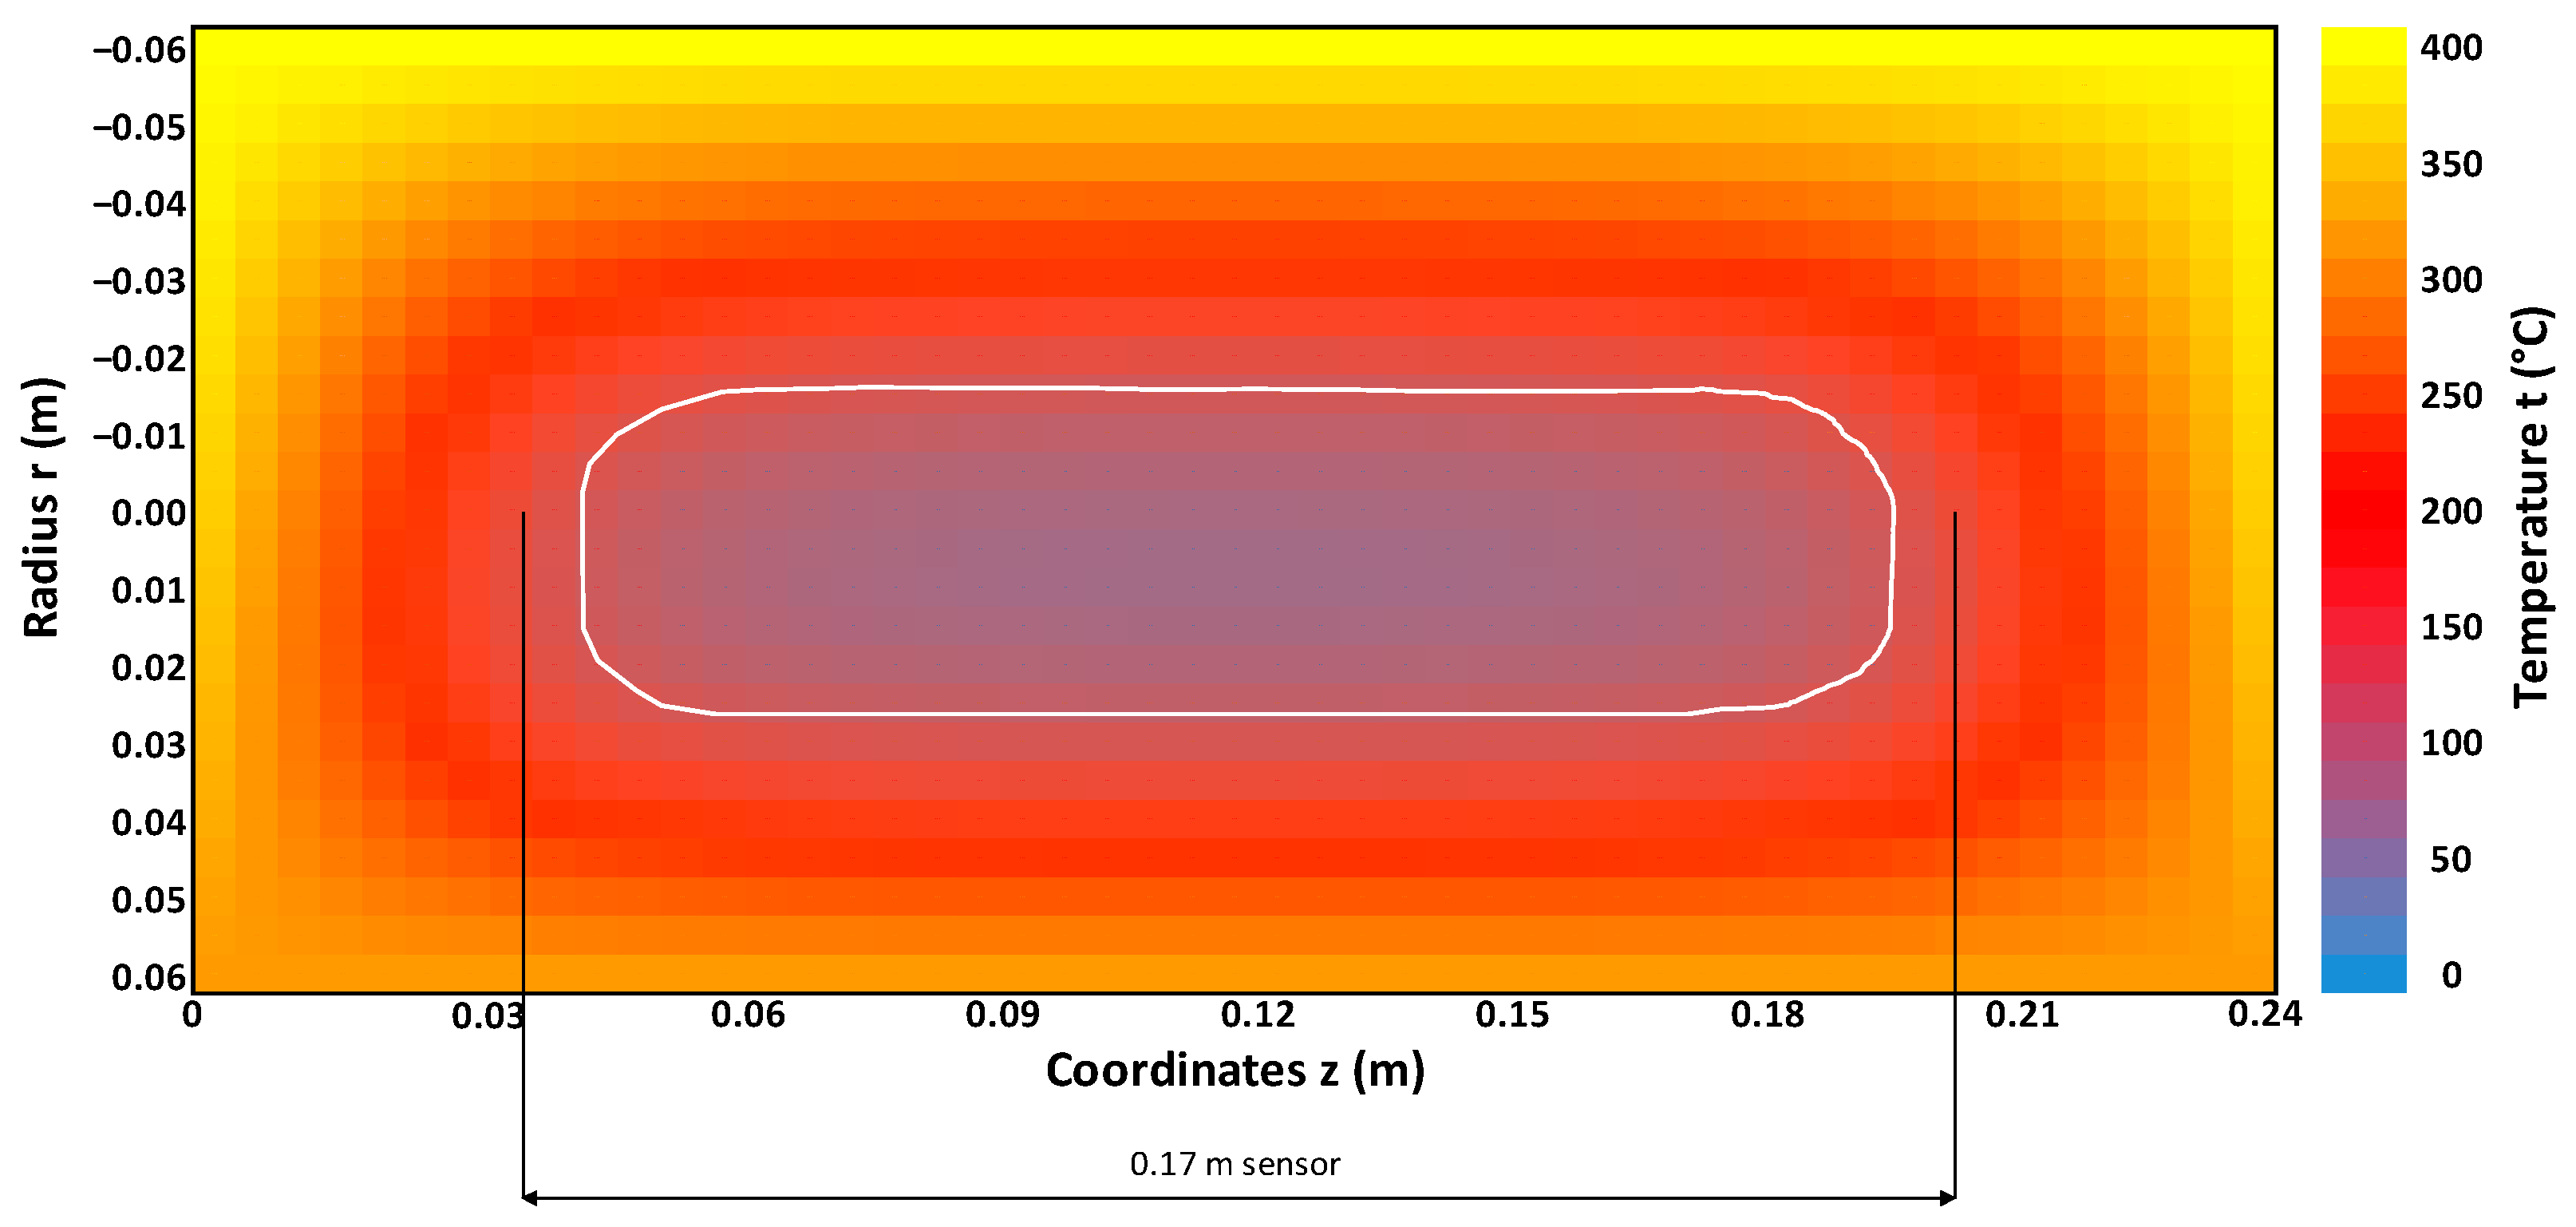
Figure 11 shows the temperature field after a 30 min simulation for the vacuum station caisson boundary conditions. The temperature field was calculated using the C–N method based on the measured boundary conditions, which were as follows: the surface temperature of the cylinder at the shell of the ladle was 400 °C, the temperature on the opposite side was 300 °C. On the side walls of the cylinder, there was a parabolic temperature profile from 400 °C to 300 °C.
In Figure 11, the sensor area is highlighted here, and the area where the temperature was lower than 120 °C (temperature limit of the sensor, as already mentioned above) is highlighted. It can be seen in the figure that the RFID sensor would extend to areas with a temperature higher than 120 °C and, therefore, would degrade under these conditions.
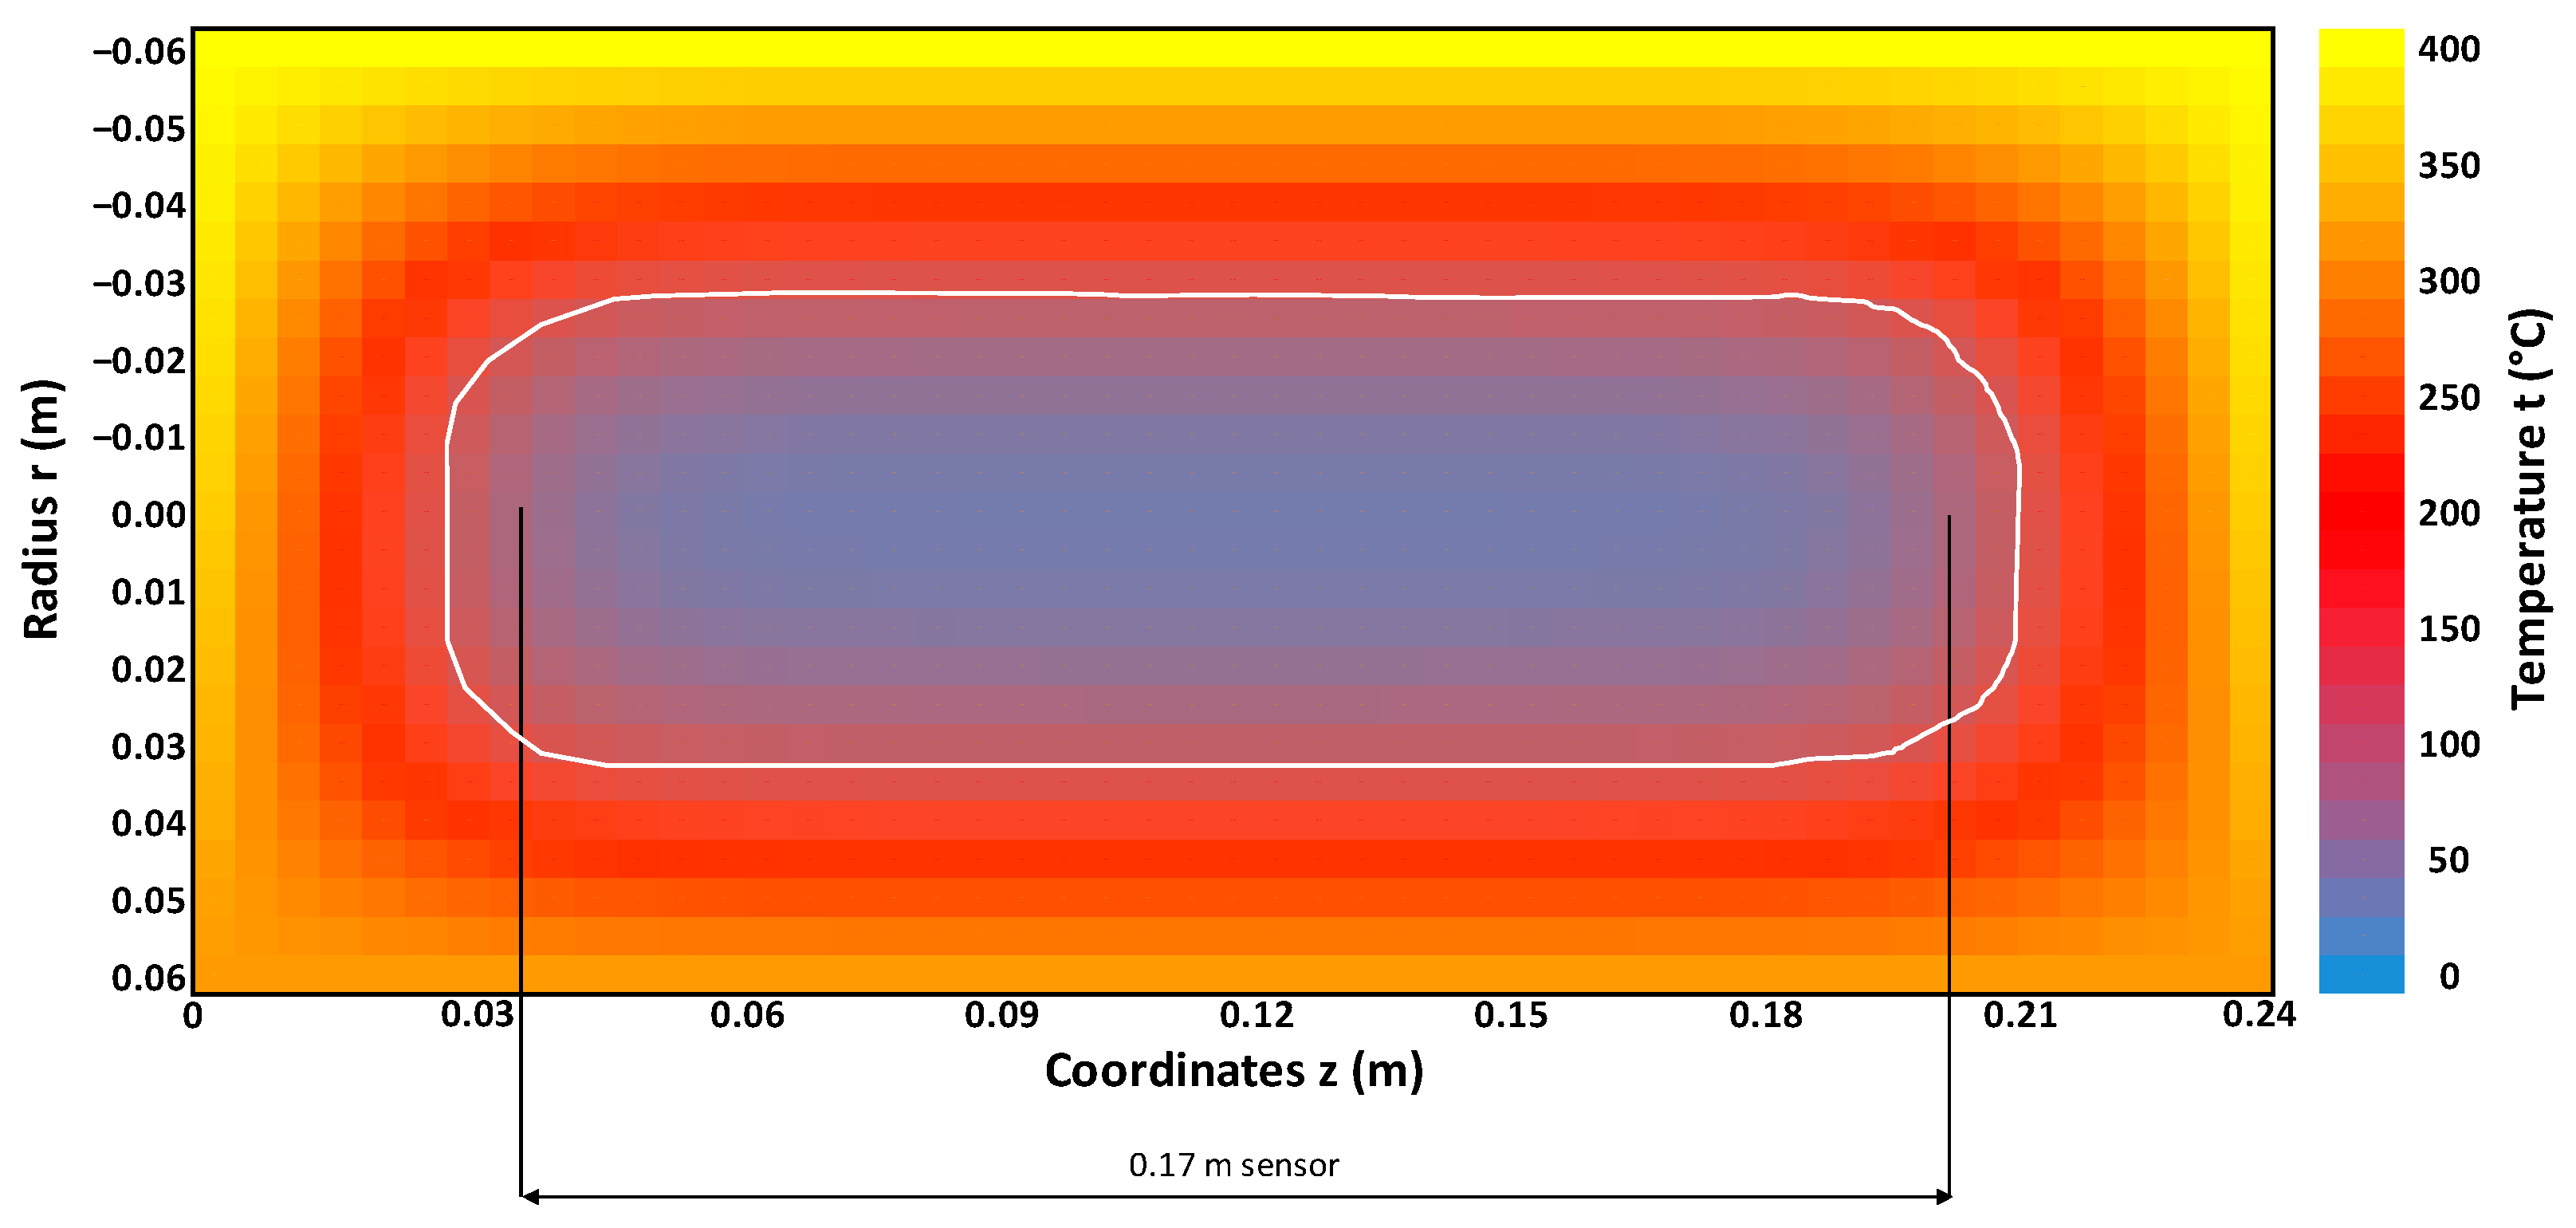
For this reason, it was decided that the ceramic cylinder would be cooled to 25 °C with cold air for several minutes before entering the vacuum station. Only then would the ladle be sealed in the caisson of the vacuum station. The temperature field for these initial conditions is shown in Figure 12. It can be seen in the figure that a sensor built 4 cm from the outer surface of the cylinder would be stressed by a temperature lower than 120 °C.
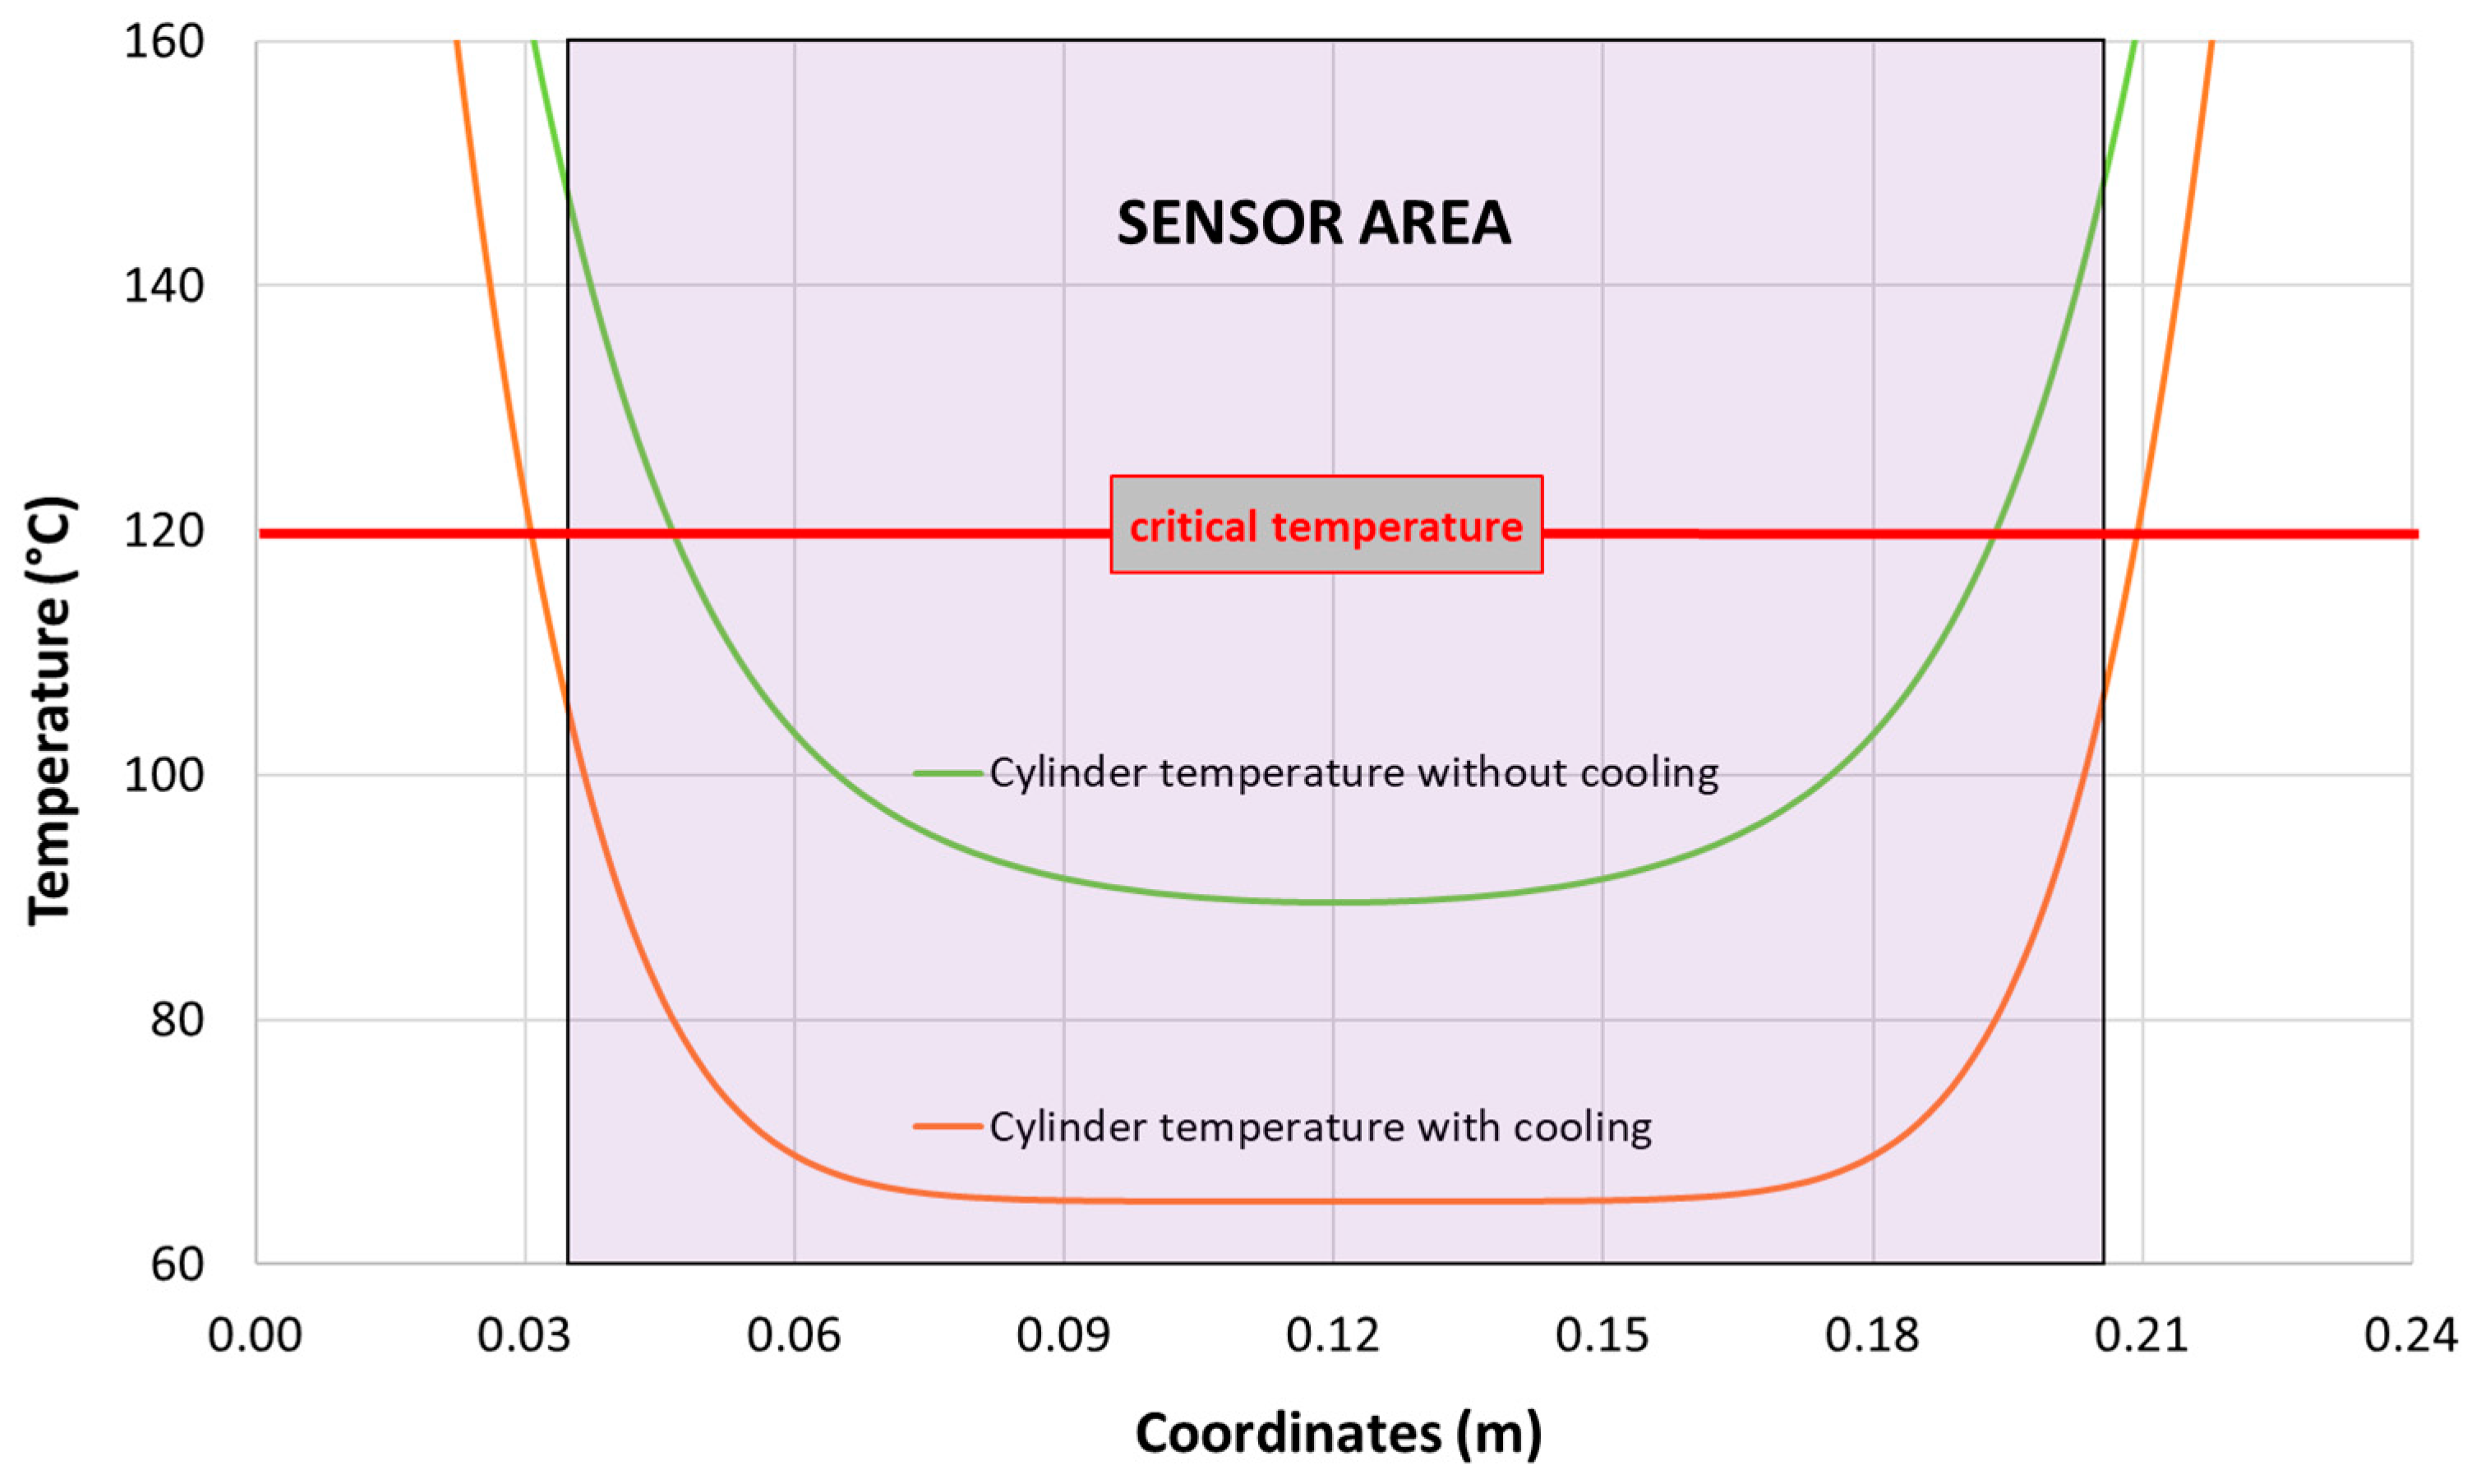
A comparison of the temperatures of both variants in the vacuum station, i.e., without cooling the sensor before placing it in the caisson of the vacuum station and while cooling it, is shown in Figure 13. The temperature profiles in the plane 4 cm from the outer surface of the cylinder are shown in this figure.

4. Conclusions

A system for the automatic identification of the presence of ladles at a given workplace was designed for seamless communication between the control system and the higher level of control in which the ladle cycle model works. It is an RFID system based on the principle of radio data transmission between the sensor and a moving object (in our case, a ladle), which is equipped with a so-called transponder (RFID tag). The RFID transponder was mounted on the shell of the ladle. RFID transponders can have various designs, mainly depending on the nature of their application. In our case, the transponder, in the form of a thin wire 17 cm long, was placed on the shell of the ladle and was therefore constantly exposed to the conditions of the ladle surface. These were mainly high temperatures, often exceeding 250 °C. The maximum operating temperature of the RFID transponder was 120 °C. At higher temperatures, it would be damaged.
For this reason, several types of insulation protections have been proposed to ensure that the RFID transponder temperature is below the critical temperature of 120 °C throughout the operation of the ladle. The temperature field was calculated using numerical methods based on the determined boundary conditions for these insulation protections. On this basis, the most suitable variant of insulation protection for the RFID transponder was selected.
Two methods were chosen for the calculations of temperature fields, i.e., the explicit–implicit finite difference method—the so-called Crank–Nicholson method—and the finite element method—the so-called FVM. Numerical simulations showed that both methods accurately captured real states, corresponding to real data obtained from operational measurements. Therefore, both approaches are applicable for the description of unmeasurable temperature fields in regular operation.
The contactless identification system, which has been upgraded and is currently in the testing phase, should, in the final step, guarantee the identification of the ladle in all production units (ladle furnace, casting machines, transfer car) under the operating conditions of a steel plant.

Author Contributions

Conceptualization, D.J. and P.T.; methodology, D.J., M.M., M.V., P.T. and J.V.; investigation, M.M., M.V. and P.T.; writing—original draft preparation, D.J., M.M. and J.V.; writing—review and editing, M.V.; visualization, M.M.; supervision, D.J.; project administration, M.V.; funding acquisition, M.V. All authors have read and agreed to the published version of the manuscript.

Funding

This work was supported by Project No. (FW01010097)—“Automated Control Systems in the Field of Ladle Metallurgy”, Funder Technology Agency of the Czech Republic (TACR) and Project No. (SP2022/13)—“Low energy processes and materials in industry”, Funder Ministry of Education, Youth and Sports of the Czech Republic (MEYS, MŠMT)—Specific research.

Informed Consent Statement

Informed consent was obtained from all subjects involved in the study.

Data Availability Statement

The data presented in this study are available on request from the corresponding author.

Conflicts of Interest

The authors declare no conflict of interest.

References

  1. Siddiqui, M.I.H.; Kim, M.-H. Two-Phase Numerical Modeling of Grade Intermixing in a Steelmaking Tundish. Metals 2019, 9, 40. [Google Scholar] [CrossRef] [Green Version]
  2. Jančar, D.; Klárová, M.; Tvardek, P.; Vlček, J.; Hašek, P.; Ovčačík, F. Utilization of casting ladle lining enthalpy for heating gas saving in the course of ladle preheating. Metalurgija 2014, 53, 159–162. Available online: https://hrcak.srce.hr/110059 (accessed on 1 June 2022).
  3. Balog, M.; Szilágyi, E.; Dupláková, D.; Minďaš, M. Effect verification of external factor to readability of RFID transponder using least square method. Measurement 2016, 94, 233–238. [Google Scholar] [CrossRef]
  4. Chen, H.; Chen, Y.; Yang, L. Intelligent early structural health prognosis with nonlinear system identification for RFID signal analysis. Comput. Commun. 2020, 157, 150–161. [Google Scholar] [CrossRef]
  5. Hardi, E.; Veigt, M.; Koerdt, M.; Herrmann, A.S.; Freitag, M. Monitoring of the vacuum infusion process by integrated RFID transponder. Procedia Manuf. 2020, 52, 20–25. [Google Scholar] [CrossRef]
  6. Deng, F.; Wen, K.; Zeng, H.; Xie, Z. Novel metal-oxide arrester monitoring technology based on RFID sensor and mind evolutionary computation. Electr. Power Syst. Res. 2021, 192, 106859. [Google Scholar] [CrossRef]
  7. Duan, K.-K.; Cao, S.-Y. Emerging RFID technology in structural engineering—A review. Structures 2020, 28, 2404–2414. [Google Scholar] [CrossRef]
  8. Zhang, Y.; Bai, L. Rapid structural condition assessment using radio frequency identification (RFID) based wireless strain sensor. Autom. Constr. 2015, 54, 1–11. [Google Scholar] [CrossRef]
  9. El Masri, I.; Lescop, B.; Talbot, P.; Vien, G.N.; Becker, J.; Thierry, D.; Rioual, S. Development of a RFID sensitive tag dedicated to the monitoring of the environmental corrosiveness for indoor applications. Sens. Actuators B Chem. 2020, 322, 128602. [Google Scholar] [CrossRef]
  10. Tatiparthi, S.R.; De Costa, Y.G.; Whittaker, C.N.; Hu, S.; Yuan, Z.; Zhong, R.Y.; Zhuang, W.-Q. Development of radio-frequency identification (RFID) sensors suitable for smart-monitoring applications in sewer systems. Water Res. 2021, 198, 117107. [Google Scholar] [CrossRef]
  11. Jančar, D.; Tvardek, P.; Machů, M.; Velička, M.; Vlček, J.; Ovčačíková, H. Design of protection of contactless identification system for ladles. In Proceedings of the 39th Meeting of Departments of Fluid Mechanics and Thermodynamics, Horní Bečva, Czech Republic, 13–15 October 2021. [Google Scholar]
  12. Chaskalovic, J. Mathematical and Numerical Methods for Partial Differential Equations. Applications for Engineering Sciences, 1st ed.; Springer: Berlin/Heidelberg, Germany, 2014; pp. 1–372. [Google Scholar]
  13. Woodford, C.; Phillips, C. Numerical Methods with Worked Examples: Matlab Edition, 2nd ed.; Springer: Berlin/Heidelberg, Germany, 2012; pp. 1–266. [Google Scholar]
  14. Zhu, J.; Lin, W. Efficient Computation of Heat Distribution of Processed Materials under Laser Irradiation. Mathematics 2021, 9, 1368. [Google Scholar] [CrossRef]
  15. Fredman, T. A model for rapid computation of dynamic heat conduction in steelmaking ladle linings. IFAC Proc. 2000, 33, 369–373. [Google Scholar] [CrossRef]
  16. Phanomchoeng, G.; Chantranuwathana, S.; Charunyakorn, P. On line Ladle Lining Temperature Estimationby Using Bounded Jacobian Nonlinear Observe. J. Iron Steel Res. Int. 2016, 23, 792–799. [Google Scholar] [CrossRef]
  17. Li, L.; Li, X.; Zhu, Z.; Li, B. Numerical modeling of multiphase flow in gas stirred ladles: From a multiscale point of view. Powder Technol. 2020, 373, 14–25. [Google Scholar] [CrossRef]
  18. Zhang, H.; Zhou, P.; Yuan, F. Effects of ladle lid or online preheating on heat preservation of ladle linings and temperature drop of molten steel. Energy 2021, 214, 118896. [Google Scholar] [CrossRef]
  19. Lu, B.; Meng, X.; Zhu, M. Numerical analysis for the heat transfer behavior of steel ladle as the thermoelectric waste-heat source. Catal. Today 2018, 318, 180–190. [Google Scholar] [CrossRef]
  20. Damhofa, F.; Brekelmansb, W.A.M.; Geers, M.G.D. Predictive FEM simulation of thermal shock damage in the refractory lining of steelmaking installations. J. Mater. Processing Technol. 2011, 211, 2091–2105. [Google Scholar] [CrossRef]
  21. Hahn, D.W.; Özişik, M.N. Heat Conduction, 1st ed.; John Wiley & Sons: Hoboken, NJ, USA, 2012; pp. 1–752. [Google Scholar]
  22. Kalbasi, R.; Alaeddin, S.M.; Akbari, M.; Afrand, M. Analytical Solution of Heat Conduction in a Symmetrical Cylinder Using the Solution Structure Theorem and Superposition Technique. Symmetry 2019, 11, 1522. [Google Scholar] [CrossRef] [Green Version]
  23. Kulacki, F.A. Handbook of Thermal Science and Engineering, 1st ed.; Springer: Berlin/Heidelberg, Germany, 2018; pp. 1–3075. [Google Scholar]
  24. Brenn, G. Analytical Solutions for Transport Processes: Fluid Mechanics, Heat and Mass Transfer, 1st ed.; Springer: Berlin/Heidelberg, Germany, 2017; p. 315. [Google Scholar]
  25. Mori, C.N.T.; Romão, E.C. Numerical simulation by finite difference method of 2D convection-diffusion in cylindrical coordinates. Appl. Math. Sci. 2015, 9, 6157–6165. [Google Scholar] [CrossRef] [Green Version]
  26. Taler, J.; Duda, P. Solving Direct and Inverse Heat Conduction Problems, 1st ed.; Springer: Berlin/Heidelberg, Germany, 2006; pp. 1–915. [Google Scholar]
  27. López-Cornejo, M.S.; Vergara-Hernández, H.J.; Arreola-Villa, S.A.; Vázquez-Gómez, O.; Herrejón-Escutia, M. Numerical Simulation of Wire Rod Cooling in Eutectoid Steel under Forced-Convection. Metals 2021, 11, 224. [Google Scholar] [CrossRef]
  28. Joachimiak, M. Analysis of Thermodynamic Parameter Variability in a Chamber of a Furnace for Thermo-Chemical Treatment. Energies 2021, 14, 2903. [Google Scholar] [CrossRef]
  29. Selmer, I.; Farrell, P.; Smirnova, I.; Gurikov, P. Comparison of Finite Difference and Finite Volume Simulations for a Sc-Drying Mass Transport Model. Gels 2020, 6, 45. [Google Scholar] [CrossRef]
  30. Idelsohn, S.R. Numerical Simulations of Coupled Problems in Engineering, 1st ed.; Springer: Cham, Switzerland, 2014; pp. 1–422. [Google Scholar]
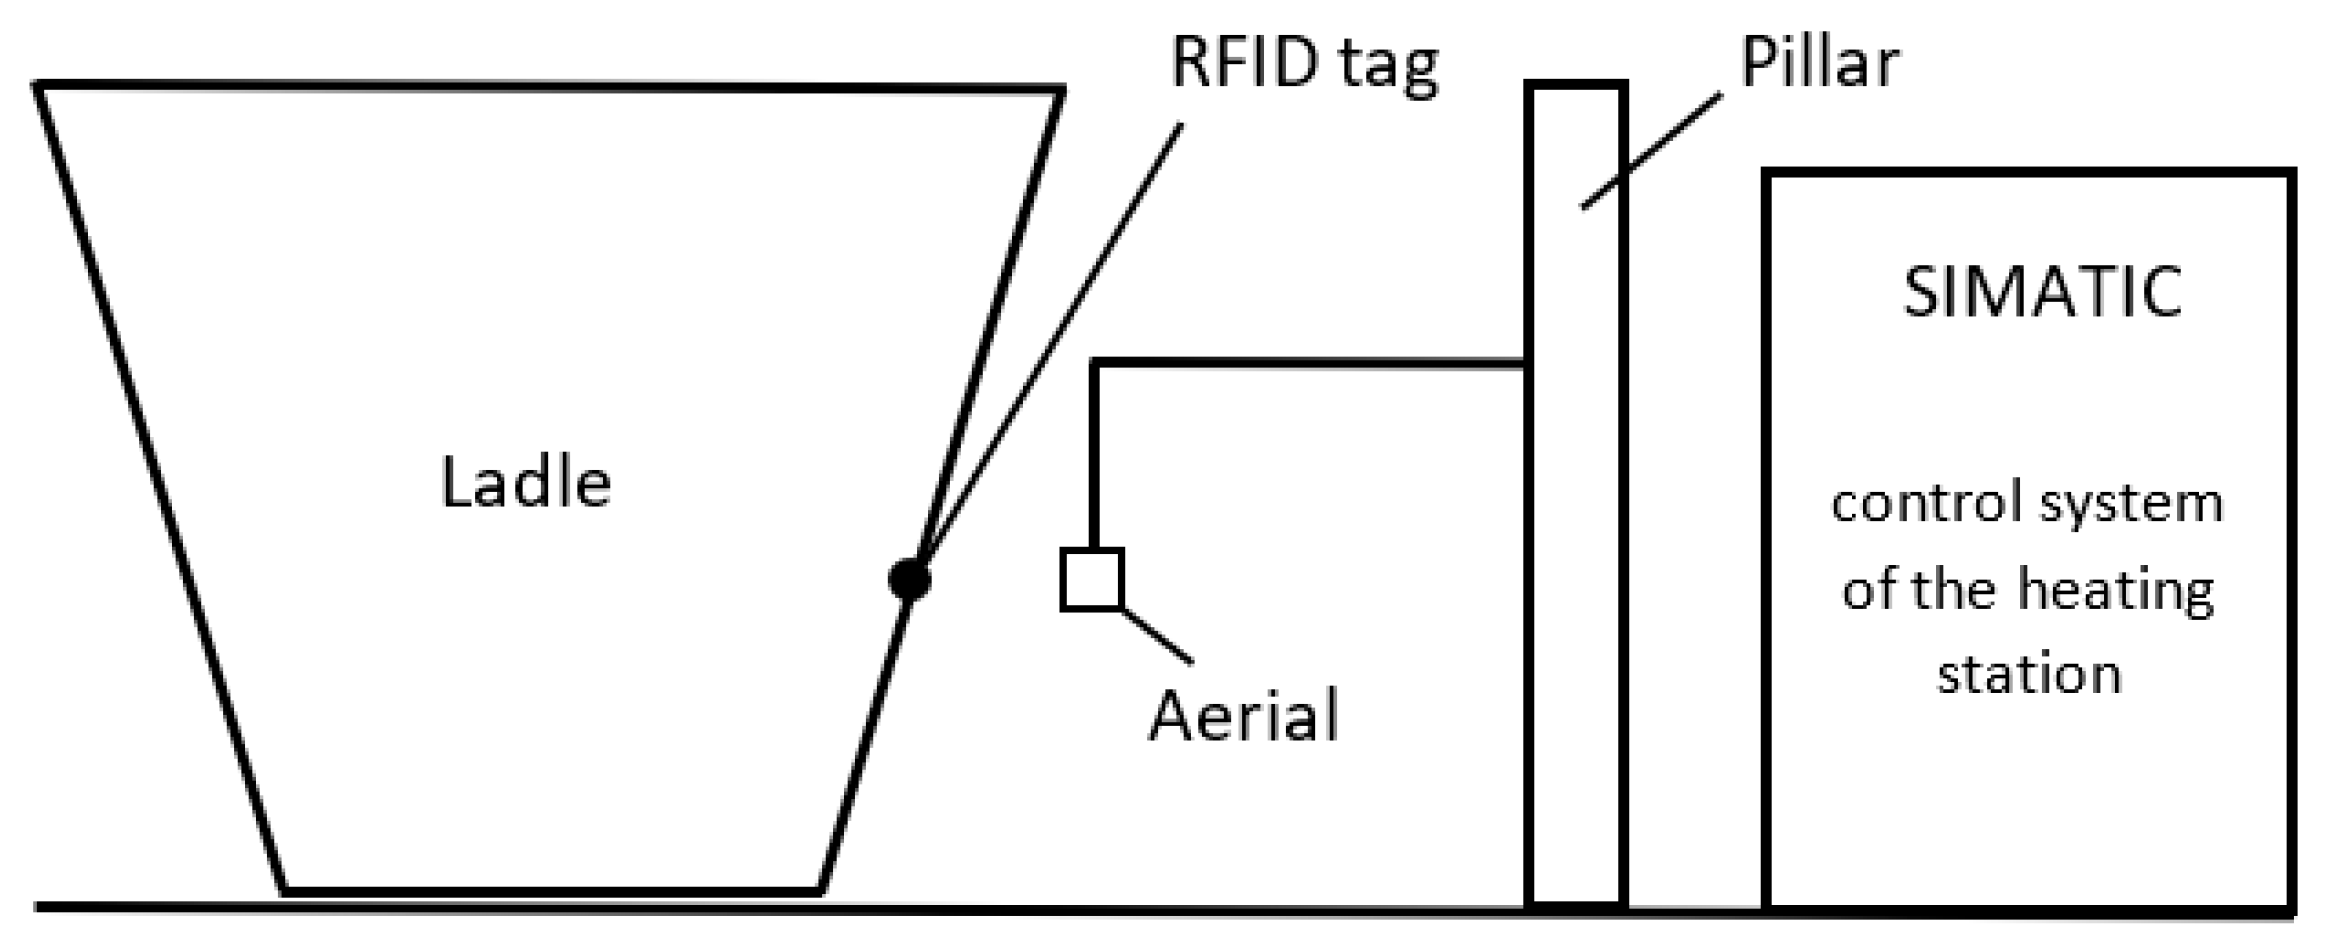
Figure 1. Scheme of the identification system.
Metals 12 01163 g001
Figure 2. Ceramic RFID sensor protection.
Metals 12 01163 g002
Figure 3. Scheme of the internal node of the analyzed area.
Metals 12 01163 g003
Figure 4. Placement of the RFID sensor and thermal insulation box on the steel shell of the ladle.
Metals 12 01163 g004
Figure 5. Temperature distribution in the cylinder at the beginning of the simulation.
Metals 12 01163 g005
Figure 6. Temperature field according to the C–N method after 5 h of heating.
Metals 12 01163 g006
Figure 7. Temperature field according to the FVM method after 5 h of heating.
Metals 12 01163 g007
Figure 8. Comparison of the values measured with the numerical methods C–N and FVM.
Metals 12 01163 g008
Figure 9. Temperature field by the C–N method after 7 h of a normal work campaign.
Metals 12 01163 g009
Figure 10. Temperature distribution in the central plane of the cylinder and in a plane 4 cm from the outer surface.
Metals 12 01163 g010
Figure 11. Temperature field determined by the C–N method after 30 min in a vacuum station.
Metals 12 01163 g011
Figure 12. C–N temperature field after 30 min in a vacuum station while cooling the cylinder to 25 °C.
Metals 12 01163 g012
Figure 13. Temperature distribution after 30 min of vacuuming in a plane 4 cm from the outer surface of the cylinder.
Metals 12 01163 g013
Table 1. Properties of the insulating materials.
MaterialDensity (kg m−3)Thermal CONDUCTIVITY at 200 °C (W/m·K)Specific Heat Capacity at 200 °C (J/kg·K)Refractoriness (°C)Crushing Strength (N/mm2)
Promalight 10002800.02287510000.32
Fireclay19500.965846174010.00
Publisher’s Note: MDPI stays neutral with regard to jurisdictional claims in published maps and institutional affiliations.