Article

Micromechanics-Based Low Cycle Fatigue Life Prediction Model of ECAPed Aluminum Alloy

1
Key Laboratory of Disaster Prevention and Structural Safety of Ministry of Education, Guangxi Key Laboratory of Disaster Prevention and Engineering Safety, College of Civil Engineering and Architecture, Guangxi University, Nanning 535000, China
2
Key Laboratory of Beibu Gulf Offshore Engineering Equipment and Technology, Beibu Gulf University, Education Department of Guangxi Zhuang Autonomous Region, Qinzhou 535011, China
3
College of Mechanical Engineering, Guangxi University, Nanning 535000, China
*
Author to whom correspondence should be addressed.
Metals 2022, 12(7), 1127; https://doi.org/10.3390/met12071127
Submission received: 5 June 2022 / Revised: 27 June 2022 / Accepted: 28 June 2022 / Published: 30 June 2022
(This article belongs to the Special Issue Residual Stress and Fatigue of Metals)

Abstract

:
Ultrafine-grained aluminum alloys (UFG AA) show great potential in the design of fatigue-resistant lightweight alloys, and the methodology to assess low-cycle fatigue (LCF) life remains to be studied. In this work, a micromechanics-based LCF life prediction model is presented by conducting crystal plasticity finite element simulation (CPFEM). The fatigue indicator parameter (FIP) of maximum accumulated equivalent plastic strain energy, modulated by triaxiality, is developed to assess the material damage in the microstructure. Particularly, a new multiaxial strain parameter is proposed by considering the combined influence of the mean strain and non-proportional cyclic additional hardening effect, and then directly embedding into the cyclic J-integral. Finally, the reformulated Manson-Coffin relationship is theoretically constructed by correlating the crack tip opening displacement to the crack propagation equation. The results show the scatter fatigue life of UFG AA6061 is not only related to the inhomogeneous evolution of plastic deformation but also to the local stress state. Since the proposed approach considers both the deformation mechanisms at the micro-scale and the corresponding macroscopic responses, it can predict the LCF life of UFG AA with reasonable accuracy.

1. Introduction

The 6xxx series Al alloys (AA) have been widely used for the fabrication of structure or machine components due to their excellent combination of high specific strength, fatigue life and corrosion resistance [1]. However, with the increasing demand for the application of lightweight alloys, higher performance, such as improved hardness and strength, is required for AA in a lightweight design. In recent decades, many researchers have focused on the manufacture of ultrafine grains (UFG) metallic alloys and the application of these kinds of materials in actual engineering conditions, such as blades [2], medical implants [3], gears [4] and connecting rods [5], etc. However, micro-scale fatigue mechanisms in UFG metallic alloys are still not yet fully understood so far [6,7]. Thus, more theoretical investigations are required to fully use these promising materials.
As compared to macro continuum models, the crystal plasticity finite element method (CPFEM) presents a potential advantage due to its quantitative assessment between microstructural feature evolution and material deformation [8,9]. Previous CPFEM investigations generally correlated the micro-scale deformation with fatigue properties through different kinds of fatigue indicator parameters (FIPs). For example, Zhang et al. [10,11] developed a statistical criterion within the crystal plasticity framework to predict the fatigue life of polycrystalline materials by tracking the evolution of inhomogeneous deformation under a repeat fatigue loading condition. Castelluccio et al. [12] successfully revealed the mechanism of small crack propagation by establishing a microstructure-sensitive crack propagation equation. The small crack propagation life was predictable by using the new FIP with consideration of interactions with grain boundaries. Li et al. [13] assumed that fatigue failure can be judged by the accumulated equivalent plastic slip calculated within the crystal plasticity framework. The rationality of the newly established microstructure-sensitive FIP was verified by experimental characterization. Further, a comparative analysis was conducted by researchers to assess the accuracy of these microstructure-sensitive FIPs under LCF loading. Some scholars [14] confirm that plastic strain energy (PSE) is a more convincing approach for fatigue life prediction under the condition of high strain, as the PSE dissipation is a criterion that is independent of material parameters and it can reflect the strain path dependence under multiaxial cyclic loading. In addition, Wang et al. [15] adopted the PSE to assess fatigue damage evolution of materials at the crack tip of a compact tension (CT) specimen under LCF loading and found that the development of mechanical degradation may depend on the collective effects of grain size and inclusion combination. However, for UFG AA, large amounts of the inclusion of precipitates can lead to the micro-crack nucleation, growth, coalescence and macro-crack propagation inevitably occurring leading to macro-degradation and rapid failure [16]. As a result, the unique structure of AA under the action of tension and compression may render a failure mode that is different from that of its coarse grain (CG) counterpart.
Generally, the LCF life of materials can be divided into three parts, i.e., nucleation (crack size ranging from 10−7 to 10−5 m), small crack propagation (crack size ranging from 10−5 to 10−4 m) and long crack (crack size >10−3 m) [17]. However, for UFG AA, it was observed that the small crack propagation regime dominates the LCF life because the micro-cracks are prone to occur in advance due to a lack of ductility [18,19]. These experimental results inspire us that the micromechanical model based on fracture mechanics and crystal plasticity theory can provide a better prediction under high strain LCF loading conditions. Recently, some scholars have tried to evaluate the fracture toughness of UFG materials through calculating J-integrals [20,21,22]. In addition, the small crack propagation life can be predicted by associating the cyclic J-integral with the range of crack tip opening displacement. Ding et al. [23] firstly developed an LCF life model for UFG materials based on fracture mechanics. The controlling fatigue indicator parameter to drive crack propagation in their research is the plastic strain range. However, most of these investigations above were established by assuming a very small initial radius of crack, without considering the influence of the heterogeneous microstructure and anisotropic mechanical behavior of materials. This may bring errors to the prediction of the LCF life of UFG materials. As emphasized in references [17,24,25], the assessment and prediction of early fatigue behavior require micromechanics-based modeling. McDowell et al. [26] discussed the influence of microstructure attributes and properties on small crack propagation, and then the cycles required to propagate a small crack to the macro one were assessed by incorporating the Fatemi and Socie (F-S) critical plane model [18] into the cyclic J-integral. Subsequently, the F-S model was regarded as the FIP and embedded into the small crack growth rate equation to obtain the small crack propagation life by Shenoy [27]. More recently, Yuan and Castelluccio [17] utilized a modified F-S model to predict the small crack life in bridge steel welds by CPFEM. However, for the ultrafine grains subjected to the local multiaxial strain-controlled loading history [28], the mean strain plays a non-negligible role in the evolution of small crack propagation as a result of complicated loading paths and non-proportional loading. Moreover, the local multiaxial stress-strain states at the grain level can give rise to the non-proportional cyclic additional hardening (NPACH) effect in the process of LCF loading [29,30]. As a result, the inhomogeneous plastic deformation is not only related to the stress state but also to the strain path. As extensive experimental observations have exhibited errors could be made in the prediction of multiaxial fatigue life without considering the mean strain and NPACH effect, it is essential to reflect these factors in the LCF life prediction of UFG AA6061.
In this paper, a methodology based on micromechanics is proposed to predict the LCF life of UFG AA. Choosing the UFG AA6061 as a model material, the entire study is structured into the following two parts: in the first part, the constitutive based on the finite strain crystal plasticity theory is used to describe the cyclic plasticity of UFG AA6061. Furthermore, a character strain considering the combined effect of mean strain and NPACH effect was developed to determine the grain-level multiaxial deformation field. Coupled with the FIP of equivalent inelastic slip energy modulated by triaxiality, the cyclic J-integral was calculated and embedded into the small crack propagation equation to calculate the LCF life of UFG AA6061. In the second part, using the model, the fatigue damage evolution at the critical cites was studied from the perspective of energy evolution. Moreover, the distribution of the local multiaxial strain field with respect to different strain amplitudes was analyzed. Finally, the reliability of the proposed prediction model has been verified by comparing the predicted results with the experimental tests of UFG AA6061, proving its accuracy.

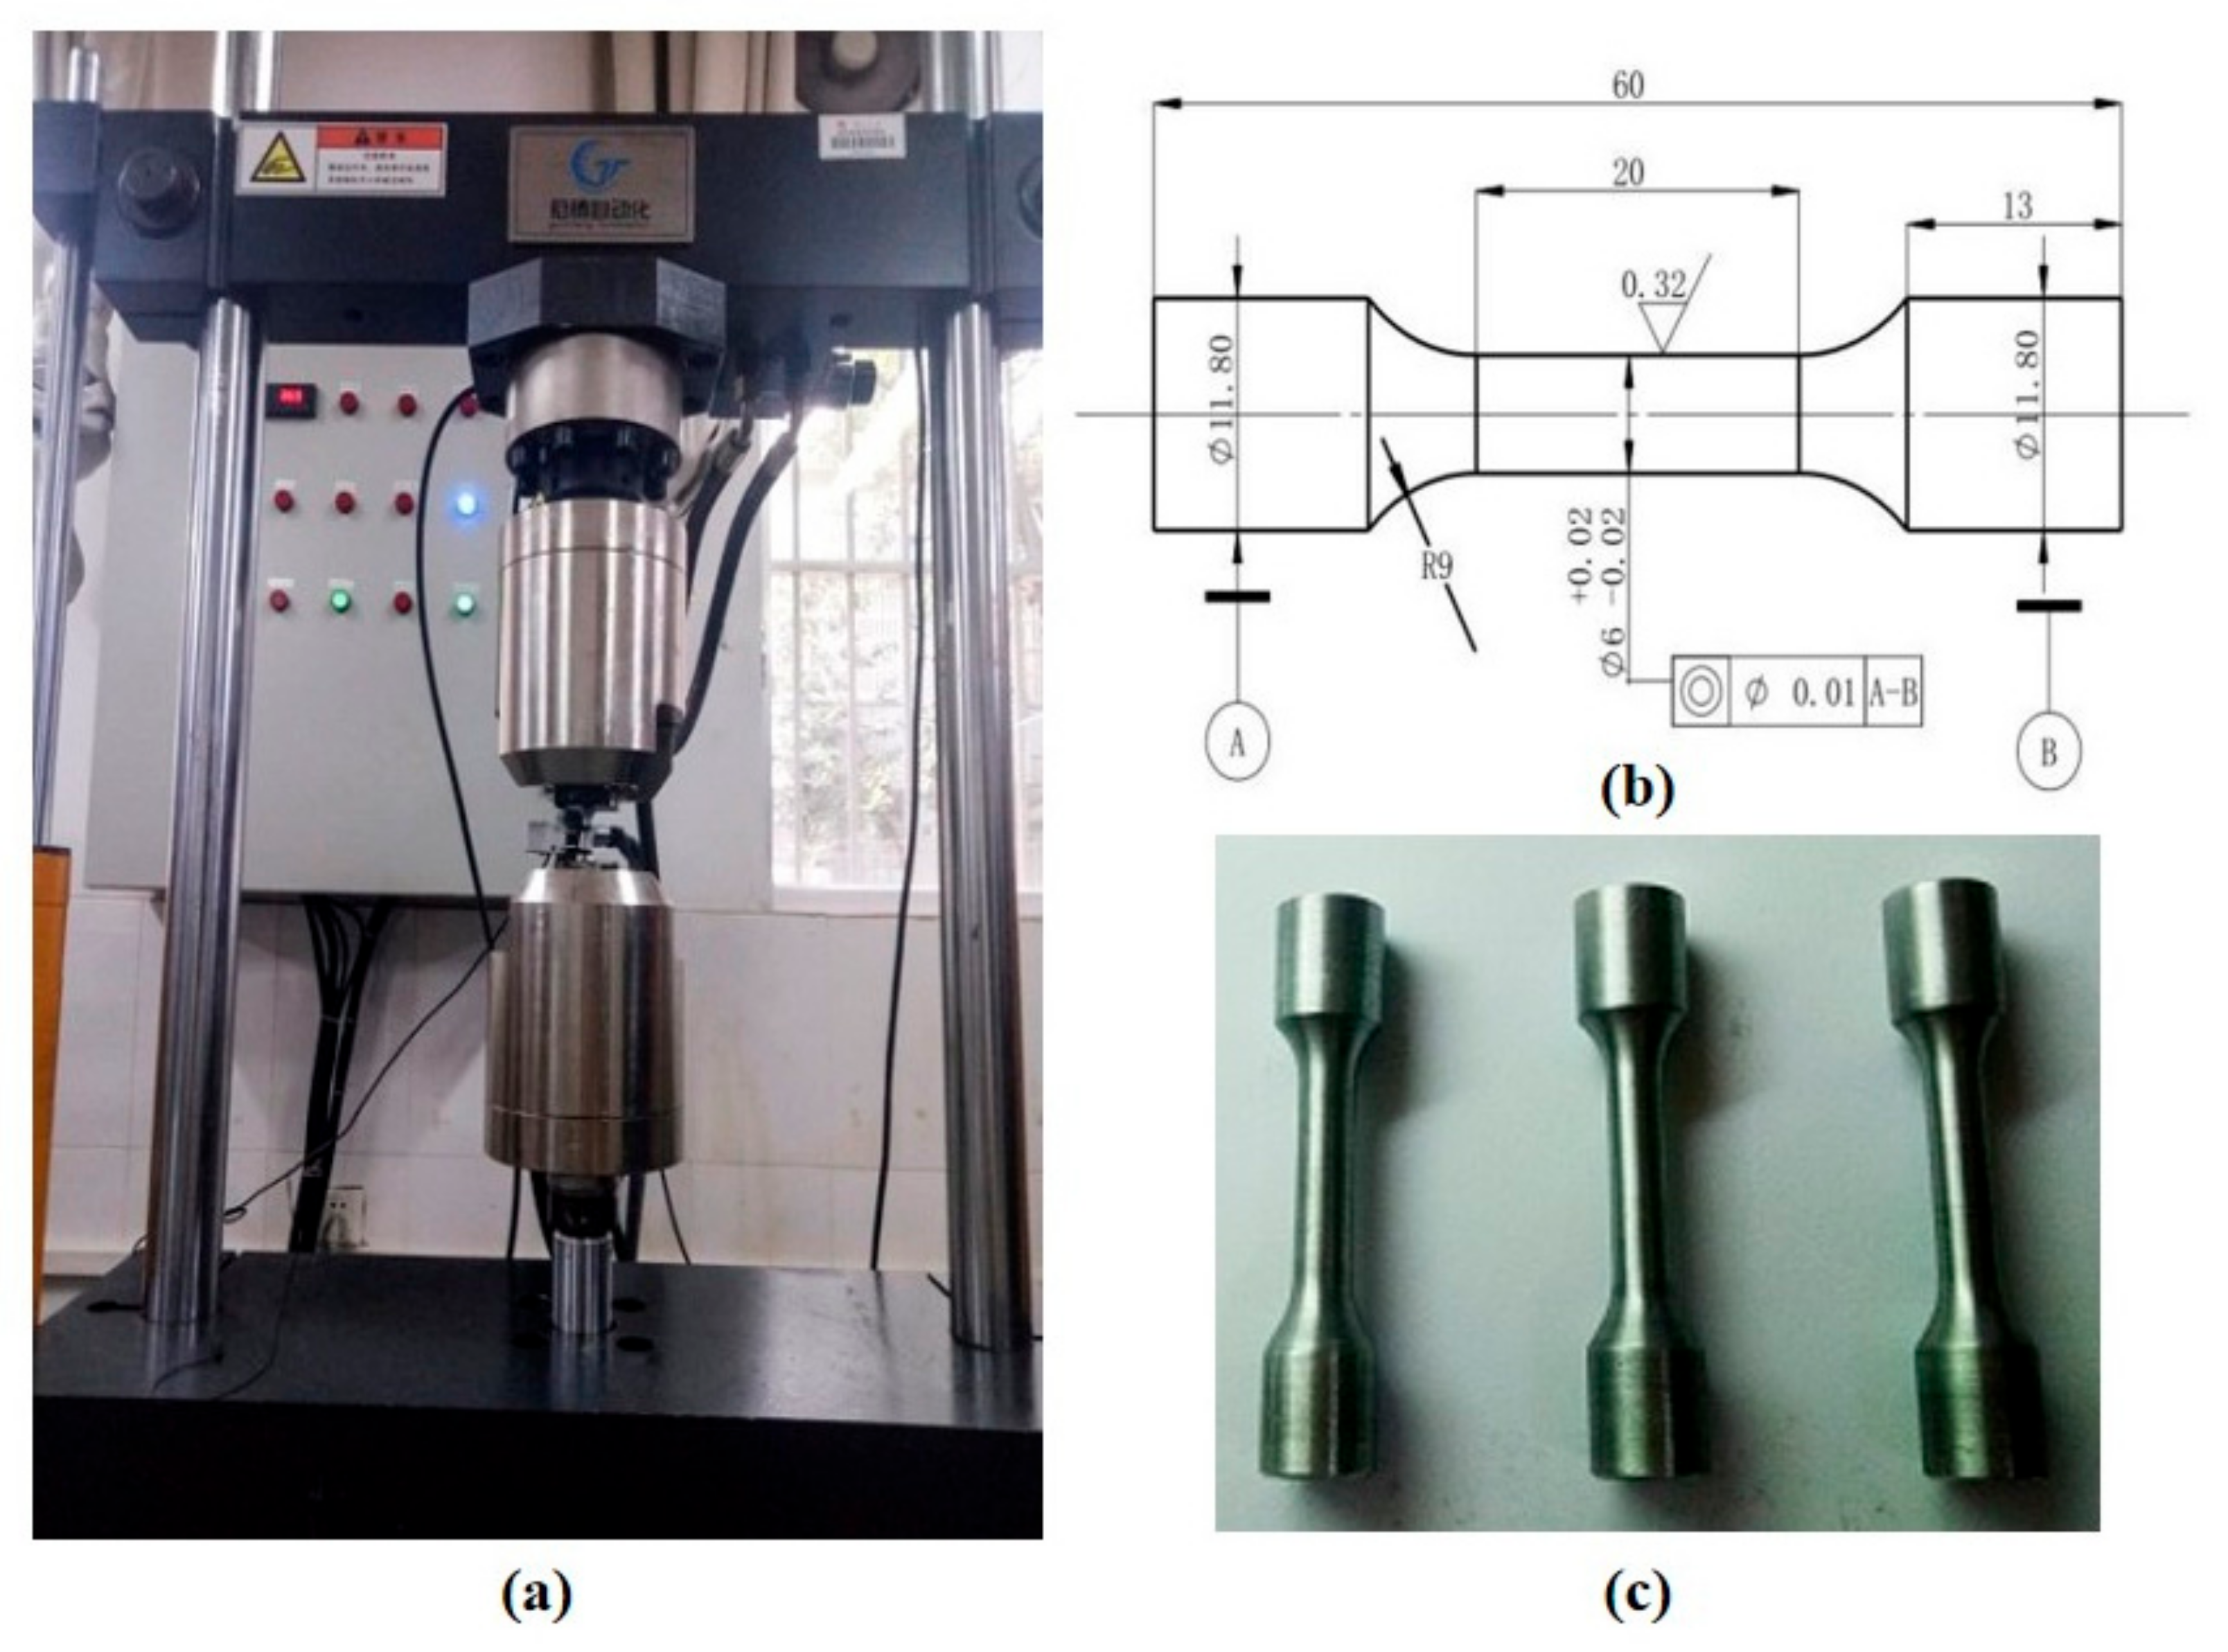
2. Material and Experimental Procedures

The materials used in ECAP is AA6061 and the main chemical composition of AA6061 are listed in Table 1. The process of ECAP was carried out on the wa-600b electro-hydraulic universal testing machine at room temperature (RT). After ECAP 8 passes extrusion, the microstructure of UFG AA6061 was measured by the EBSD (electron backscatter diffraction, Oxford Instruments, Oxford, England) technique to obtain crystal orientations and grain morphology.
The fatigue life of UFG AA6061 under symmetrical cyclic strain-controlled loading was conducted for strain amplitudes 0.005, 0.006 and 0.007 at room temperature and carried out on three samples for reproducibility. The tested samples and the experimental process were designed according to the axial constant amplitude LCF test methods for metal materials (GB/T 15248-1994). As shown in Figure 1a, the Guanteng PA-20 fatigue testing machine (Guanteng Instruments, Changchun, China) was used and the gauge distance of the extensometer was 12.5 mm. After the ECAP process, the deformed samples were machined into a cylindrical shape with a size of Φ11.8 mm × 60 mm (shown in Figure 1b,c). In addition, all the samples were carefully ground to reduce the effect of surface roughness. Moreover, the frequency of fatigue loading sine was fixed at 0.1Hz. According to the method in reference [23], a series of symmetrical cyclic strain-controlled loading tests were conducted to obtain the parameters related to the unique properties of UFG AA6061.

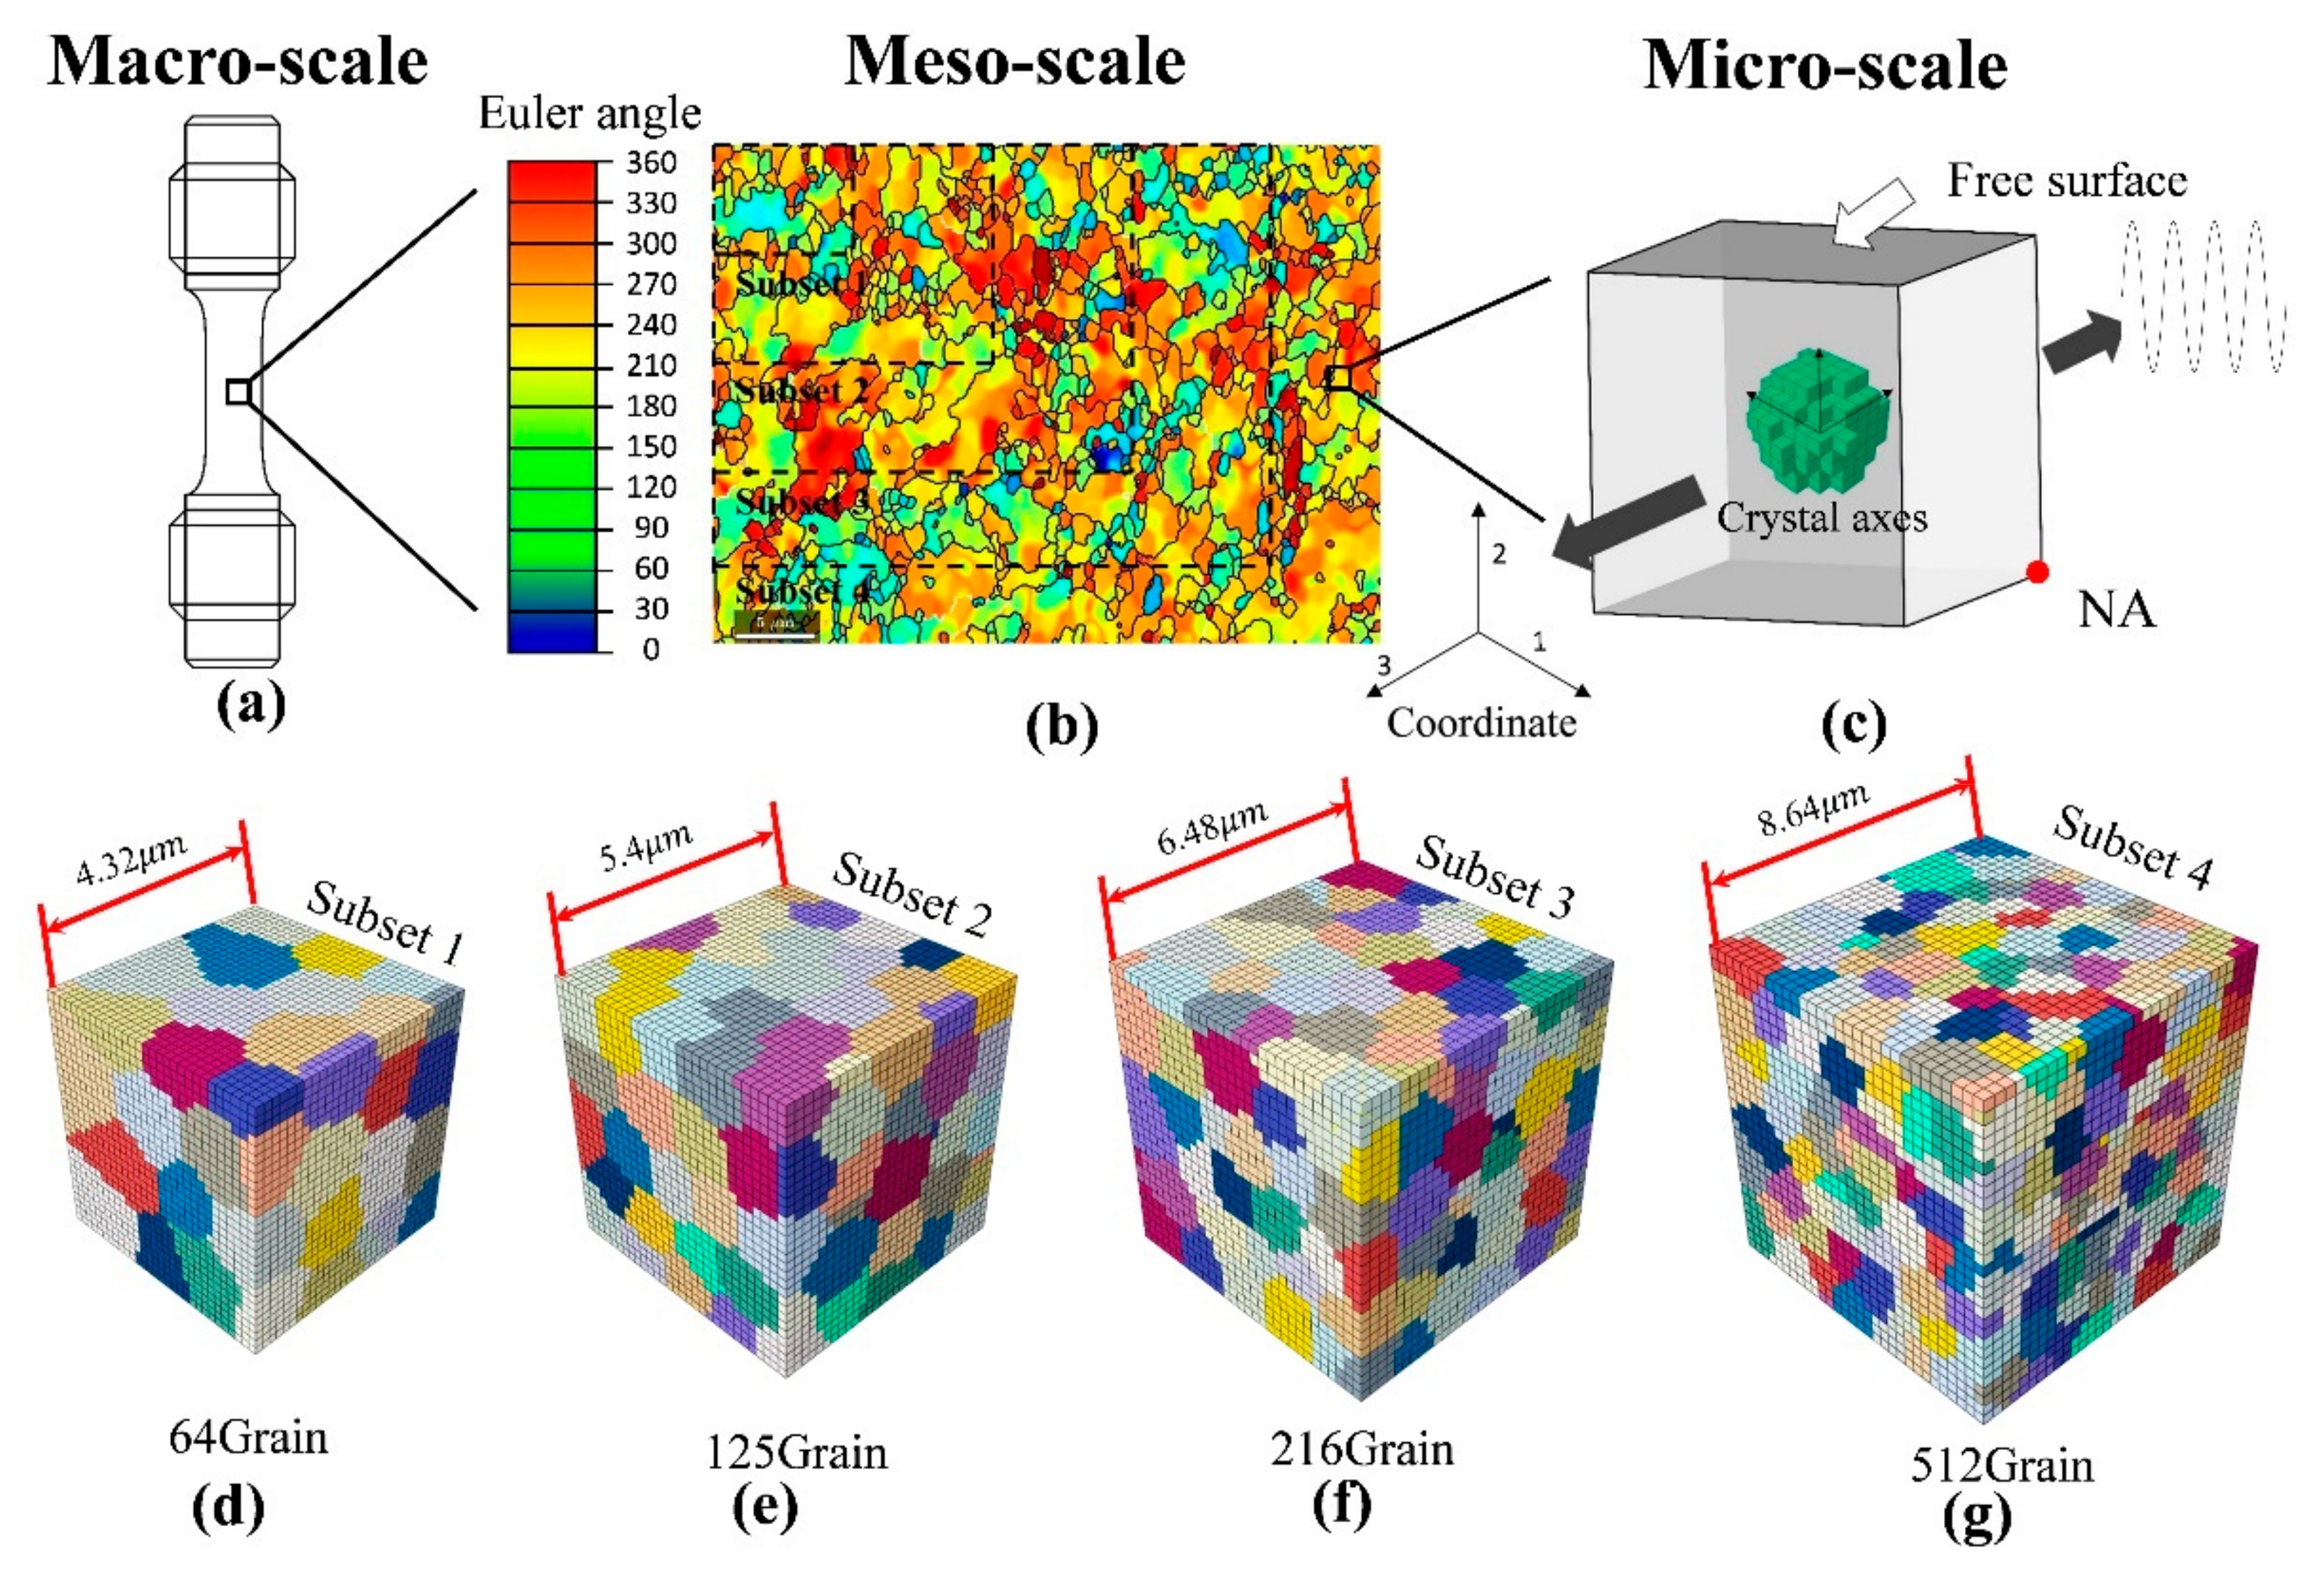
3. Simulation Methodology

3.1. The Crystal Plastic Constitutive Model

The following formulation of the constitutive equations of crystal plasticity is based on the work described in [31], the history of which was summarized in [32]. Considering the microscale slip mechanism of material based on continuum mechanics, the equations of Euler’s velocity gradient tensor and its decomposition for single crystal deformation can be written as follows:
L = F ˙ F 1 = L * + L P , L * = F ˙ * F * 1 L P = F * F ˙ P F ˙ P 1 F ˙ * 1 = F * α = 1 n m ( α ) n ( α ) γ ˙ ( α ) F ˙ * 1
L * , L P are corresponding to the elastic part and plastic part of Euler’s velocity gradient tensor. The elastic F * and plastic F P can be obtained by a multiplicative decomposition of the deformation gradient, F = F * F P . m ( α ) and n ( a ) stand for the unit vector defined in terms of the slip direction and the slip plane normal to the slip system with respect to the reference configuration, respectively. α refers to the total amount of slip system for FCC crystal structure materials, which is equal to 12. γ ˙ ( a ) is the crystal plastic resolved shear strain rate for the a-slip system.
In addition, Euler’s velocity gradient tensor can be decomposed into the following two parts:
L = D + W
where D is the symmetric part of the deformation rate. W is the antisymmetric (skew) spin tensor. In addition, they themselves can be decomposed into two parts, i.e., the lattice stretching tensor part and the spin tensor part, respectively. This relationship can be expressed as follows:
D = D * + D P = sym ( L * ) + sym ( L P ) W = W * + W P = asym ( L * ) + asym ( L P )  
where D * and W * are the elastic stretching tensors associated with elastic deformation and lattice rotations, respectively; D P and W P are the plastic spin tensors derived from distinct crystallographic slip mechanisms of material on a specific slip system.
The constitutive relation is the Jaumann stress rate, which can be expressed as follows:
σ ˙ J = σ ˙ W σ + σ W
Assuming elastic deformation is small and not influenced by the slip mechanism, the constitutive relation can be written as follows:
σ ˙ J = Q ( C : D * ) Q T
where C is the fourth-order elastic stiffness tensor of the crystal grain. Q represents the orientation of the local cubic system. Since the spatial orientation distribution strongly influences the mechanical behavior of UFG metals, the crystallographic texture data characterized by a triple of Euler angles obtained from EBSD was considered and translated into a 3 × 3 orthogonal matrices and then implemented into the user-supplied subroutine UMAT by ABAQUS.
For the α th slip system, a viscoplastic flow rule is used for the description of γ ˙ ( α ) , which is given by the following [33]:
γ ˙ ( α ) = γ ˙ 0 sgn τ ( α ) χ ( α ) τ ( α ) χ ( α ) g ( α ) k
where γ ˙ 0 is the reference strain rate. k refers to exponential constants related to the material properties.
τ ( α ) represents the resolved shear stress
τ ( α ) = P ( α ) σ
Here, P ( α ) is Schmid factor, and we have P ( α ) = 1 2 ( m ( α ) n ( α ) + n ( α ) m ( α ) ) . Furthermore, the evolution of backstress, χ ( α ) , is introduced as
χ ( a ) = C γ ˙ ( a ) D χ ( a ) γ ˙ ( a )
g ( α ) denotes the isotropic deformation resistance on the α th slip system
g ( α ) = μ G β = 1 12 A α β ρ β
A α β = h 0 ω 1 + ( 1 ω 2 ) σ α β
Furthermore, the overall dislocation density evolution equation considering the competition between the multiplication and annihilation of dislocations (increase or not of dislocation density) on each slip system is governed by the following equation [34]:
ρ ˙ ( α ) = γ ˙ ( α ) b 1 D g r a i n + α β ρ ( β ) K 2 y c ρ ( α )  

3.2. Indicator Parameters for Fatigue Damages

Previous investigations have demonstrated the energy dissipation per cycle can be regarded as a criterion to assess the fatigue crack formation, which can be expressed as follows [35]:
W d i s = c y c l e τ ( α ) d γ ( α ) = c y c l e σ e f f d ε p
The fatigue damage can be explained by a process of energy dissipation. When the PSE reaches the critical value, micro-cracks can be initiated from precipitates, dispersed second-phase particles, or other metallurgical defects such as cavity nucleation, which finally lead to the gradual material degradation via a complex void evolution process. For crystalline grains under a multiaxial stress state, the role of triaxiality and its relationship with fatigue crack initiation has been defined by adding a term accounting for its effect on limiting micro-slip [16]. In the present work, the formulation of the accumulated crystallographic strain is modified based on the previous theoretical work on the interplay between stress triaxiality and void shape in metals, where the effect of stress triaxiality is believed to be associated with the growth of voids [36,37]. In addition, then we incorporate the accumulated crystallographic strain into equivalent plastic energy so as to account for the effect of the local stress state on the energy dissipation. Therefore, the equivalent plastic energy released during the cycle deformation is defined as follows:
W e q , d i s p = c y c l e d W e q , d i s p = c y c l e σ e q d ε e q p
Here,
ε e q p ( N ) = n = 1 N t n t n + 1 ( 2 3 D P : D P ) 1 2 exp ( k T k 3 ) d τ
D P = 1 2 α = 1 12 γ ˙ α F e m α n α ( F e ) 1 + ( F e ) T n α m α ( F e ) T  
Here, t n and t n + 1 , i.e., the upper and lower limits of the integral, are denoted as one complete loading cycle. k is a stress concentration coefficient related to the geometry of the void [38]. T = σ m / σ e q , stands for stress triaxiality, which is known as the ratio of hydrostatic pressure to Mises equivalent stress. It should be noted that the factor k provides the switch between the two fatigue crack initiation modes. In the present work, k = 1.5 has been adopted since UFG AA6061 processed by ECAP has been experimentally observed with micro-cracks initiating from the nearly sphere-shaped oxide inclusions. Finally, the comparative analysis between k = 0 and k = 1.5 will be discussed in the following subsection.

3.3. Proposed Fatigue Life Approach

For the materials under uniaxial tensile-compressive cycle loading, the stress-strain relationship can be expressed by the classical Osgood–Ramberg equation, which is given as follows:
Δ ε 2 = Δ σ 2 E + ( Δ σ 2 K ) 1 n
where E is elastic modulus, and the average value obtained during the fatigue test is 68.94 GPa. K denotes as uniaxial cyclic strength coefficient (CSC) and n characterizes uniaxial cyclic strain hardening (CSH) exponent, all of which can be identified by fitting from the corresponding cyclic mechanical response. At the microscale, the deformation field of polycrystalline metallic materials evolves non-proportionally under the multiaxial cyclic straining load (shown in Figure 2). Therefore, it is necessary to amend the CSC coefficient and CSH exponent. As indicated in reference [39], the change of the cyclic CSH exponent changed little under non-proportional loading. Therefore, the stress-strain relationship for each individual grain undergoing a multiaxial state is obtained by revising the multiaxial CSC ( K m u l ), which can be described by the following relationship:
Δ ε e q 2 = Δ σ e q 2 E + Δ σ e q 2 K m u l 1 n
Here, Δ ε e q , Δ σ e q denote equivalent strain range and equivalent stress range, respectively.
Recently, PSE in each particular slip plane was suggested as a driving force for evaluating fatigue damage [16]. From the perspective of phase transformations, the fatigue crack nucleation and propagation behavior can be explained by the energy dissipation process, in which the increase in internal energy in the matrix will lead to the instability of materials. On the basis of Griffith’s fracture energy criterion, this process not only contributes to generating a new surface but also the release of energy from lattice defects near the crack tip [40]. Thus, in this paper, the distribution of PSE at each point of the element was calculated and its maximum value was adopted as FIP to assess the fatigue damage evolution of UFG metals. Furthermore, the equivalent stress amplitude was calculated by the following equation:
W e q , d i s = c y c l e Δ σ e q 2 d Δ ε e q P 2 = c y c l e 1 2 Δ σ e q ( 1 + n ) n 2 K m u l 1 n
Here, the equivalent plastic strain range can be given as follows:
Δ ε e q p = 2 3 Δ ε i j p Δ ε i j p 1 2
Based on the assumption that only active slip planes can be potentially considered critical planes, a path-independent multiaxial fatigue damage parameter, defined on the specific crystallographic plane, was proposed according to the von Mises yield criterion, which can be deduced as follows:
Δ ε e q C P 2 = ε n * 2 + 1 3 Δ γ max 2 2 1 2
where Δ γ max is the maximum shear strain range on α slip system. ε n * denotes as normal strain on the crystallographic plane, where Δ γ max occurs, which can be calculated as ε n * = max t A < t < t E ( ε n t ) min t A < t < t E ( ε n t ) = ε n max ε n min . ε n on the slip plane can be expressed as follows:
ε n ( t ) = n x n y n z ε x γ x y γ x z γ x y ε y γ y z γ x z γ y z ε z n x n y n z
Furthermore, considering the effect of multiaxial mean strain, the FIP for small crack propagation can be calculated as follows:
F I P S C = Δ ε e q C P 2 + Δ ε e q m 2 = Δ σ e q 2 E + Δ σ e q 2 K U F G , m u l 1 n
With
Δ ε e q , m 2 = sgn sgn ( Δ ε n , m 2 ) ( Δ ε n , m 2 ) 2 + 1 3 sgn ( Δ γ m 2 ) sgn ( Δ γ m 2 ) 2 × Δ ε n , m 2 2 + 1 3 Δ γ m 2 2 1 2
where Δ ε n m , Δ γ m represent mean normal strain range and mean shear strain range on slip plane, respectively. According the work of Rice [41], the J-integral is assumed to satisfy the following relation:
J = V i n t r
Here, V i n t is the potential energy, which can be calculated by the product of cyclic ultimate tensile strength and mean multiaxial damage strain in FDR for UFG metallic alloys, as follows:
V i n t = R Y , U F G ε ˜ F D R π ( r F D R / 2 ) 2
In details, the solution of ε ˜ F D R can be expressed as the following integral:
ε ˜ F D R = 1 r F D R 0 r F D R ε C P R ( r ) d r
Here, the strain in CPR ( ε C P Z ) and the radius of the fatigue damage region can be associated with the FIP, namely, as follows:
ε C P R ( r ) = F I P P 2 r c r 1 / ( n + 1 )
r F D R = λ π K G B S 2 16 K G B C 2 K U F G 3 + 1 / n R m , U F G 1 + 1 / n R Y , U F G 2 F I P P 2 3 n + 1 α
Substituting Equations (25) and (26) into Equation (22), one can arrive at
Δ J = λ π 2 K G B S 2 32 K G B C 2 ( n + 1 n ) K U F G 3 R p , U F G 2 F I P P 2 3 n + 1 α
Moreover, the relationship between the Δ J integral and the range of crack tip opening displacement ( Δ C T O D ) follow the work in fracture mechanics [42] as follows:
Δ C T O D = Δ J / ω R P , U F G , w i t h   ω   =   1.5
Therefore, the small crack growth rate in UFG metals can be further expressed as follows;
( d a d N ) S C = λ π 2 K G B S 2 96 K G B S 2 ( n + 1 n ) ( K U F G , m u l R p , U F G ) 3 ( F I P S C 2 ) 3 n + 1 a
Here K G B S and K G B C are, respectively, GB strengthening factor and GB constraint factor. In this work, both of them can be calculated based on the work of Ding [23] shown as follows:
K G B S R P , 0 . 2 U F G   /   R p , 0 . 2 K G B C [ ( Δ σ / 2 ) / ( Δ σ e f f / 2 ) ] / 2
Here, Δ σ / 2 ,   Δ σ e f f / 2 are the cyclic stress and equivalent stress ranges obtained from the CPFEM simulation, respectively. In addition, λ is a material parameter that can be computed by an experiment. By integrating Equation (29) from an initial crack length (ri) to the critical one (rf), we have the expression of the fatigue initiation life of UFG materials, which follows the standard Coffin-Manson model, as follows:
N f = 96 C 2 λ π 2 F 2 n n + 1 R p , U F G K U F G , m u l 3 l n r f r i P E P S C P 2 3 n + 1

4. Results and Discussion

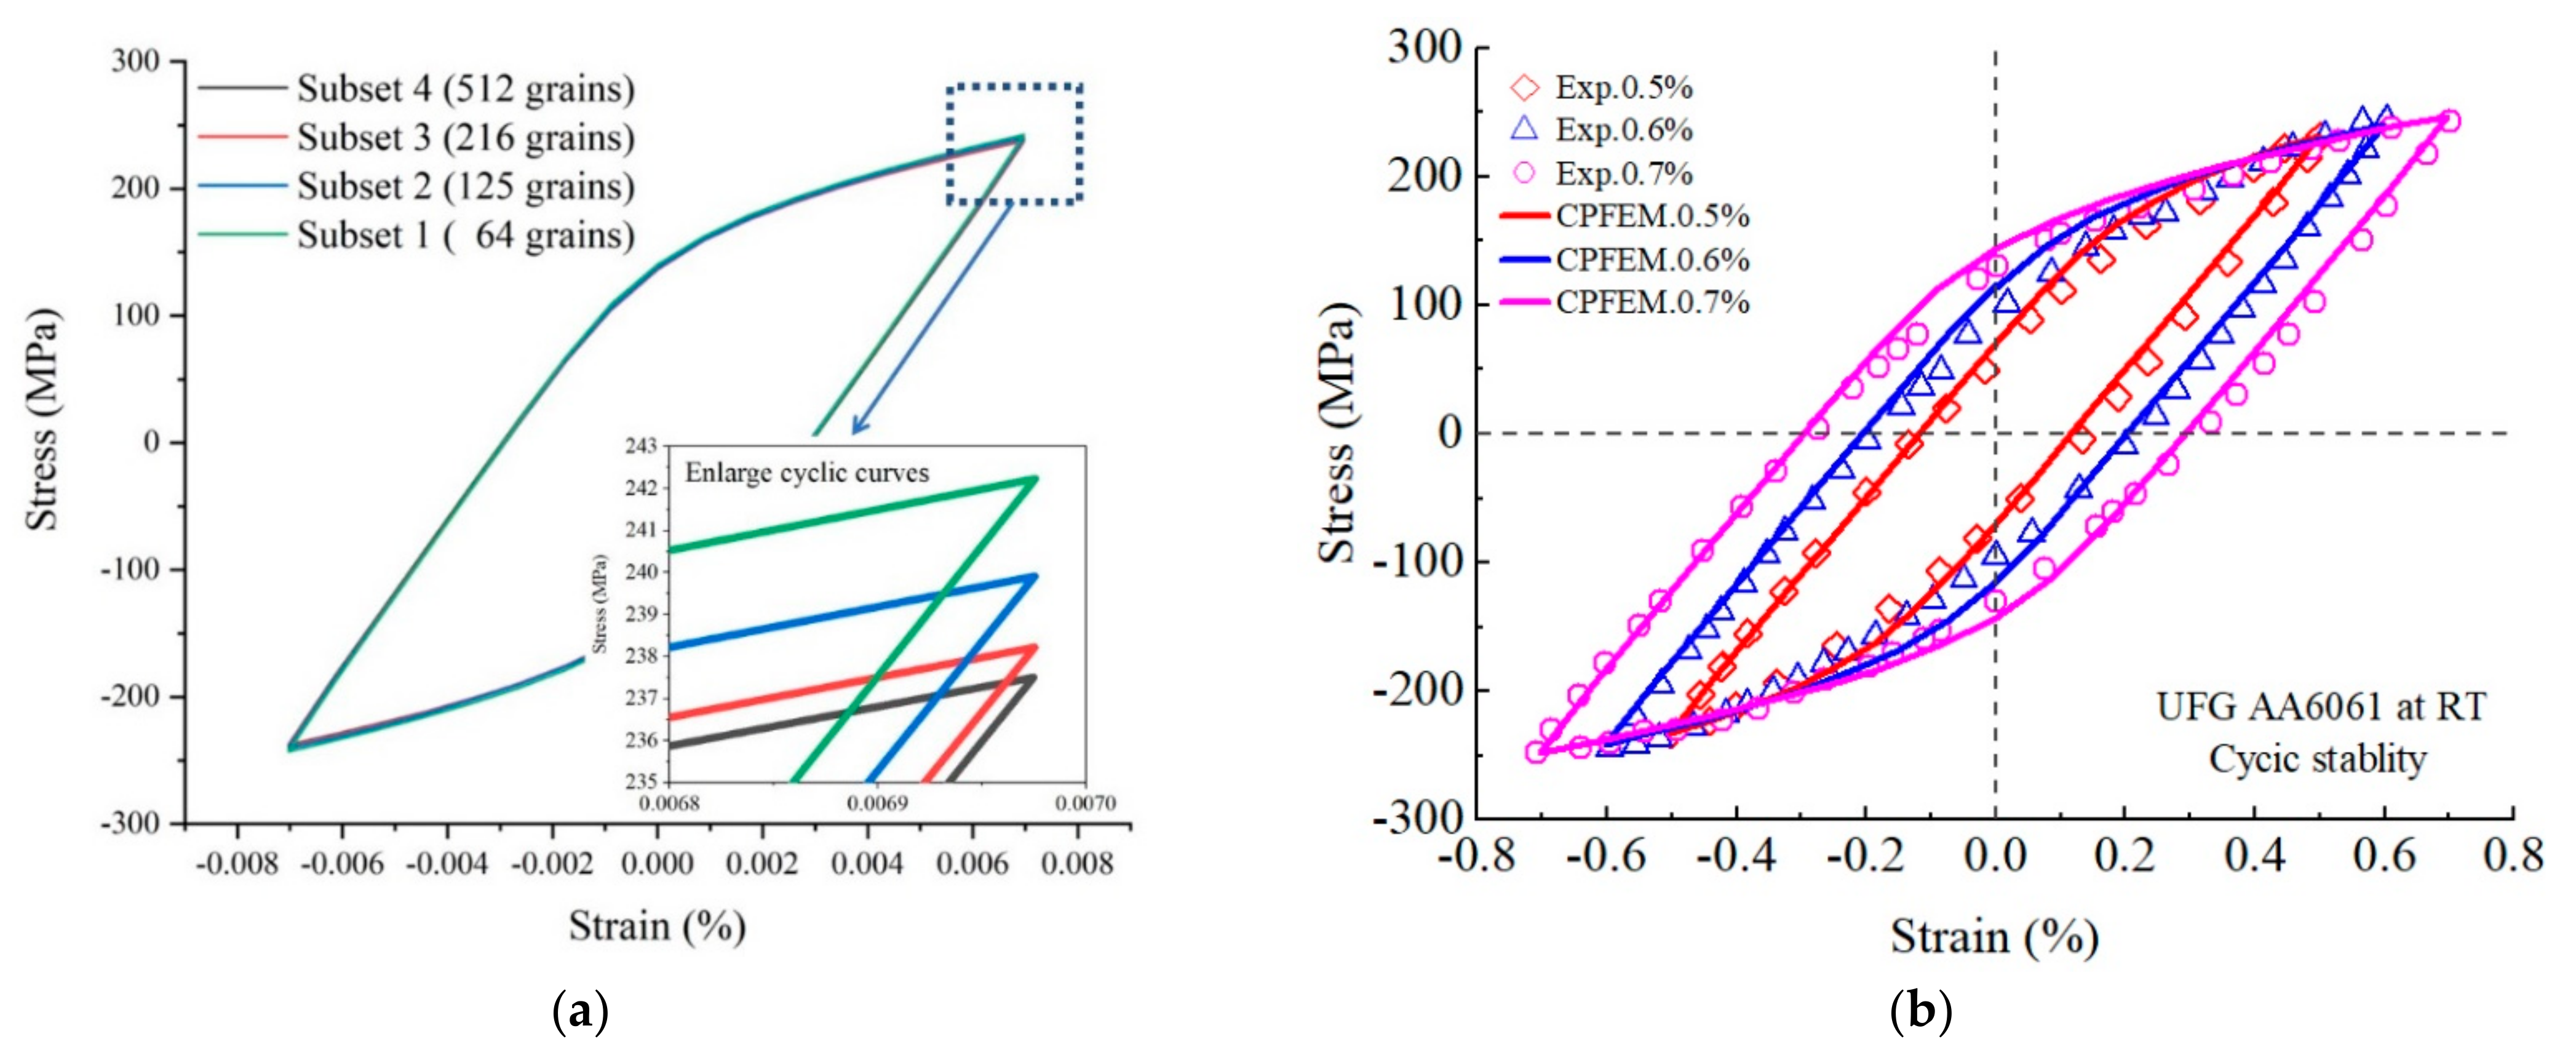
4.1. Simulating the Cyclic Plasticity Behavior of UFG AA6061

As shown in Figure 3a,b, the microstructure observation demonstrates the grain size is about 1.08 μm, indicating significant grain refinement in the ECAP process. The different colors in the figure represent the orientation of separate grains. As previous investigations have demonstrated it is feasible to adopt a small Voronoi polyhedron aggregation to simulate the mechanical response at the macroscale [10], a small cube taken from the surface of the macroscopic specimen was regarded as a representative volume element (RVE) for CPFEM simulation (shown in Figure 4a). The RVE, consisting of a number of grains with different Euler angles, is exhibited in Figure 4b. To reproduce the cyclic plasticity response of UFG AA6061 at the polycrystal level, three steps were carried out to identify material parameters used in the crystal plasticity constitutive equation.
Firstly, the boundary condition and loading direction configuration for the RVE model are displayed in Figure 4c. In detail, the sine strain-loading was applied at the positive and negative surfaces of the 3-axis. The displacement on the negative surfaces of the 1-axis and 2-axis were set to zero. In addition, the elements on the positive surface of the 1-axis were divided into the following two parts: (1) The element in the lower right corner was regarded as the reference point and classified as A set. (2) The other elements on the surface were classified as an A’ set. The A and A’ sets are assumed to satisfy the constraint equation U 1 A + U 1 A = 0 and then embedded in ABAQUS software to provide constraints for RVE.
Secondly, considering the consistency between the numerical and experimental results and the physical definitions of individual parameters, the material parameters in crystal plasticity constitutive are classified into three categories and determined by trial-and-error according to the following procedure. In the first step, parameters such as C11, C12, C44 and mean grain size d can be easily obtained from the macroscopic experiments and EBSD observation. In the second step, physical parameters such as the GB thermal activation energy Δ G B , the magnitude of Burgers vector b, Boltzmann constant k B , reference strain rate γ ˙ 0 and rate sensitivity k can be determined by referring to the Refs. [43,44] for UFG AA. In the third step, the parameters that controlled the evolution of isotropic hardening and the kinematic hardening, i.e., C ,   D ,   y 0 ,   K ,   w 1 ,   w 2 ,   h 0 , are not easy to determine from the macroscopic experimental results. Therefore, these parameters are determined by fitting the predicted data with the experimental results in terms of the stable cyclic hysteresis curve of UFG AA6061. All material parameters for UFG AA6061 used in the CP model are listed in Table 2.
Finally, it is well known that the materials after severing plastic deformation show obvious mechanical anisotropy due to the preferred crystallographic orientation. However, from the computational efficiency viewpoint, it is not a good choice to model an RVE with a large number of grains due to the heavy computational costs. Therefore, a reasonable number of grains with the reduced texture, i.e., from subset-1 to subset 4 (shown in Figure 4d–g), were adopted as a strategy to save the computational cost. Figure 5a displays the stable hysteresis loops from cyclic tests simulated by the four RVEs and its local enlarged figure with respect to the tension peak of hysteresis loops. It can be clearly seen that the discrepancy induced by the number of grains used in RVE tends to be decreased. It is not hard to observe the RVE with 216 crystal grains consisting of 27,000 elements, i.e., subset-3, seems to be the most reasonable scheme. Subsequently, the subset-3 and the crystal plasticity UMAT subroutine were combined to validate the rationality of the material parameters. The numerical results (shown in Figure 5b) show that the maximum stress difference between the experimental results and the CPFEM simulations are less than 3 Mpa with respect to the strain amplitude of 0.5%, 0.6% and 0.7%. In summary, all the above results show that the calibrated material parameters and the constructed RVE for the crystal plasticity model are reasonable and acceptable for further investigations.

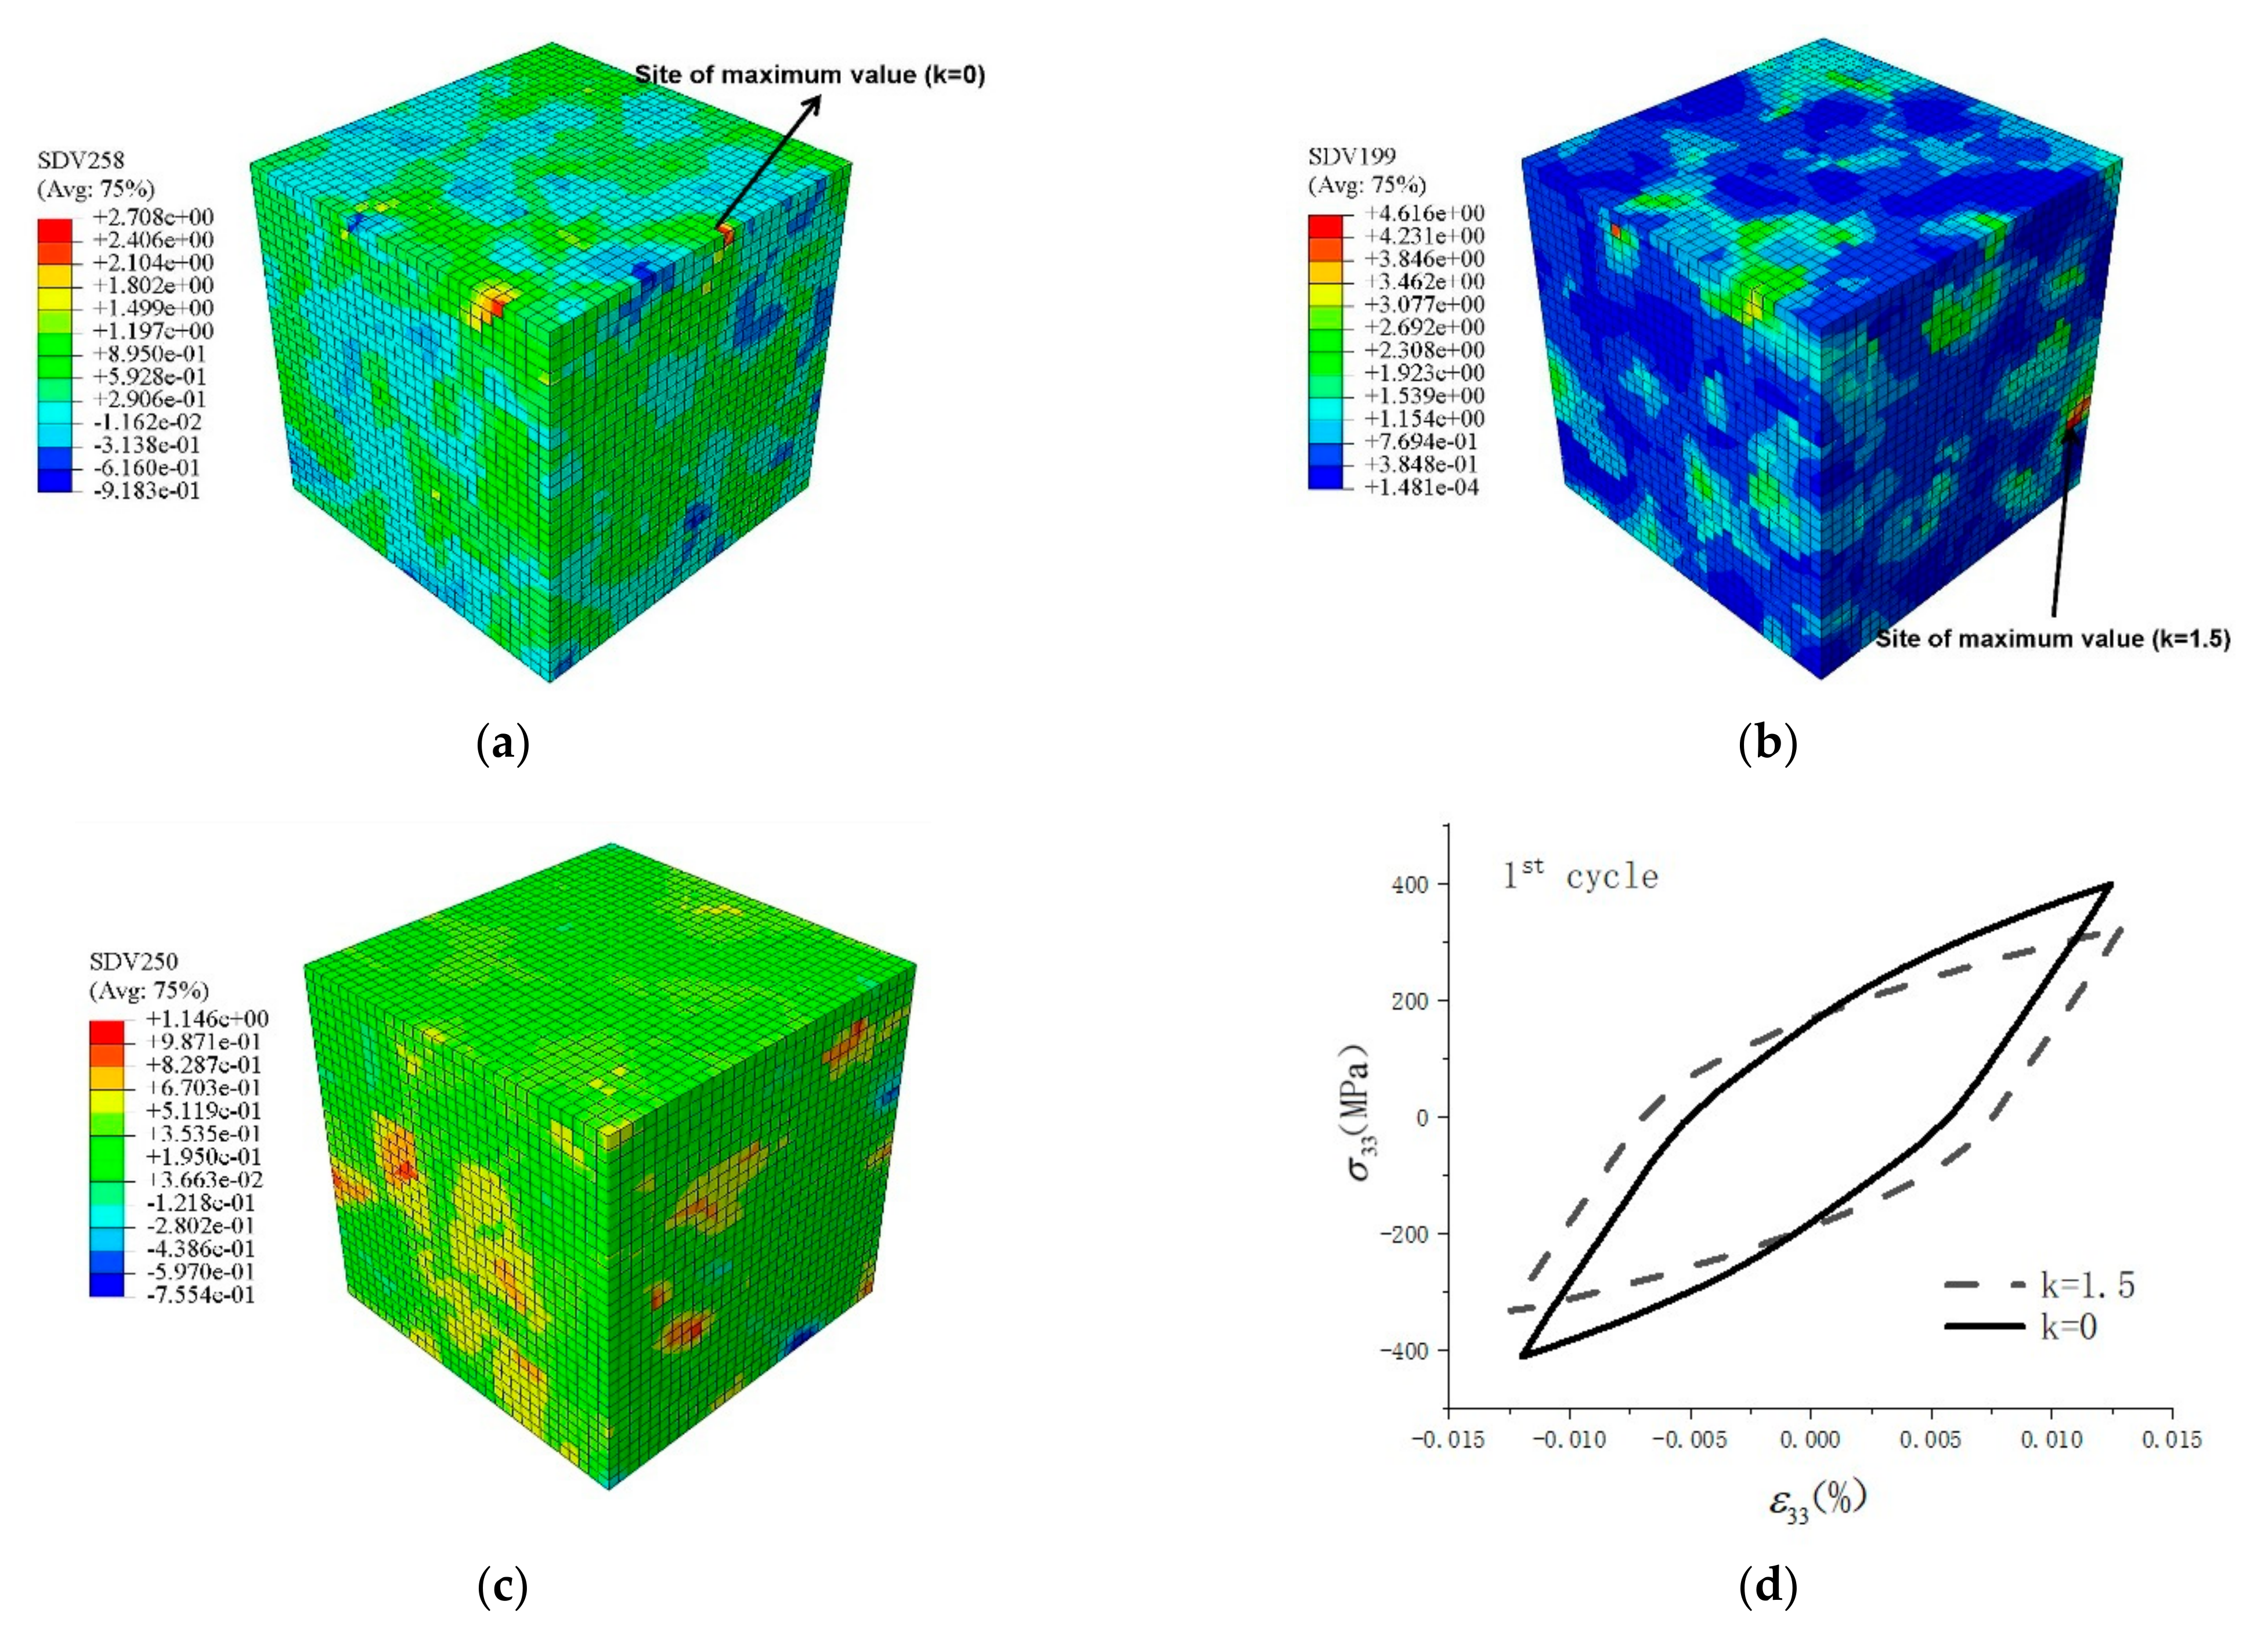
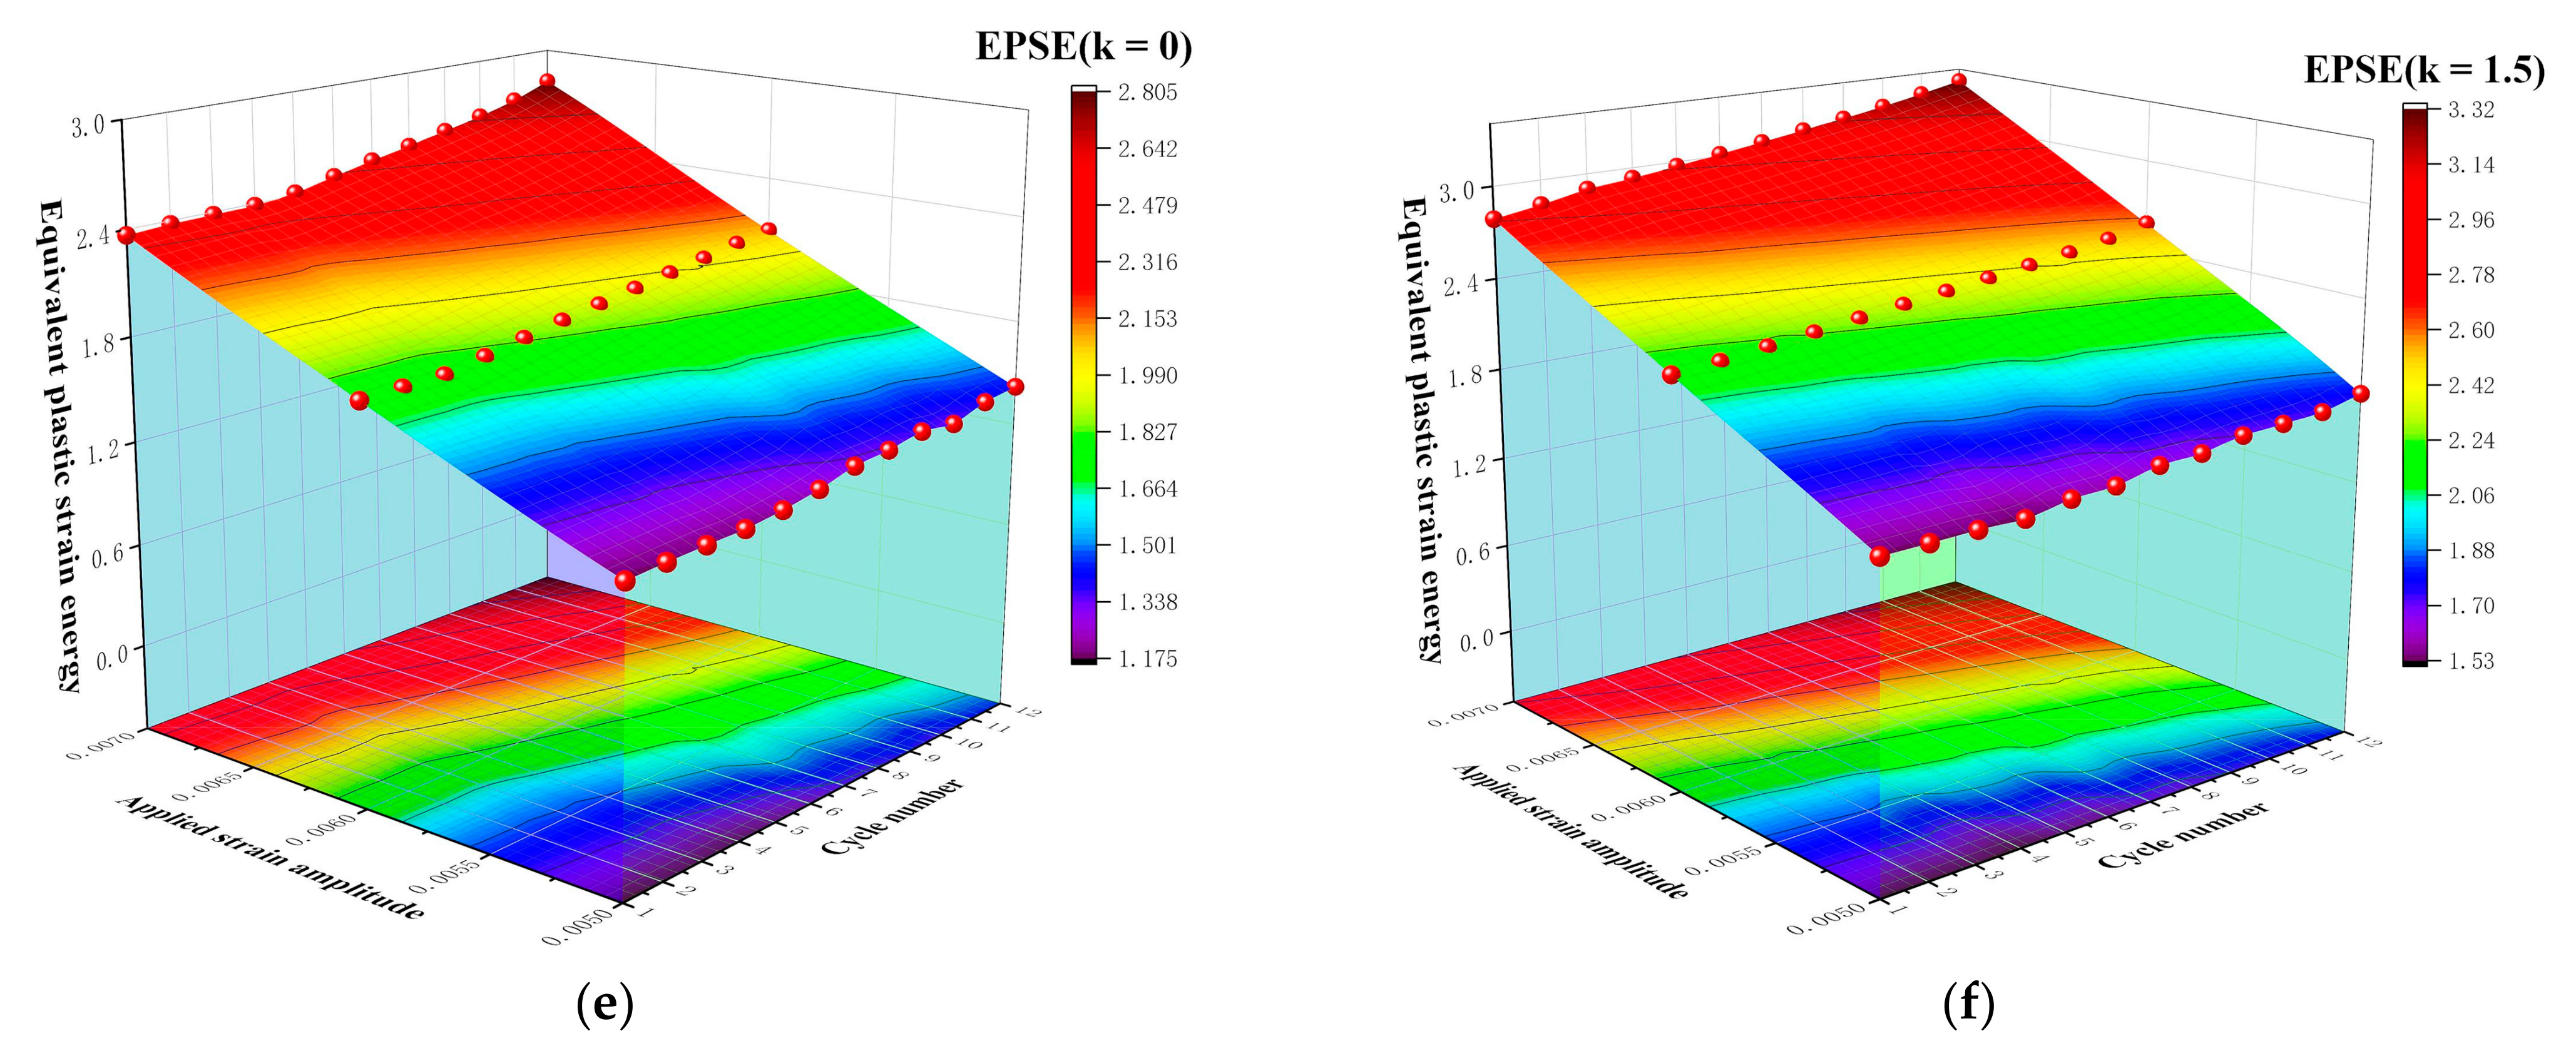
4.2. The Relationship between Stress Triaxiality and PSED

In this section, the evolution of PSE dissipation was systematically explored by the CPFEM simulation. By utilizing Equation (13) with consideration of void geometry coefficient taken as k = 1.5 and k = 0, the distribution contours of PSE in the RVE with respect to the strain amplitude of 0.007 are displayed in Figure 6a,b. As anticipated, there are obvious discrepancies for the maximum values of PSE, i.e., the maximum fatigue damage locations, when compared to Figure 6a,b. Figure 6c gives the contour of stress triaxiality at the tension peak of the sixth cycle for the case of strain amplitude 0.007. The results show stress triaxiality presents strong inhomogeneous with values varying in the range from −0.7 to 1. Figure 6d further analyzes the cyclic response for the two PESD modes by extracting the hysteresis loop of points at the critical site with maximum PSE dissipation in the first cycle for the case of strain amplitude 0.007. The results manifest that the average values over the element at the high FIP location exhibit that both the strain range and peak stress are obviously higher than the macro stress-strain response, which indicates larger accumulated crystallographic slip and PSE dissipation at the critical cite. Furthermore, it can also be found the local stress-strain field in the fatigue damage region evolve in multiaxial and non-proportional state at the grain level. Therefore, it is significant to consider the influence of grain-level multiaxial and non-proportional loading on the local stress-strain field for a more accurate prediction of LCF life. Figure 6e,f show the energy response surface for the maximum accumulated PSED obtained from CPFEM simulations, which were plotted as a function of cycle numbers under the applied strain amplitudes of 0.007. The figures depict a consistent regular that both FIPs tend to be stable with the increasing number of cycles. Therefore, cycle numerical simulation of polycrystalline aggregate to the steady-state of the hysteresis loop is enough to assess the fatigue damage, instead of the entire micro-level simulation for the fatigue process. Another striking feature is the maximum accumulated PSE considering the effect of stress triaxiality is significantly higher than the one without the triaxiality term. This is mainly ascribed to the large amount of existing second-phase particles within the UFG AA6061 matrix that impede the sliding of dislocations and eventually result in a relatively high value of PSE dissipation that accelerates the process of fatigue damage. Furthermore, some investigators have reported, that even under the condition of symmetrical cycle loading, the local stress state of the micro-void is asymmetric, which further indicates the role of triaxiality-dependent plastic strain energy density in capturing the ‘applied’ mean stress effect cannot be ignored.

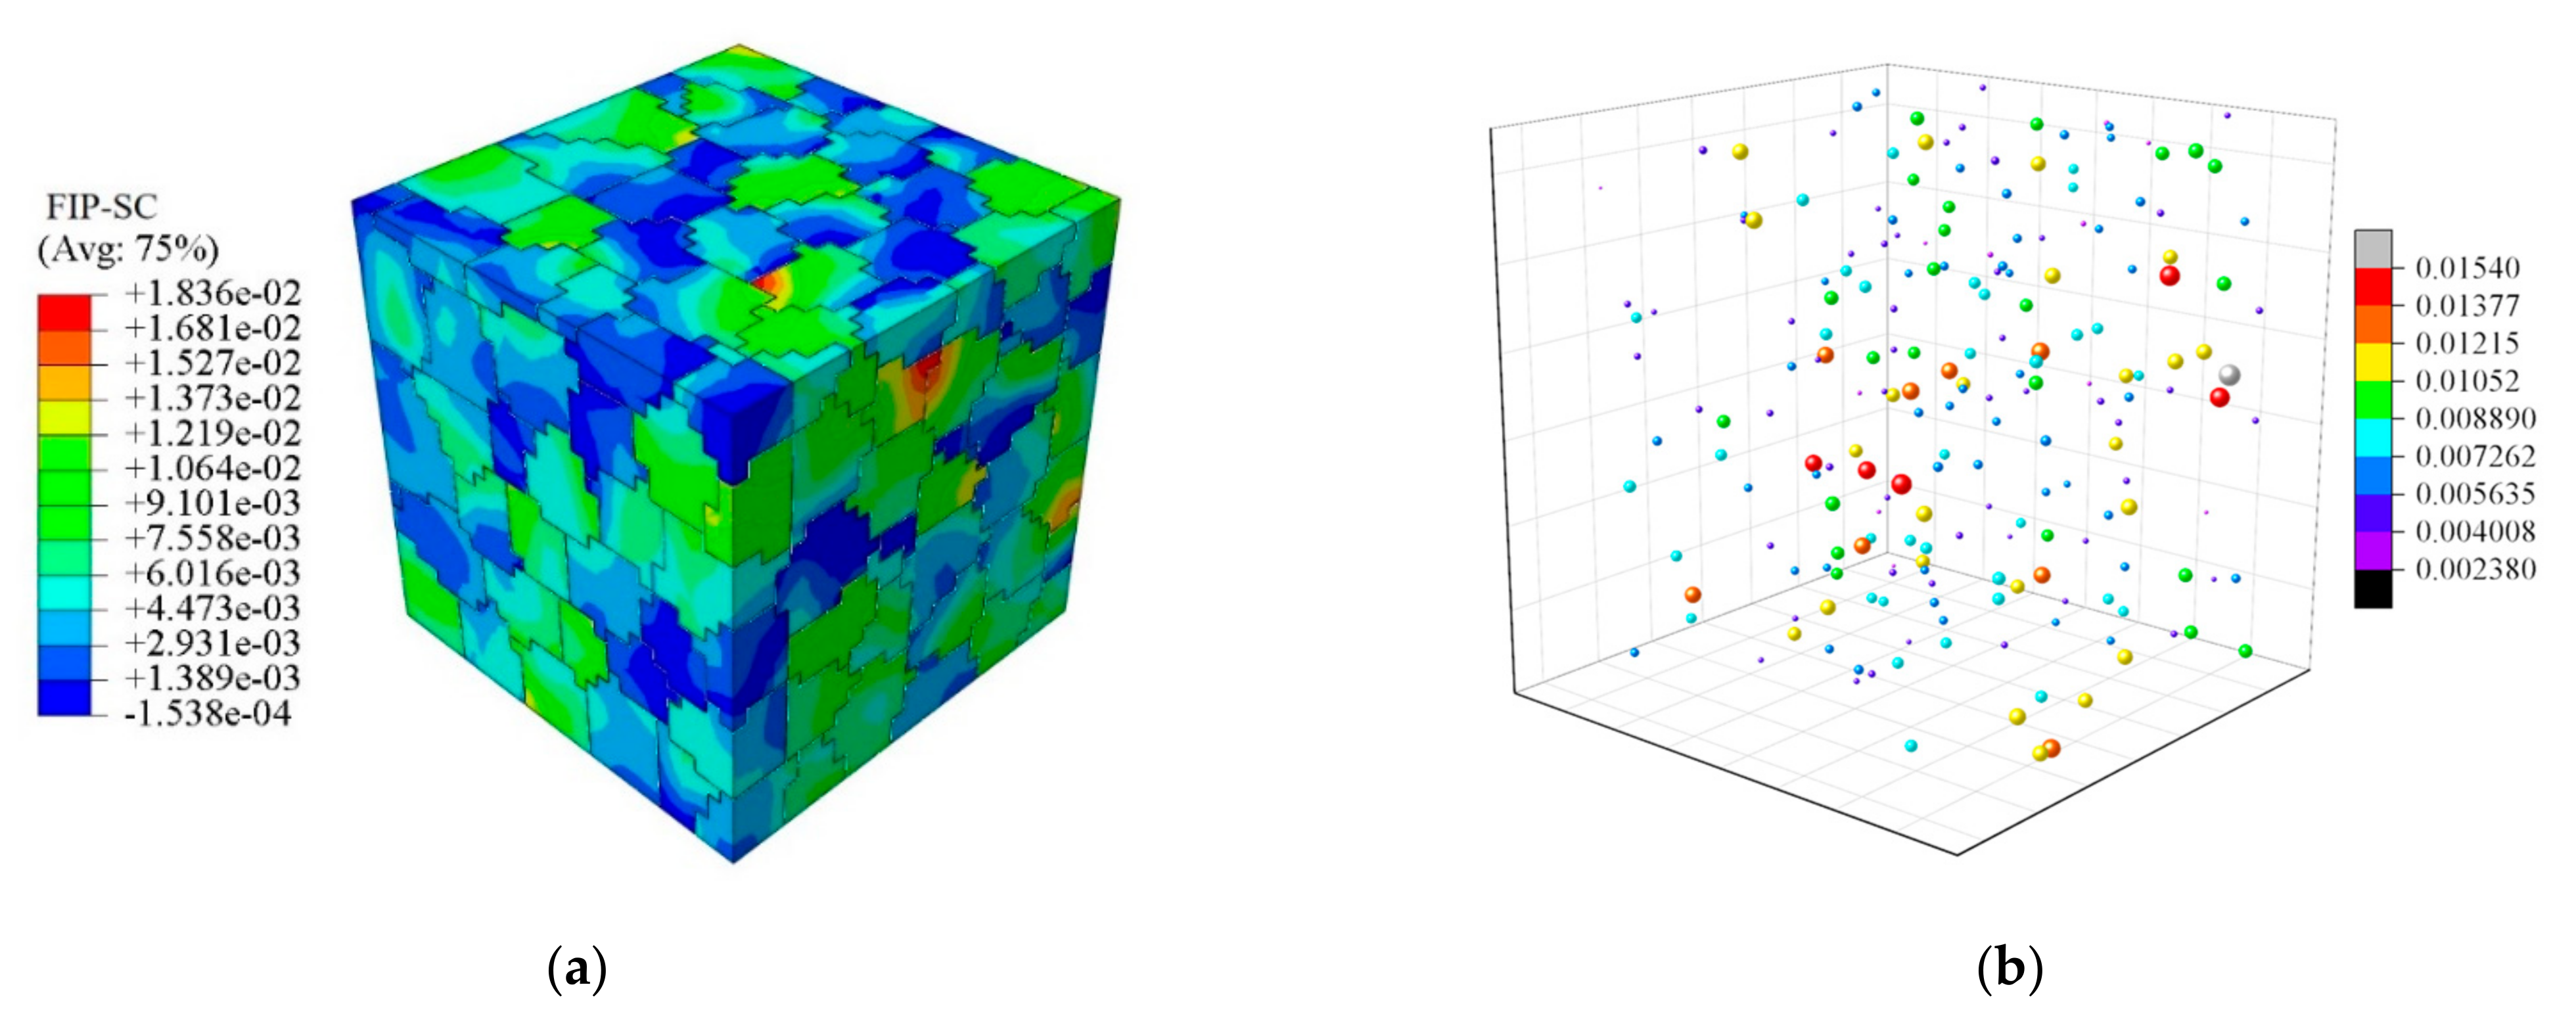
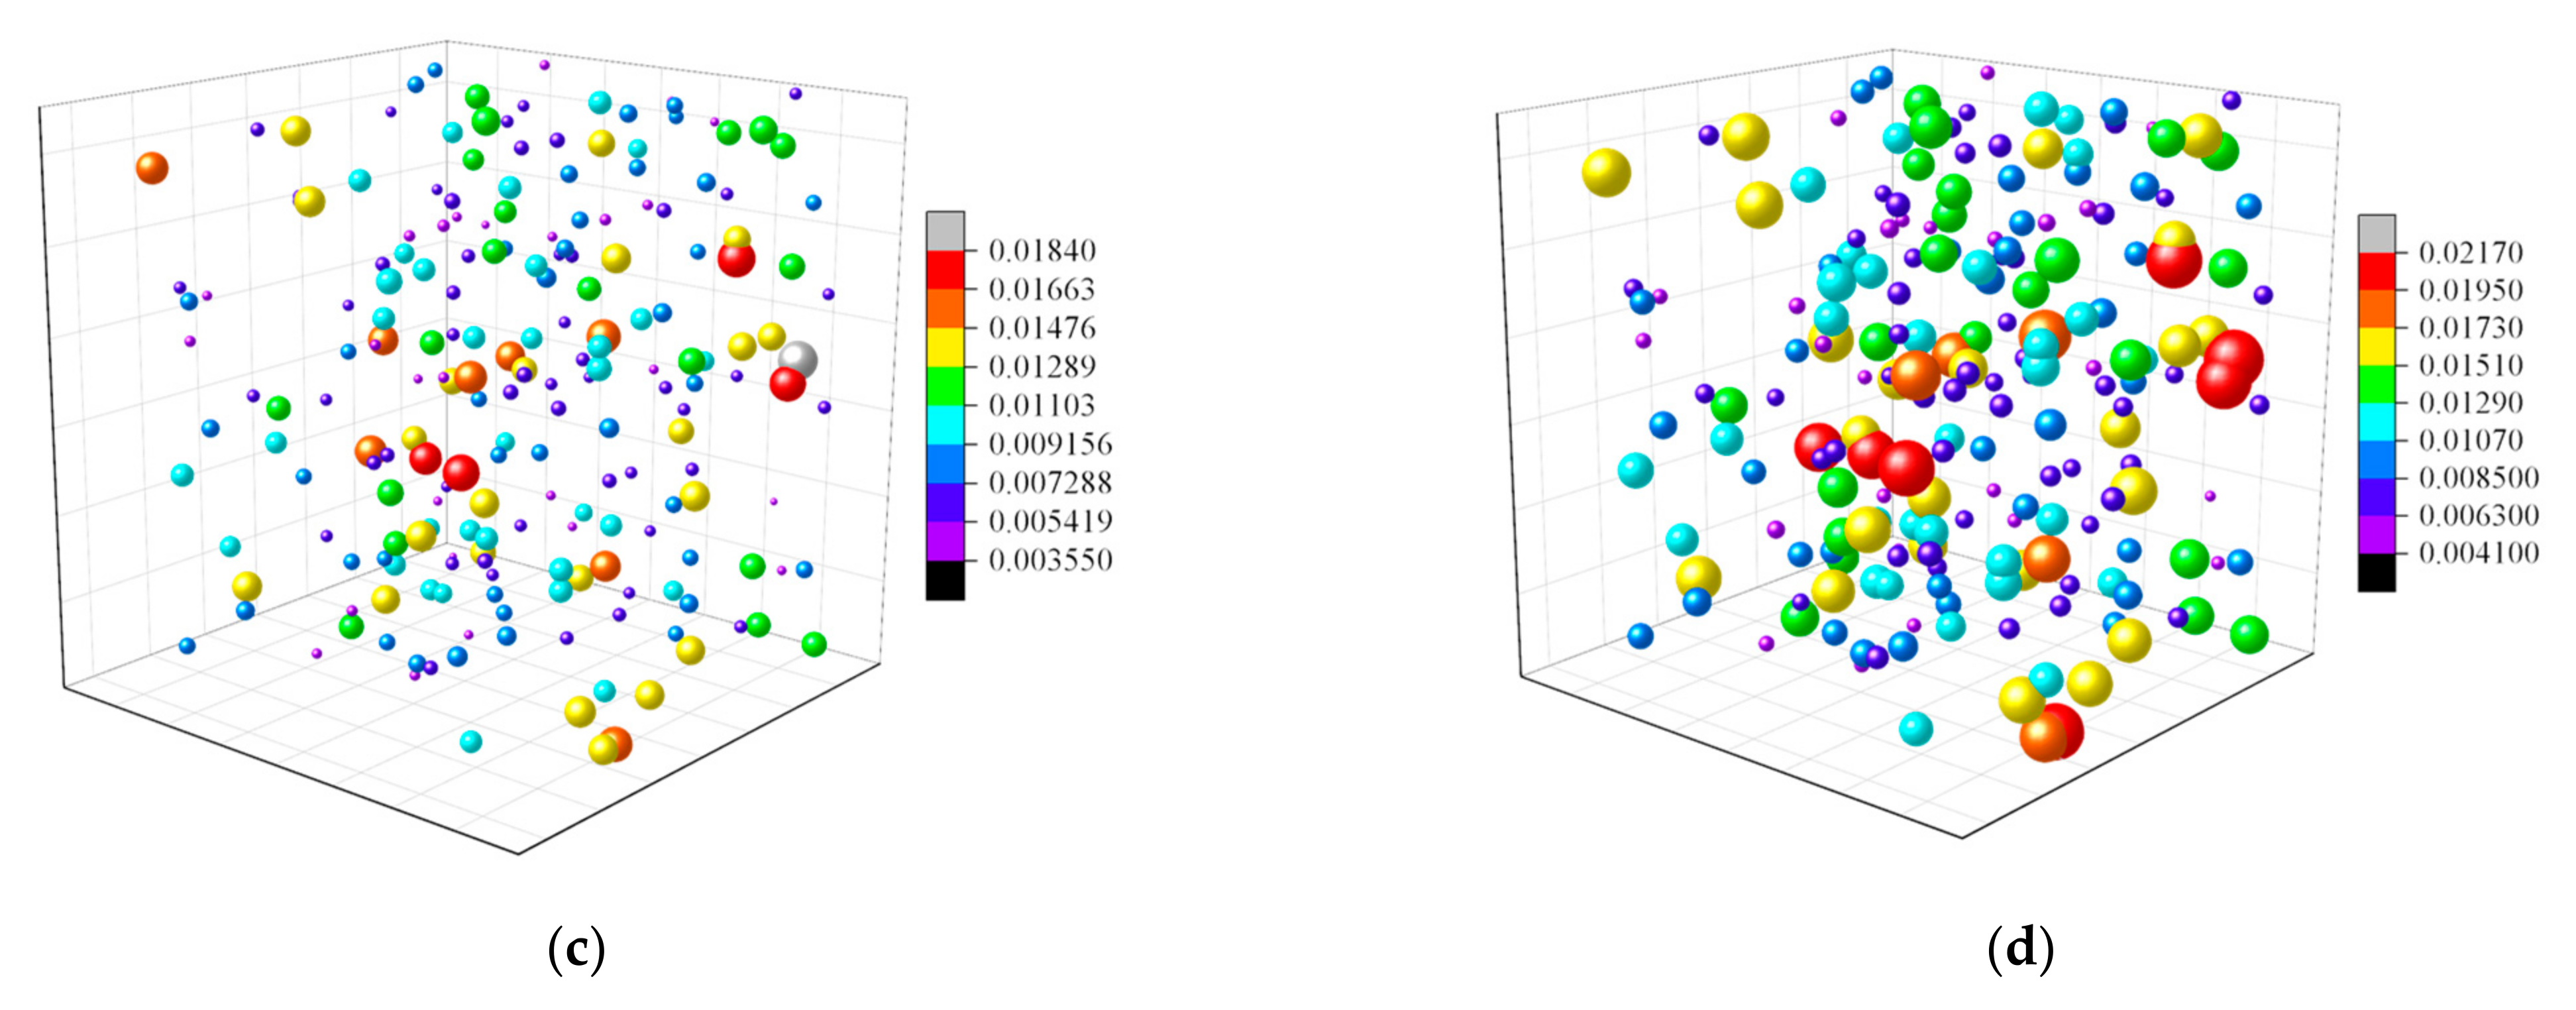
4.3. Fatigue Indicator Parameter Based on the Micro-Multiaxial Strain Field

From the figure and the data in the legend box shown in Figure 7a, it is observed that the distribution of local multiaxial strain in all grains is non-uniformly at the grain level, though a uniform cyclic strain is applied to the RVE at the polycrystal level. In detail, the distribution of the maximum FIP of the 216 crystal grains is exhibited by a 3D scatter diagram (Figure 7b–d) with respect to the strain amplitude of 0.5%, 0.6% and 0.7%, respectively. It should be noted that different colors indicate the maximum numerical value of FIP for individual grains, while the volume of the color ball can reflect the value of FIP with respect to different strain amplitudes. Evidently, the numerical value of FIP for the crystal plasticity model varies in the range from 2.38 × 10⁻³ to 1.54 × 10⁻², 3.58 × 10⁻³ to 1.84 × 10⁻² and from 4.11 × 10⁻³ to 2.14 × 10⁻², respectively. Moreover, the homogenized values of the largest numerical value of F I P S C s are equal to 7.46 × 10⁻³, 8.94 × 10⁻³ and 1.05 × 10⁻², respectively. Compared with the homogenized values, the maximal fluctuating of magnitude is up to 6.5 × 10⁻³, 7.4 × 10⁻³, 8.8 × 10⁻³. Therefore, it can be concluded that the heterogeneous microstructure, the anisotropic mechanical behavior of grain and the strong intergranular constraint variation of grain orientations influence the maximum FIP, resulting in the potential failure position.

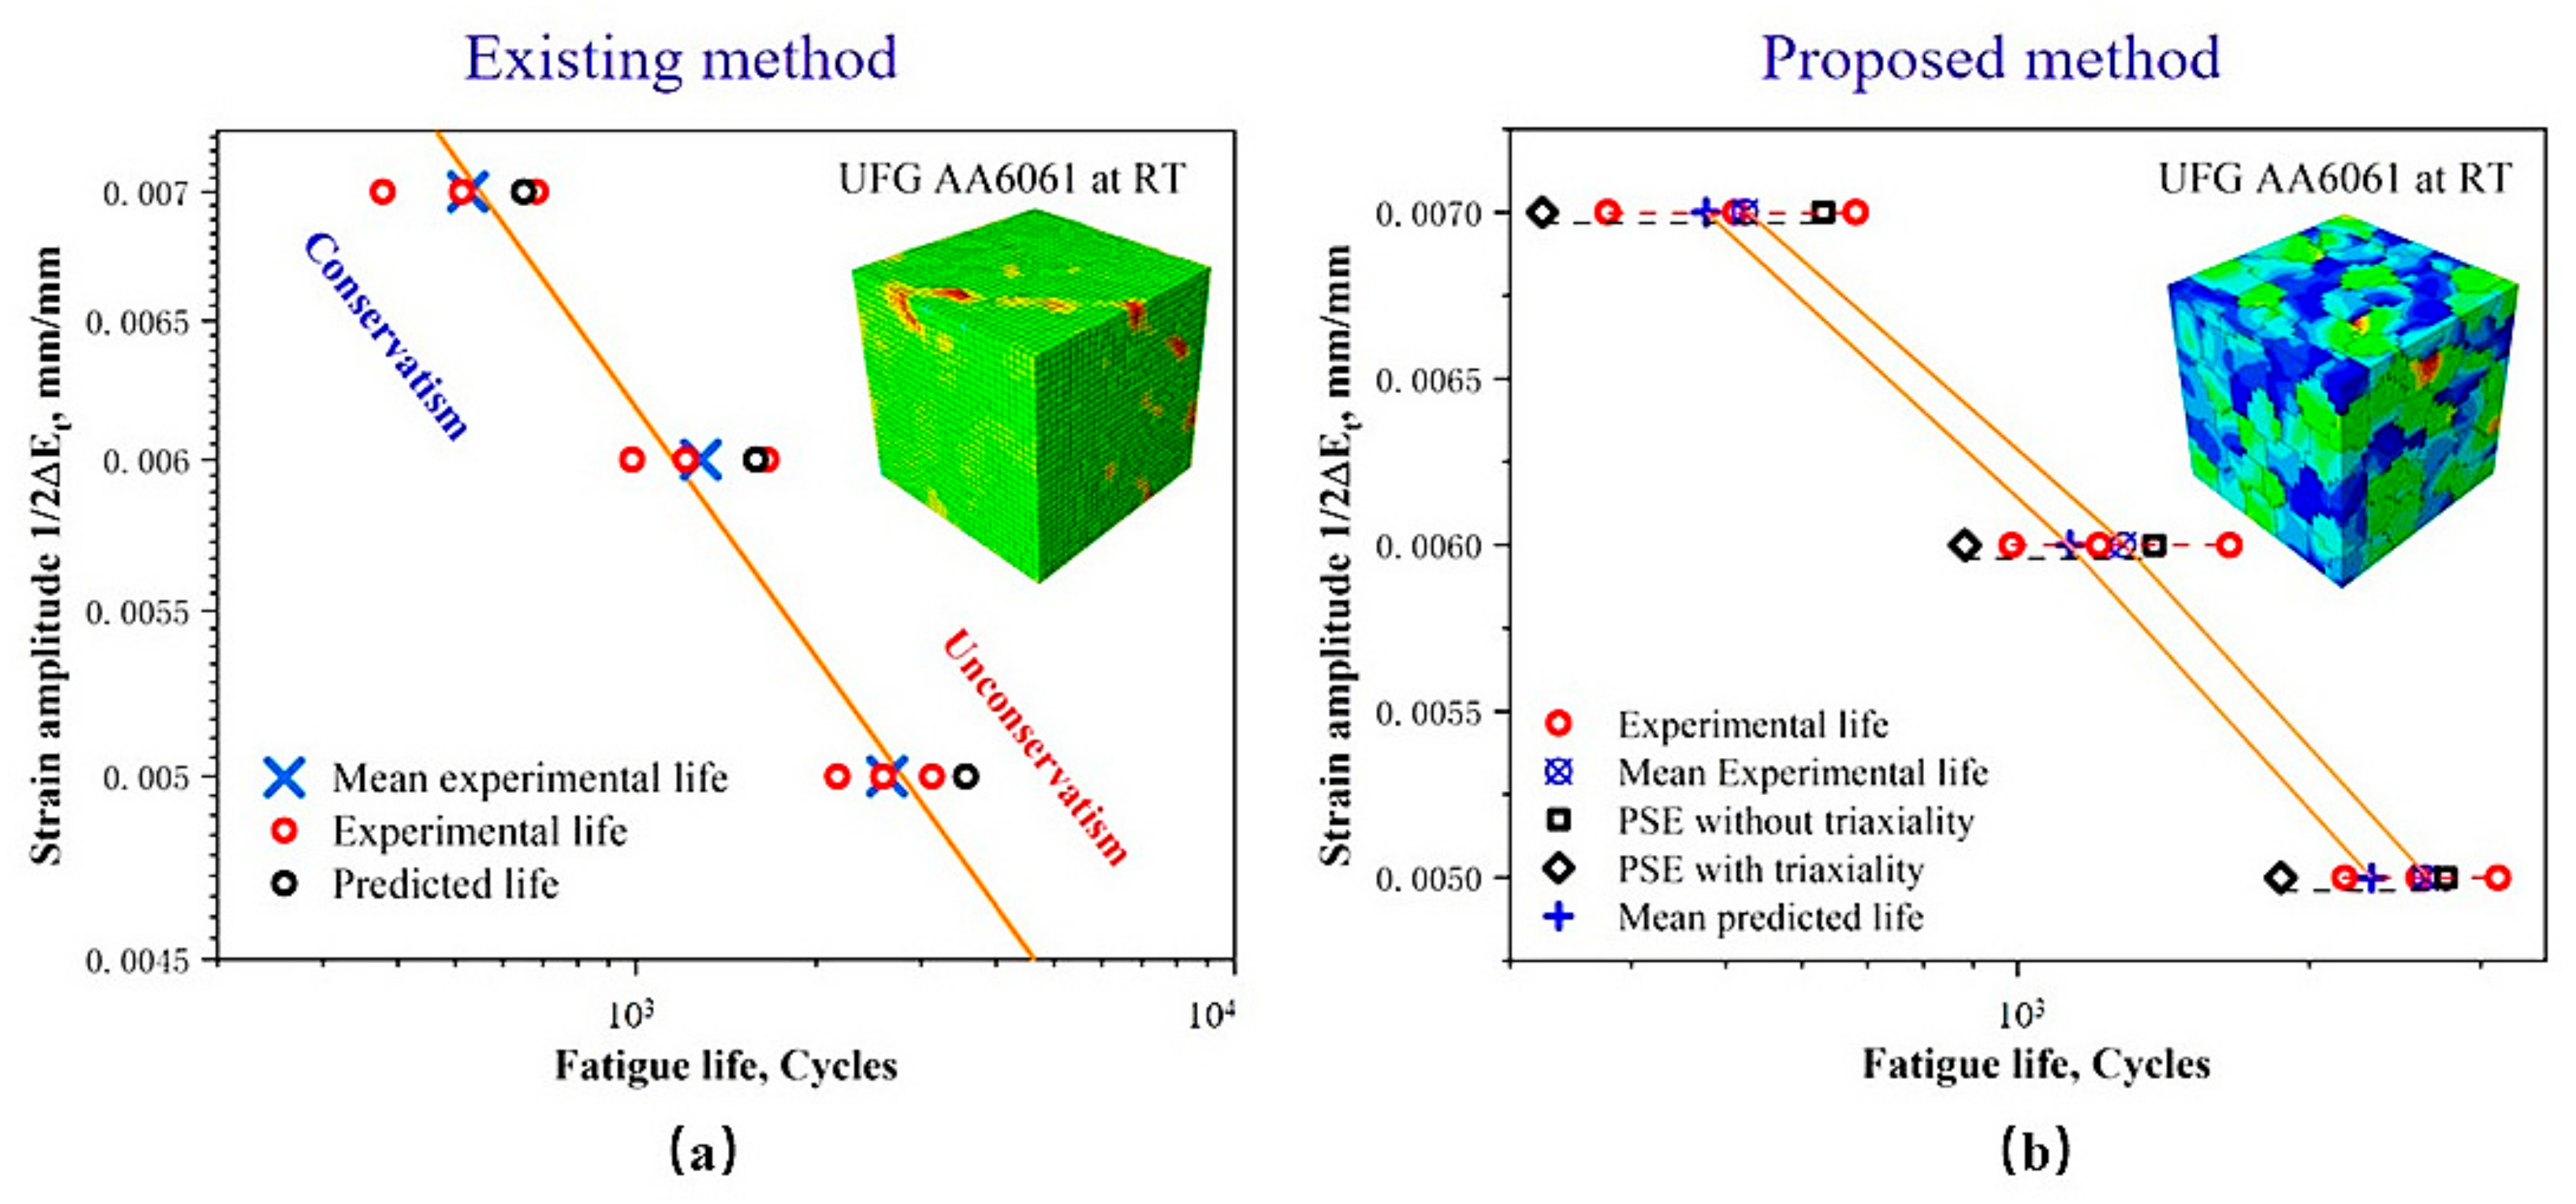
4.4. Micromechanics Based LCF Life of UFG AA6061

Based on the crystal plasticity and fracture mechanics theory, the LCF life is predicted according to Equation (31). Evidently, it can be found that the LCF life of UFG AA6061 depends on the defined initial crack length, cyclic plasticity properties and the type of materials. Since it is difficult to capture the real-time micro-crack for the cylindrical fatigue specimen by the current observation equipment, the initial crack length in our prediction is assumed to be 0.2 μm due to the fact that most of the engineering detectable crack lengths are between 0.1 and 0.25 μm [45]. Moreover, the cyclic plasticity zone correction factor, λ , can be obtained by one strain-controlled cyclic experiment. As shown in Figure 8, the cyclic yield strength and strengthening factor for UFG AA6061 and its coarse grain counterpart were respectively fitted according to Equation (32) [23]. These parameters related to the cyclic plasticity properties of UFG AA 6061 are listed in Table 3. By substituting all the variables above, the experimental fatigue lives (Nf) and the predicted fatigue lives were, respectively, computed by the existing method and the proposed prediction model, associated with their error range compared with the mean experimental and predicted values. These values are listed in Table 4.
R P , 0.2 = K ( 0.002 ) n
As shown in Figure 9a, the experimental results are compared with the computed data by utilizing the existing method in reference [23]. However, such an approach seemed to overestimate the LCF life of UFG AA6061 at lower strain amplitude. The physical reason behind this is that the controlling parameter in the crack propagation equation contains only plastic strain amplitude but ignored that the grains in the polycrystalline aggregate are in a multiaxial non-proportional loading state. In fact, the mean strain is prone to be relaxed in the case of high plastic strain conditions. Therefore, reasonable prediction accuracy can be obtained in terms of the strain amplitude of 0.7%. However, for the crystal grains subjected to HCF with low applied strain level or multiaxial LCF loading, the rotation of the principal axes of strain under non-proportional cyclic loading hinders the formation of stable dislocation structures in the material, which contributes to the NPACH effect that significantly reduces the fatigue life of the material [46,47]. As extensive experimental observations have exhibited considerable variations in the fatigue life of a material tested by multiaxial loading, it is necessary to address the variation of the multiaxial local strain field as a function of the cyclic J-integral for accurately evaluating the LCF life of UFG AA6061.
As exhibited in Figure 9b, the results show the fatigue life predicted by the proposed micromechanics-based methodology is more reasonable than that based on the existing method. The scatter fatigue life of UFG AA6061 can be predicted by introducing the PSE with or without the triaxiality term. Yang [48] provided a detailed explanation of the scatter characteristic of LCF life for precipitate-strengthened metallic alloys. It is noted that the grain interior exhibits higher LCF life compared with the micro-crack initiated at the inclusion, which all depends on its local stress state. Therefore, the proposed model with consideration of triaxiality can capture the scatter characteristic of LCF life to some extent. It was noteworthy that the prediction intervals tend to be conservative under small strain amplitude due to the ignorance of the fatigue nucleation regime. In addition, good achievement between the experimental life and mean predicted life can be achieved when the multiaxial strain field is taken into consideration, especially in the case of smaller strain amplitudes. Based on the discussion above, it was confirmed that the proposed prediction model, with consideration of the crystal anisotropy and multiaxial non-proportional loading, is significant for fatigue life prediction modeling of UFG materials.

5. Conclusions

In this work, an LCF life prediction model was proposed by considering the grain-orientation induced microscale plasticity and grain-level multiaxial response, which contains a crystal plasticity constitutive formulation and a newly proposed crack propagation equation. Herein, micro-level numerical simulations and a series of strain-controlled fatigue experiments were conducted for UFG AA6061 to examine the prediction ability of the proposed model. The main findings drawn from this study are summarized as follows:
  • The accumulated plastic strain energy, modulated by triaxiality, is regarded as the FIP to assess the fatigue damage of multiple potential locations. Since this parameter is independent of the type of materials and has a clear physical meaning, it can comprehensively reflect the combined mechanical response of cyclic stress and strain at the grain level, as well as the correlation of strain path in multiaxial and non-proportional cyclic loading;
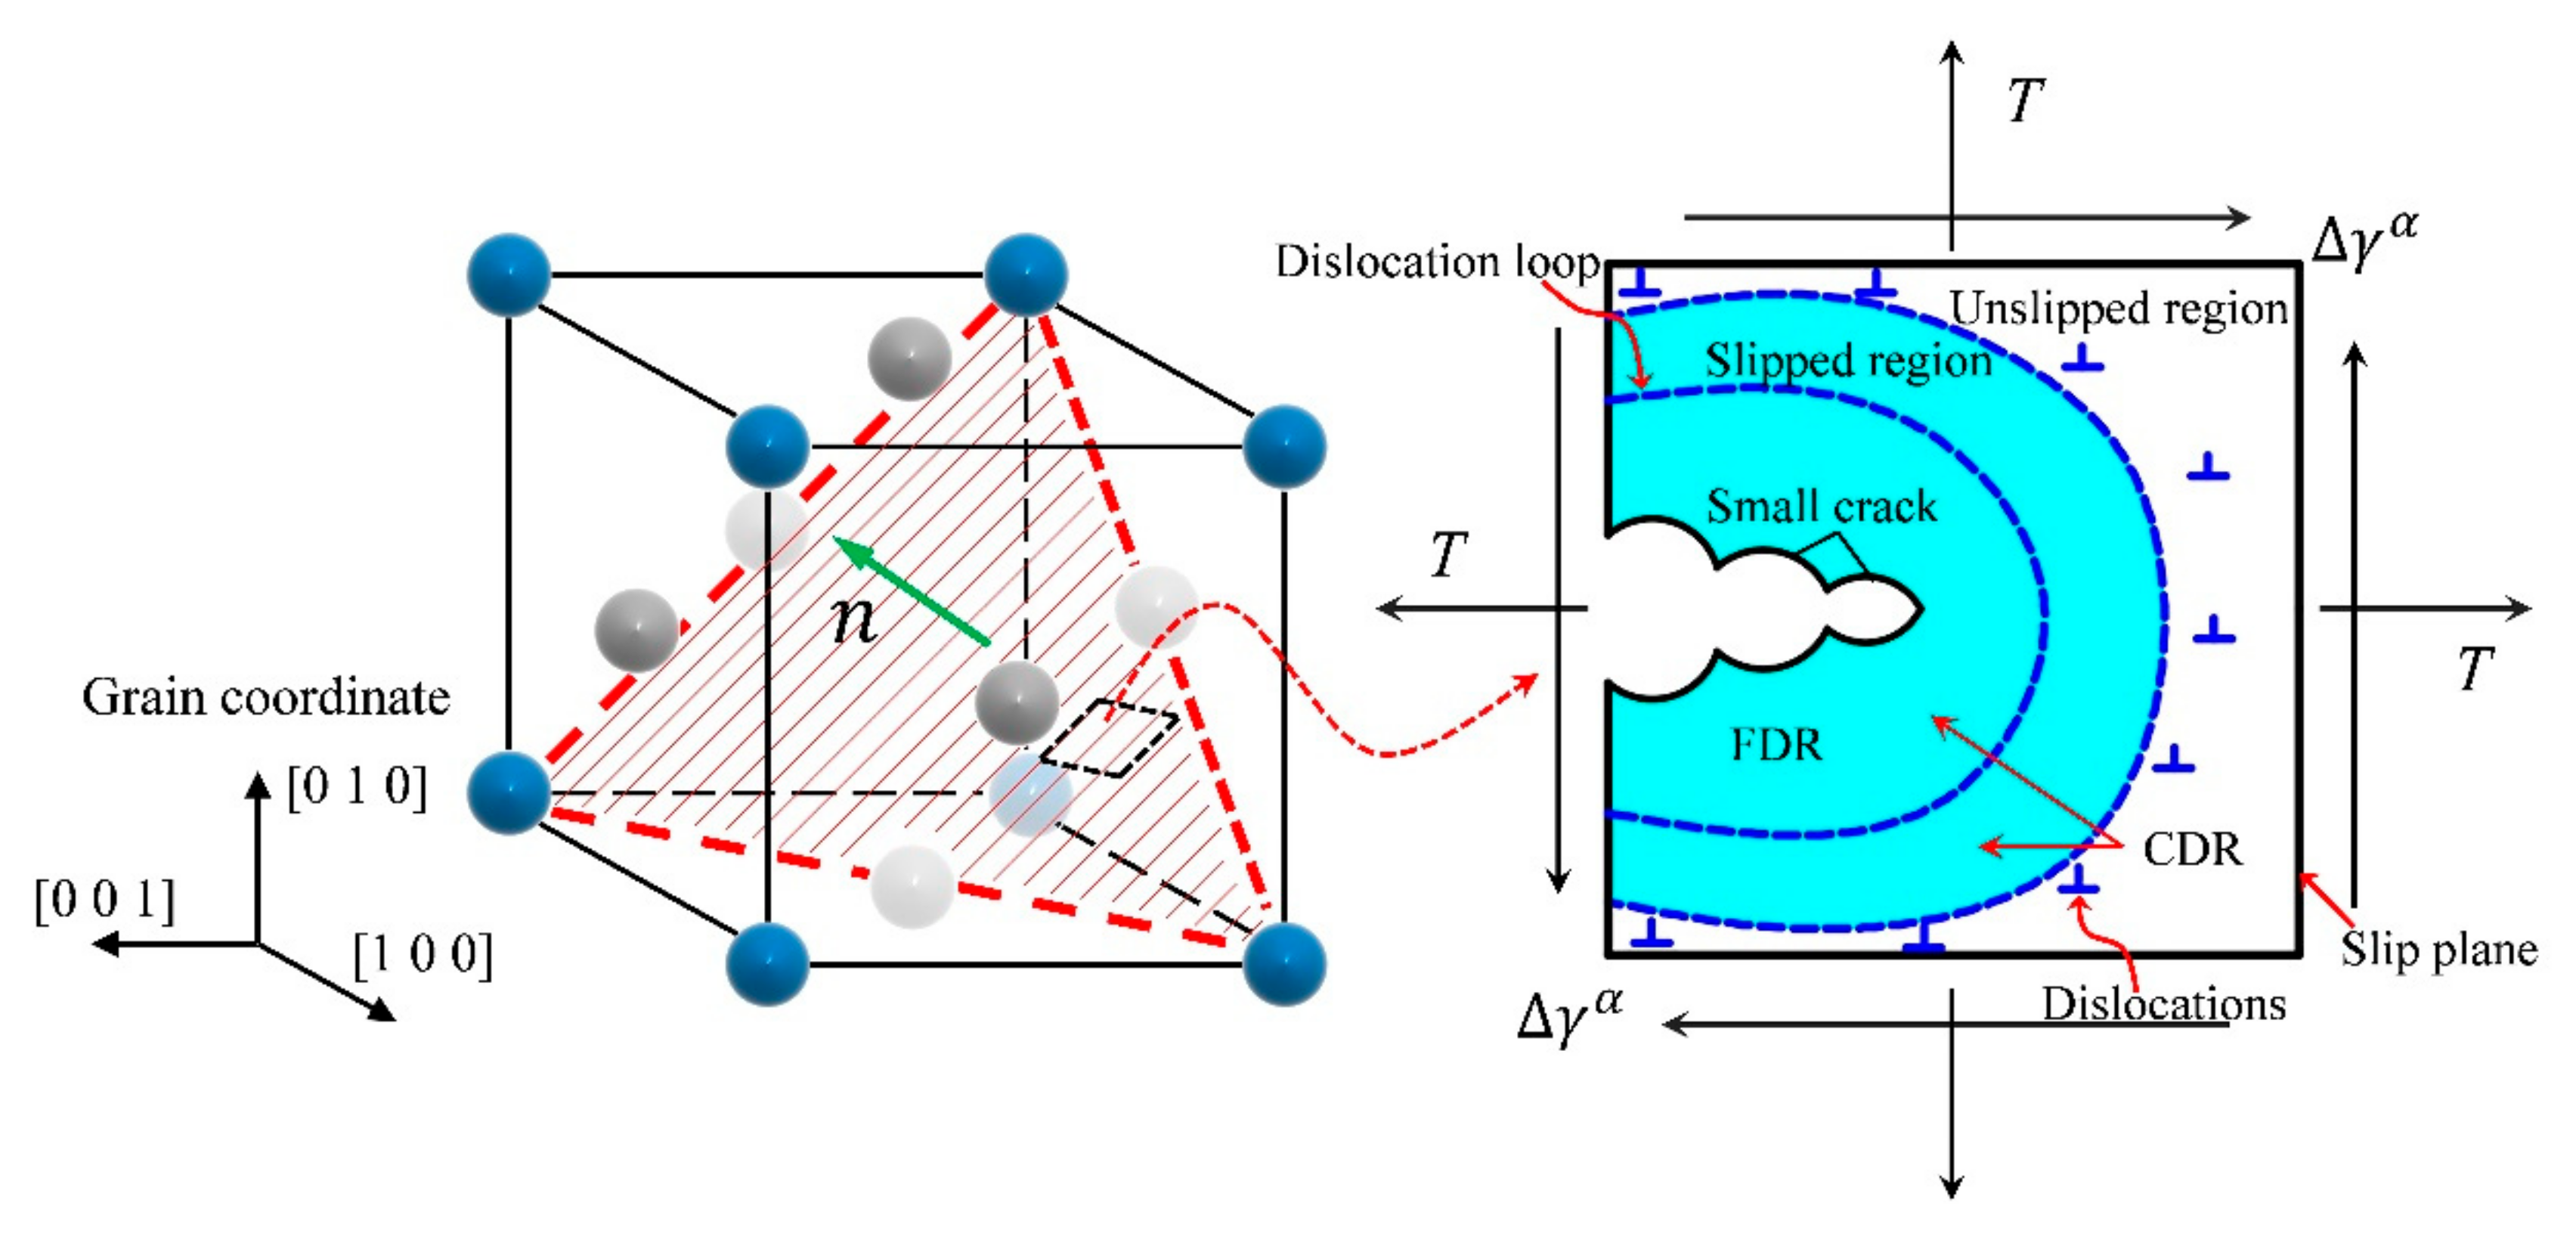
  • The local stress and strain field in the FDR and CPR regions on the slip plane evolve in a multiaxial state. The parameters in cyclic J-integral related to the stress state ahead of the small crack tip must be modified to adapt to the multiaxial and non-proportional state. In addition, the appropriate critical values can be determined by a family of cyclic experiments, combined with CPFEM simulations from the perspective of energy evolution;
  • According to the Mises criterion, the multiaxial strain, with consideration of the NPACH effect and equivalent mean strain, was regarded as the driving force for small crack propagation. More reasonable LCF fatigue life prediction results can be obtained using the FIPs proposed in this paper, which means that the description of the multiaxial strain field by the new indicator parameters is closer to the actual process.
However, the main limitation of the proposed method did not explicitly consider the fatigue crack nucleation life for UFG AA, which means the fatigue life tends to be conservative under lower amplitudes. Besides, it needs to be pointed out that the development of a new model requires extensive experimental validation. Therefore, more UFG material will be tested in future work to validate the proposed model.

Author Contributions

Conceptualization, T.S. and Z.H.; methodology, T.S.; software, Y.X.; validation, T.S.; formal analysis, Y.X.; investigation, C.X.; resources, Y.P.; data curation, C.X.; writing—original draft preparation, T.S.; writing—review and editing, Z.Z.; visualization, Z.H.; supervision, Y.P.; project administration, Z.Z.; funding acquisition, Z.Z. All authors have read and agreed to the published version of the manuscript.

Funding

This research was funded by the Natural Science Foundation of Guangxi Province of China (2021GXNSFAA220119), the Guangxi Key R&D Program (guike AB20159012), Interdisciplinary Scientific Research Foundation of GuangXi University (Grant No. 2022JCC023), the Guangxi Science and Technology Base and Special Talents (guike AD21220101), the National Natural Science Foundation of China (52161042, 11962001).

Data Availability Statement

Not applicable.

Conflicts of Interest

The authors declare no conflict of interest.

References

  1. Kumar, N.; Goel, S.; Jayaganthan, R.; Owolabi, G.M. The influence of metallurgical factors on low cycle fatigue behavior of ultra-fine grained 6082 Al alloy. Int. J. Fatigue 2018, 110, 130–143. [Google Scholar] [CrossRef]
  2. Salcedo, D.; Luis, C.J.; Puertas, I.; León, J.; Luri, R.; Fuertes, J.P. FEM Modelling and Experimental Analysis of an AA5083 Turbine Blade from ECAP Processed Material. Mater. Manuf. Process. 2014, 29, 434–441. [Google Scholar] [CrossRef]
  3. Balasubramanian, R.; Nagumothu, R.; Parfenov, E.; Valiev, R. Development of nanostructured titanium implants for biomedical implants—A short review. Mater. Today Proc. 2021, 46, 1195–1200. [Google Scholar] [CrossRef]
  4. Luis Pérez, C.J.; Salcedo Pérez, D.; Puertas Arbizu, I. Design and mechanical property analysis of ultrafine grained gears from AA5083 previously processed by equal channel angular pressing and isothermal forging. Mater. Des. 2014, 63, 126–135. [Google Scholar] [CrossRef]
  5. Luri, R.; Luis, C.J.; León, J.; Fuertes, J.P.; Salcedo, D.; Puertas, I. Analysis of Fatigue and Wear Behaviour in Ultrafine Grained Connecting Rods. Metals 2017, 7, 289. [Google Scholar] [CrossRef] [Green Version]
  6. Zhao, P.C.; Chen, B.; Zheng, Z.G.; Guan, B.; Zhang, X.C.; Tu, S.T. Microstructure and Texture Evolution in a Post-dynamic Recrystallized Titanium During Annealing, Monotonic and Cyclic Loading. Metall. Mater. Trans. A 2021, 52, 394–412. [Google Scholar] [CrossRef]
  7. Zhao, P.; Chen, B.; Kelleher, J.; Yuan, G.; Guan, B.; Zhang, X.; Tu, S. High-cycle-fatigue induced continuous grain growth in ultrafine-grained titanium. Acta Mater. 2019, 174, 29–42. [Google Scholar] [CrossRef]
  8. Zhang, Y.; Chen, H.; Jia, Y.-F.; Li, D.-F.; Yuan, G.-J.; Zhang, X.-C.; Tu, S.-T. A modified kinematic hardening model considering hetero-deformation induced hardening for bimodal structure based on crystal plasticity. Int. J. Mech. Sci. 2021, 191, 106068. [Google Scholar] [CrossRef]
  9. Zhang, X.-C.; Li, H.-C.; Zeng, X.; Tu, S.-T.; Zhang, C.-C.; Wang, Q.-Q. Fatigue behavior and bilinear Coffin-Manson plots of Ni-based GH4169 alloy with different volume fractions of δ phase. Mater. Sci. Eng. A 2017, 682, 12–22. [Google Scholar] [CrossRef]
  10. Zhang, K.-S.; Ju, J.W.; Li, Z.; Bai, Y.-L.; Brocks, W. Micromechanics based fatigue life prediction of a polycrystalline metal applying crystal plasticity. Mech. Mater. 2015, 85, 16–37. [Google Scholar] [CrossRef] [Green Version]
  11. Zhang, K.-S.; Shi, Y.-K.; Ju, J.W. Grain-level statistical plasticity analysis on strain cycle fatigue of a FCC metal. Mech. Mater. 2013, 64, 76–90. [Google Scholar] [CrossRef]
  12. Castelluccio, G.M.; McDowell, D.L. Mesoscale modeling of microstructurally small fatigue cracks in metallic polycrystals. Mater. Sci. Eng. A 2014, 26, 34–55. [Google Scholar] [CrossRef]
  13. Li, D.-F.; Davies, C.M.; Zhang, S.-Y.; Dickinson, C.; O’Dowd, N.P. The effect of prior deformation on subsequent microplasticity and damage evolution in an austenitic stainless steel at elevated temperature. Acta Mater. 2013, 61, 3575–3584. [Google Scholar] [CrossRef] [Green Version]
  14. Yuan, G.-J.; Zhang, X.-C.; Chen, B.; Tu, S.-T.; Zhang, C.-C. Low-cycle fatigue life prediction of a polycrystalline nickel-base superalloy using crystal plasticity modelling approach. J. Mater. Sci. Technol. 2020, 38, 28–38. [Google Scholar] [CrossRef]
  15. Wang, J.; Jiang, W. Numerical assessment on fatigue damage evolution of materials at crack tip of CT specimen based on CPFEM. Theor. Appl. Fract. Mech. 2020, 109, 102687. [Google Scholar] [CrossRef]
  16. Li, D.-F.; Barrett, R.A.; O’Donoghue, P.E.; O’Dowd, N.P.; Leen, S.B. A multi-scale crystal plasticity model for cyclic plasticity and low-cycle fatigue in a precipitate-strengthened steel at elevated temperature. J. Mech. Phys. Solids 2017, 101, 44–62. [Google Scholar] [CrossRef] [Green Version]
  17. Hao, Y.; Wei, Z.; Castelluccio, G.M.; Kim, J.; Liu, Y. Microstructure-sensitive Estimation of Small Fatigue Crack Growth in Bridge Steel Welds. Int. J. Fatigue 2018, 112, 183–197. [Google Scholar]
  18. Vishnu, P.; Raj Mohan, R.; Krishna Sangeethaa, E.; Raghuraman, S.; Venkatraman, R. A review on processing of aluminium and its alloys through Equal Channel Angular Pressing die. Mater. Today Proc. 2020, 21, 212–222. [Google Scholar] [CrossRef]
  19. Estrin, Y.; Vinogradov, A. Fatigue behaviour of light alloys with ultrafine grain structure produced by severe plastic deformation: An overview. Int. J. Fatigue 2010, 32, 898–907. [Google Scholar] [CrossRef]
  20. Sga, B.; Sm, B. Fracture toughness characteristics of ultrafine grained Nb–Ti stabilized microalloyed and interstitial free steels processed by advanced multiphase control rolling. Mater. Charact. 2020, 159, 110003. [Google Scholar]
  21. Hohenwarter, A.; Pippan, R. Fracture toughness evaluation of ultrafine-grained nickel. Scr. Mater. 2011, 64, 982–985. [Google Scholar] [CrossRef]
  22. Kumar, N.; Owolabi, G.M.; Jayaganthan, R. Al 6082 alloy strengthening through low strain multi-axial forging. Mater. Charact. 2019, 155, 109761. [Google Scholar] [CrossRef]
  23. Ding, H.Z.; Mughrabi, H.; Höppel, H.W. Alow-cycle fatigue life prediction model of ultrafine-grained metals. Fatigue Fract. Eng. Mater. Struct. 2002, 25, 975–984. [Google Scholar] [CrossRef]
  24. Musinski, W.D.; McDowell, D.L. Simulating the effect of grain boundaries on microstructurally small fatigue crack growth from a focused ion beam notch through a three-dimensional array of grains. Acta Mater. 2016, 112, 20–39. [Google Scholar] [CrossRef]
  25. Potirniche, G.P.; Daniewicz, S.R. Analysis of crack tip plasticity for microstructurally small cracks using crystal plasticity theory. Eng. Fract. Mech. 2003, 70, 1623–1643. [Google Scholar] [CrossRef]
  26. McDowell, D.L.; Berard, J.Y. A ΔJ-based approach to biaxial fatigue. Fatigue Fract. Eng. Mater. Struct. Aug. 1992, 15, 719–741. [Google Scholar] [CrossRef]
  27. Shenoy, M.; Zhang, J.; McDowell, D.L. Estimating fatigue sensitivity to polycrystalline Ni-base superalloy microstructures using a computational approach. Fatigue Fract. Eng. Mater. Struct. 2007, 30, 889–904. [Google Scholar] [CrossRef]
  28. Moosbrugger, J.C.; Batane, N.R.; Morrison, D.J. Modeling aspects of low plastic strain amplitude multiaxial cyclic plasticity in conventional and ultrafine grain nickel. Int. J. Plast. 2008, 24, 1837–1862. [Google Scholar] [CrossRef]
  29. Tong, J.; Lin, B.; Lu, Y.W.; Madi, K.; Tai, Y.H.; Yates, J.R.; Doquet, V. Near-tip strain evolution under cyclic loading: In situ experimental observation and numerical modelling. Int. J. Fatigue 2015, 71, 45–52. [Google Scholar] [CrossRef]
  30. Zhao, B.; Xie, L.; Song, J.; Zhao, Z.; Xu, G. Prediction of multiaxial fatigue life for complex three imensional stress state considering effect of additional hardening. Fatigue Fract. Eng. Mater. Struct. 2019, 42, 2558–2578. [Google Scholar] [CrossRef]
  31. Cailletaud, G. A micromechanical approach to inelastic behaviour of metals. Int. J. Plast. 1992, 8, 55–73. [Google Scholar] [CrossRef]
  32. Roters, F.; Eisenlohr, P.; Hantcherli, L.; Tjahjanto, D.D.; Bieler, T.R.; Raabe, D. Overview of constitutive laws, kinematics, homogenization and multiscale methods in crystal plasticity finite-element modeling: Theory, experiments, applications. Acta Mater. 2010, 58, 1152–1211. [Google Scholar] [CrossRef]
  33. Farooq, H.; Cailletaud, G.; Forest, S.; Ryckelynck, D. Crystal plasticity modeling of the cyclic behavior of polycrystalline aggregates under non-symmetric uniaxial loading: Global and local analyses. Int. J. Plast. 2020, 126, 102619. [Google Scholar] [CrossRef] [Green Version]
  34. Mecking, H.; Kocks, U.F. Kinetics of flow and strain-hardening. Acta Metallurgica 1981, 29, 1865–1875. [Google Scholar] [CrossRef]
  35. Wan, V.V.C.; MacLachlan, D.W.; Dunne, F.P.E. A stored energy criterion for fatigue crack nucleation in polycrystals. Int. J. Fatigue 2014, 68, 90–102. [Google Scholar] [CrossRef]
  36. Anahid, M.; Samal, M.K.; Ghosh, S. Dwell fatigue crack nucleation model based on crystal plasticity finite element simulations of polycrystalline titanium alloys. J. Mech. Phys. Solids 2011, 59, 2157–2176. [Google Scholar] [CrossRef]
  37. Mbiakop, A.; Constantinescu, A.; Danas, K. An analytical model for porous single crystals with ellipsoidal voids. J. Mech. Phys. Solids 2015, 84, 436–467. [Google Scholar] [CrossRef] [Green Version]
  38. Li, D.-F.; O’Dowd, N.P. On the evolution of lattice deformation in austenitic stainless steels—The role of work hardening at finite strains. J. Mech. Phys. Solids 2011, 59, 2421–2441. [Google Scholar] [CrossRef]
  39. Shang, D.-G.; Wang, D.-J.; Yao, W.-X. A simple approach to the description of multiaxial cyclic stress-strain relationship. Int. J. Fatigue 2000, 22, 251–256. [Google Scholar] [CrossRef]
  40. Yao, Y.; Wang, J.; Keer, L.M. A phase transformation based method to predict fatigue crack nucleation and propagation in metals and alloys. Acta Mater. 2017, 127, 244–251. [Google Scholar] [CrossRef]
  41. Rice, J.R. A Path Independent Integral and the Approximate Analysis of Strain Concentration by Notches and Cracks. J. Appl. Mech. 1968, 35, 379–386. [Google Scholar] [CrossRef] [Green Version]
  42. Broek, D. Elementary Engineering Fracture Mechanics; Springer Science & Business Media: Berlin, Germany, 1982. [Google Scholar]
  43. Rao, P.N.; Singh, D.; Brokmeier, H.-G.; Jayaganthan, R. Effect of ageing on tensile behavior of ultrafine grained Al 6061 alloy. Mater. Sci. Eng. A 2015, 641, 391–401. [Google Scholar] [CrossRef]
  44. Khan, A.S.; Liu, J. A deformation mechanism based crystal plasticity model of ultrafine-grained/nanocrystalline FCC polycrystals. Int. J. Plast. 2016, 86, 56–69. [Google Scholar] [CrossRef]
  45. Halliday, M.D.; Bowen, P. Fatigue extrusions, slip band cracking and a novel hybrid concept for fatigue crack closure close to the crack tip. Int. J. Fatigue 2011, 33, 1277–1285. [Google Scholar] [CrossRef]
  46. McDowell, D.L. An Experimental Study of the Structure of Constitutive Equations for Nonproportional Cyclic Plasticity. J. Eng. Mater. Technol. 1985, 107, 307–315. [Google Scholar] [CrossRef]
  47. Borodii, M.V.; Shukaev, S.M. Additional cyclic strain hardening and its relation to material structure, mechanical characteristics, and lifetime. Int. J. Fatigue 2007, 29, 1184–1191. [Google Scholar] [CrossRef]
  48. Yang, M.; Lu, S. A microstructure-based homogenization model for predicting the low-cycle fatigue initiation life of GH4169 superalloy. Fatigue Fract. Eng. Mater. Struct. 2021, 44, 1546–1561. [Google Scholar] [CrossRef]
Figure 1. (a) The tested fatigue machine (b) Geometric dimensions of the cylindrical specimen for strain-controlled LCF tests (unit: mm) (c) The tested samples.
Metals 12 01127 g001
Figure 2. The local multiaxial stress state in fatigue damage region (FDR) and cyclic plastic region (CPR) on the specific slip plane.
Metals 12 01127 g002
Figure 3. (a) The microstructure of ECAPed sample obtained by the EBSD test (b) Grain size analysis.
Metals 12 01127 g003
Figure 4. (a) The tested LCF specimen; (b) EBSD map; (c) boundary condition and loading direction applied to RVE; (d) Subset1-64grains; (e) Subset2-125grains; (f) Subset3-216grains; (g) Subset4-512grains.
Metals 12 01127 g004
Figure 5. (a) Grain number sensitivity analysis; (b) The experimental and simulated hysteresis loop in terms of cyclic stability state.
Metals 12 01127 g005
Figure 6. Simulated energy dissipation results and the location of maximum value under the strain amplitude of 0.007: (a) k = 0 and (b) k = 1.5; (c) Contours of stress triaxiality at the tension peak of 6th cycle; (d) Cyclic hysteresis loop for the k = 1.5 and k = 0 at the maximum fatigue damage location in terms of the 1st cycle, respectively; PSE response surface for (e) k = 0 and (f) k = 1.5.
Metals 12 01127 g006aMetals 12 01127 g006b
Figure 7. (a) FIPSC distribution with respect to the strain amplitude 0.6%; 3D Scatter diagram for FIPSC in terms of strain amplitude (b) 0.5% (c) 0.6% (d) 0.7% for 216 crystal grains.
Metals 12 01127 g007aMetals 12 01127 g007b
Figure 8. Stress amplitude vs. plastic strain amplitude curves.
Metals 12 01127 g008
Figure 9. Comparisons between the predicted LCF lives and experimental ones: the existing prediction approach based on (a) plastic strain range; (b) The proposed prediction approach based on the combined influence of multiaxial strain and PSE.
Metals 12 01127 g009
Table 1. Chemical composition of 6061 aluminum alloy (% in weight).
SiFeCuMnMgCrZnTi
0.5860.2410.2640.0950.9450.070.0240.005
Table 2. The values of material parameters for CPFEM simulation.
Parameter TypeMaterial Parameters
Elastic constants:C11 = 77,159 MPa, C12 = 55,706 Mpa, C44 = 35,910 Mpa
Flow rule: γ ˙ 0 = 0.001 , n = 50
Kinematic hardening rule:C = 8831 Mpa, D = 118
Isotropic hardening rule:ΔGB = 87,000 J/mol, T = 300 K, kB = 1.38 × 10⁻²³, b = 0.286 nm,
y0 = 0.9 × 10⁻²⁵, h0 = 0.014, K = 3.55, ω1 = 1, ω2 = 1
Table 3. Characteristic parameters of UFG AA6061 and CG AA6061.
Materials n K Cyclic Yield Strength
R P , 0 . 2 U F G ( MPa )
Strengthening Factor
K G B S
UFG AA6061/RT state0.214841392.1
CG AA6061/RT state0.1516866
Table 4. Experimental LCF lives vs. the predicted LCF lives by using the existing method (N1) and proposed method (N2).
Δ E t / 2   ( % ) N f N ¯ f N 1 N 1 N ¯ f N ¯ f N 2 N 2 N ¯ f N ¯ f
0.53125/2173/2589262935580.351958−0.26
0.61653/986/1213128415870.24982−0.24
0.7512/378/6815246500.24424−0.19
Publisher’s Note: MDPI stays neutral with regard to jurisdictional claims in published maps and institutional affiliations.

