
Densities of Liquid Tm2O3, Yb2O3, and Lu2O3 Measured by an Electrostatic Levitation Furnace Onboard the International Space Station

 ,
,
Abstract
1. Introduction
2. Experimental Setup
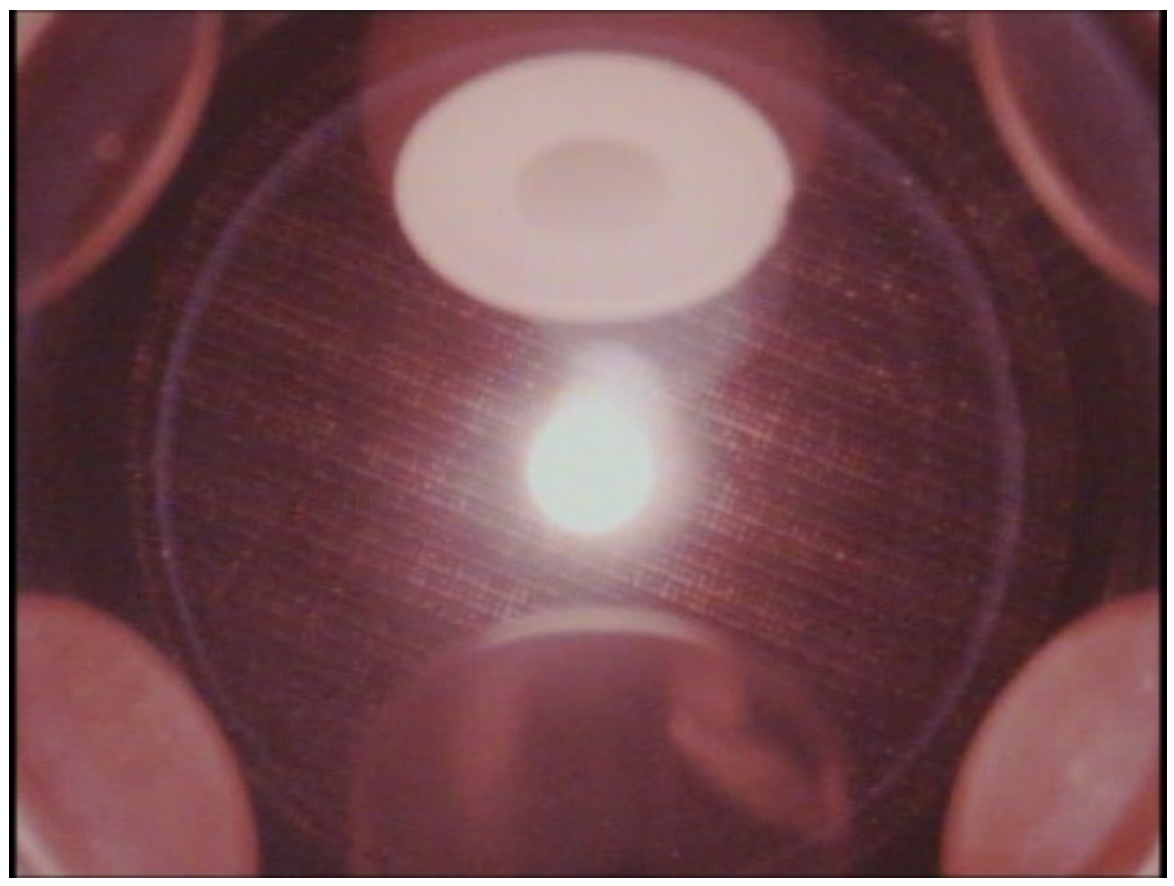
2.1. Electrostatic Levitation Furnace
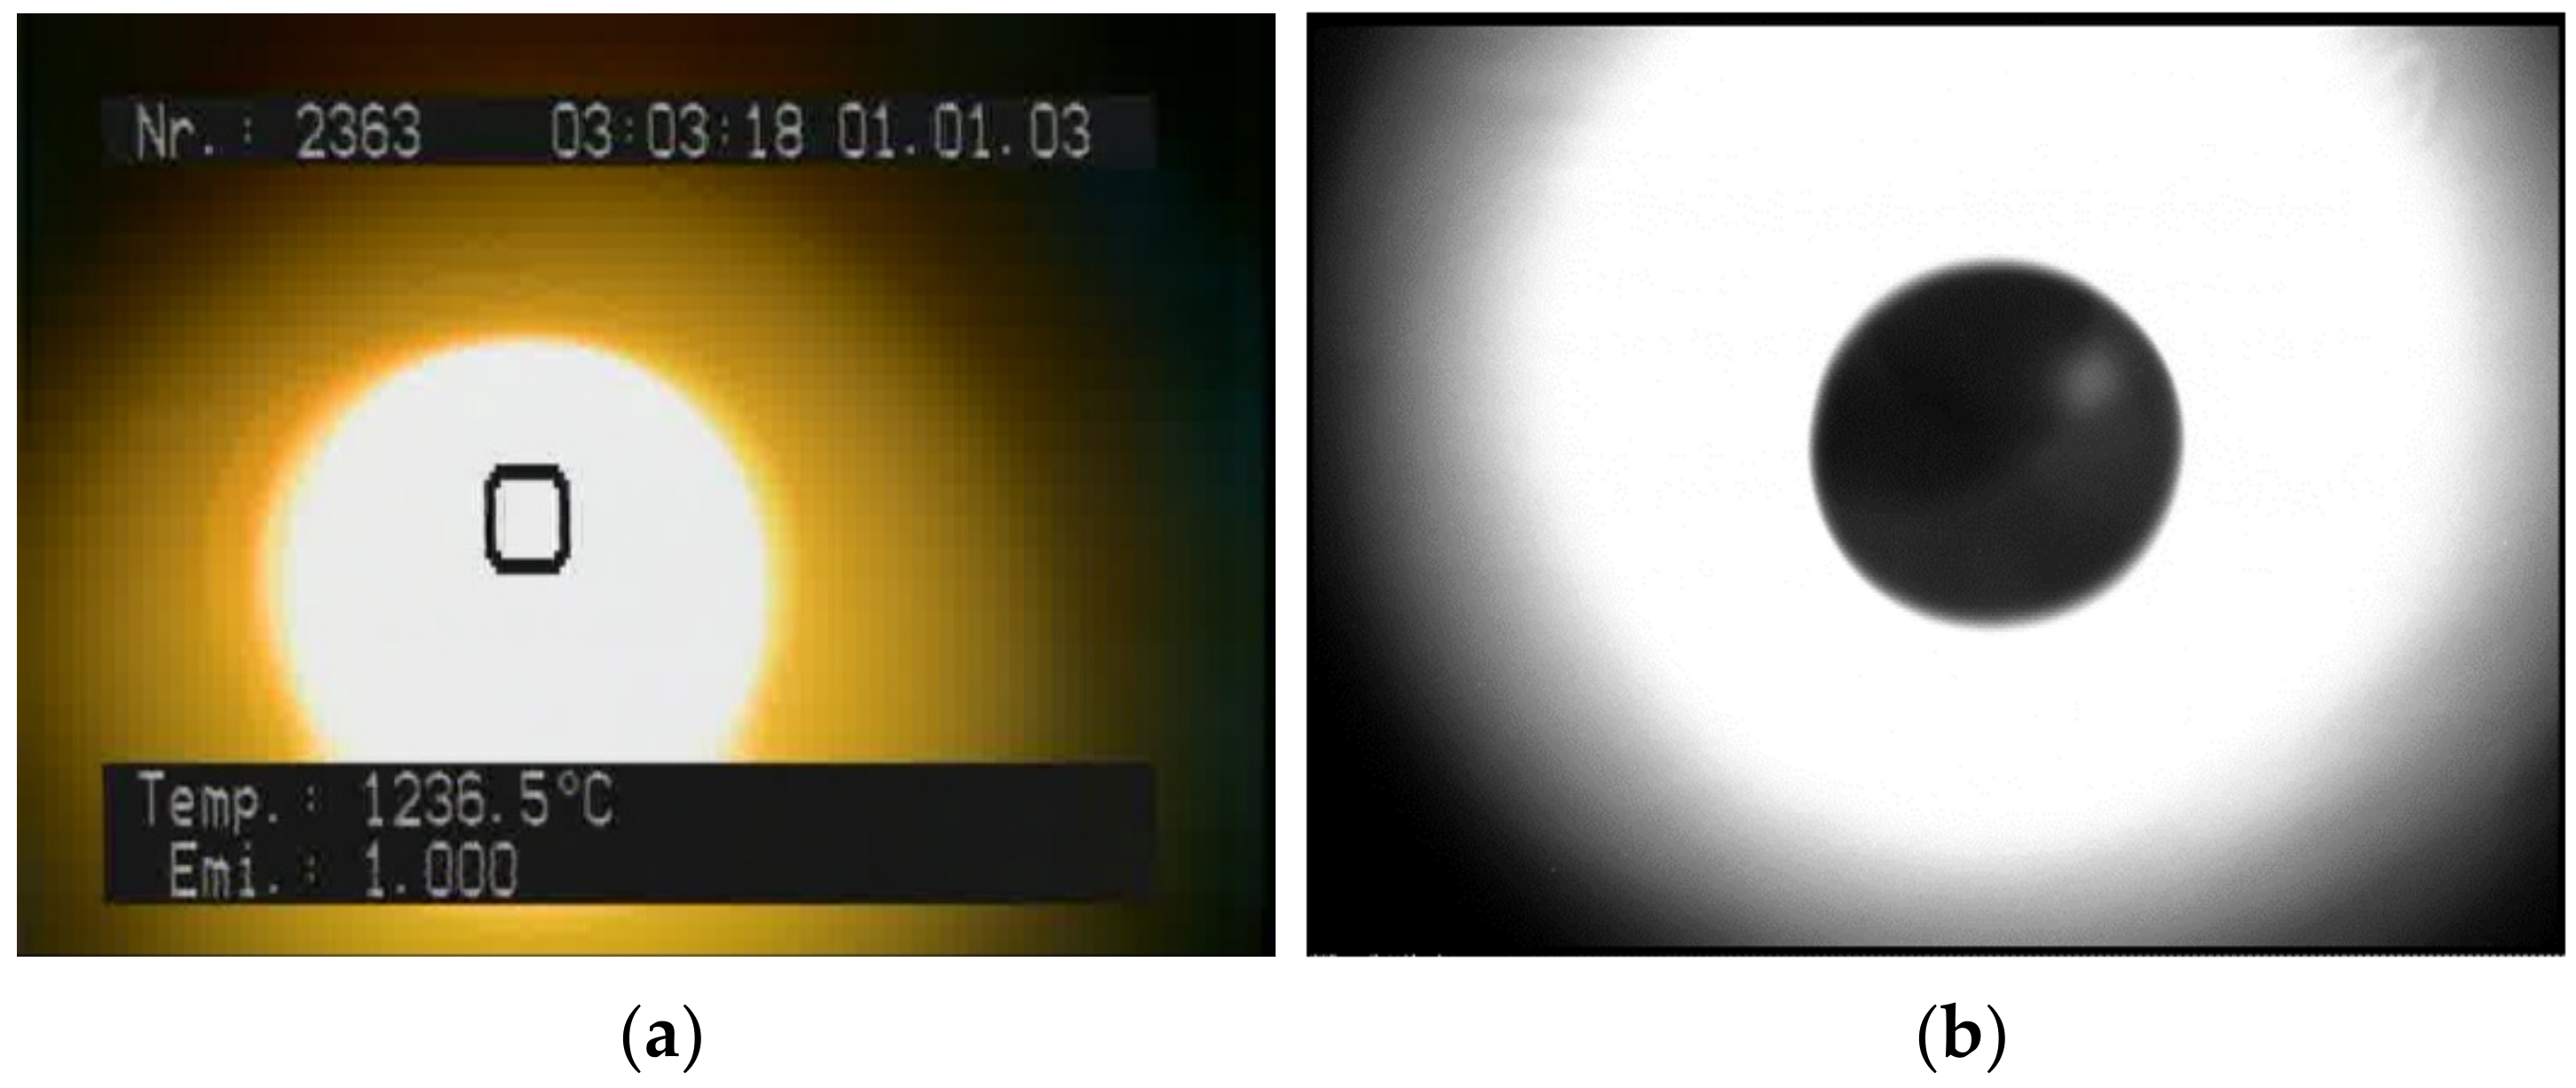
2.2. Density Measurement
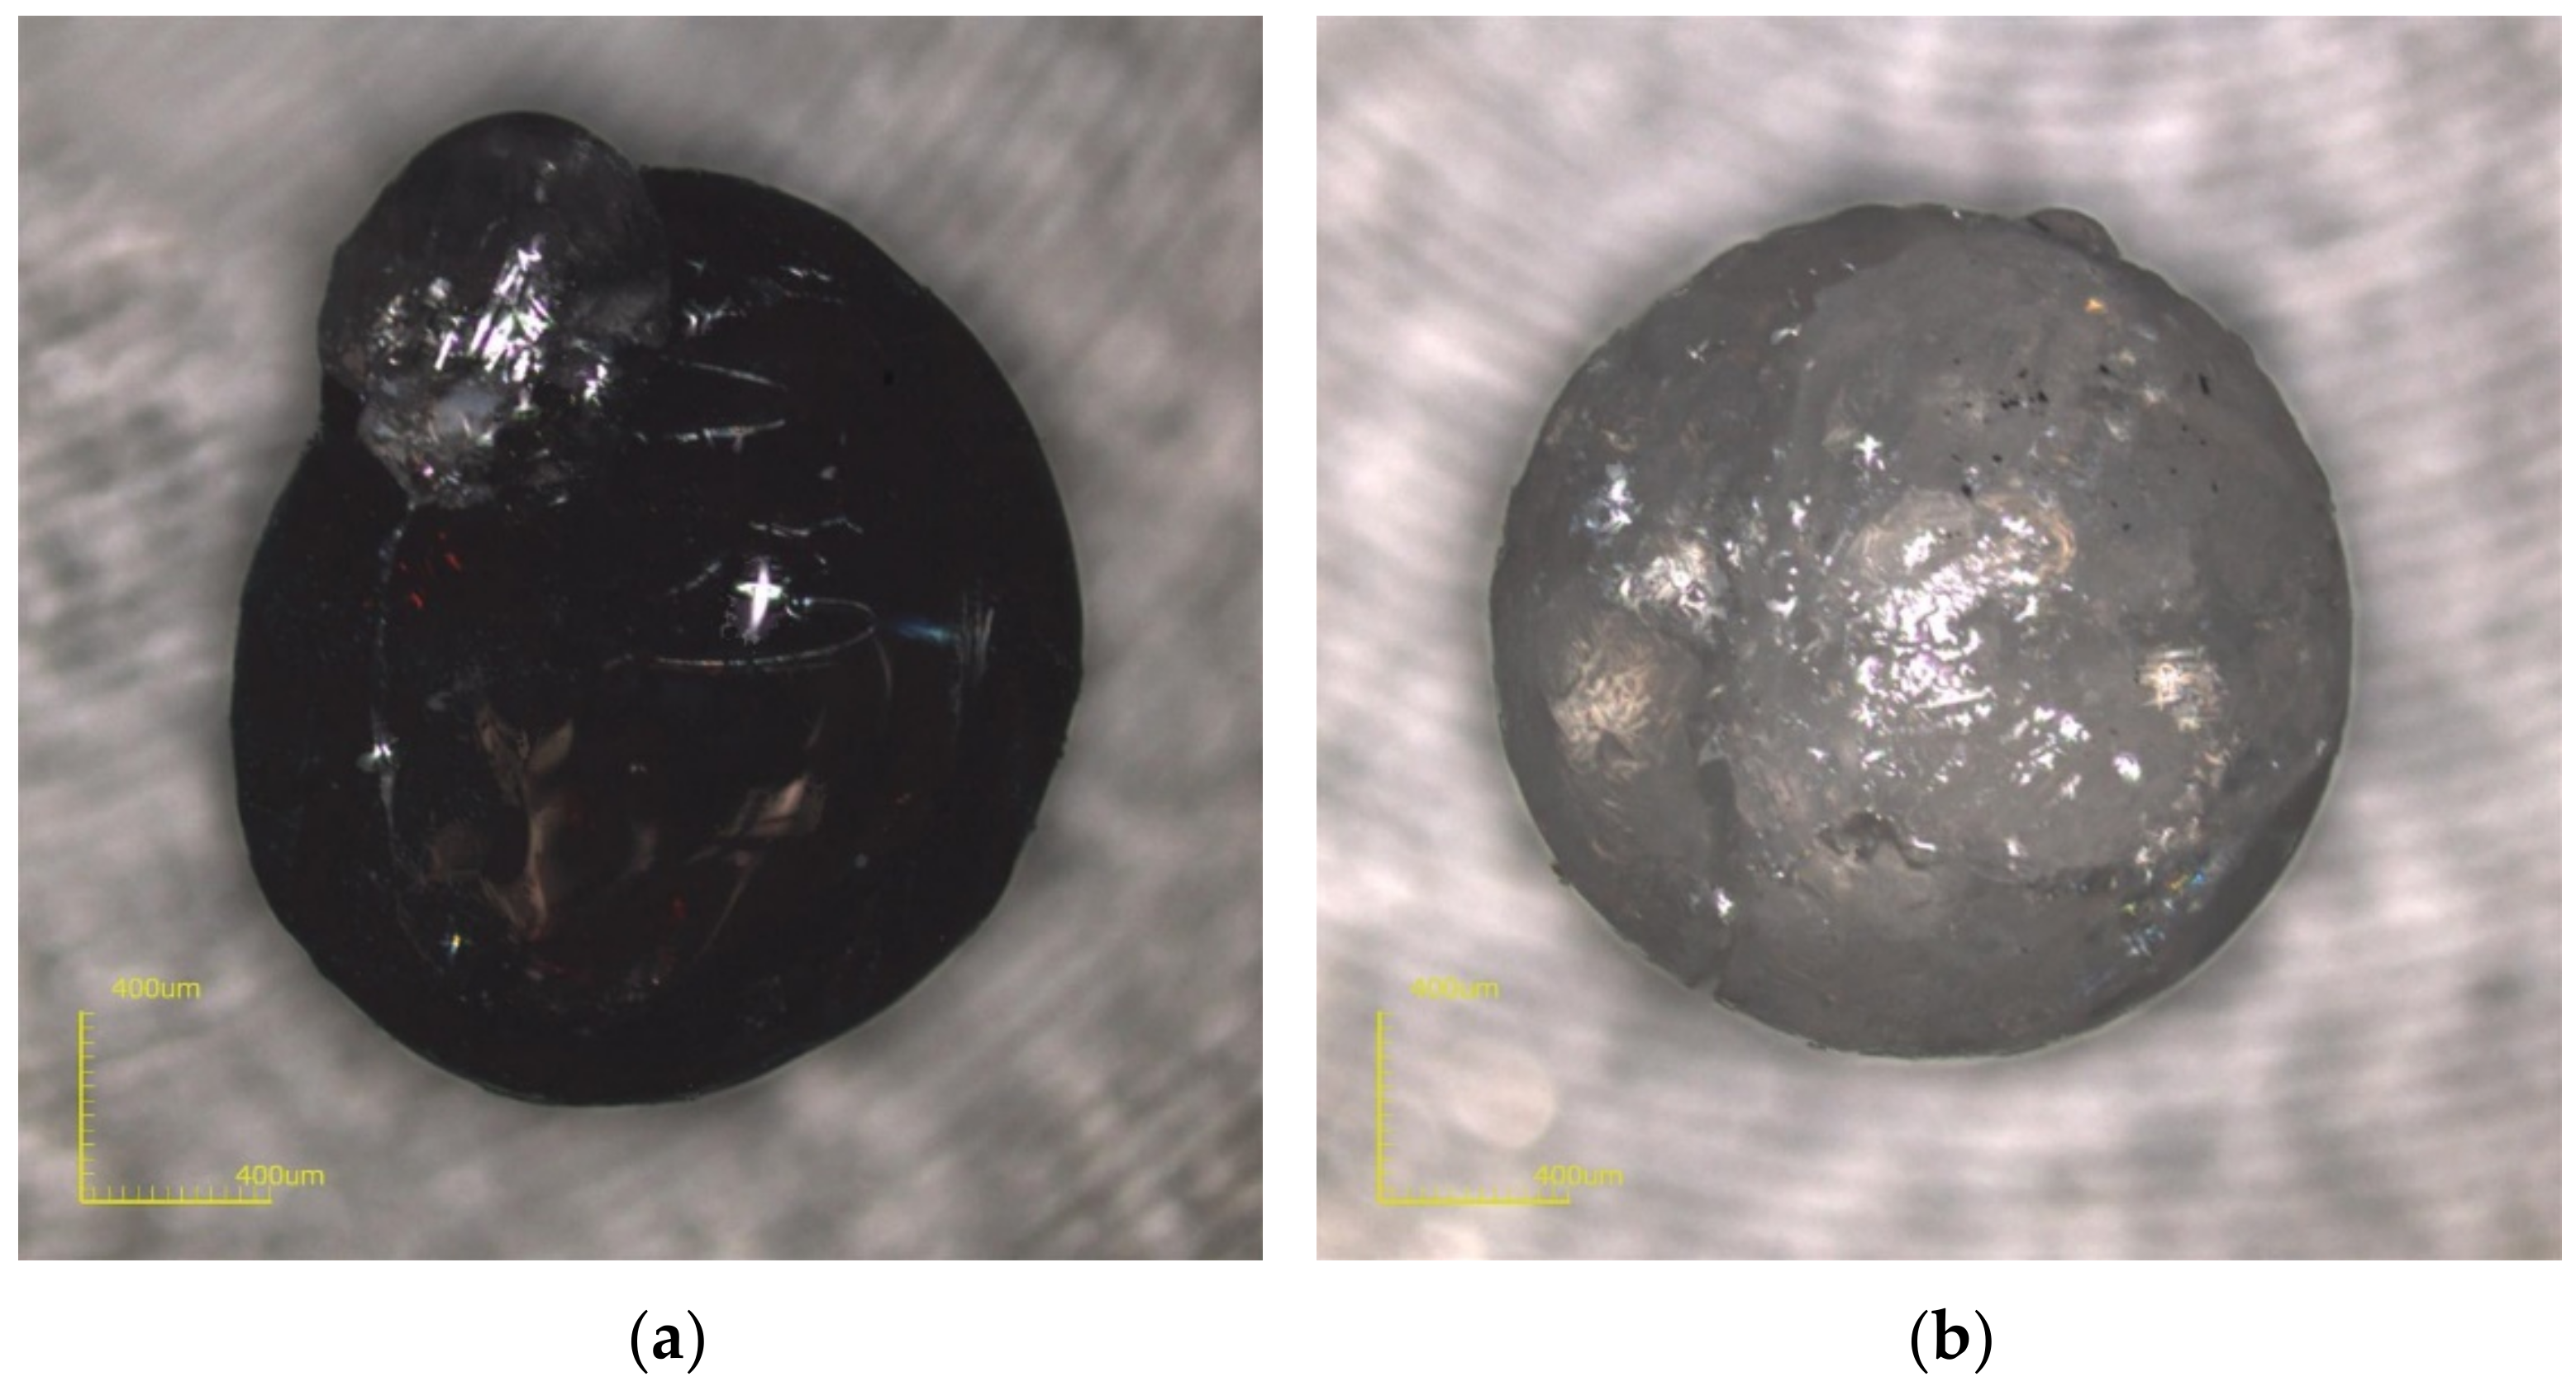
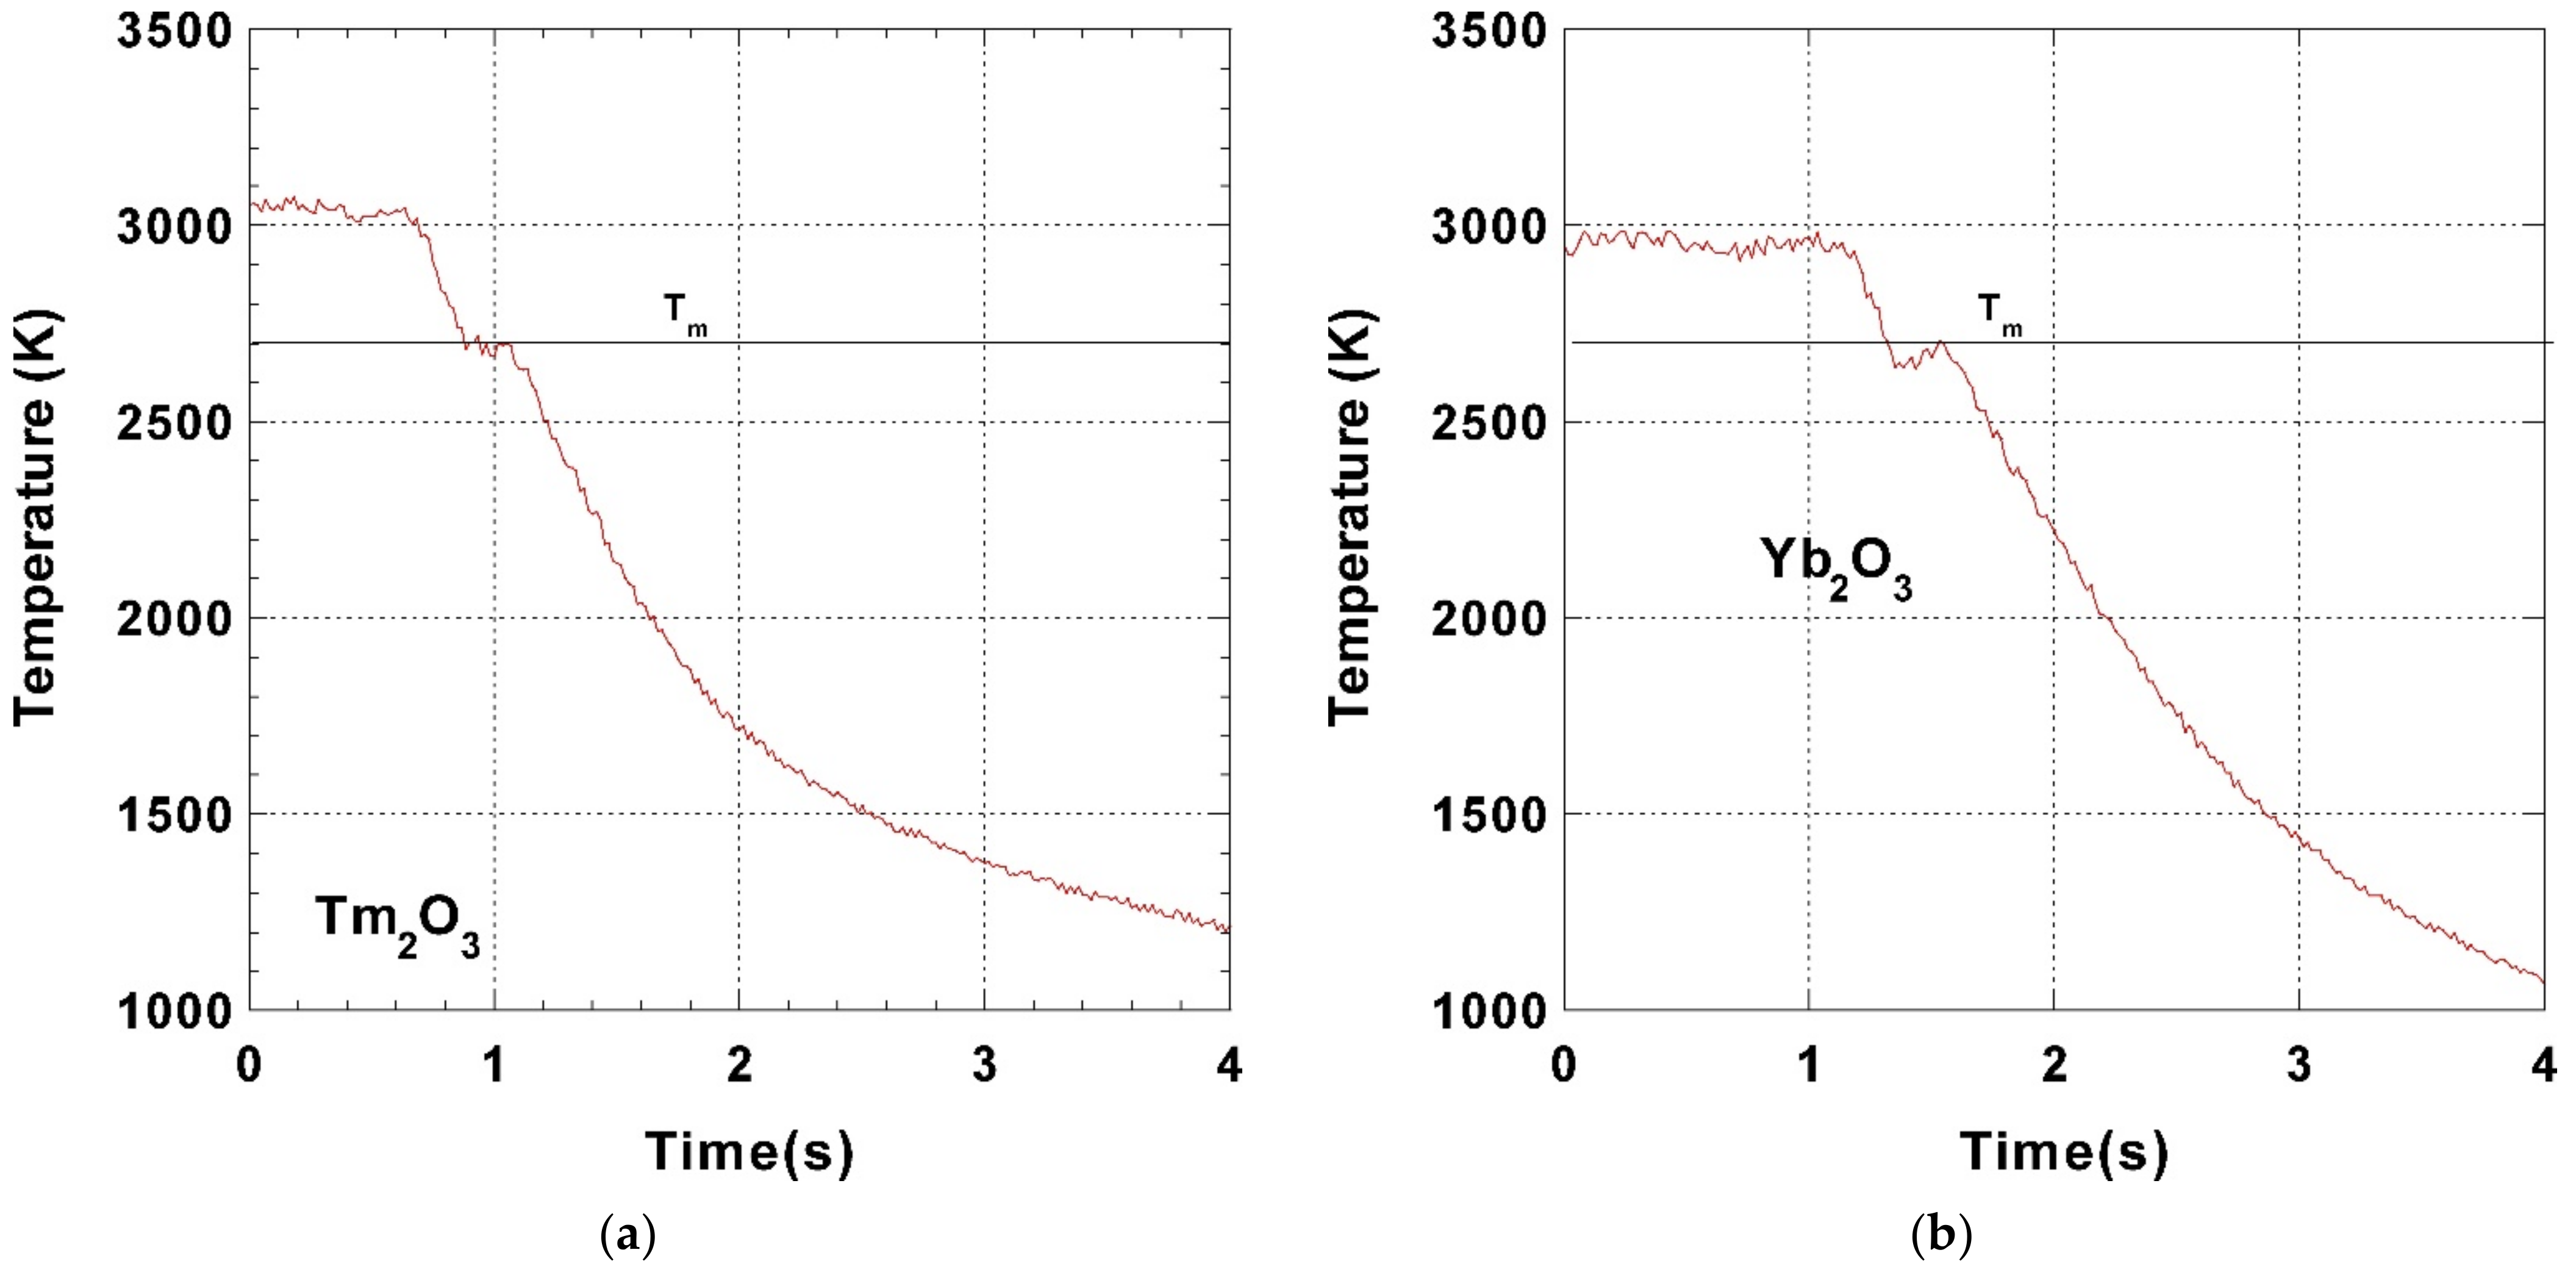
3. Results and Discussion
4. Conclusions
Supplementary Materials
Author Contributions
Funding
Institutional Review Board Statement
Informed Consent Statement
Data Availability Statement
Acknowledgments
Conflicts of Interest
References
- Chen, Z.; Li, Z.; Li, J.; Liu, C.; Lao, C.; Fu, Y.; Liu, C.; Li, Y.; Wang, P.; He, Y. 3D printing of ceramics: A review. J. Eur. Ceram. Soc. 2019, 39, 661–687. [Google Scholar] [CrossRef]
- Ushakov, S.V.; Niessen, J.; Quirinale, D.G.; Prieler, R.; Navrotsky, A.; Telle, R. Measurements of Density of Liquid Oxides with an Aero-Acoustic Levitator. Materials 2021, 14, 822. [Google Scholar] [CrossRef] [PubMed]
- Granier, B.; Heurtault, S. Density of liquid rare-earth sesquioxides. J. Am. Ceram. Soc. 1988, 71, C466–C468. [Google Scholar] [CrossRef]
- Courtial, P.; Dingwell, D.B. High-temperature density of lanthanide-bearing Na-silicate melts: Partial molar volumes for Ce2O3, Pr2O3, Nd2O3, Sm2O3, Eu2O3, Gd2O3, Tb2O3, Dy2O3, Ho2O3, Er2O3, Tm2O3, and Yb2O3. Am. Mineral. 2005, 90, 1597–1605. [Google Scholar] [CrossRef]
- Brillo, J.; Egry, I. Density Determination of Liquid Copper, Nickel, and Their Alloys. Int. J. Thermophys. 2003, 24, 1155–1170. [Google Scholar] [CrossRef]
- Shneider, S.; Egry, I.; Seyhan, I. Measurement of the Surface Tension of Undercooled Liquid Ti90Al6V4 by the Oscillating Drop Technique. Int. J. Thermophys. 2002, 23, 1241–1248. [Google Scholar] [CrossRef]
- Brillo, J.; Kolland, G. Surface tension of liquid Al–Au binary alloys. J. Mater. Sci. 2016, 51, 4888–4901. [Google Scholar] [CrossRef]
- Kobatake, H.; Fukuyama, H.; Tsukada, T.; Awaji, S. Noncontact modulated laser calorimetry in a dc magnetic field for stable and supercooled liquid silicon. Meas. Sci. Technol. 2010, 21, 025901. [Google Scholar] [CrossRef]
- Seidel, A.; Soellner, W.; Stenzel, C. EML—An electromagnetic levitator for the International Space Station. J. Phys. Conf. Ser. 2011, 327, 012057. [Google Scholar] [CrossRef]
- Mohr, M.; Hofmann, D.C.; Fecht, H.-J. Thermophysical Properties of an Fe57.75Ni19.25Mo10C5B8 Glass-Forming Alloy Measured in Microgravity. Adv. Eng. Mater. 2021, 23, 2001143. [Google Scholar] [CrossRef]
- Luo, Y.; Damaschke, B.; Schneider, S.; Lohöfer, G.; Abrosimov, N.; Czupalla, M.; Samwer, K. Contactless processing of SiGe-melts in EML under reduced gravity. NPJ Microgravity 2016, 2, 1. [Google Scholar] [CrossRef][Green Version]
- Xiao, X.; Brillo, J.; Lee, J.; Robert, W.; Hyers, R.W.; Matson, D.M. Impact of convection on the damping of an oscillating droplet during viscosity measurement using the ISS-EML facility. NPJ Microgravity 2021, 7, 36. [Google Scholar] [CrossRef]
- Rhim, W.-K.; Collender, M.; Hyson, M.T.; Simms, W.T.; Elleman, D.D. Development of an electrostatic positioner for space material processing. Rev. Sci. Instrum. 1985, 56, 307. [Google Scholar] [CrossRef]
- Rhim, W.-K.; Chung, S.K.; Barber, D.; Man, K.F.; Gutt, G.; Rulison, A.; Spjut, R.E. An electrostatic levitator for high-temperature containerless materials processing in 1-g. Rev. Sci. Instrum. 1993, 64, 2961. [Google Scholar] [CrossRef]
- Chung, S.K.; Thiessen, D.B.; Rhim, W.-K. A noncontact measurement technique for the density and thermal expansion coefficient of solid and liquid materials. Rev. Sci. Instrum. 1996, 67, 3175. [Google Scholar] [CrossRef]
- Rhim, W.-K.; Ohsaka, K.; Paradis, P.-F.; Erik Spjut, R.E. Noncontact technique for measuring surface tension and viscosity of molten materials using high temperature electrostatic levitation. Rev. Sci. Instrum. 1999, 70, 2796. [Google Scholar] [CrossRef]
- Rulison, A.J.; Rhim, W.-K. A noncontact measurement technique for the specific heat and total hemispherical emissivity of undercooled refractory materials. Rev. Sci. Instrum. 1994, 65, 695. [Google Scholar] [CrossRef]
- Paradis, P.-F.; Ishikawa, T.; Lee, G.-W.; Holland-Moritz, D.; Brillo, J.; Rhim, W.-K.; Okada, J.T. Materials properties measurements and particle beam interactions studies using electrostatic levitation. Mater. Sci. Eng. R 2014, 76, 1–53. [Google Scholar] [CrossRef]
- Tamaru, H.; Koyama, C.; Saruwatari, H.; Nakamura, Y.; Ishikawa, T.; Takada, T. Status of the electrostatic levitation furnace (ELF) in the ISS-KIBO. Microgravity Sci. Technol. 2018, 30, 643–651. [Google Scholar] [CrossRef]
- Ishikawa, T.; Koyama, C.; Saruwatari, H.; Tamaru, H.; Oda, H.; Ohshio, M.; Nakamura, Y.; Watanabe, Y.; Nakata, Y. Density of molten Gadolinium oxide measured with the electrostatic levitation furnace in the International Space Station. High Temp. High Press. 2020, 49, 5–15. [Google Scholar] [CrossRef]
- Koyama, C.; Tahara, S.; Kohara, S.; Onodera, Y.; Småbråten, D.R.; Selbach, S.M.; Akola, J.; Ishikawa, T.; Masuno, A.; Mizuno, A.; et al. Very sharp diffraction peak in liquid Er2O3 with crystal-like homology. NPG Asia Mater. 2020, 12, 43. [Google Scholar] [CrossRef]
- Koyama, C.; Ishikawa, T.; Oda, H.; Saruwatari, H.; Ueno, S.; Oshio, M.; Watanabe, Y.; Nakata, Y. Densities of liquid lanthanoid sesquioxides measured with the electrostatic levitation furnace in the ISS. J. Am. Ceram. Soc. 2021, 104, 2913–2918. [Google Scholar] [CrossRef]
- Coutures, J.P.; Rand, M.H. Melting temperatures of refractory oxides: Part II Lanthanoid sesquioxides. Pure Appl. Chem. 1989, 61, 1461–1482. [Google Scholar] [CrossRef]
- Sarou-Kanian, V.; Rifflet, J.-C.; Millot, F. UV-visible pyrometry of refractory oxides at high temperature. High Temp. High Press. 2011, 40, 249–261. [Google Scholar]
- Masuno, A.; Arai, Y.; Yu, J. In situ observation of containerless solidification from undercooled Lu2O3 and Y2O3 melts. Phase Transit. 2008, 81, 553–559. [Google Scholar] [CrossRef]
- Ishikawa, T.; Paradis, P.-F.; Yoda, S. New sample levitation initiation and imaging techniques for the processing of refractory metals with an electrostatic levitator furnace. Rev. Sci. Instrum. 2001, 72, 2490–2495. [Google Scholar] [CrossRef]
- Langstaff, D.; Gunn, M.; Greaves, G.N.; Marsing, A.; Kargl, F. Aerodynamic levitator furnace for measuring thermophysical properties of refractory liquids. Rev. Sci. Instrum. 2013, 84, 124901. [Google Scholar] [CrossRef]
- Dingwell, D.B. Density of Ga2O3 liquid. J. Am. Ceram. Soc. 1992, 75, 1656–1657. [Google Scholar] [CrossRef]
- Ishikawa, T.; Koyama, C.; Oda, H.; Saruwatari, H.; Paradis, P.-F. Status of the Electrostatic Levitation Furnace in the ISS—Surface Tension and Viscosity measurements. Int. J. Microgravity Sci. Appl. 2022, 39, 390101. [Google Scholar] [CrossRef]
- Hakamada, S.; Nakamura, A.; Watanabe, M.; Kargl, F. Surface Oscillation Phenomena of Aerodynamically Levitated Molten Al2O3. Int. J. Microgravity Sci. Appl. 2017, 34, 340403. [Google Scholar]
- Kargl, F.; Yuan, C.; Greaves, G.N. Aerodynamic Levitation: Thermophysical Property Measurements of Liquid Oxides. Int. J. Microgravity Sci. Appl. 2015, 32, 320212. [Google Scholar] [CrossRef]
- Kondo, T.; Muta, H.; Kurosaki, K.; Kargl, F.; Yamaji, A.; Furuya, M.; Ohishi, Y. Density and viscosity of liquid ZrO2 measured by aerodynamic levitation technique. Heliyon 2019, 5, e02049. [Google Scholar] [CrossRef] [PubMed]
- Kondo, T.; Muta, H.; Ohishi, Y. Droplet impingement method to measure the surface tension of molten zirconium oxide. J. Nucl. Sci. Technol. 2020, 57, 889–897. [Google Scholar] [CrossRef]
- Sun, Y.; Muta, H.; Ohishi, Y. Novel method for surface tension measurement: The drop-bounce method. Microgravity Sci. Technol. 2021, 33, 32. [Google Scholar] [CrossRef]


| Chemical Name | Source | Initial Mass Fraction Purity |
|---|---|---|
| Tm2O3 | High Purity Chemical Lab. | 0.999 |
| Yb2O3 | High Purity Chemical Lab. | 0.9999 |
| Lu2O3 | High Purity Chemical Lab. | 0.999 |
| Chemical Name | Mass before Launch (mg) | Mass after Retrieval (mg) |
|---|---|---|
| Tm2O3 | 17.62 | 17.55 |
| Yb2O3 | 26.96 | 26.80 |
| Lu2O3 | 14.62 | 14.62 |
| Samples | Tm (K) | rm (kg·m−3) | dr/dT (kg·m−3·K−1) | b (10−5K−1) | Remarks |
|---|---|---|---|---|---|
| Tm2O3 | 2698 [12] | 8304 ± 148 | −0.18 ± 0.05 | 2.2 ± 0.6 | Present work |
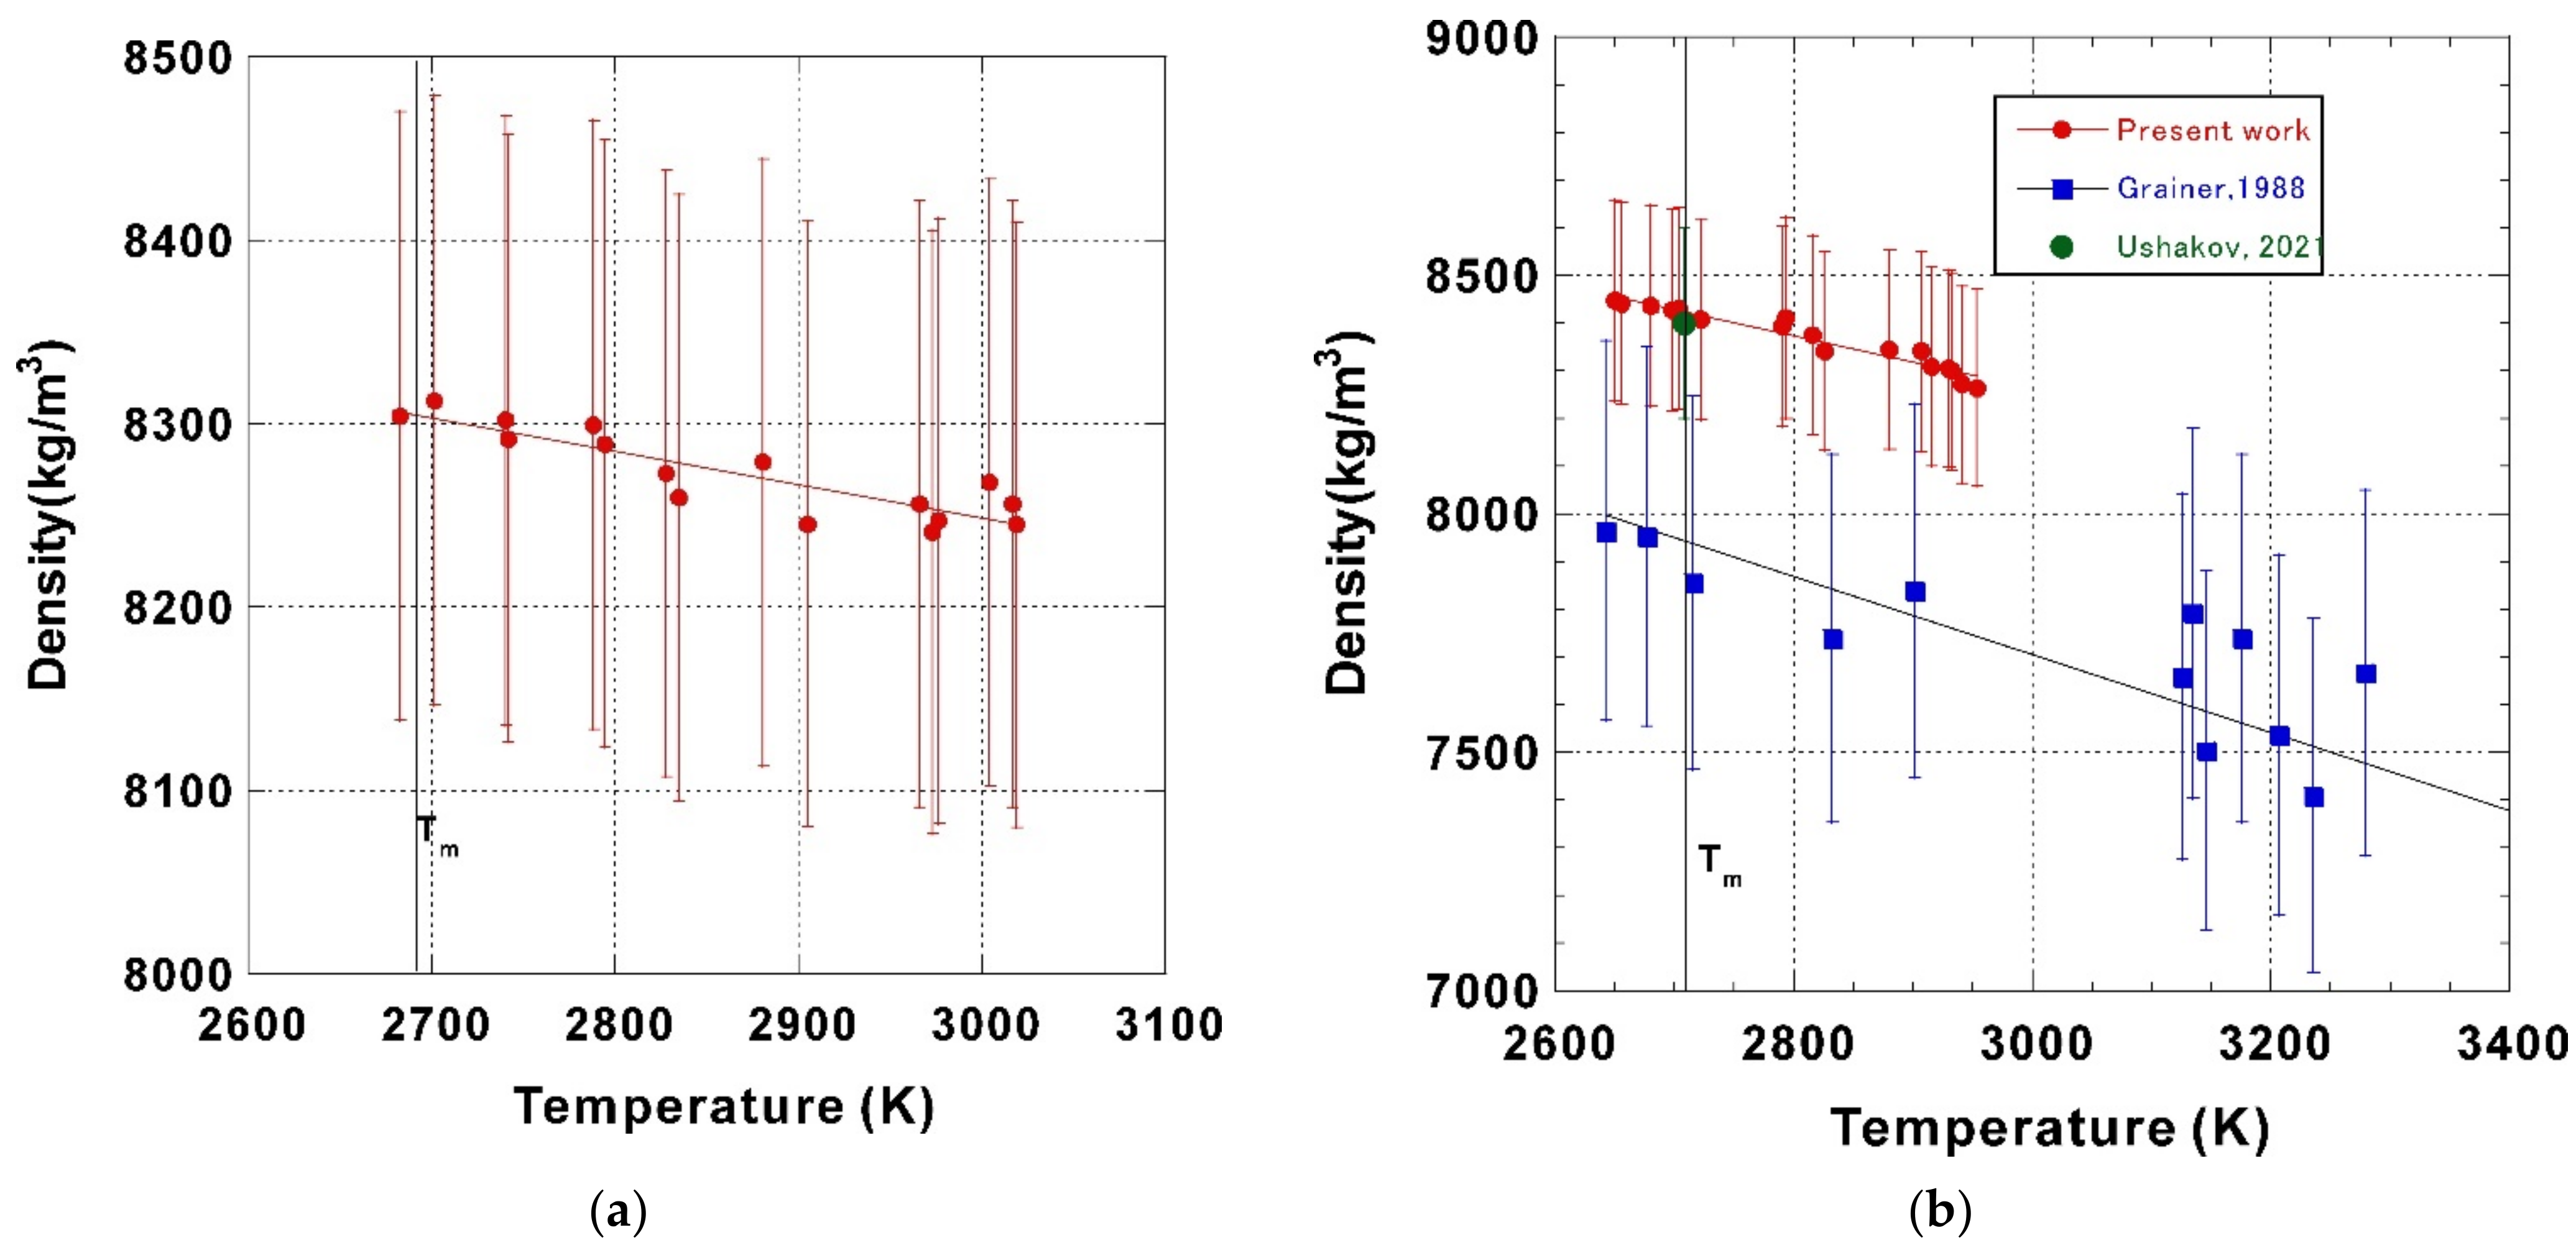
| Yb2O3 | 2708 [12] | 8425 ± 217 | −0.55 ± 0.08 | 6.5 ± 0.9 | Present work |
| 2708 | 7940 | −0.74 ± 0.13 | Granier et al. [3] | ||
| 2708 | 8400±200 | Ushakov et al. [2] | |||
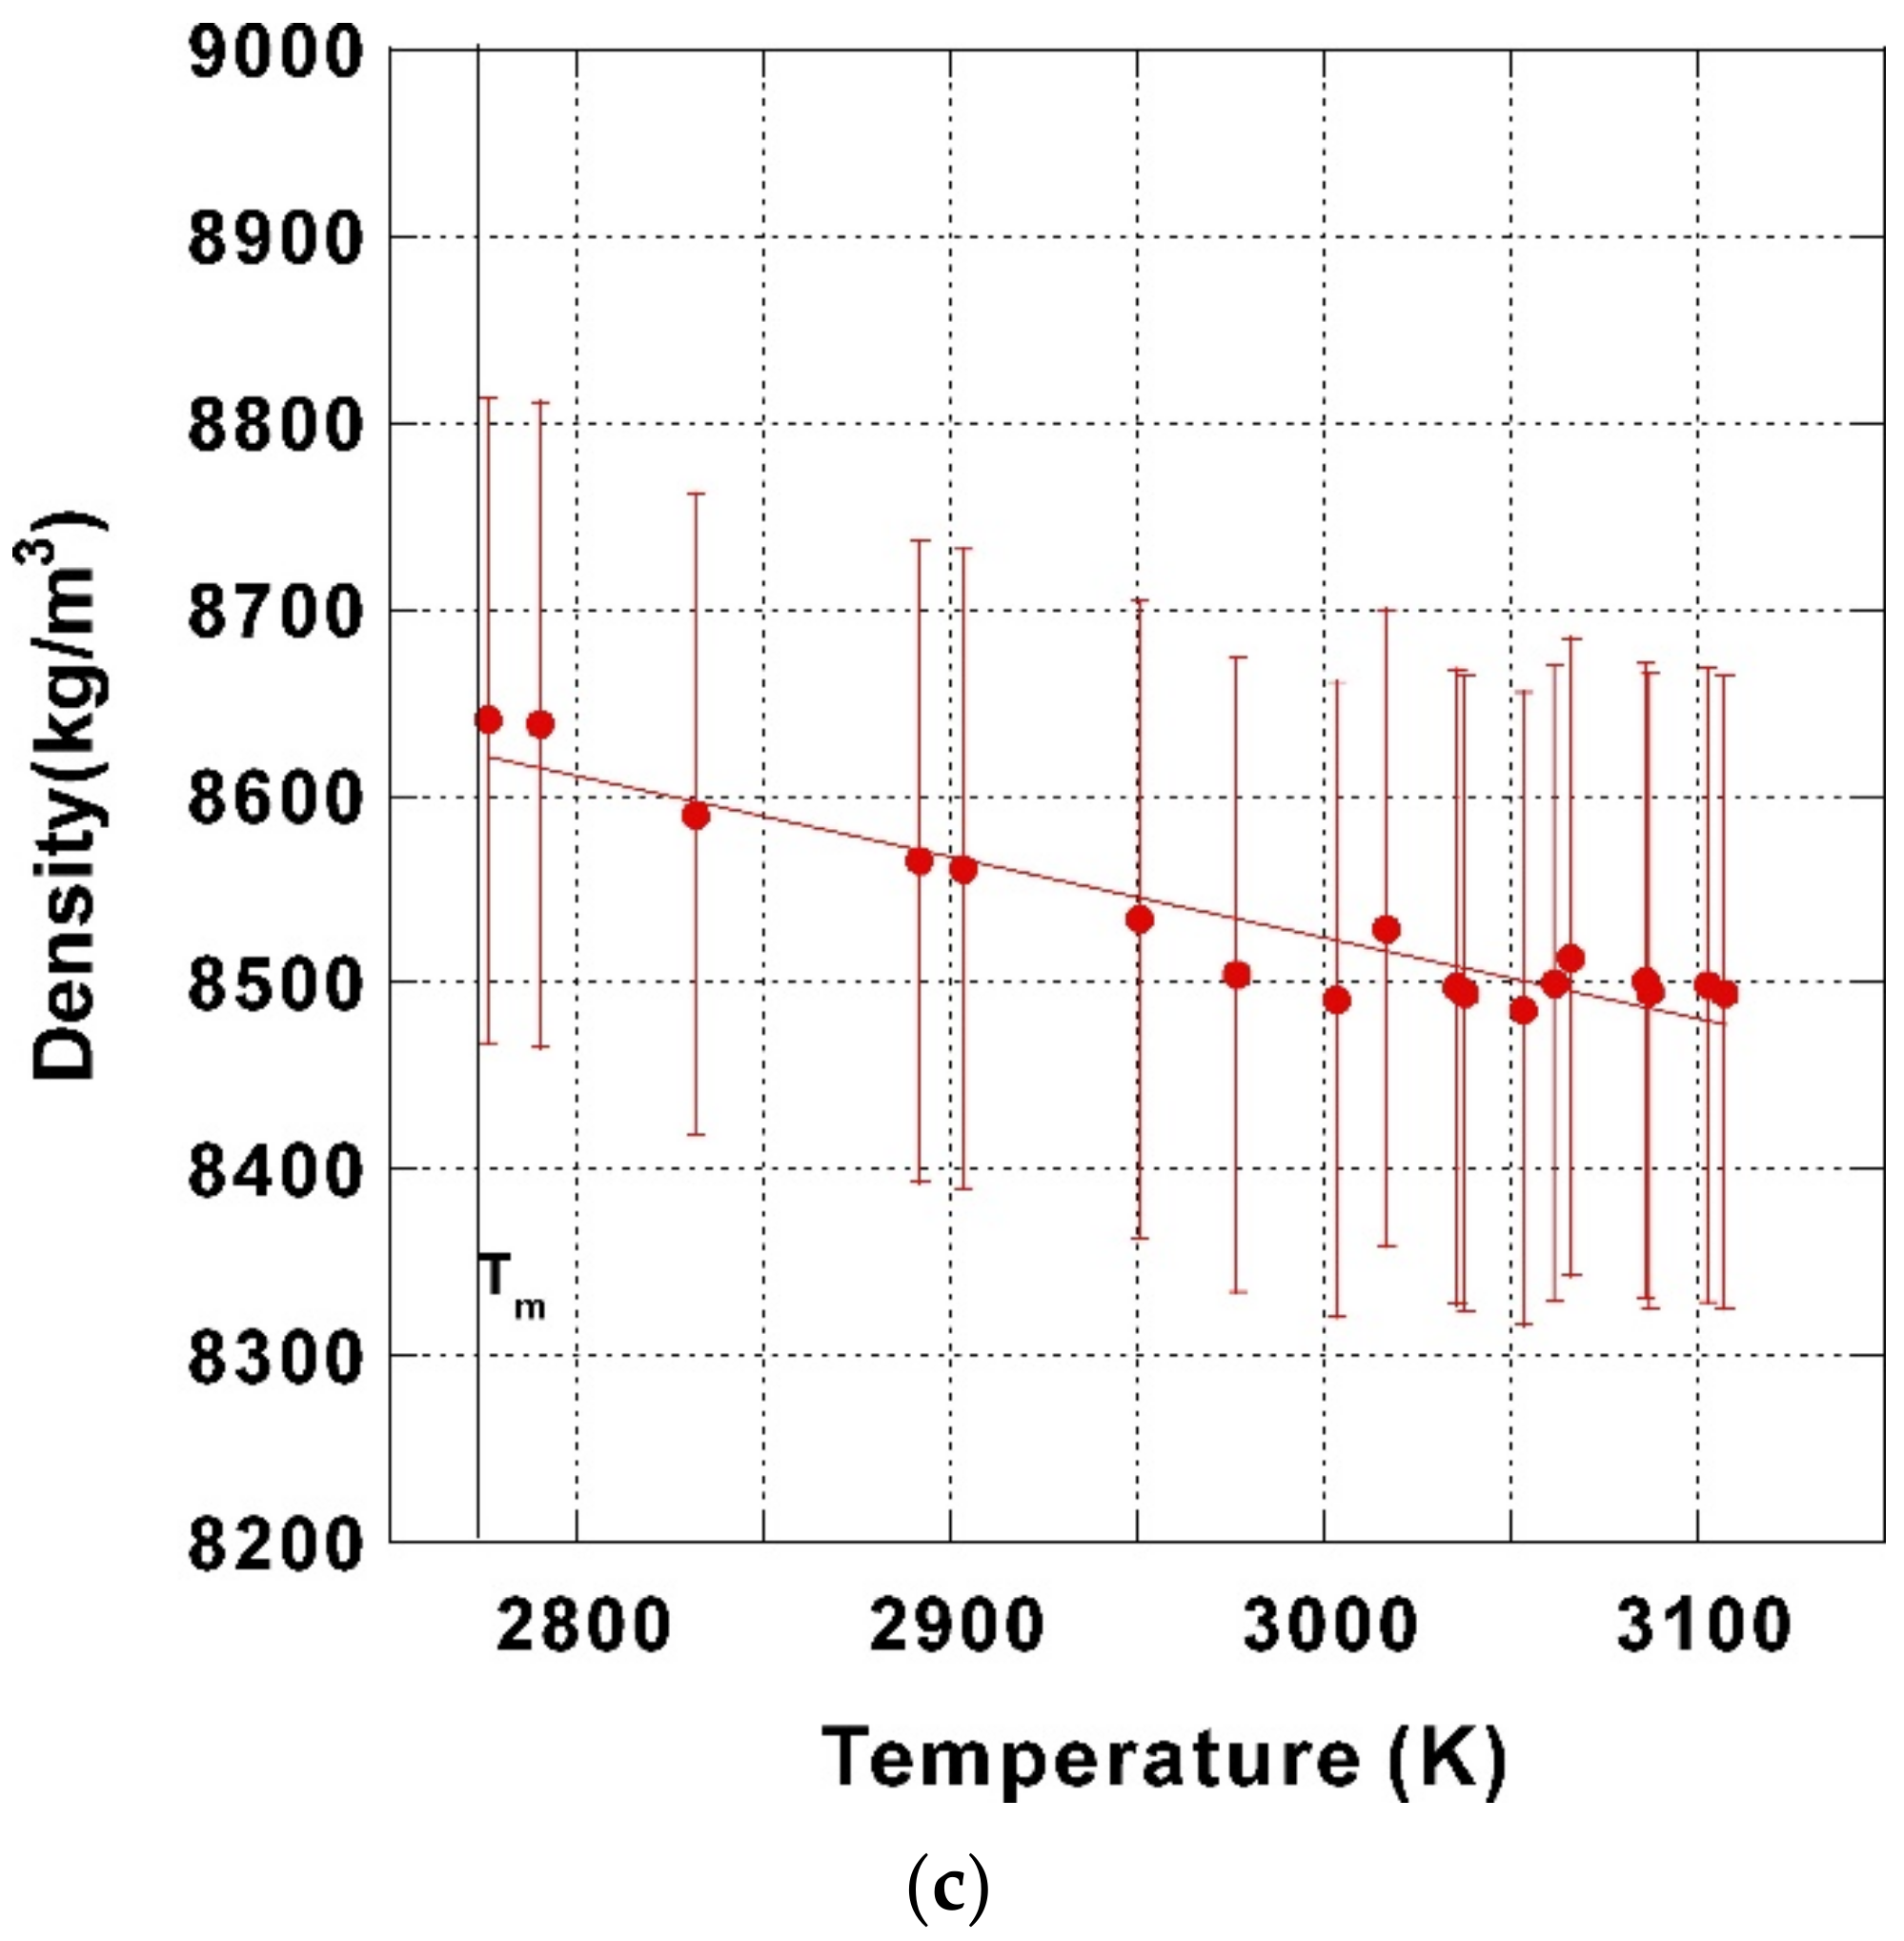
| Lu2O3 | 2763 [12,13] | 8627 ± 240 | −0.43 ± 0.08 | 5.0 ± 0.9 | Present work |
Publisher’s Note: MDPI stays neutral with regard to jurisdictional claims in published maps and institutional affiliations. |
© 2022 by the authors. Licensee MDPI, Basel, Switzerland. This article is an open access article distributed under the terms and conditions of the Creative Commons Attribution (CC BY) license (https://creativecommons.org/licenses/by/4.0/).
Share and Cite
Ishikawa, T.; Koyama, C.; Oda, H.; Shimonishi, R.; Ito, T.; Paradis, P.-F. Densities of Liquid Tm2O3, Yb2O3, and Lu2O3 Measured by an Electrostatic Levitation Furnace Onboard the International Space Station. Metals 2022, 12, 1126. https://doi.org/10.3390/met12071126
Ishikawa T, Koyama C, Oda H, Shimonishi R, Ito T, Paradis P-F. Densities of Liquid Tm2O3, Yb2O3, and Lu2O3 Measured by an Electrostatic Levitation Furnace Onboard the International Space Station. Metals. 2022; 12(7):1126. https://doi.org/10.3390/met12071126
Chicago/Turabian StyleIshikawa, Takehiko, Chihiro Koyama, Hirohisa Oda, Rina Shimonishi, Tsuyoshi Ito, and Paul-François Paradis. 2022. "Densities of Liquid Tm2O3, Yb2O3, and Lu2O3 Measured by an Electrostatic Levitation Furnace Onboard the International Space Station" Metals 12, no. 7: 1126. https://doi.org/10.3390/met12071126
APA StyleIshikawa, T., Koyama, C., Oda, H., Shimonishi, R., Ito, T., & Paradis, P.-F. (2022). Densities of Liquid Tm2O3, Yb2O3, and Lu2O3 Measured by an Electrostatic Levitation Furnace Onboard the International Space Station. Metals, 12(7), 1126. https://doi.org/10.3390/met12071126