Abstract
Laser direct energy deposition (L-DED) is one of the most promising additive manufacturing methods, which has been paid more and more attention in recent years. An improved heat and mass transfer model was developed here to analyze thermal behavior, driving force, surface tension-driven flow and its correlation with dilution during L-DED of Co-based powders to a 38MnVS substrate. Thermal behavior was firstly studied for its fundamental influence on fluid flow and mass transfer. Next, the roles of capillary force and thermal capillary force were characterized using both the dimensional analysis and simulation methods, and the mechanism of surface tension-driven flow was also qualitatively investigated. Finally, flow characteristics inside the melt pool were studied in detail and their correlation with the dilution phenomenon was analyzed based on the multi-component mass transfer model. The temperature gradient was found to be much larger at the front of the melt pool, and it took about 200 ms for the melt pool to reach a quasi-steady condition. Moreover, sharp changes in the curvature of the solid/liquid boundary were observed. Surface tension was demonstrated as the main driver for fluid flow and resulted in centrally outward Marangoni flow. Capillary force contributes to the reduction of the curvature of the free surface, and thermal capillary force (Marangoni force) dominated the Marangoni convection. Alloy elements from the powders, such as Co and Ni, were added to the front part of the melt pool and mainly diluted at the upper side of the rear region near the symmetric plane of the melt pool. Fundamental results in this work provide a valuable understanding of the surface tension-driven flow and its correlation with concentration dilution during the additive manufacturing process.
1. Introduction
Assisted by advanced auto-control technology, laser direct energy deposition (L-DED) was developed as a promising additive manufacturing method and is widely used to obtain a deposited metal layer on the surface of the base metal to improve its mechanical properties and service performance [1,2,3], such as the deposition of Co-based powders to 38MnVS. Compared with the traditional surface modification method, L-DED has the obvious advantages of higher efficiency, a smaller heat-affected zone, lower deformation and smaller residual stress [4,5,6]. The substrate and powders are heated and melted by high power density laser beam, and many complicated physical processes are included and coupled during the L-DED process, such as the interaction of substrate and liquid powders, phase change, heat and mass transfer inside the melt pool, solidification phenomenon and grain growth, which are all closely related to the fluid flow inside the melt pool [7,8,9,10,11,12,13]. Convection flow was demonstrated to be driven by multiple forces including capillary force, thermal capillary force, buoyance force and so on, and convection is proved to be the dominant driver for dilution by former studies [1,2,8,9,10]. However, the roles of different driving forces and mechanisms of surface tension-driven flow are still not clearly illustrated, which is important for an accurate understanding of flow characteristics. Moreover, correlations between dynamic flow and mass transfer inside the melt pool have not been revealed, which are non-negligible to investigated the formation of defects and the optimization strategies. To fill these gaps, a thermal–fluid–dilution model is developed to try to analyze the roles of the main driving force for convection, understand the mechanism of surface tension-driven flow and reveal the spatial and directional correlations between convection flow and dilution inside the melt pool.
Though some fundamental achievements had been made in the driving mechanism of fluid flow during welding and additive manufacturing process, studies of the driving force were mostly concentrated on the relative importance of different forces using the dimensional analysis method. Hu et al. [14] developed a 3D numerical model to research the driving force in laser spot welding of dissimilar metals, and thermal capillary force mainly caused by surface temperature gradient was recognized as the dominant driver for fluid flow. The driving force for laser spot welding of 304SS was investigated by He et al. [15] using a self-developed code, and they found that liquid flow was mainly driven by Marangoni convection and, to a much less extent, by the buoyancy force. A finite element model was established by Baharami et al. [16] to capture the evolution of the shear stress on the free surface during arc spot welding of steel and nickel, and they concluded that the surface-tension shear stress was mainly caused by the surface temperature gradient at a steady condition. Recently, surface tension and surface shear stress evolution were qualitatively analyzed by Li et al. [17] in the research of linear laser welding of 304SS, and the maximum surface shear stress may reach 2500 N/m2 in their conclusions. In summary, most studies on the driving force for melt pools are based on the analysis of non-dimensional numbers, such as the Grashof number and Marangoni number. The roles of main driving forces on melt pool behavior, such as capillary force and thermal capillary force, have not been recognized up until now. Moreover, the gas/liquid surface is mostly assumed to be flat in welding models, thus capillary force is not considered because the curvature is zero under the flat surface assumption. Driving force modeling based on flat assumption is obviously not as complex as that in a L-DED simulation, where the free surface is significantly deformed due to the addition of liquid powders and its topography evolves with time. As a result, the roles of different driving forces on melt pool convection, especially for the convection for L-DED in which melted powders addition and mixing of different liquid metals are involved, are still unknown and worthy of being further analyzed to reveal the corresponding mechanisms of heat transfer, fluid flow and concentration dilution. In this work, the quantitative description of the main driving force, the roles of the main driving forces on melt pool evolution and the mechanism of surface tension-driven flow are all presented based on the analyses of thermal behavior.
Resulting from the great difference in chemical composition, mechanical properties and thermal physical properties between the substrate and added powders, defects involving the formation of unknown brittle intermetallic, low melting point eutectics, hot cracking and failure, are still the main challenging problems for L-DED technology [1,3,10]. Based on former studies [1,5,10], the defects mentioned above are all closely related to the dilution phenomenon inside the melt pool, which is mainly driven by convection flow. Numerical simulation provides an effective way to study the dilution process for L-DED and then optimize processing parameters and select the appropriate powder composition to obtain the ideal deposited layer properties. Gan et al. [18] established a mass transfer model to study concentration dilution during laser-assisted additive manufacturing and found that convection is the dominant driver for mass transfer and diffusion is non-negligible at the initial stage. The mass transfer phenomenon during arc additive manufacturing was investigated by Hejripour et al. [19] using a 3D FEM model. Numerical and experimental results in their work showed that an increase in wire feed rate leads to homogenous composition in the fusion zone. The composition profile during double-track cladding of H13 to steel was numerically studied by He et al. [20], and both the preheating and previously deposited mass from the first track had effects on the composition of the second track in their conclusions. In spite of the wide study of dilution phenomenon, former research on the correlation between convection flow and the mixing phenomenon is mainly concentrated on dimensional analysis, driving mechanism and the effects of processing parameters, and there are not many details showing how the species are diluted and transported inside the welt pool. Though the dominant convection transfer mechanism is revealed by published works, the three-dimensional coupling and dilution characteristics inside the melt pool are seldom reported, which show different features at different positions and directly result in the expected/unexpected mixing phenomenon. These spatial and directional correlations between convection flow and concentration dilution are so important to deeply understand the transfer phenomenon and find the reasons why defects, such as hot cracking and unknown brittle phase, occur at a certain position of the solidified track. Thus, technologies for optimization and strategies for quality improvement could be proposed based on the obtained results. This point will be specially discussed in the following part of this study.
Summarily, an improved 3D heat and mass transfer model is developed here to study the roles of driving force, surface tension-driven flow and their correlation with concentration dilution. Novelties for this study could be summarized as follows. Contributions to the developed numerical model and analysis of the evolution of melt pool morphology considering mass addition are carried out. Then, a quantitative description of the main driving force is performed to understand the driving mechanism. Roles of capillary force and thermal capillary force on convection flow are next fundamentally analyzed to study the evolution of cladding track. Based on the basic understanding of driving force, the mechanism of surface tension-driven flow is qualitatively investigated. Finally, the spatial and directional correlation between fluid flow and solute dilution are studied to deeply understand the mass transfer phenomenon.
2. Experimental Details
Substrate used for experiments is made of 38MnVS medium carbon steel with the dimension of 20 mm × 10 mm × 6 mm, and Co-based powders are deposited on substrate under the irritation of laser source. The substrate 38MnVS is widely used in the manufacturing of engines, such as the parts of piston and gear, which are faced with the main challenge of thermal fatigue resistance. Contributed by the good performance of Co-based alloy under high-temperature, the deposition of Co-based powders to the surface of 38MnVS as-built part is a benefit for the improvement of its mechanical properties. Chemical compositions of the substrate and powders are all shown in Table 1. L-DED experiments are performed on a program-controlled five-axis laser manufacturing system equipped with Nd: YAG laser beam and two feeding pipes used to convert the powders into the melt pool. TRUMPF L1000.1 Nd: YAG Continuous Fiber Laser with a wavelength of 1064 nm is used. Pure argon is used as protection gas and the medium to transfer powders through feeding pipes. The deposited layer and substrate are sectioned by electric discharge cutting and then mounted, polished and etched in aqua regia solution to prepare metallurgical samples.

Table 1.
Chemical composition of the substrate and powders used in the simulation [18] (Reprinted with permission from ref. [18]. Copyright 2017 Elsevier).
3. Numerical Model
The mass addition and gas/liquid surface deformation are accurately captured by Arbitrary–Eulerian–Lagrangian method. The proposed 3D transient thermo-fluid-dilution model is solved by the finite element method. In brief, all the governing equations describing the heat and mass transfer process for L-DED are calculated by PRADISO solver. PARDISO is a high-performance robust and memory-efficient solver for solving large sparse symmetric and nonsymmetric linear systems of equations on shared-memory and distributed-memory architectures. Considering the calculation efficiency and accuracy, the developed model is discretized by two different mesh systems: the fluid domain with a max mesh size of 80 μm, where all the equations of heat transfer, fluid flow, ALE and multi-component dilution are all considered, and the solid domain with a max mesh size of 400 μm, where only the heat conduction equation is solved. Finally, the mesh grid consists of unstructured tetrahedral units. Additionally, a linear interpolation is adopted with the time step of 1μs. The backward Euler temporal scheme is used, and pre-implemented adaptive time-stepping is enabled to make the time step flexible when necessary.
Details of model geometry, mesh discretization, laser heat source, boundary conditions and experimental observations are all presented in Figure 1. To exclude the effect of mesh sensitivity on simulation results, mesh-independent tests were carried out before this study by varying the mesh size. Based on the in situ observation of powder flow shown in the insets of Figure 1, the powder flow, which will be melted by laser and jet into the melt pool, is assumed as a Gaussian distribution in the proposed model. The powder dynamic and its effect on melt pool kinetics will be further analyzed in a future study. The thermal physical properties of the substrate and powders are listed in Table 2. In the numerical model, the initial values for Cr and Co as powders are 20% and 75%, respectively, and the initial value for Fe as a substrate is 98%. In addition, for mathematical simplification, the simulation is performed based on some major assumptions: fluid flow is Newtonian, laminar, and incompressible; both the laser heat and distribution of powders are assumed to be a Gaussian distribution; the mushy zone where the temperature is between solidus and liquidus temperature is supposed to be a porous medium.
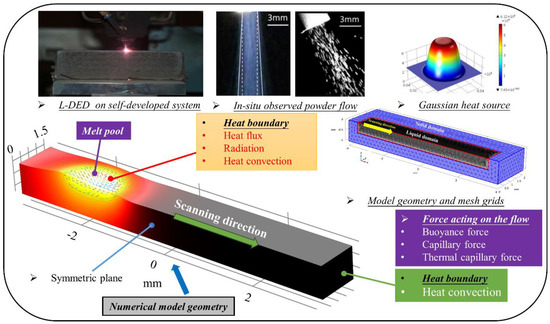
Figure 1.
Schematic diagram for the L−DED of Co−based powders to 38MnVS. Model geometry, mesh discretization, laser heat source, and experimental observation. Parameters: Laser power of 700 W, laser scanning speed of 10 mm/s, laser spot radius 1.0 mm, mass flow radius 2.5 mm, mass flow rate of 6.2 g/min, powder catchment efficiency of 0.9. In this study, an improved transient 3D model coupling the heat transfer, fluid flow and multi-component dilution is developed to study the melt pool evolution, roles of driving force, surface tension-driven flow and their correlation with concentration dilution inside the melt pool during L-DED of Co-based powders.
Table 2.
Thermal physical properties of substrate and powders used in the simulation.
3.1. Heat Transfer and Fluid Flow
Based on the above assumptions, the governing equations used to describe the heat transfer and fluid flow are expressed in Equations (1), (2) and (6).
Mass transfer equation:
Momentum transfer equation:
In Equation (3), the second term on the right hand represents the momentum dissipation in the mushy zone according to the Carmon–Kozeny equation [22,23].
In relations, is a number related to mushy zone morphology and set as . M is a small positive number used to avoid the division by zero and set as 10−4, and denotes the liquid mass fraction and is defined as:
Energy transfer equation:
The source term in Equation (6) is expressed as follows:
In Equation (7), is used to characterize the latent heat caused by phase change.
3.2. Multi-Component Mass Transfer
To investigate the correlation between surface tension-driven flow and species dilution, the distribution of four main elements (e.g., Fe, Co, Cr, and C) is calculated based on the following governing equation:
In Equation (8), represents the concentration of Fe, C, Co and Cr clement, respectively. in denotes the number of alloys included in the multi-component system, and is set as four for the Fe–C–Co–Cr system in this study. denotes the mass fraction of one certain alloy element in the dilution equation, which could be the concentration of Fe, Cr, Co or Cr element. In detail, is not the sum of these four elements, and each alloy element is separately considered in the proposed model. The first term on the right hand denotes the mixture-averaged approach used to characterize the multi-component diffusion, which represents the effect of interaction between different elements on the mass transfer. Moreover, the last two terms of Equation (8) account for the species flux due to relative phase diffusion and motion, respectively.
The expressions of the multi-component diffusion coefficient and mean molar mass are defined as follows:
Binary diffusion coefficients used to calculate are listed in Table 3.
Table 3.
Binary diffusion coefficients used for the calculation of multi-component diffusion coefficients [24].
3.3. Boundary Conditions
3.3.1. Boundary Condition for Energy Equation
At the liquid/gas surface, i.e., the top surface of the melt pool (see Figure 1), the boundary condition of the energy equation is expressed as:
The first term on the right hand denotes the laser heat input, and the second term and third term represent heat loss caused by heat convection and radiation, respectively.
The position of the top surface is labeled in Figure 1. For the energy boundary condition at other surfaces, such as the bottom and side surfaces of the substrates, only the second term at the right hand of Equation (11) is included because there is no heat input from the high-energy-density laser beam on these surfaces and the radiation is not significant.
3.3.2. Boundary Condition for Momentum Equation and Dilution Equation
The momentum boundary condition at the free surface is described as:
where the term denotes the capillary force, acting in the normal direction of the liquid/gas surface, and represents the thermal capillary force (Marangoni force) induced by the spatial variation of the temperature gradient, which exerts a tangential driving force along the free surface.
In this model, the moving mesh based on the arbitrary Lagrangian–Eulerian (ALE) method is used to capture the free surface evolution. The velocity for the moving mesh is set up as:
where the first term on the right hand represents the deformation induced by material flow and the second term is the mesh deformation caused by mass addition. The expression of could be written as:
In Equation (14), is the unit vector along the positive z-direction.
The position of the top surface is labeled in Figure 1. For the momentum boundary condition at other surfaces, such as the bottom and side surfaces of the substrates, the no-slip condition is used, and its mathematical expression could be given by: u = 0.
3.4. Material Properties and Laser Absorption
The melt pool for L-DED is actually the mixture of melted powders and melted substrates, and it is necessary to reasonably describe the properties using numerical strategies, which will affect the modeling efficiency. The dilution rate method (DRM) in which the temporal and spatial dilution characteristics are considered is demonstrated as an efficient approach.
Based on the DRM, as a mixture of melted powders and substrate, the thermal physical properties of the melt pool are assumed to linearly depend on the properties of powders and substrate.
In Equation (15), represents the properties of the melt pool, which could be represented by density, specific heat, dynamic viscosity and so on. and denote the properties of the substrate and Co-based powders, respectively. The mixture fraction, , is defined as the mass fraction of the substrate element Fe inside the melt pool [3]. The theoretical range interval for α is from 0 to 1 from powders to substrate. The value for α is determined by the dilution phenomenon. The parameters used for the simulation are shown in Table 4.
Table 4.
Parameters used for simulation [6,18].
The laser absorption efficiency is so important for the simulation accuracy and taken as the function of electrical resistivity of the substrate according to the Hagen–Rubens law [18], which could be expressed as:
In Equation (16), is the electrical resistivity and assumed to vary with temperature.
4. Results and Discussion
4.1. Thermal Behavior
The melt pool profile, temperature and velocity distribution and temperature isotherms when the melt pool reaches a quasi-steady condition are all illustrated in Figure 2. It is observed that the melt pool is shallow due to the outward convection resulting from the negative temperature coefficient of surface tension [14], and its depth at the back is obviously larger than that at the front, indicating that melt pool development is more sufficient at the back. The Peclet number, representing the relative importance of convective and conductive heat transfer [18], is calculated to be over 70 and thus heat transfer is dominated by convection. Temperature isothermals are observed as highly concentrated at the front of the melt pool and less condensed at the back, which means that the temperature gradient is smaller on the rear side. There are two underlying reasons resulting in this difference. One is that temperature distribution is more uniform at the solidified part which the moving laser has just swept, compared with that at the front part where the material is still melting. Moreover, as shown in Figure 2, convection flow is more intense on the rear side, indicating that here, the convective heat transfer is more significant. Thermal behavior is expected to have a great effect on driving force (capillary force, thermal capillary force and so on), and then significantly affect the heat and mass transfer process, which will be discussed next.
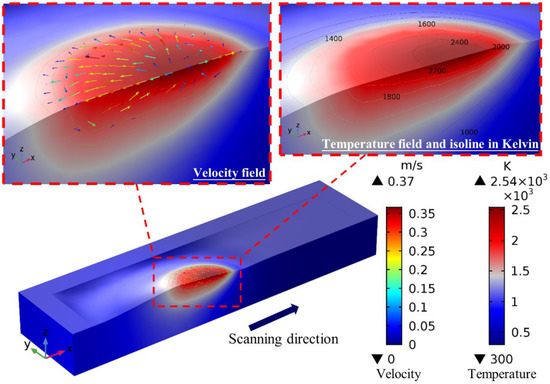
Figure 2.
Temperature field and velocity distribution in L-DED of Co-based powders to 38MnVS.
The melt pool profile, temperature and velocity distribution at 10 ms, 50 ms, 100 ms and 200 ms are presented in Figure 3A–D, respectively. Resulting from some key reasons, such as the latent heat of the materials, the interaction between the liquid powders and the substrate and the movement of the laser heat source and powders, there is an evolution from the initial stage to the quasi-steady state. The peak temperature quickly reaches a high value and almost keeps at a constant, while max velocity varies with time and finally nearly remains unchanged until the end of the deposition. The variation of max velocity means the unstable interaction between the melted powders and the substrate at the initial stage, indicating that the deposition track here is prone to defects such as pores, cracks and a brittle metallurgical phase due to the nonuniform dilution of alloy elements (e.g., Co and Cr elements) [1,3,10]. In addition, the effect of scanning speed on the melt pool dimension is also illustrated in Figure 3. At the beginning, the melt pool dimension sees a symmetric distribution in the x- and y-direction because the movement of the laser heat source could be neglected within a few milliseconds (see Figure 3A) and both the laser power density and the distribution of the Co-based powders are symmetrical (Gaussian distribution). As the deposition develops, the dimension in the x-direction grows faster than that in the y-direction due to the movement of the heat source (see Figure 3D). Additionally, sharp changes in fusion boundary, marked by a yellow dashed circle in Figure 3D, are also observed due to the competition of convection flow boundary layers and heat conduction boundary layers. To give a better understanding, the enlarged views of circle 1 and circle 2 are also plotted in Figure 3D, respectively. The inflections of the fusion line could be found in the enlarged yellow circles. This competition mechanism could also be explained by Prandtl number [9], which represents the relative thickness of momentum and thermal boundary layers and could be expressed as:
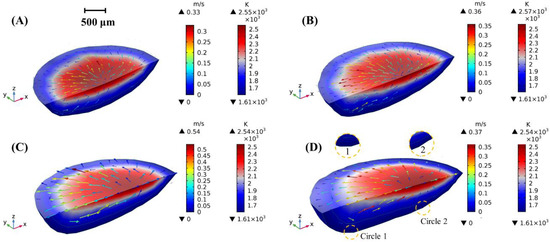
Figure 3.
Temperature and velocity distribution at different times: (A) 10 ms; (B) 50 ms; (C) 100 ms; (D) 200 ms.
If the is much larger than 1, the fusion boundary is dominated by the momentum boundary, while it is mainly affected by the thermal boundary when is much smaller than 1. Especially, when is comparable to 1, fierce competition appears and finally results in the inflections at the fusion boundary (see the yellow circle in Figure 3D).
Based on the thermal physical properties listed in Table 1, the Prandtl number in this simulation is computed to be in the order of . Consequently, the intense competition of these two boundary layers could be predicted inside the melt pool. As a result, there are sharp changes in the curvatures of the solid/liquid boundary (see Figure 3D).
A comparison of the observed and simulated melt pools is performed for validation. In detail, the melt pool morphology and dimensions obtained from the L-DED experiments are calibrated with the results from numerical modeling. As shown in Figure 4, the change of the gas/liquid surface (the top surface) in Figure 4A is mainly resulted from the addition of the melted powders, and the simulated surface, depicted in Figure 4B by the ALE method, is reasonably consistent with the observed result. In addition, the simulated fusion line of the melt pool denoted by the isoline of liquidus temperature in Figure 4B also agrees well with the OM observation in Figure 4A. The melt pool dimensions, including melt width, melt height and melt depth, are also reasonably simulated with good correspondence.
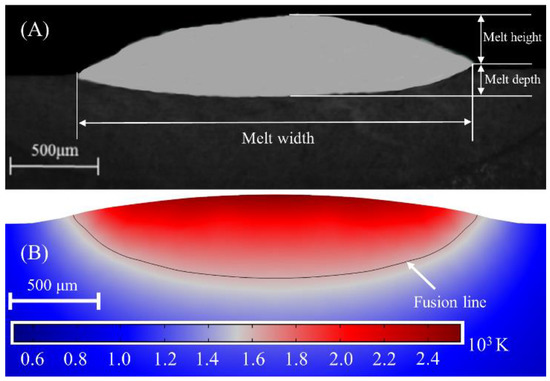
Figure 4.
Cross-section of deposited track. (A) Experimental result [18]; (B) Calculated result. Reprinted with permission from ref. [18]. Copyright 2017 Elsevier.
4.2. Surface Tension-Driven Flow
Several non-dimensional (ND) numbers are used to understand the effects of the processing parameters and material properties on driving force, including the Grashof number and the Capillary number, which are closely associated with heat and mass transfer. In summary, the significance, mathematical expression and adopted value for these ND numbers are all listed in Table 5.
Table 5.
ND numbers used to study the driving force in L-DED [17,25].
In L-DED of Co-based powders, buoyance force and surface tension are considered the two major driving forces for convection and dilution. Expressions of these two ND numbers are also given in Table 5, where is the difference between the peak temperature and solidus temperature, and is the characteristic length for buoyance and taken as one eight of the width of the melt pool. To obtain the dominant driver, the relative importance of surface tension to buoyance could be expressed as:
Based on the expressions in Table 5, the Ma and Gr numbers in the steady melt pool are calculated to be in the order of 10−1 and 103, respectively, indicating that the buoyancy effect is comparable to viscosity force in the flow of liquid metal, but contributes little compared with surface tension. Thus, the ratio of Ma to Gr, , is on the order of 104. Hence, it could be concluded that the fluid flow is mainly driven by surface tension, which is characterized by capillary force and thermal capillary force.
On the other hand, other ND numbers listed in Table 5 also provide effectiveness for understanding surface tension-driven fluid flow. The details of these commonly used ND numbers are all given, but not discussed in this section.
Next, decoupled analyses of capillary force and thermal capillary force are carried out to separately discuss their roles on melt pool evolution. It should be noted that capillary force and thermal capillary force are coupled at every iterative calculation. The so-called decoupled analysis means that thermal capillary force is not considered in the plotting of capillary force, but they are both included in the calculation. Similarly, the decoupling for thermal capillary force means that capillary force is not obtained in the plotting of its evolution during L-DED.
The distribution of capillary force at different times on the gas/liquid surface, which acts normal for a curve-free surface, is plotted in Figure 5 to illustrate its evolution from the initial stage to the quasi-steady stage. The contour denotes the value of capillary force calculated from the expression of (see Equation (12)). The direction and the color of the arrows represent the direction of the velocity field and the magnitude of surface tension, respectively. The driving force acting on the free surface consists of capillary force and thermal capillary force, which are also the boundary condition for the momentum equation. As plotted from Figure 5A–D, the capillary force increases from the center to the periphery and its value changes little in the evolution.
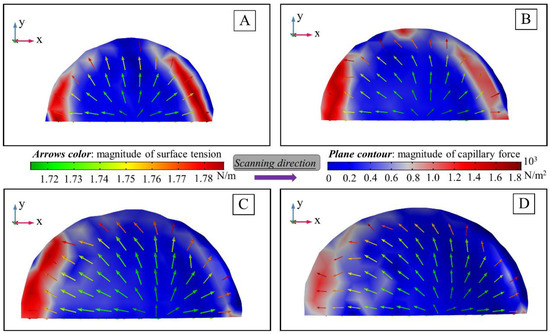
Figure 5.
Capillary force distribution at top surface of the melt pool at different times: (A) 10 ms; (B) 50 ms; (C) 100 ms; (D) 200 ms.
Based on the expression of capillary force,, denotes the surface tension of the mixture and changes little, thus the capillary force is mainly determined by curvature . Here, capillary force is different from surface tension. Surface tension for liquid pure nickel is a vector, but only the value for is used in the expression of .
Capillary force could also be expressed as , in which represents the average curvature of the free surface [26,27]. As L-DED goes on, the peak capillary force continually decreases and changes from 1840 N/m2 to 1200 N/m2, indicating that both the max curvature and average curvature decrease with evolution. As a result, the surface asperities with large curvature of the solidified deposition track are expected to be significantly eliminated and surface topography is refined by capillary force, which is a benefit for the improvement of the surface quality of the deposition track. In addition, the area with high capillary force appears at both the front and rear periphery at the initial stage, but only at the back when the melt pool is quasi-steady, which means that the larger curvature at the front was obviously eliminated by capillary force. As illustrated in Figure 5A–D, the distribution of capillary force also tends to be uniform, indicating that the surface asperities of the deposition track are significantly improved with melt pool evolution. As a result, the surface quality obtained under steady conditions will be better than that at the initial stage.
The thermal capillary force that drives the Marangoni convection, which is also known as the Marangoni force, is determined by the temperature derivative term [16], and its distribution on the free surface at different times is shown in Figure 6. The magnitude of the thermal capillary force is depicted by color contour, and the color map and direction of the arrows represent the magnitude and direction of the velocity field, respectively. As illustrated, a strong outward fluid flow is developed as a result of increased distribution of the Marangoni force from the center to the periphery, which pulls the fluid towards the periphery. Additionally, the velocity magnitude increases from the center to the periphery, which is also consistent with the distribution of the Marangoni force. With deposition processing, the maximum Marangoni force continually decreases and becomes almost constant under quasi-steady conditions. The high-stress area at the periphery quickly decreases with time, especially in the back area. This phenomenon could be mainly explained by the smaller temperature gradient () at the rear side, which is analyzed in the discussion in Figure 2. The maximum capillary force and thermal capillary force are about 1200 N/m2 and 350 N/m2, respectively, representing that the magnitude of the capillary force is comparable to the thermal capillary force. In addition, it should be noted that both the fluid flow and mass transfer are driven by the coupled capillary force and thermal capillary force, and decoupled analysis is carried out here only to qualitatively illustrate the roles of these two terms on heat and mass transfer.
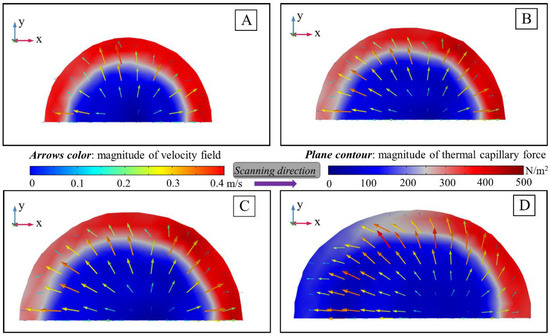
Figure 6.
Thermal capillary force distribution at top surface of the melt pool at different times: (A)10 ms; (B) 50 ms; (C) 100 ms; (D) 200 ms.
Based on the study of thermal behavior and analysis of driving force, the mechanism of surface tension-driven flow (Marangoni flow) is then investigated. The contour of the temperature field is depicted in Figure 7A and the temperature decreases from the center to the periphery of the melt pool. Consequently, as shown in Figure 7B, surface tension increases from the central area to the periphery due to the negative temperature coefficient of surface tension [14] and results in a central to outwards fluid flow. The distribution of surface tension is consistent with the result illustrated by the color arrows shown in Figure 5. Moreover, corresponding to the larger spatial temperature gradient in the front section, illustrated by the more concentrated temperature isotherms in Figure 2, the variation of surface tension is also more significant at the front. Next, the 3D velocity field is presented in Figure 7C to give a comprehensive understanding. The magnitude and direction of the velocity field are represented by the color contour and green arrows, respectively. Liquid metal flows from the center towards the periphery and its magnitude also increases from the center towards the solid/liquid boundary, which is consistent with the above discussion of the driving force.
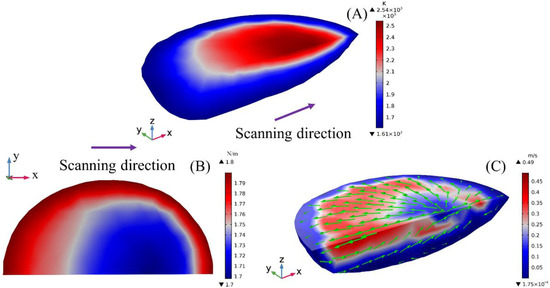
Figure 7.
Schematic illustration of the mechanism of surface tension−driven flow. (A) Temperature field; (B) Surface tension distribution; (C) Velocity field.
4.3. Convection Flow and Its Correlation with Mass Transfer
To accurately comprehend the relationship between convection and dilution, fluid flow and alloy elements distribution on different planes are studied. The initial position of the center of the laser heat source is x = −2.5 mm and now it is just located at x = 0.2 mm. The velocity distribution at the yz-planes is firstly investigated to provide more details about the convection inside the melt pool. As shown in Figure 8A, the magnitude and direction of the velocity field are represented by the color contour and the direction of arrows. The green and red planes denote the iso-surface of solidus temperature and liquidus temperature, respectively. Velocity distribution is swirling due to the Marangoni effect. Plane 1 is located at x = −1.0 mm, plane 2 and plane 3 are located at x = −0.4 mm and x = 0.2 mm, respectively. Velocity distribution on these three planes is plotted in detail in Figure 8B–D, and streamline lines are also introduced to characterize the velocity evolution. Based on the assumption of incompressible and laminar flow, the density of the streamlines could be used to characterize velocity magnitude. Where streamlines are dense, velocity is high; on the contrary, where they are spaced out, velocity is small. Streamlines are obviously more concentrated at the rear side, indicating more intense convection. There is also a separate vortex motion at each plane, but its distance to the symmetrical xz-plane increases and the convection becomes weaker from plane 1 to plane 2 to plane 3. Corresponding to the real physical process, the rear section (plane 1) has fully developed and its area is much larger compared with plane 2 and plane 3 in the front region. Additionally, concentration dilution was demonstrated to be mainly driven by convection flow [18]. Therefore, resulting from an intense Marangoni convection, alloy elements (e.g., Co, Cr) mainly added into the center of the melt pool from melted powders are transported to other parts from the central area, and the Fe element is also transferred from the substrate and mixed with other elements inside the melt pool. However, at plane 3, both the melt pool and convection flow have not fully developed, indicating that mixing is mainly performed at the back. In conclusion, species from powders (e.g., Co and Ni) are added at the front but mainly diluted at the back area, and the mixing of Fe from the substrate is similar.
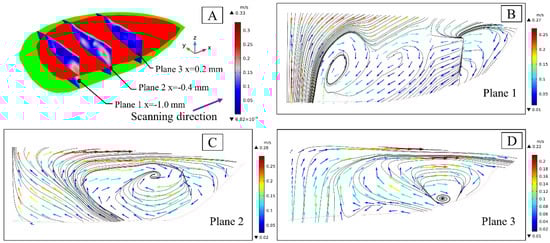
Figure 8.
Melt pool profile, cross-section coordinates and velocity distribution on yz-plane. (A) Melt pool configuration and position of three yz-sections; (B) Velocity distribution at plane 1; (C) Velocity distribution at plane 2; (D) Velocity distribution at plane 3.
Velocity evolution at the xy-planes inside the melt pool is plotted in Figure 9. To clearly illustrate the velocity field, the position of plane 5 is moved along the positive z-direction in Figure 9A. As shown in Figure 9B,C, the streamlines are more concentrated and fluid flow is much more intense at plane 5 than that at plane 4 because surface tension mainly acts on a gas/liquid surface. Vortex motion is also observed at plane 5 and the streamlines are obviously dense near the symmetric plane, indicating flow is more intense in this area, which is also validated by the contour of the arrows representing the magnitude of the velocity field. No vertical motion is found at plane 4, but a similar tendency of velocity distribution could also be observed near the symmetric plane. As a result, it could be concluded that species dilution is mainly carried out on the upper side. Moreover, a portion of the flow at the xy-plane is along the positive x-direction and this branch flow is relatively stronger, thus alloy elements are expected to be concentrated near the central part and then diluted in different directions.
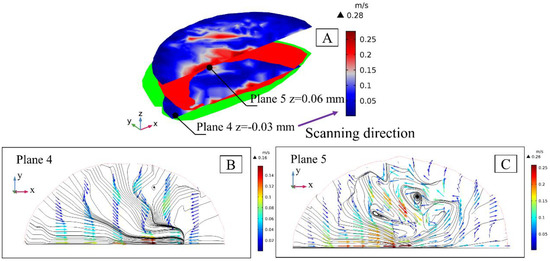
Figure 9.
Melt pool profile, cross−section coordinates and velocity distribution on xy-plane. (A) Melt pool configuration and position of two xy-sections; (B) Velocity distribution at plane 4; (C) Velocity distribution at plane 5.
The velocity field at the xz-plane, described in Figure 10A, is plotted in Figure 10B–D in detail, respectively. The liquid fraction of the central xz-plane is illustrated by the color contour in Figure 10B, and the solid and liquid phases are represented by 0 and 1, respectively. There are two almost separate vertical motions at the back and frontal sections of the melt pool, which are the two parts of the three-dimensional circular vortex. Circulation at the back is stronger because the melt pool is well-expanded at the back. Away from the symmetric plane, the convection at plane 7 and plane 8 is generally weaker compared with that at plane 6. As a result, element distribution in the central area of the melt pool is expected to be more uniform, which would next be validated by the investigation of mass transfer. In addition, the backward convection is observed from plane 6 to plane 8. Alloy elements from the melted powders are mainly added into the melt pool at the front and then transported to the rear side by backward fluid flow.
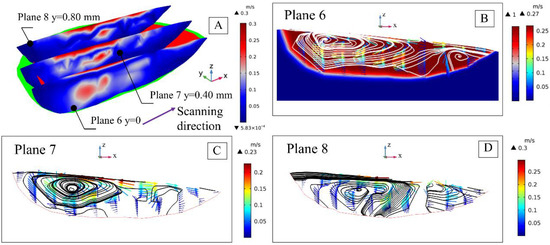
Figure 10.
Liquid fraction contour along with velocity distribution at xz-plane. (A) Melt pool configuration and position of three xz-sections; (B) Velocity distribution and liquid phase fraction at plane 6; (C) Velocity distribution at plane 7; (D) Velocity distribution at plane 8.
In conclusion, based on the overall consideration of flow characteristics shown in Figure 8, Figure 9 and Figure 10, the alloy elements from the powders, such as Co and Ni, are added to the front part of the melt pool and transported to the rear side by backward branch flow, and then mainly diluted with the melted material from the substrate at the back area and the upper part of the melt pool. Additionally, it should be noted that both the convection and dilution happen in three dimensions and should be investigated considering the characteristics in different sections to obtain a more accurate understanding of the correlation between convection and dilution.
Contributed by the high efficiency of the multi-component mass transfer model, the dilution results of these three main alloy elements, presented in Figure 11, are obtained just one time. The distribution of the Co element at the yz-plane is plotted in Figure 11A, and the Cr distribution at the xy-plane and the Fe distribution at the xz-plane are illustrated in Figure 11B,C, respectively. The coordinates of these planes (plane 1 to plane 8) are the same as the those plotted above. As shown in Figure 11A, from plane 3 to plane 2 to plane 1, convective mass transfer is more obvious resulted from the more intense convection at the rear side (see Figure 7). As a result, the Co element is nearly uniformly mixed at plane 1 and presents nonuniform distribution at plane 3, indicating that the dilution is mainly carried out at the back. From plane 4 to plane 5, the Cr distribution also becomes more uniform as a result of surface tension-driven flow, which is more intense in the upper area, and it is thus validated that species are mainly mixed in the upper side. As illustrated in Figure 11C, the Fe concentration is also more uniform at the back, which is consistent with the discussion above. Additionally, the distribution of Fe at plane 6 is obviously more uniform than that at plane 7 and plane 8, which means that mixing is mainly performed near the symmetric plane (plane 6).
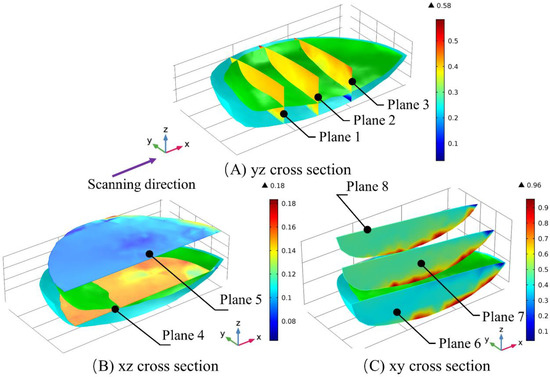
Figure 11.
Alloy element distribution in different sections. (A) Co distribution at yz-plane; (B) Cr distribution at xy-plane; (C) Fe distribution at xz-plane.
Furthermore, it should be noted that there is a small region where alloy elements are not uniformly mixed near the fusion boundary, which is the so-called unmixed zone (UMZ) and can be observed in Figure 11A–C. The formation of the UMZ is still the main challenging problem in additive manufacturing and a fundamental study of the UMZ is necessary to be performed as its formation largely lowers mechanical properties and makes the alloy susceptible to cracks and failures [10,18]. This work has basically revealed the mechanism of surface tension-driven flow and its correlation with concentration dilution. In the future, an improved model could be developed based on the present work by analyzing the fluid flow in the UMZ, which is frictionally dissipated in the presence of a solidified microstructure. Moreover, the transition of the temperature coefficient of surface tension [14] and a larger heat input [28] are both reported to be a benefit for uniform mixing and should be considered as strategies that may contribute to the restriction of the UMZ in future studies.
5. Conclusions
Based on the improved 3D fluid flow and multi-component mass transfer model, thermal behavior, driving force, surface tension-driven flow and its correlation with concentration dilution inside the melt pool are fundamentally studied. Some fundamental findings could be concluded as follows:
- (1)
- is over 70 inside the melt pool, indicating that heat transfer is dominated by convection. Resulting from the quick solidification at the rear side and more intense fluid flow at the front part, the temperature gradient is much larger in the front of the melt pool.
- (2)
- It takes about 200 ms for the melt pool to reach a quasi-steady condition. The Prandtl number is in the order of 1~10, and sharp changes in the curvature of the solid/liquid boundary of the melt pool are observed due to intense competition between the momentum flow boundary layers and the heat conduction boundary layers.
- (3)
- Based on dimensional analysis, surface tension, which is characterized by capillary force and thermal capillary force, is demonstrated as the dominant driving force. Capillary force contributes to the reduction of the curvature of the free surface, and Marangoni convection is dominated by thermal capillary force (Marangoni force).
- (4)
- Surface tension acting at the free surface decreases from the center to the periphery, resulting in a central to outwards Marangoni fluid flow. Max capillary force reaches the level of 1200 N/m2 and appears at the rear part of the melt pool. The peak value of thermal capillary force is in the order of 350 N/m2 and increases from the center to the boundary.
- (5)
- Alloy elements from the powders, such as Co and Ni, are mainly added to the front part of the melt pool and transported to the rear part by backward branch flow. Dilution is mainly carried out in the upper side of the rear part of the melt pool near the symmetric plane.
Author Contributions
Conceptualization, Z.L. and G.Y.; methodology, Z.L. and S.L.; software, Z.L.; validation, Z.L., X.H. and Z.S.; formal analysis, Z.L.; investigation, Z.L. and X.H; resources, X.H.; data curation, S.L.; writing—original draft preparation, Z.L.; writing—review and editing, X.H. and S.L.; visualization, S.L.; supervision, G.Y.; project administration, X.H.; funding acquisition, G.Y. All authors have read and agreed to the published version of the manuscript.
Funding
The authors are grateful for the financial support from the Beijing Municipal Commission of Science and Technology (Z181100003818015) and the financial help from the National Natural Science Foundation of China (No.11672304).
Acknowledgments
Zhiyong Li also thanks the Chinese Scholarship Council (CSC) for the financial help, and the insightful discussions with Jiaying Gao, Mechanical Department, Northwestern University.
Conflicts of Interest
The authors declare that there is no conflict of interest.
Nomenclature
| Nomenclature | Reference temperature (300 K) |
| Density of the material | Heat transfer coefficient |
| Time variable | Force acting on the free surface |
| Velocity vector | Normal unit vector of free surface |
| Pressure parameter | Curvature of the free surface |
| Mushy zone morphology | Temperature gradient |
| Liquid fraction | Normal velocity for moving mesh |
| Solidus temperature | Mesh velocity caused by mass addition |
| Liquidus temperature | Mass flow rate |
| Specific heat | Powder catchment efficiency |
| Temperature inside the melt pool | Density of the powder |
| Thermal conductivity | Mass flow radius |
| Latent heat content | Scanning speed |
| Small parameter | Greek symbols |
| Weight fraction ofspecies | Dynamic viscosity |
| Multi-component diffusion coefficient | Mole fraction of the th species |
| Molar mass | Laser absorptivity |
| Solid fraction | The surface emissivity |
| Concentration in liquid phase | Stefan–Boltzmann constant |
| Mass fraction | Surface tension of liquid pure metal |
| Maxell–Stefan diffusivities | Temperature coefficient of surface tension |
| Molar mass of certain fraction | Mixture fraction |
| Laser power | Angular frequency of the laser |
| Distance to the center of the laser source |
References
- DebRoy, T.; Wei, H.L.; Zuback, J.S.; Mukherjee, T.; Elmer, J.W.; Milewski, J.O.; Beese, A.M.; Wilson-Heid, A.; De, A.; Zhang, W. Additive manufacturing of metallic components–process, structure and properties. Progr. Mater. Sci. 2018, 92, 112–224. [Google Scholar] [CrossRef]
- Bayat, M.; Nadipalli, V.K.; Biondani, F.G.; Jafarzadeh, S.; Thorborg, J.; Tiedje, N.S.; Bissacco, G.; Hattel, J.H. On the role of the powder stream on the heat and fluid flow conditions during Directed Energy Deposition of maraging steel—Multiphysics modelling and experimental validation. Addit. Manuf. 2021, 43, 102021. [Google Scholar] [CrossRef]
- Gan, Z.T.; Yu, G.; He, X.L.; Li, S.X. Surface-active element transport and its effect on liquid metal flow in laser-assisted additive manufacturing. Int. J. Heat Mass Transf. 2017, 86, 206–214. [Google Scholar] [CrossRef] [Green Version]
- Li, Z.; Yu, G.; He, X.; Li, S.; Zhao, Y. Numerical and experimental investigations of solidification parameters and mechanical property during laser dissimilar welding. Metals 2018, 8, 799. [Google Scholar] [CrossRef] [Green Version]
- Ma, C.; Chen, L.; Cao, C.; Li, X. Nanoparticle-induced unusual melting and solidification behaviours of metals. Nat. Commun. 2017, 8, 14178. [Google Scholar] [CrossRef] [Green Version]
- Chen, X.; Yu, G.; He, X.; Li, S.; Li, Z. Numerical study of heat transfer and solute distribution in hybrid laser-MIG welding. Int. J. Therm. Sci. 2020, 149, 106182. [Google Scholar] [CrossRef]
- Chen, L.Y.; Xu, J.Q.; Hongseok, C.; Hiromi, K.; Song, J.; Li, X.C. Rapid control of phase growth by nanoparticles. Nat. Commun. 2014, 5, 3879. [Google Scholar] [CrossRef] [Green Version]
- Wolff, S.J.; Lin, S.; Faierson, E.J.; Liu, W.K.; Wagner, G.J.; Cao, J. A framework to link localized cooling and properties of directed energy deposition (DED)-processed Ti-6Al-4V. Acta Mater. 2017, 132, 106–117. [Google Scholar] [CrossRef] [Green Version]
- Li, Z.; Yu, G.; He, X.; Li, S.; Li, H.; Li, Q. Study of thermal behavior and solidification characteristics during laser welding of dissimilar metals. Results Phys. 2019, 12, 1062–1072. [Google Scholar] [CrossRef]
- Kou, S. Welding Metallurgy; John Wiley & Sons: New York, NY, USA, 2003. [Google Scholar]
- Jin, K.N.; Yang, Z.Y.; Chen, P.; Huang, G.S.; Qiao, X.X. Dynamic solidification process during laser cladding of IN718: Multi-physics model, solute suppressed nucleation and microstructure evolution. Int. J. Heat Mass Transf. 2022, 192, 22907. [Google Scholar] [CrossRef]
- Meng, G.R.; Gong, Y.D.; Zhang, J.D.; Zhu, L.D.; Xie, H.L.; Zhao, J.B. Multi-scale simulation of microstructure evolution during direct laser deposition of Inconel718. Int. J. Heat Mass Transf. 2022, 191, 122798. [Google Scholar] [CrossRef]
- Wei, M.; Ding, W.J.; Vastola, G.; Zhang, Y.W. Quantitative study on the dynamics of melt pool and keyhole and their controlling factors in metal laser melting. Addit. Manuf. 2022, 54, 102779. [Google Scholar] [CrossRef]
- Hu, Y.W.; He, X.L.; Yu, G.; Zhao, S.S. Capillary convection in pulsed butt welding of miscible dissimilar couple. J. Mech. Sci. Technol. 2016, 231, 2429–2440. [Google Scholar] [CrossRef]
- He, X.; Fuerschbach, P.W.; DebRoy, T. Heat transfer and fluid flow during laser spot welding of 304 stainless steel. J. Phys. D. Appl. Phys. 2003, 36, 1388–1398. [Google Scholar] [CrossRef]
- Bahrami, A.; Valentine, D.T.; Helenbrook, B.T.; Aidun, D.K. Study of mass transport in autogenous GTA welding of dissimilar metals. Int. J. Heat Mass Transfer. 2015, 85, 41–53. [Google Scholar] [CrossRef]
- Li, Z.; Yu, G.; He, X.; Li, S.; Tian, C.; Dong, B. Analysis of surface tension driven flow and solidification behavior in laser linear welding of stainless steel. Opt. Laser Technol. 2020, 123, 105914. [Google Scholar] [CrossRef]
- Gan, Z.; Yu, G.; He, X.; Li, S. Numerical simulation of thermal behavior and multicomponent mass transfer in indirect laser deposition of Co-base ally on steel. Int. J. Heat Mass Transf. 2017, 104, 28–38. [Google Scholar] [CrossRef] [Green Version]
- Hejripour, F.; Valentine, D.T.; Aidun, D.K. Study of mass transport in cold wire deposition for Wire Arc Additive Manufacturing. Int. J. Heat Mass Transf. 2018, 125, 471–484. [Google Scholar] [CrossRef]
- He, X.; Yu, G.; Mazumder, J. Temperature and composition profile during double-track laser cladding of H13 tool steel. J. Appl. Phys. 2010, 43, 015502. [Google Scholar] [CrossRef]
- Mills, K.C. Recommended Values of Thermophysical Properties for Selected Commercial Alloys; Woodhead Publishing: Wiltshire, UK, 2002. [Google Scholar]
- Voller, V.; Prakash, C. A fixed grid numerical modelling methodology for convection–diffusion mushy region phase-change problems. Int. J Heat Mass Transf. 1987, 30, 1709–1719. [Google Scholar] [CrossRef]
- Brent, A.D.; Voller, V.R.; Reid, K.J. Eethalphy-Porosity technology for modeling convection-diffusion phase-change—Application to the melting of a pure metal. Numer. Heat Transf. 1988, 13, 297–318. [Google Scholar] [CrossRef]
- Cezary, G. Diffusion Coefficients in Liquid Metals at High Dilution; Springer: Boston, MA, USA, 1995. [Google Scholar]
- Tan, Q.M. Dimensional Analysis: With Case Studies in Mechanics; Springer: Berlin/Heidelberg, Germany, 2011. [Google Scholar]
- Shen, H.; Pan, Y.; Zhou, J.; Yao, Z. Forming Mechanism of Bump Shape in Pulsed Laser Melting of Stainless Steel. J. Heat Transf. TASME 2017, 139, 062301. [Google Scholar] [CrossRef]
- Gan, Z.; Lian, Y.; Lin, S.E.; Jones, K.K.; Liu, W.K.; Wagner, G.J. Benchmark study of thermal behavior, surface topography, and dendritic microstructure in selective laser melting of inconel 625. Integr. Mater. Manuf. Innov. 2019, 8, 178–193. [Google Scholar] [CrossRef]
- Hejripour, F.; Helenbrook, B.T.; Valentine, D.T.; Aidun, D.K. Mass transport and solidification phenomenon in dissimilar metals arc welding. Int J Heat Mass Transf. 2019, 144, 118703. [Google Scholar] [CrossRef]
Publisher’s Note: MDPI stays neutral with regard to jurisdictional claims in published maps and institutional affiliations. |
© 2022 by the authors. Licensee MDPI, Basel, Switzerland. This article is an open access article distributed under the terms and conditions of the Creative Commons Attribution (CC BY) license (https://creativecommons.org/licenses/by/4.0/).