Abstract
Significant efforts have been spent determining or monitoring interlayer temperatures (IT) to increase quality in Wire Arc Additive Manufacturing (WAAM). However, an uneven thermal profile in the wall and a temperature gradient along the layer length are expected after a thin wall layer deposition, questioning the effectiveness of IT and its measuring approaches. After identifying the holistic meaning of IT, this work aimed at confronting two strategies using infrared pyrometers, elucidating their advantages and limitations for both open and closed-loop control. The proposed Upper and Sideward Pyrometer strategies were presented in detail and then assessed at different distances from the heat source. A calibration procedure was proposed. The results confirmed the existence of a natural temperature gradient along the wall. In addition, they showed how differently the arc heat affects the measured points (in intensity and steadiness) according to the strategy. Therefore, the interlayer temperature measured at a specific point on a part manufactured by WAAM should be taken as a reference and not an absolute value; the absolute value changes according to the measuring approach, sensor positioning and calibration. Using a temperature reference, both strategies can be used in open-loop control to reach repeatability (geometrical and metallurgical) between layers. However, the Sideward Pyrometer strategy is more recommended for feedback control of production, despite being less flexible.
1. Introduction
1.1. Contextualisation of Interlayer Temperature Measurement in WAAM
Wire Arc Additive Manufacturing (WAAM) corresponds to a group of processes widely reported in the literature [1,2] and is characterized by high deposition rates, low equipment costs and great versatility in terms of materials. In WAAM, particularly in thin-wall multi-layer constructions with one pass per layer, the interlayer temperature (IT) is a fundamental parameter (essential variable). Notwithstanding, this variable should not be assumed as the preheating or interpass temperature widely adopted in welding unless IT is equalized along with the build under construction by an external heat source. As known, the purpose of the preheat or interpass temperatures in welding (which together constitute a temperature range, under which welding must be performed) is to reduce the cooling rate. Preheat and interpass temperatures control the microstructural formation, for maintaining mechanical properties, such as toughness, and avoiding cold cracks. Therefore, it is essential to providing preheat and interpass temperatures throughout the deposition.
In turn, the interlayer temperature (IT) is defined in WAAM as the temperature measured at a certain point on the top layer of a build under construction (at the designer specification). In most cases, IT is taken as a reference to start the deposition of a new layer (open-loop control, without feedback). Thus, IT does not represent the temperature of the entire part. The time to reach its specified value (usually referred to as idle time or dwell time in WAAM) depends on the measurement position, deposition energy, as well as the shape, dimension and material of the structure. In addition, this temperature is not expected to remain constant during the deposition of a complete layer. In this context, the objective of IT is primarily to ensure the homogeneity of the layer geometry, preventing overheating and ensuring repeatability. When fixing an IT, it is desired to form a new layer similar to the previous layer in terms of shape, that is, the “same” width and height of each layer and, consequently, with a surface finish without large variations along the wall.
Depending on the variation of its level and the material, IT can also affect the microstructure of the component deposited by WAAM, and consequently, its mechanical properties. Since there may be a temperature difference along the wall, incurring different cooling rates, adopting IT as above defined, heterogeneous microstructure might form along the wall. Thus, IT can also be used with closed-loop control to achieve a more homogeneous microstructure and minor layer geometric deviations in WAAM. This closed-loop control could be achieved by monitoring a reference temperature to act on the parameter correction for its maintenance.
One way or another, the importance of knowing and studying IT in WAAM is notorious. In an ideal scenario, all regions of the build would be at the same temperature before starting the deposition of a new layer (bringing to a welding situation, it would be as if it were a preheating temperature). However, a thermal gradient along the length of a layer is expected after accomplishing a layer deposition over a WAAM thin wall. This is schematically shown in Figure 1a, which represents a bidirectional deposition condition. In this case, the heat takes time to transfer to the environment or distribute itself homogeneously in the manufactured wall. Therefore, the temperature at the initial point of the subsequent layer deposition is always higher than at the other extreme (the time to cool this material location after the previous layer is longer).
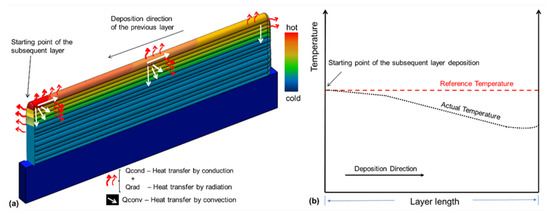
Figure 1.
Thin wall constructed by WAAM before starting a new layer deposition: (a) qualitative model of the heat exchange mechanisms; (b) hypothetical thermal profile.
An actual temperature profile similar to that illustrated in Figure 1b can be obtained through monitoring a point located on the surface of the last layer and moving along the wall length. Figure 1b also presents a reference temperature, corresponding to a value used as a starting point for a new layer. As seen, the actual temperature profile shows temperature reduction along with the deposition (a thermal gradient). This temperature profile can vary according to the energy provided by the arc (the average of the instantaneous powers divided by the displacement speed) and the relative position of the measurement point in relation to the heat source. Thus, even if the same thermal history imposed by the previous layers is maintained and the energy of the arc and the measurement point are the same, a thermal gradient will still characterize the actual temperature profile. Therefore, it is not the temperature measured along the layer that really matters (since it varies anyway), but what matters is a parameter representing a given interlayer temperature.
In terms of sensor positioning in a pyrometrical measurement method, two strategies can be pointed out to monitor the interlayer temperature (IT). The first is coined for this work as the “upper pyrometer” strategy, schematically represented in Figure 2a. The pyrometer light beam points downward over a measurement point on the upper face of the last deposited layer, constantly monitoring the temperature in front of the melt pool. In ideal conditions, the temperature would be monitored as closely as possible in the melt pool. This monitored temperature would provide a better idea of the molten metal pool’s physical-chemical properties and volume (variables that influence the layer geometry). This temperature would also give information on variables affecting the component microstructure (namely, peak temperatures, range temperature duration, and cooling rates). However, there are intrinsic operational hindrances to this. Therefore, a minimal “L” distance from the molten pool to the measurement point must be established. Evidently, this distance “L” in Figure 2 turns out to be a variable added to the sensor position, since the influence of the arc heat tends to reduce as “L” increases (the arc heat has its impact reduced to the measurement point). In concordance with the intrinsic thermal gradient, the temperature monitored at the end of the same layer will differ from that at the beginning of the deposition. In this way, if “L” is too long (no arc heat influence), the monitored temperature is slightly reduced as the layer deposition progresses; if “L” is too short (arc heat influencing), on the other hand, this temperature will tend to decrease throughout the deposit.
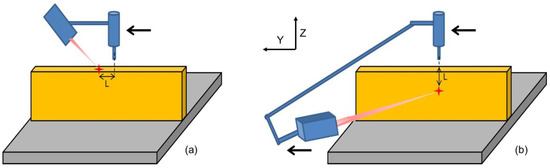
Figure 2.
Strategies for interlayer temperature (IT) measurement in thin-wall WAAM: (a) Upper Pyrometer strategy; and (b) Sideward Pyrometer strategy.
The second strategy, not commonly commented on in the literature about WAAM, is designated in the present work as the “Sideward Pyrometer” strategy, and schematically represented in Figure 2b. The pyrometer light beam is positioned over a measurement point located on the lateral of the wall and underneath the molten pool. In this case, the heat from the arc affects the temperature measurement, whatever “L” is (assuming that the most significant heat flux occurs along the construction direction—Z direction, from the deposited layer towards the previous layers). However, a very long “ L” distance would change the point to an almost-equilibrium temperature region (where the heat flow is already homogeneous), reducing the sensitivity of the measuring approach to ensure the expected stabilities (geometric homogeneity and mechanical properties of the build) based on a given IT.
1.2. A Review of Pyrometric/Thermocouple Measurement of Interlayer Temperature in MADA
Several studies using different materials have evaluated already the effect of interlayer temperature (IT) on geometric characteristics, surface quality, microstructure and mechanical properties in components deposited by WAAM. Different measurement approaches were adopted to monitor different IT levels in these works. Among these, some authors used an infrared pyrometer to monitor a measurement point located on the top surface of the last deposited layer [3,4,5,6,7], as proposed in Figure 2a. In Derekar et al. [3], two walls of Al-5%Mg (AWS ER5356) were deposited using two different levels of IT (50 °C and 100 °C). The wall with the IT level of 100 °C presented grain sizes larger than those with 50 °C. According to the authors, the greater amount of grain boundaries available for the lower IT condition served as a site for hydrogen trapping, leading to greater porosity and compromising the evaluated mechanical properties. Knezovic et al. [4] evaluated the effect of IT on the structure and properties of components deposited with duplex stainless steel. They stated that increasing IT from 50 °C to 150 °C resulted in a slight reduction of the ferrite amount, but was insufficient to result in significant variations in hardness. In Muller et al. [5], two IT levels (200 °C and 400 °C), two energy levels (2.7 kJ/cm and 4.6 kJ/cm), and the usage or not of forced cooling with compressed air were evaluated using high-strength steel. Higher IT levels led to martensite formation, resulting in higher tensile strength, lower yield strength, and a drop in impact strength. Furthermore, active cooling was less significant when higher IT was employed. Despite the remarkable features disclosed by them, it is essential to highlight that all these authors did not mention that when measuring the temperature at the top of the layer, they just set a reference value (and not a particular IT value, due to the potential temperature variation along the layer).
Other authors used the thermocouple method with a positioning point on the substrate to measure the temperature [8,9,10,11]. With this approach, Shen et al. [8] showed a slight increase in the wall width and improved yield strength when IT was increased in components deposited with an iron aluminide (Fe3Al-based iron aluminide). However, it is important to note that the measurement point is increasingly far from the melt pool throughout the deposition when this monitoring approach is employed. Thus, depending on the IT levels, dwell times considered and the material evaluated (higher or lower thermal conductivity), heat accumulation can occur with the progression of the deposition and deleterious consequences are observed. Geng et al. [9], using an aluminum alloy and an IT of 150 °C, showed an increase in wall width along with the deposition.
On the other hand, lower levels of IT (50 °C, 80 °C, and 120 °C) did not reveal this behavior. For this reason, Montevecchi et al. [11] proposed an approach to calculate the interval time between two layers (time necessary to ensure a melt pool with a constant size throughout the deposition in WAAM). They considered some temperature control points located at the surface of each layer (more precisely at the endpoint of the layer). A thermocouple positioned on the substrate was used to build a model based on finite elements (this approach served as the basis for developing the proposed technique). However, the papers on measuring the temperature at the substrate face show several setbacks to consider this temperature as IT.
In addition to the measurement approaches mentioned previously, only Bai et al. [12] used a measurement point located on the lateral of the deposited component as a reference to monitor the IT (more precisely at 8 mm from the last deposited layer and in the middle of the wall length). In this case, the measurement point was always at a fixed distance from the top of the wall and followed the increase in construction height. As a result, the average temperature of the last layer showed minor variations from the third layer, indicating considerable control of the heat accumulation.
1.3. Research Questions and Purpose
As seen, researchers have spent significant efforts to determine or monitor interlayer temperatures (IT) to increase the quality of WAAM builds. Keeping the focus on thin-wall WAAM and the usage of infrared (non-contact) pyrometers to monitor IT, a novelty of further study on the subject would consist in confronting two approaches for measuring IT, elucidating their advantages and limitations for potential applications in control. As a result, it is expected to provide more subsidies to researchers in choosing a method for measuring IT. After identifying the holistic meaning of IT, two specific objectives are proposed for this work, i.e., to demonstrate the suitability and limitations of using the “Upper Pyrometer” and “Sideward Pyrometer” approaches to measure IT in WAAM:
- Aiming at maintaining the wall geometric and metallurgical structure along with the layer depositions (open-loop control);
- Aiming at closed-loop control in WAAM towards the same outcomes.
2. Methodology and Experimental Procedure
Experiments were designed to evaluate the two pyrometrical strategies for measuring interlayer temperatures (IT) in WAAM of thin walls. The temperature profiles were acquired by the two strategies considering different measurement points in relation to the heat source (electric arc). Both strategies used single-pass per layer (4 layers) and bidirectional depositions. At first sight, unilateral depositions would be more suitable for this study, as they would always keep the upper pyrometer in front of the melt pool and a more significant equivalence between layers. However, unidirectional deposition leads to material accumulation at the beginning and material shortage at the end of the deposit. This resultant geometric difference would affect the analysis of the heat distribution.
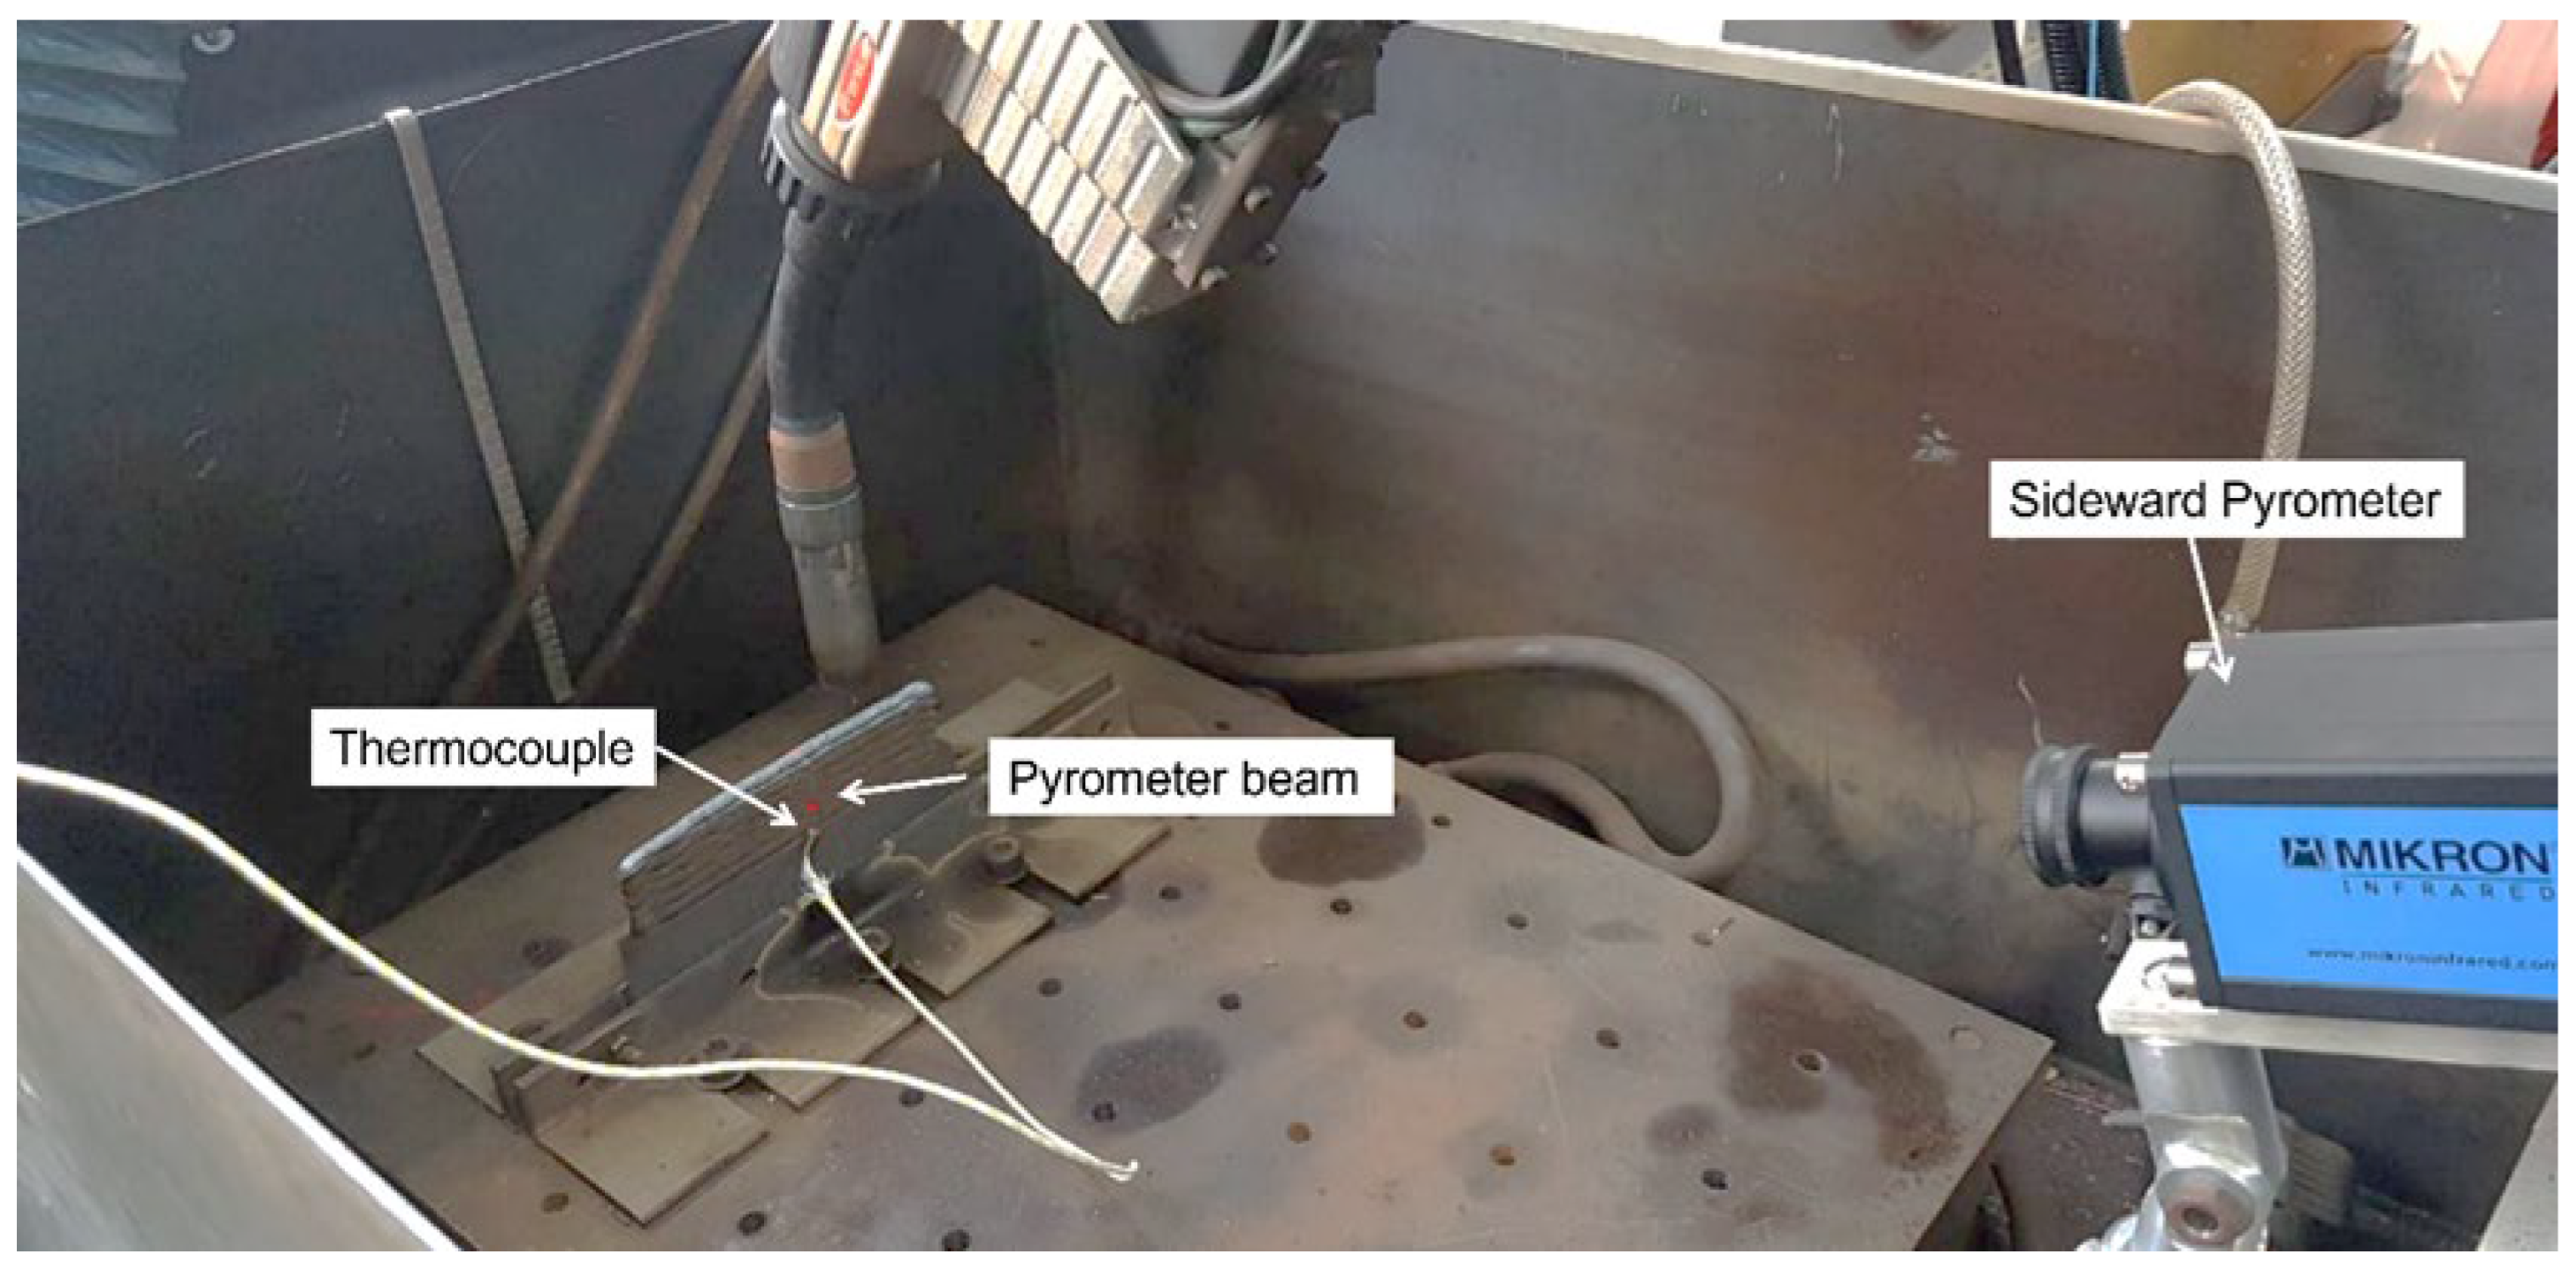
In both cases, the pyrometers were fixed to the torch support (Figure 3) in order to ensure that the measurement point was always at the same distance from the heat source. This distance, called “L”, and as schematically illustrated in Figure 1, was defined based on the span between the measurement point and the point where the centerline of the wire intersects the last deposited layer surface. “L” was fixed at 10 mm, 15 mm and 20 mm, yet keeping the same set value for the two pyrometers during the depositions.
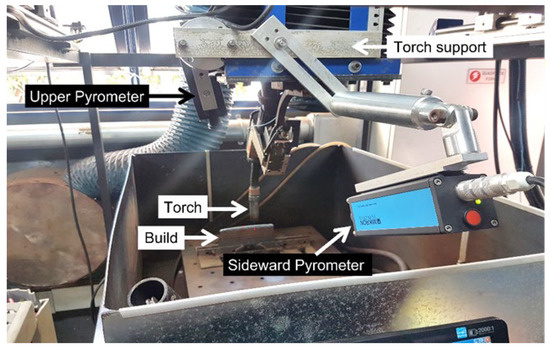
Figure 3.
Experimental rig with the two pyrometers fixed in the torch support and positioned to measure with the strategies Upper Pyrometer and Sideward Pyrometer accordingly.
Regardless of the strategy and the sensor positioning (“L”), the layer deposition between walls started when the temperature indicated by the “upper pyrometer” reached a reference temperature of 300 °C during the cooling from the previously deposited layer. Therefore, the desired IT is considered hereupon the reference temperature measured by the upper pyrometer at a given distance “L” from the centerline of the arc. As the pyrometer was always positioned on the same side of the torch, the reference temperature was not determined in the inversion of the deposition direction, when the position of the pyrometer target pointed outside the wall. To compensate for this limitation, the time to reach the reference temperature was quantified with a stopwatch and used as the parameter to start the inversed deposition.
Additional experiments were carried out using the same way described in the previous paragraph, but without the presence of the electric arc after the deposition of a layer. The objective of this approach was to demonstrate the existence of a natural temperature gradient along the wall, from the beginning to the end of the torch translation time, according to both measurement strategies and the “L” value. Furthermore, by contrasting these temperature profiles with the ones that had the presence of the arc, it was possible to evaluate the magnitude influence of the arc heat on the thermal gradient. Table 1 displays the conditions for each experiment. It is important to highlight that the measurements were made on two of the four layers deposited, at the same deposition direction (to ensure the repeatability of the experiments).

Table 1.
Experimental design to assess the influence of the “L” distance on the pyrometric thermal profiles.
2.1. Equipment, Materials and Deposition Conditions
The Cold Metal Transfer (CMT®) version of the GMAW (Gas Metal Arc Welding) process was used for the WAAM depositions with an AWS ER90S-B3 wire, protected with an Ar + 4%CO2 mixture (flow rate of 15 L/min). The contact-tube distance to the workpiece was kept at 16 mm. The wire feed speed (WFS) was set at 4.4 m/min and travel speed (TS) at 33.3 cm/min. Plain carbon steel flat bars (6.3 × 50 × 150 mm) were used as a substrate and fixed in such a way that the narrowest side faced up. With this approach, the substrate served as a “pre-wall” of similar thermal behavior, avoiding the need for depositing a large number of initial layers to reach the steady-state condition. Nonetheless, to ensure temperature monitoring on the layers and not on the substrate, eight layers, with an average height of 2.7 mm, were previously deposited, resulting in an initial wall height of approximately 21.6 mm (excluding the 50 mm of substrate height).
Two commercially available infrared (non-contact) single-color pyrometers (Mikron MI-PE140) were used to perform the temperature measurements. They have a measurement range of 30 °C to 1000 °C, 0.1 °C of the resolution, and 50 Hz of the acquisition rate. The users set the emissivity coefficient of the body under each measurement.
2.2. Calibration
Before carrying out measurements, it is usual and safe to calibrate the measurement system (sensor, signal conditioner and data display). Calibration is conducted, for example, by comparing the measured value with a known value (“true value”). As calibration of pyrometers used for welding and allied processes (steep gradient of temperature on the same material) are not standardized, and in some cases neglected, details of the procedure used in this work are given, as follows.
As pointed out by Da Silva et al. [13], one of the limitations in measuring with infrared pyrometers is the need for knowing the emissivity coefficient (ε) of the object to be measured, since single-color pyrometers require the user to enter the emissivity (set value). It is known that ε is a function of material composition, temperature and surface conditions. Thus, it is necessary to know ε at the measurement conditions.
To attend to this requirement, preliminary experiments were conducted to define the emissivity coefficient (εset) to be set in the data processing program for each pyrometer. The temperature used as a reference (known values) for this calibration was monitored by a non-encapsulated 0.6-mm-diameter (each wire) type K thermocouple. It is worth mentioning that this reference temperature is not equivalent to the measurand’s true value, considering thermocouple intrinsic inaccuracies, but assumed here to be an acceptable value for calibration. As the surface conditions are also a function of the thermal history experienced by the material, it was proposed to calibrate the pyrometers separately according to the strategy (“upper pyrometer” and “sideward pyrometer”) and in surface conditions as close as possible to those in which the measurements will be taken. For that, increasing temperatures (in the expected range of this work) were imposed, so that a thermal profile could be recorded by both thermocouple and IR sensors simultaneously. Using the calibration reference temperature profile (from the thermocouple), the emissivity coefficient set value (εset) was systematically varied in the data processing program for each pyrometer until guaranteed greater compliance between the profiles (therefore, the emissivity coefficient ε was entered as a calibration parameter, εset, and not at its actual value, ε).
To find the εset for the Upper Pyrometer approach, layers were sequentially deposited onto the substrate. A capacitor bank was used to impose an electrical discharge to attach the thermocouples at one end of the deposited layer top surface, as illustrated in Figure 4. The pyrometer beam was held at a fixed position over the same measurement point as the thermocouple (right next to the thermocouple, but not over to, otherwise the thermocouple temperature and not the walls would be measured). To maintain the integrity of the thermocouple, the subsequent layers always stopped before reaching the measurement point. Layer depositions were replicated for repeatability purposes. Different deposition parameter combinations were employed to reach higher peak temperatures. Then, after observing the temperatures measured by the pyrometer, εset in the program was changed up to achieve convergence between the thermal curves produced with the pyrometer and that from the thermocouple.
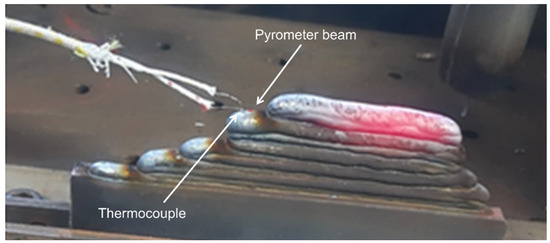
Figure 4.
Experimental determination of the set emissivity coefficient (εset) for the upper pyrometer approach (the heating of the measuring point is a result of the layer deposited after the thermocouple has been fixed on a previous layer).
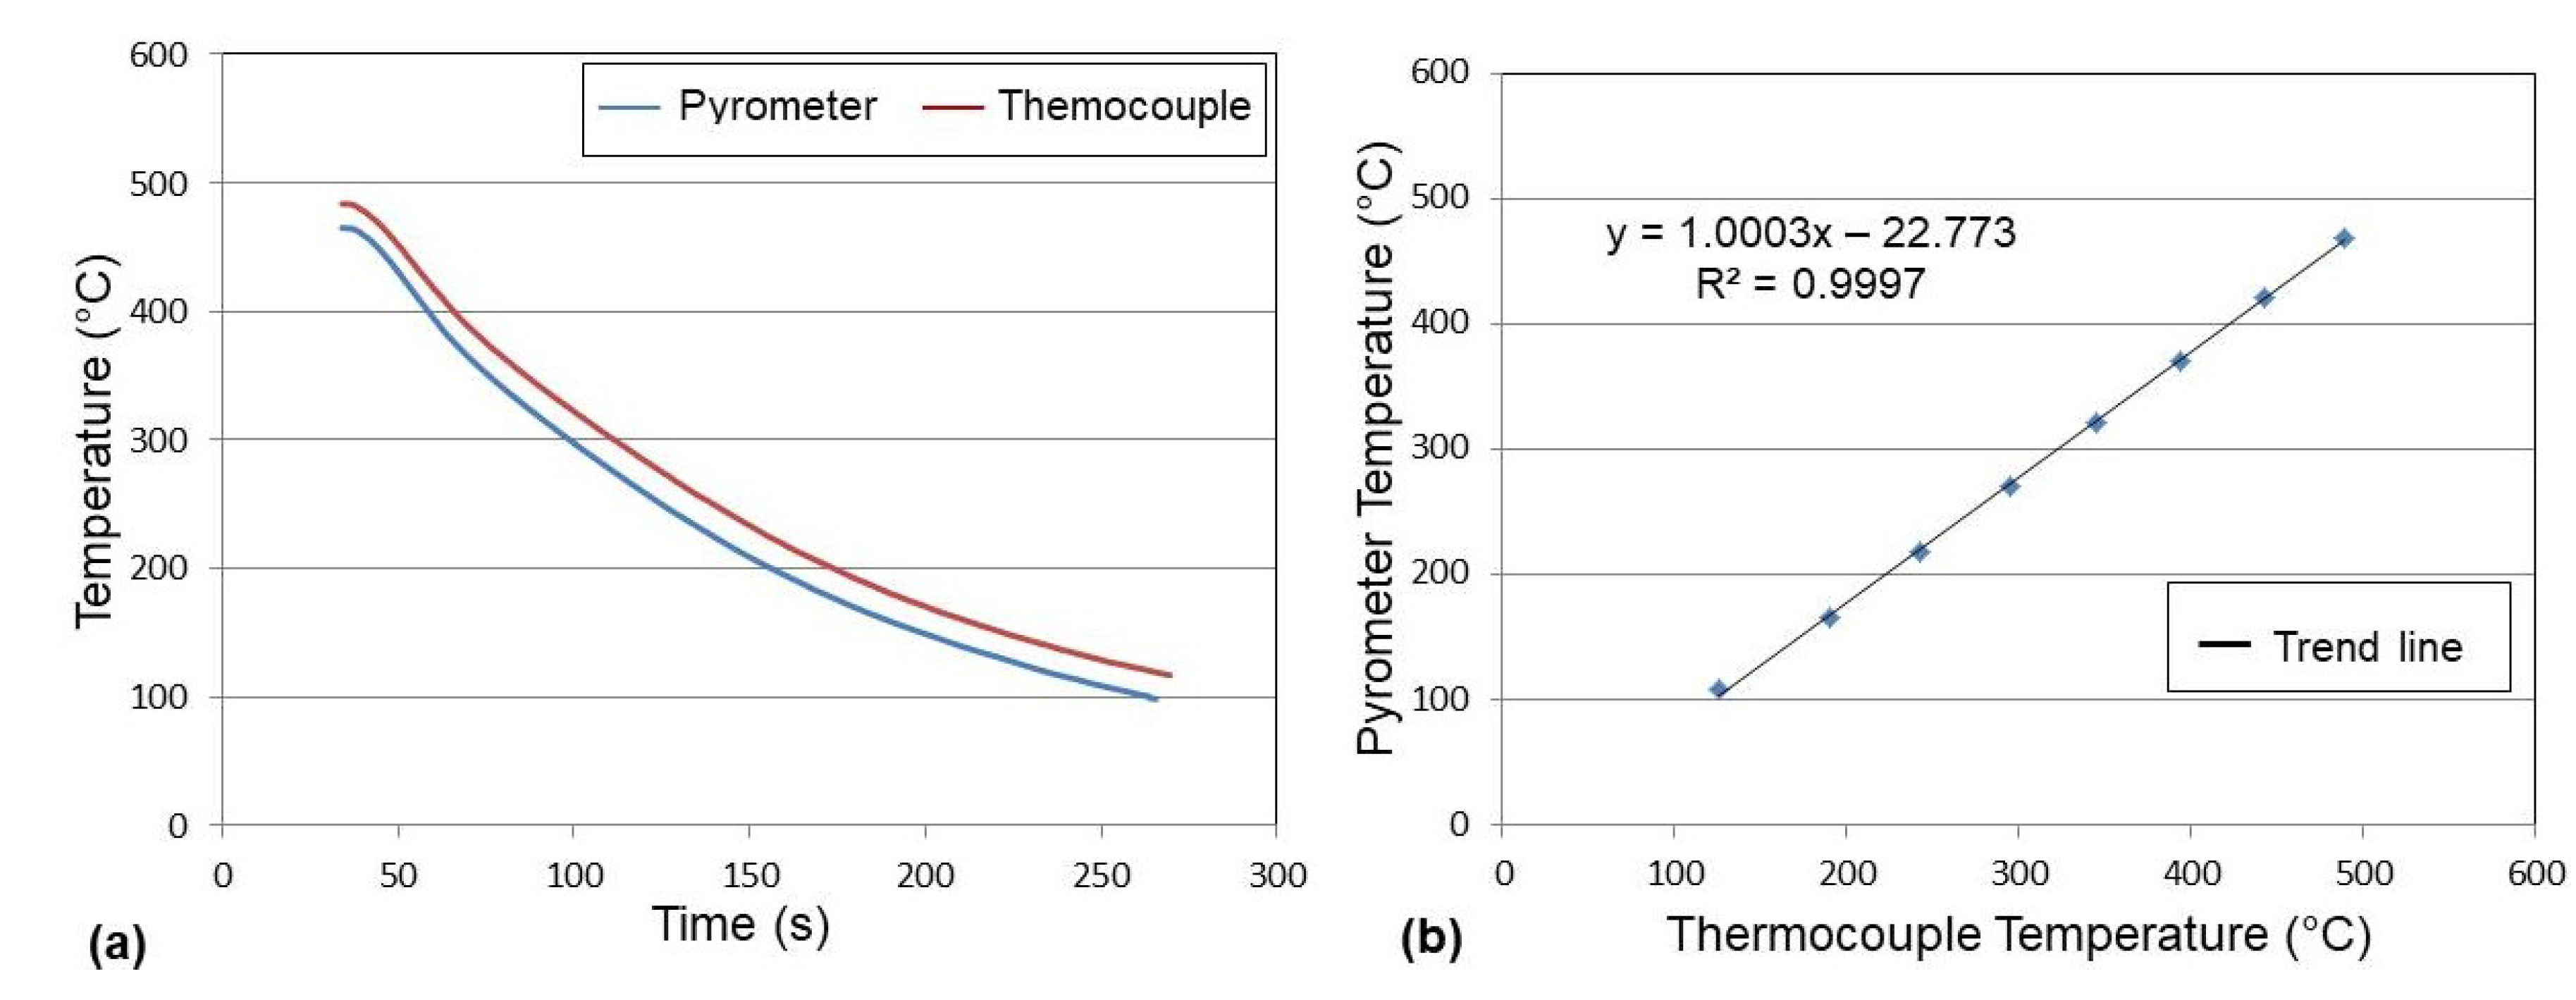
A εset of 0.99 provided the smallest differences between the cooling temperatures, within a reference temperature range between 120 °C and 487 °C. Even so, as seen in Figure 5a, the two temperature profiles did not converge ideally with each other, with minor deviations recorded at higher temperatures (3.9% at 487 °C) than for lower temperatures (16.7% at 120 °C ). In view of this divergence, a calibration curve (shown in Figure 5b) was plotted and used to correct the temperatures recorded by the Upper Pyrometer strategy. High linearity is observed in the calibration curve, but a small gradient moves the calibration curve away from the origin, suggesting that it is caused by the proportional variation of the emissivity with temperature increase. A similar approach in terms of the calibration strategy and the construction of a calibration curve was also seen in Wu et al. [7], whose authors also monitored the temperature with a pyrometer point onto the upper face of the last layer deposited.
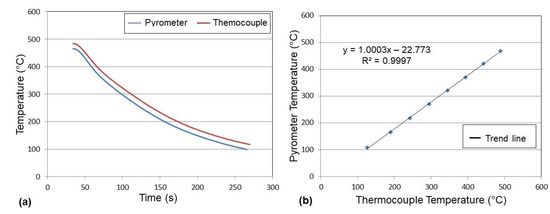
Figure 5.
(a) Temperature profiles as a function of time, within a measurement range between 120 °C and 487 °C, with the emissivity coefficient set (εset) at 0.99 for the pyrometer; (b) corresponding fitting curve and calibration equation.
To correct the emissivity configuration for the “sideward pyrometer” approach, in turn, a different calibration procedure was used. Eight layers were previously deposited and a thermocouple was fixed on the longitudinal center of one of the wall side surfaces, as illustrated in Figure 6. The pyrometer measurement point was also fixed very close to the thermocouple measurement point, yet 10 mm from the last layer, so that the measurement took place on a region underneath the cathodic cleaned area (which presented an extension of approximately 5 mm). Following, several layers were sequentially deposited, triggered when the sideward pyrometer reading registered 100 °C, considering a non-calibrated emissivity coefficient set value.

Figure 6.
Experimental determination of the set emissivity coefficient (εset) for the sideward pyrometer approach (the heating of the measuring point is a result of 5 layers deposited on a surface at approximately 10 mm from the top edge).
For this approach, a εset of 0.90 leads to the greatest convergence between the temperature curves, as shown in Figure 7a. Again, the two recorded profiles did not perfectly converge with each other, with minor deviations recorded for higher temperatures (0.5% at 500 °C) than for lower temperatures (5.0% at 100 °C). Therefore, a calibration curve (shown in Figure 7b) was also raised and used to correct the temperatures recorded by the “sideward pyrometer”. Similar to the case of the upper pyrometer, the high linearity and the slight deviation of the calibration curve from the origin confirm the emissivity’s proportional variation with the increase in temperature.
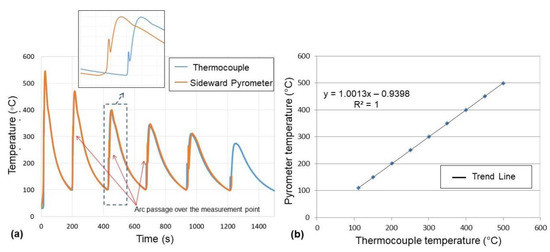
Figure 7.
(a) Temperature profiles as a function of time, recorded by the thermocouple and the sideward pyrometer, within a measurement range between approximately 100 °C and 550 °C, with the emissivity coefficient (εset) set to 0.90 (note a magnification of a signal lag to evidence punctual noises); (b) corresponding fitting curve and calibration equation.
However, the passage of the arc over the centerline of the measurement point leads to transient noise in the signals (indicated by red arrows in Figure 7a). Noise appears in both thermocouple and pyrometer signals, although in different temperature ranges. Ma et al. [14] also showed this same effect when monitoring the temperature with a pyrometer positioned over a fixed measurement point on the side of the wall. According to them, there is a peak temperature at the arc passing over the measurement point due to the transient. In the case of the pyrometer, this may be the result, mainly, of the sudden change in luminosity in the monitoring region. In the case of the thermocouple, as it is a contact measurement principle, electromagnetic waves or radiant heat from the arc may be responsible for this phenomenon. The distinct reasons for the noise justify the temperature that the transient occurs.
3. Results and Discussion
3.1. Existence of a Natural Temperature Gradient along the Wall (Temperature Measurement along the Wall without Electric Arc)
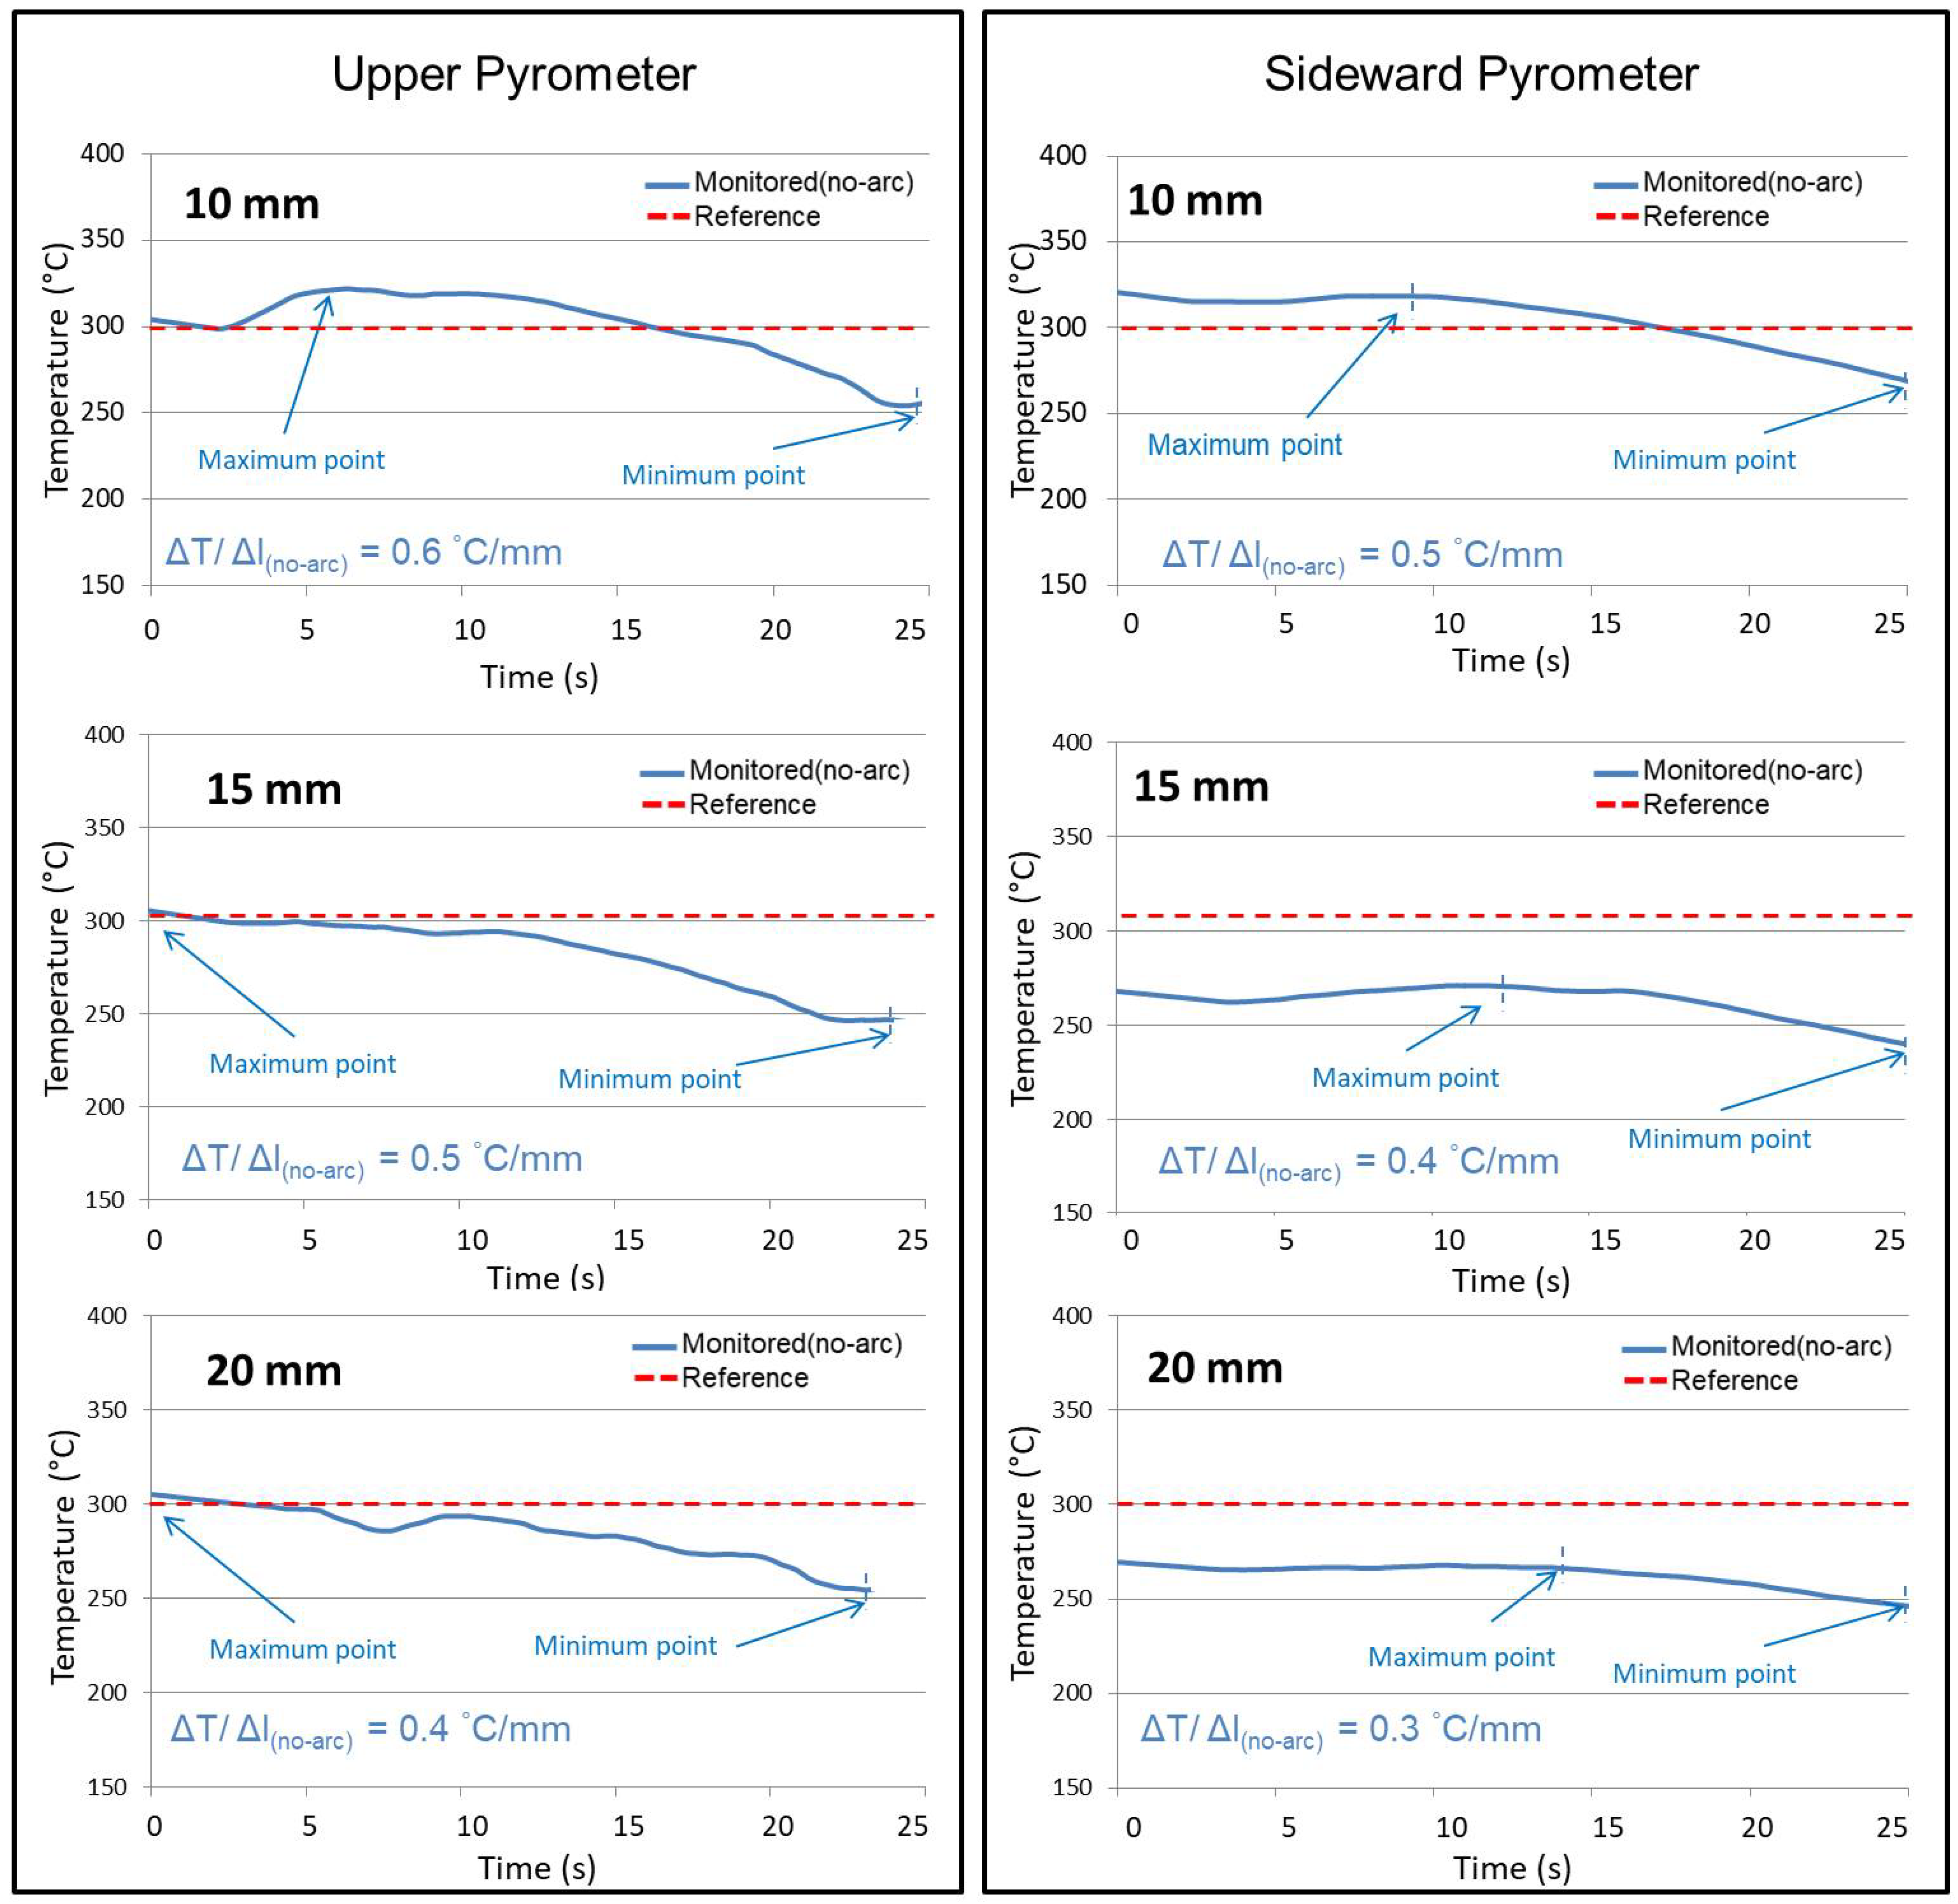
Figure 8 presents the temperature profiles for a hypothetical layer without the arc, consequently with no deposition (and delivered heat). The figure shows data from the fourth layer as representative of all experiments since very similar behavior was observed when comparing the temperature profiles between layers 2 and 4 of the same experiment. This is due to the constancy of the method and devices. The temperature profiles were individually obtained for the two pyrometer strategies, with the measurement points at 10 mm, 15 mm and 20 mm away from the heat source. As can be seen, the temperature gradients per unit of layer length in the no-arc condition ΔT/Δl(no-arc) were also calculated for each condition and are presented in Figure 8. To estimate ΔT/Δl(no-arc), the difference between the representative maximum and minimum temperatures from the profiles (within the monitored range) was determined and then divided by the elapsed time between them.
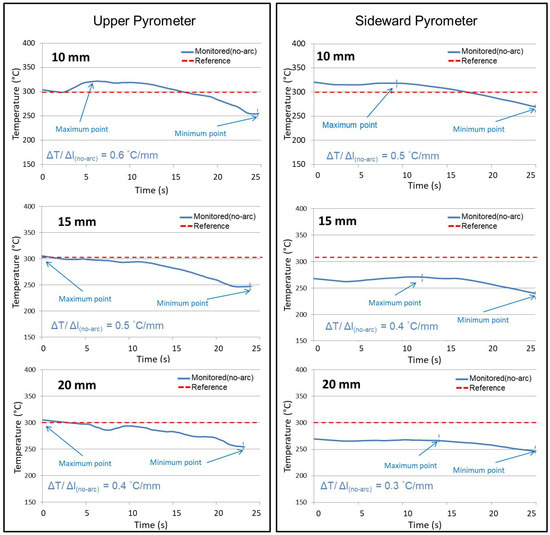
Figure 8.
Typical temperature profiles resultant from the two pyrometer approaches with the torch movement without an arc (no-arc condition), for different measurement distances “L”, where ΔT/Δl(no-arc) is the temperature gradient from the representative maximum and minimum temperatures (the reference temperature of 300 °C for the torch movement start is that from the Upper Pyrometer).
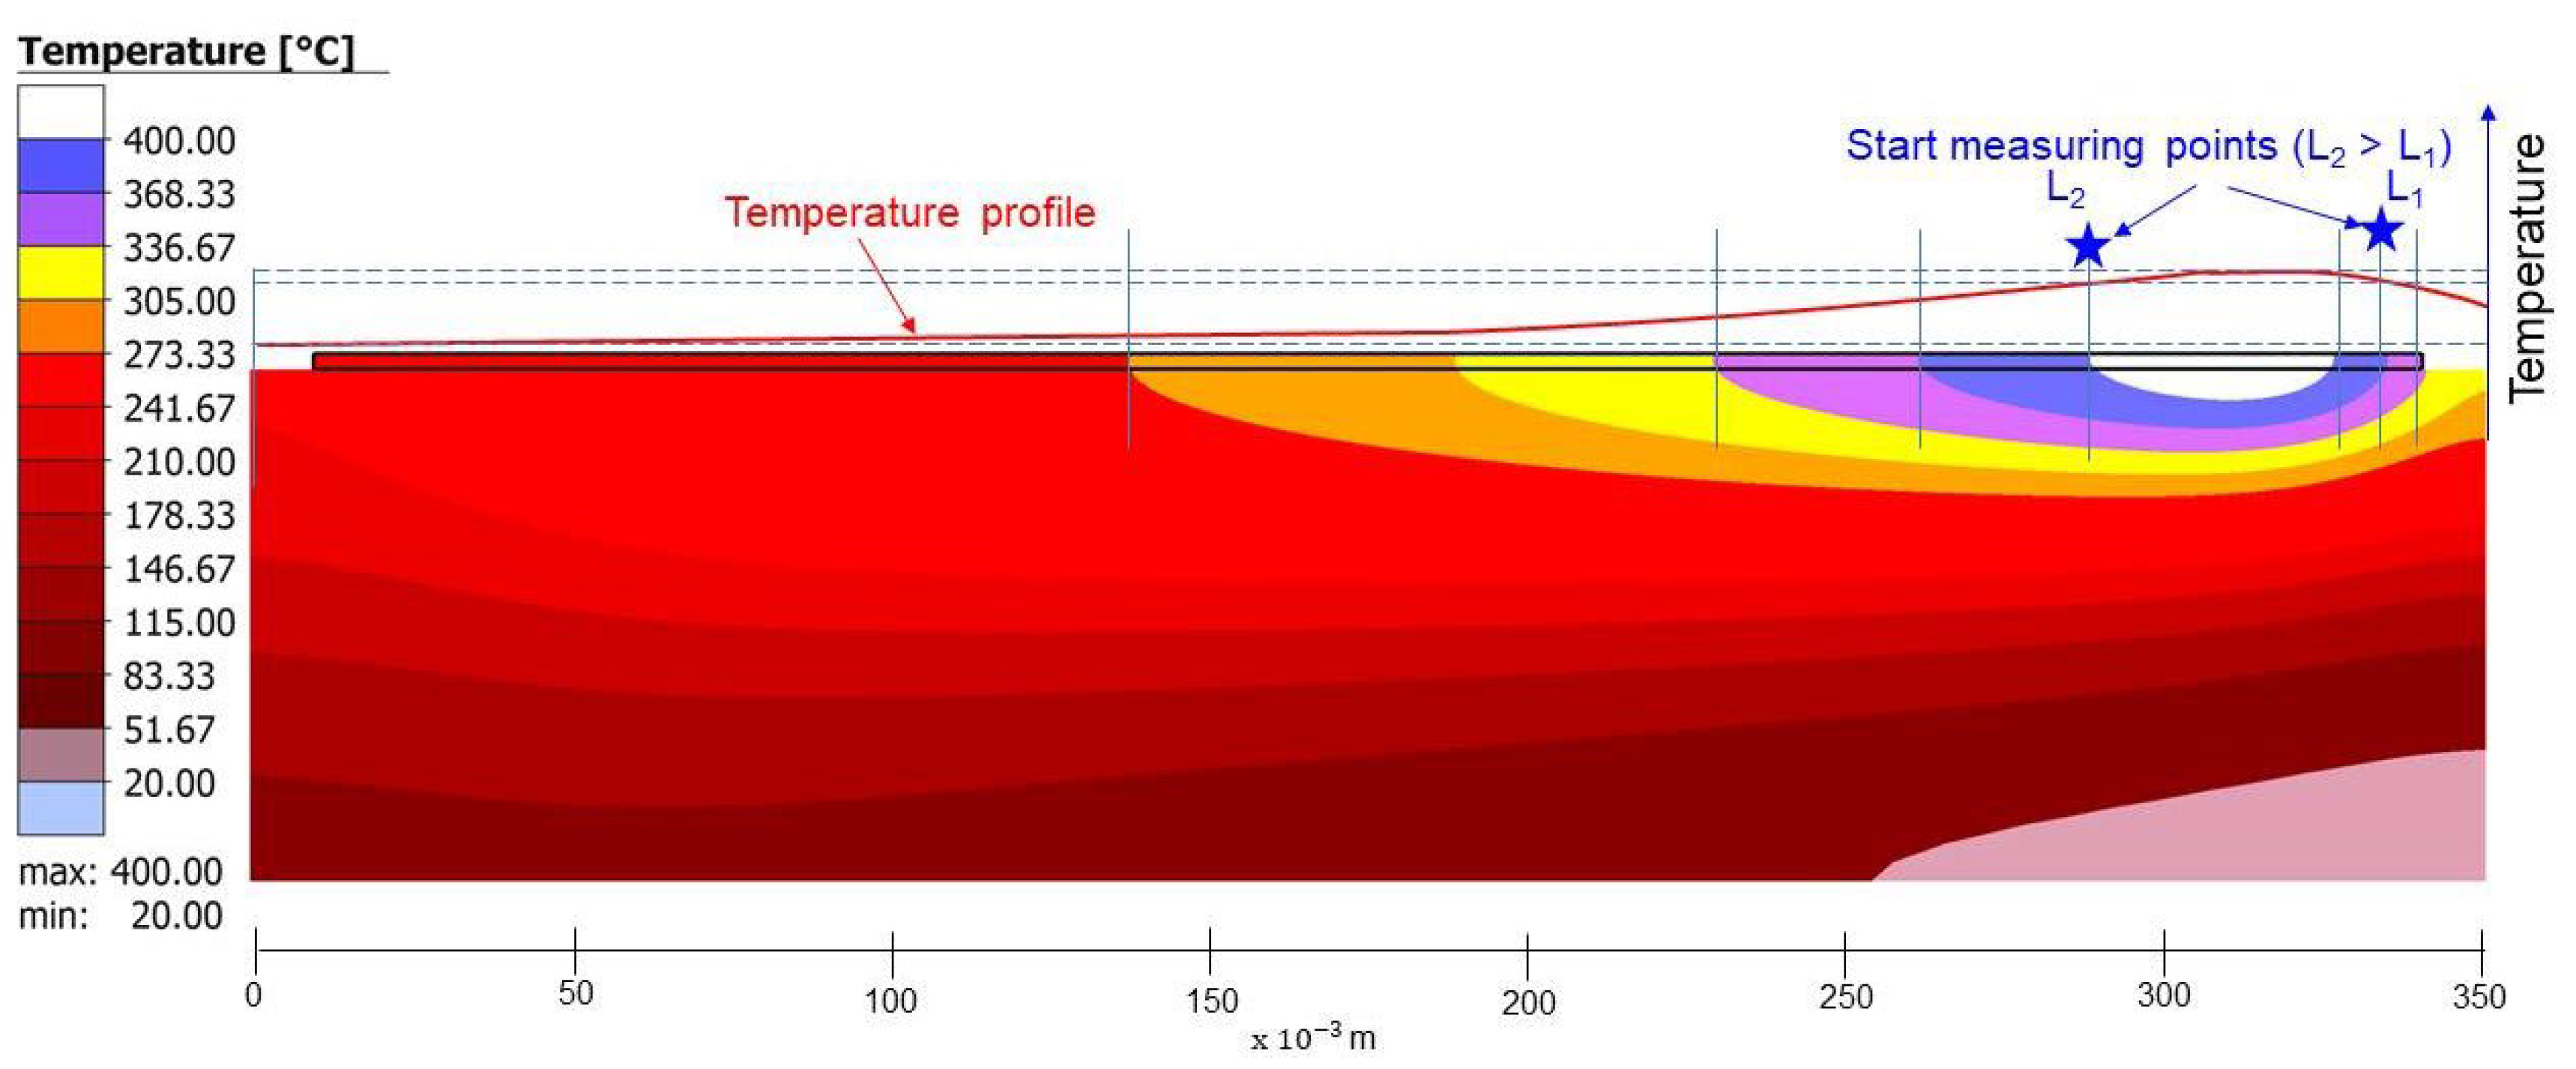
Regarding the Upper Pyrometer strategy plots, there is generally a tendency for reducing temperatures during the hypothetical deposition time, in agreement with the profile idealized in Figure 1a. However, there is an apparent influence of the “L” distance on the temperature profiles. Using L = 10 mm, there is a maximum temperature point at a range from approximately 5 s to 7 s (the temperature is about 25 °C above the 300 °C set to start the pyrometer displacement), not seem when setting the other “L”. The authors suggest two explanations for this maximum. First, the melt pool in an arc welding/deposition presents a higher temperature at the symmetrical line of the heat source and it is characterized by a temperature profile that is more elongated on its back than its front. Consequently, the heat source centerline is not positioned at the wall edge, but at a certain distance from the edge. This temperature profile will be maintained when the arc is extinguished, considering the same heat diffusion towards all sides of the pool (only the isotherms values will progressively reduce). This is confirmed by the simulation shown in Figure 9, in which the Goldak heat source was used in the model. Therefore, at a given distance from the edge of the wall, the temperature will be higher (around 320 s in Figure 9). A second concurrent explanation is based on the fact that the heat losses are slightly higher at the edge than at a given short distance from the edge since there is more surface area for convective heat transfer.
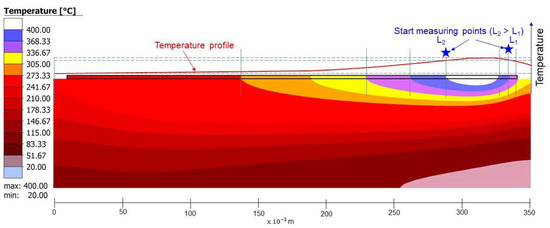
Figure 9.
Numerical simulation of an HSLA steel thin wall WAA Manufactured, 21 s after extinguishing the heat source: substrate length = 350 mm; layer length = 330 mm; layer width = 5.3 mm, arc energy = 422 J/mm (adapted contribution from Dr Amin Rahimi, personal communication).
Therefore, the temperature profile close to the layer surface presents a maximum at a short distance (between “L1” and “L2”), as depicted in Figure 9, decaying continuously from this point up to the right edge of the wall. This reasoning justifies why only with the shortest start measuring point distance from the heat source (represented by “L1” in Figure 9, equal to 10 mm in the experiments) a maximum is presented in Figure 8 (for “L” equal or greater than 15 mm, the pyrometer would be already pointing at positions that the temperature was naturally falling (beyond L2 of Figure 9).
It is interesting also to note that the temperature gradient per unit of length (ΔT/Δl(no-arc)) tended to decrease when measured with the Upper Pyrometer at different “L” distances (from 0.6 °C/mm to 0.3 °C/mm, when “L” increased from 10 mm to 20 mm, respectively). This reduction was also expected because cooling by conduction (main mechanisms at lower temperatures) is less efficient when the temperature difference shortens.
Analyzing the sideward strategy plots, in which the reference temperature is that measured by the upper pyrometer (having no relationship between the pyrometer measurands), the shorter the distance “L”, the higher the measured temperatures (it can even exceed the reference temperature if “L” is short) and the more uniform the profiles, as emphasized in Figure 8). There is also a trend for the temperature to start falling during the torch translation time after some distance from the left edge. For the same reason as for the Upper Pyrometer strategy, the temperature gradient (ΔT/Δl(no-arc)) tended to decrease (from 0.5 °C/mm to 0.3 °C/mm, for L = 10 mm to 20 mm, respectively). However, the loss of temperature uniformity starts progressively longer as “L” becomes more distant. This is justified by a more homogeneously distributed temperature in the wall when the Sideward Pyrometer pointer is farther from the latest deposited layer. This latter observation has already been observed, both through finite element simulations [14,15], and thermographic evaluations [12,16,17].
3.2. Temperature Measurements along the Wall with Electric Arc
In terms of temperature monitoring using the Upper Pyrometer strategy (sensor in front of the arc), now with the presence of the electric arc, it would be expected that the arc heat could affect to a certain extent the monitored temperatures. This influence magnitude would depend on the distance “L” for a given arc (energy). However, typical molten pool isotherms of an electric arc used in WAAM (as seen in Figure 10) teach us that the front pool temperature gradient (ΔT/Δs) is very steep. Then, “L” would have to be very short to influence the temperature ahead of the moving heat source. On the other hand, considering now the pyrometer distances (“L”) from the top surface of the layer (Sideward Strategy), the dashed horizontal lines overlapping the simulation representation in Figure 10 suggest temperature decreases when “L” is made longer (farther from the layer under deposition). These lines delimited by black dot marks also suggest how long the temperature would be constant at each “L” position.
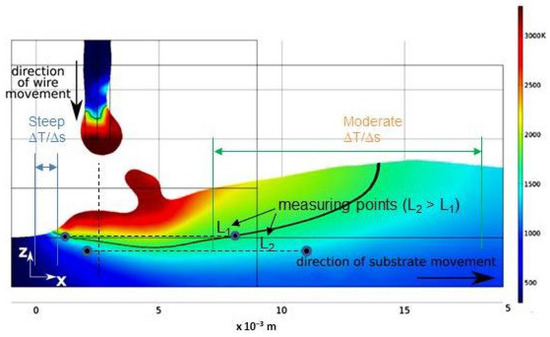
Figure 10.
Numerical simulation of a wall deposition by WAAM, showing a steeper isotherm gradient (ΔT/Δs) in front of the pool than that at the rear of the pool and the length of homogeneous temperature at positions underneath the pool (information superimposed a figure from Cadiou et al. [18]).
Having no influence of the arc on the temperature ahead of the heat source, one can imagine that the temperature profile from the Upper Pyrometer strategy would match the profile with no arc (as illustrated in Figure 11a). The monitored temperature curve would maintain a negative gradient in the direction of the layer deposition. Under the Sideward strategy, in turn, the presence of the electric arc would affect the monitored temperature according to the “L” distances (Figure 11b). The heat arc influence can even make up the natural falling temperatures along the deposited layer length.
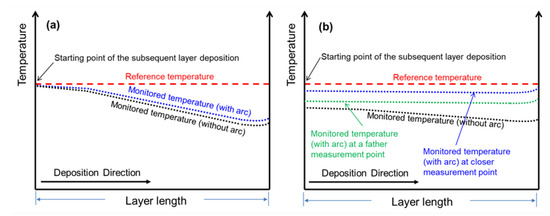
Figure 11.
Qualitative model of the temperature profile along the wall length, in contrast to the reference temperature: (a) for the upper pyrometer strategy; (b) for the sideward pyrometer strategy.
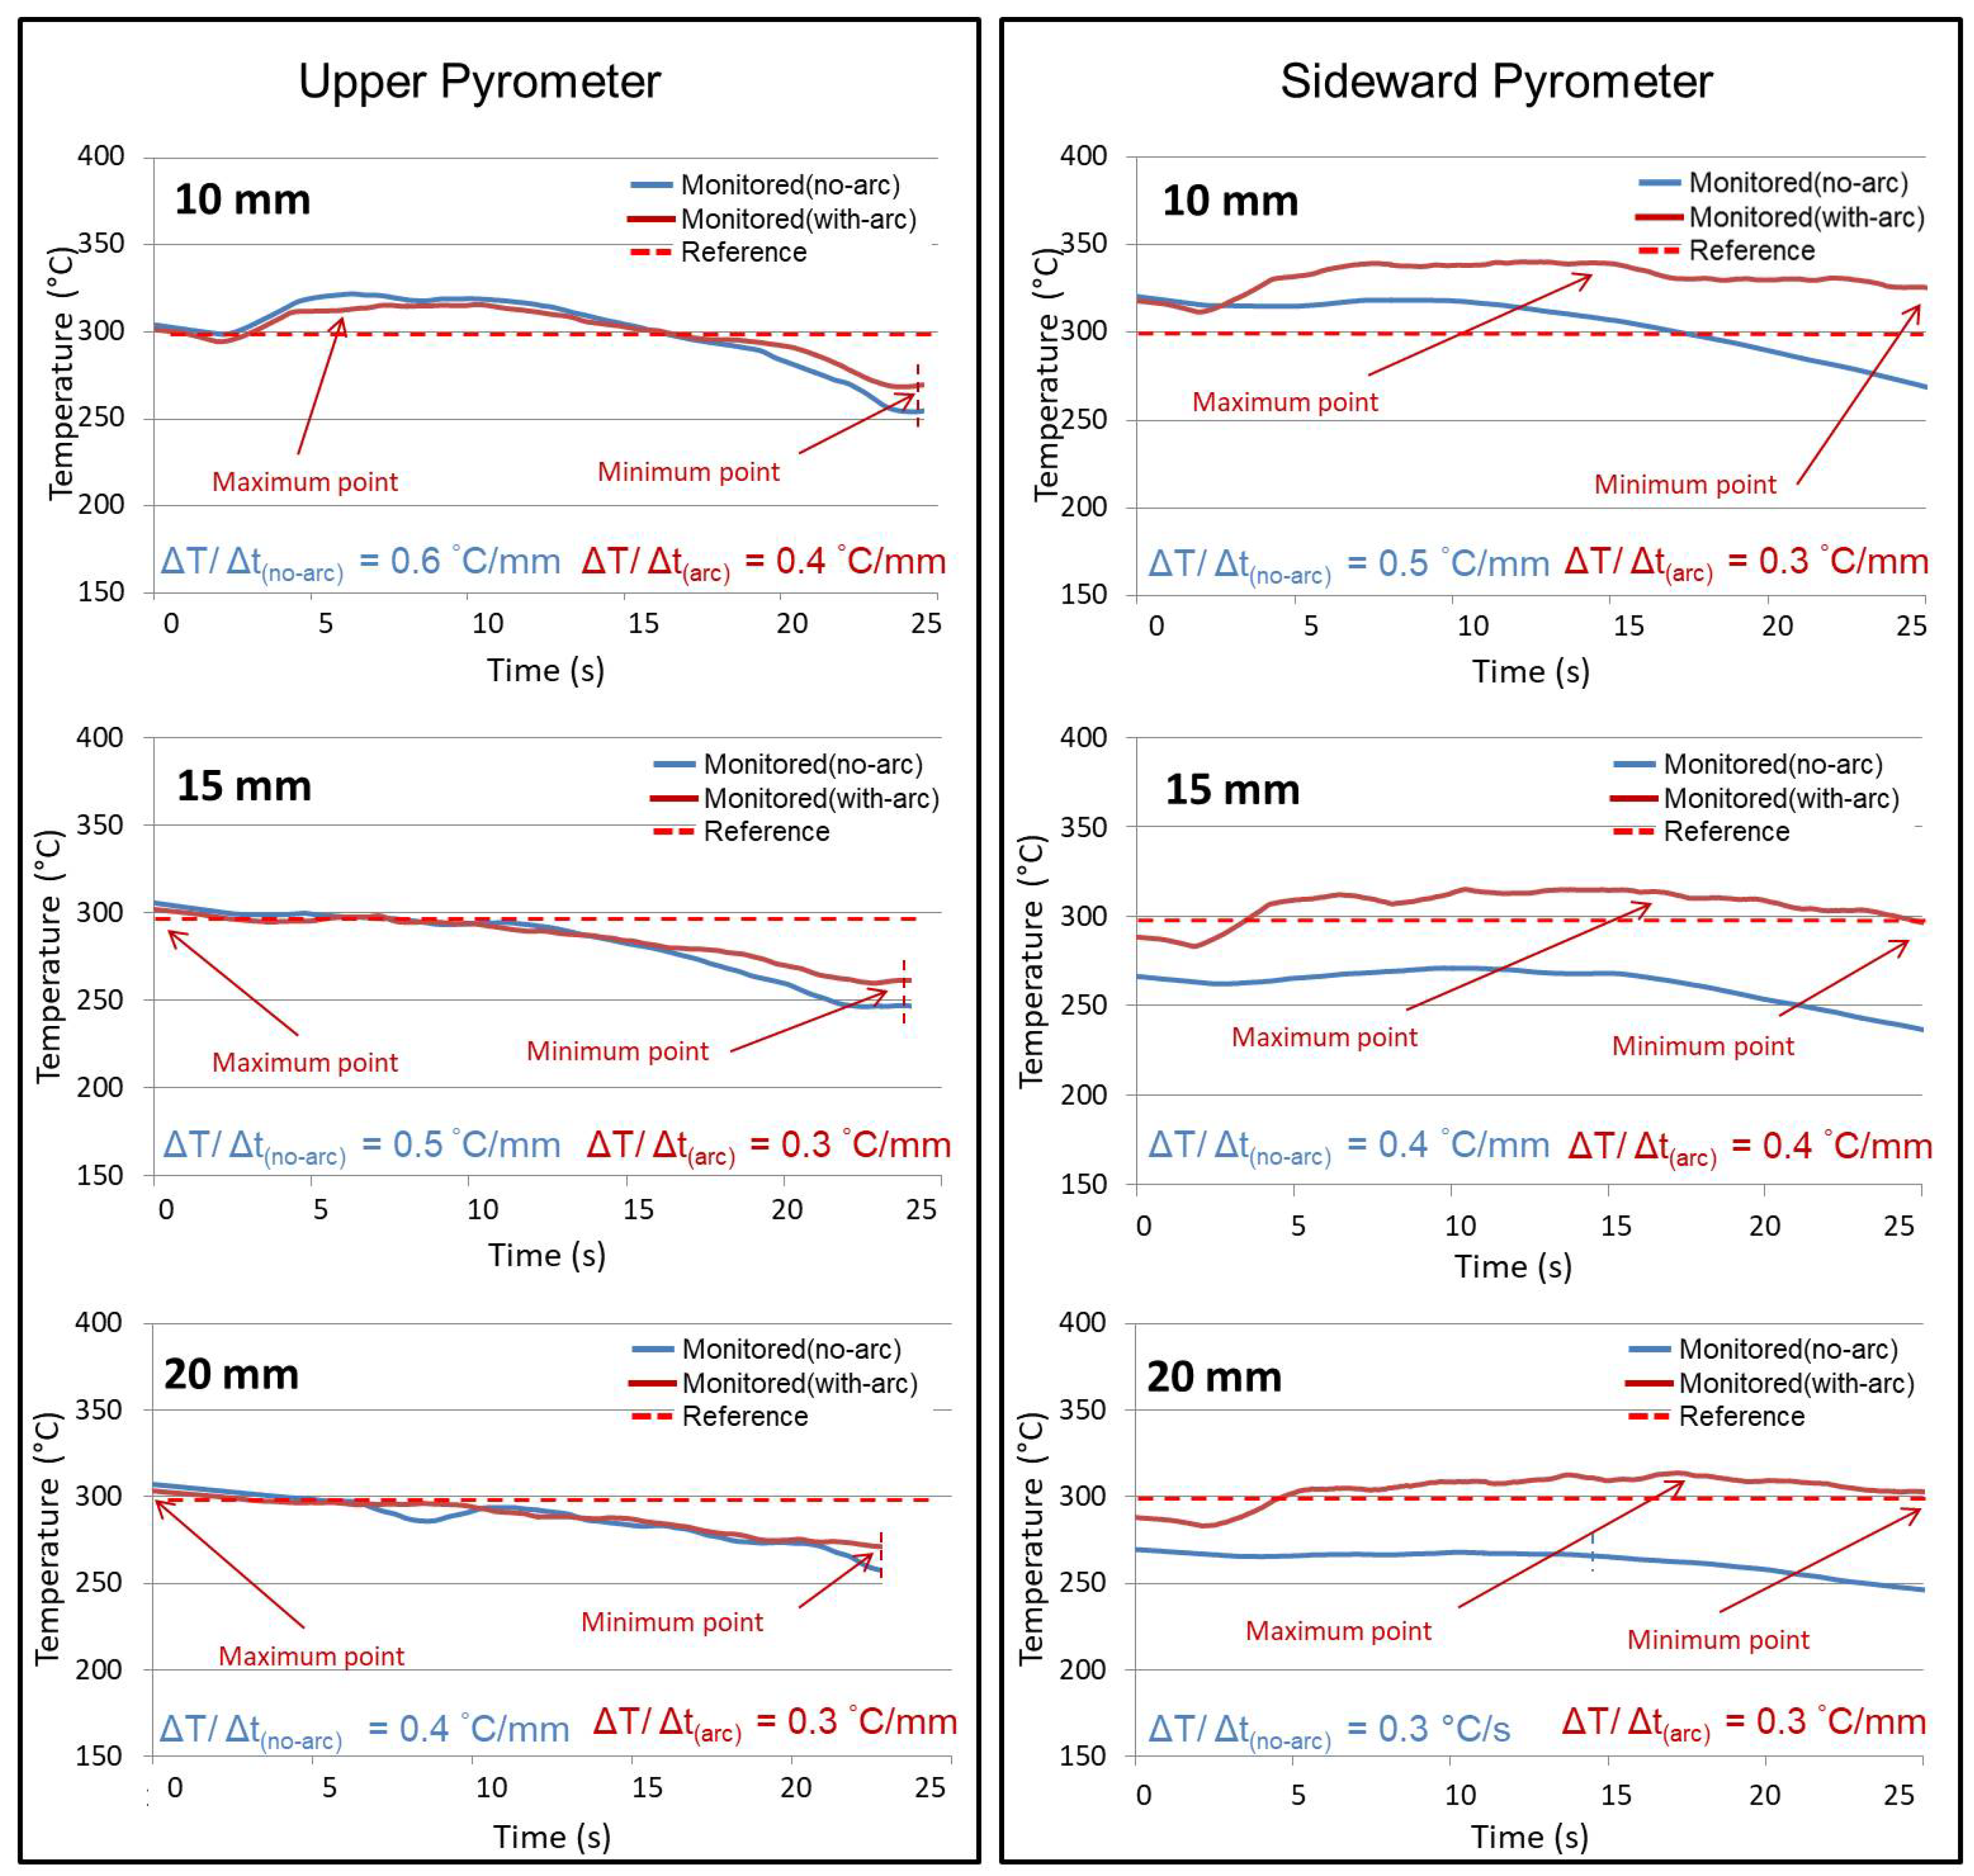
The actual temperature profiles during the deposition (with arc) of layers obtained using the two strategies are shown in Figure 12. To evaluate the effect of the arc, the experimental temperature profiles without the presence of the arc are also replicated in this figure. Considering first the Upper Pyrometer strategy (left side of Figure 12), the temperature profiles with and without the arc maintain the same behavior and very similar values for the three “L” settings (assuming inconstancies from experimental sources), except after 15–20 s of deposition. This suggests that the arc heat does not significantly affect the measurement points (as idealized by Figure 11a). However, when comparing the temperature gradients along the layer length between a no-arc (ΔT/Δl(no-arc)) and with the arc (ΔT/Δl(arc)) conditions, one can see a temperature drop for all “L” distances when the arc was present. This is a piece of evidence that there is some arc heat effect, fully justified by the conductive heat diffusion. In addition, it can be seen that the longer “L” the steeper the temperature gradient.
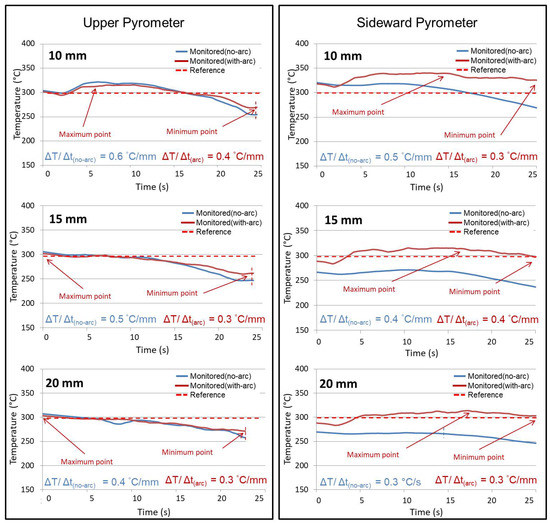
Figure 12.
Typical temperature profiles resultant from the two pyrometer approaches with the torch movement with/without arc, for different measurement distances “L”, where ΔT/Δl is the temperature gradient per unit of layer between the maximum and the minimum temperatures points.
Considering now the Sideward strategy, the temperature profiles with an arc exhibit changes compared to the no-arc condition for the three evaluated measurement points (as predicted in Figure 11b). Roughly, there is a tendency for the actual temperature not to change along with the deposition (except for signal oscillations due to the experimental uncertainties). However, it is verified that the actual temperatures are higher or equal to the reference temperature (being higher for shorter “L”). However, as already warned, the reference temperature is defined by the Upper Pyrometer. Hypothetically, if the reference temperature were determined instead by the sideward pyrometer (considering the deposition of a new layer when the sideward pyrometer reached a given temperature), the actual interlayer temperature would be equal to the defined reference temperature (whatever its value was).
Comparing the two measurement strategies and taking the condition with the arc, the average temperature tends to be more constant for a longer layer deposition distance through the sideward pyrometer, yet with more oscillation (see Figure 9 how the lower temperature isotherms are flatter than higher temperatures ones). There is no clear trend for ΔT/Δl(arc) concerning the different measuring positions (“L”), as seen for the non-arc condition. By using the Sideward strategy, it is possible to approach an “L” distance (longer) in which the temperature monitored along with the deposition would not suffer a very significant influence by the natural thermal gradient along the deposited layer length (see Figure 10 that iso-temperatures distance increases when “L” is increased). However, this would be at the expense of reducing the measurement sensitivity, due to a more uniform temperature distribution when “L” turns longer (increasing uncertainties).
3.3. General Discussion: Strategies, Limitations and Features
The results presented in Section 3.1 and Section 3.2 show that the two pyrometry measurement strategies present different features. The features are related to both different temperatures reached with each strategy at the same measuring point positions and their variation along the deposited layer length. In particular, Section 3.1 aimed to demonstrate a natural temperature drop along the wall, from the beginning to the end of the torch translation time. This means that the temperature of a thin wall is not the same throughout its extension before starting the deposition of a new layer. This fall in temperature depends on the measurement strategy, measurement position, reference temperature, material, wall dimension, and arc energy. Thus, taking a temperature value at a point on the wall (by definition called interlayer temperature or IT, a term not entirely correct), is no guarantee of the same thermal condition throughout the deposition of a layer.
Assuming the use of pyrometry measurement for keeping the same IT in an open-loop control (no feedback), in general, both strategies would work well. Even the Upper Pyrometer strategy with a stationary pyrometer (instead of the moving position one described in Figure 2) because the measurand for open-loop control would be a reference temperature at a given position that should be repeated for all layers (whatever its value is). However, care must be taken considering the case of the Upper Pyrometer strategy for this purpose. When applied to long walls, the difference between the chosen reference temperature and the actual temperature over the entire wall length can be significant. Therefore, it would not allow achieving the overall objective of this measurement (which is to maintain the geometric quality of thin-wall WAAM constructions). The usage of the Sideward strategy, in turn, appears to be more adequate for open-loop control, since the actual average temperature changes little along with the deposition for a given reference temperature. However, the sensitivity can be low if the “L” distance is long (the temperature will be more homogenous with a minor variation of the temperature per length gradient). On the other hand, the measurement will be more inaccurate (influence of the arc) if the “L” distance is too short.
However, one must be aware that geometrical constancy layer after layer is not the only target when processing WAAM. The temperature field under the bead also governs the microstructural formation of the wall. This moves the result discussion to the meaning of the measured temperature (what it represents), in addition to the temperature value (as a measurement quantity). Under this view, the Sideward strategy would provide the most adequate temperature representation. However, as demonstrated in the experiments, the actual temperature variation along the layer length measured by the upper pyrometer did not imply a variation of temperature under the bead—as the Upper Pyrometer was translating with the Sideward Pyrometer along the wall, while the temperature was falling in the first sensor, it was kept constant to some extent in the second one. Thus, either of the two approaches can be used in open-loop control for metallurgical control. The reference value could be higher or lower, depending on the distance “L”, as long as it is defined as the measurement point and the reference value for the IT (i.e., 200 °C, 300 °C, 400 °C, or other value). These parameters will depend on the results already experienced in the procedure qualification. The principal would always use the same method and the same reference temperature.
From the measurement flexibility perspective, the Upper Pyrometer strategy would provide easier sensor mechanical positioning. This strategy allows monitoring even from the first layers, which cannot be achieved with the Sideward Pyrometer strategy. On the other hand, the Sideward strategy can evaluate the temperature in both deposition directions (the Upper Pyrometer strategy would only allow measurement in all layers if the deposition was not bidirectional; another possibility is using two pyrometers, one on each side of the torch). The Sideward strategy virtually eliminates the limitation of the Upper Pyrometer strategy at the end of the wall (when the target of the sensor exits the wall). It is worth mentioning that the use of limited length linear walls in WAAM is not the typical case for applications in manufacturing parts in the industry. However, a finite length linear wall is a fundamental method for the study of the process performance, materials, and development of new technologies.
Expanding the use of the strategies for more complex geometries (considering curves and direction changing), both strategies can face challenges in terms of measurement flexibility. It would be necessary to implement a system to rotate the pyrometers concerning the torch central axis (the sensor target point must not leave the wall surface, and the distance from the measurement point to the arc must not change) to maintain the focal distance. The larger geometric variations on the sideward face of the walls and the need for the rotation system could project an even greater challenge for the Sideward strategy.
Finally, it is important to consider the potential capacity for production feedback control (closed-loop control). Whether for geometric or microstructural homogeneity, the objective is to correct the deposition process parameters to maintain the molten pool at the same temperature during the deposition. The more constant the measured temperature, the better, since the temperature at a given position from the fusion line is proportional to the pool volume, i.e., wall geometry, and cooling rates, i.e., metallurgical definitions. With the Upper Pyrometer strategy, the temperature variation along the wall length does not correlate with the pool temperature. Therefore, the results suggest that only the Sideward Pyrometer strategy could be applied in this case. However, there would still be the measurement sensitivity problem (the greater or lesser temperature variation per unit “L” distance). In the Sideward strategy, even without significantly varying temperature monitored along the layer, the higher the “L”, the lower the temperature for a given welding energy. Furthermore, the smaller the quantity to be measured, the more significant the measurement uncertainties due to the drop in sensitivity (from a metrological point of view).
In summary, Table 2 presents the functionalities of the two strategies used for monitoring the IT, considering the representativeness criteria of the IT, measurement flexibility, and the potential for closed-loop control, as above discussed. The choice will depend on the work goals. The experiments led to a better understanding of the interlayer temperature (an essential variable in WAAM) meaning, often confused with the traditional welding term interpass temperature.
Table 2.
Summary of limitations and functionalities of the two measurement strategies.
4. Conclusions
This work evaluated the suitability and limitations of using infrared pyrometry to measure interlayer temperature (IT) in WAAM of thin walls aiming at open-loop and close-loop control to maintain the wall geometric and metallurgical structure along with the layer depositions. The work development was based on confronting two proposed temperature measurement strategies, Upper Pyrometer and Sideward Pyrometer. The distance between the measurement points and heat source, called “L”, was changed at different levels (10, 15 and 20 mm), but always kept the same set value for the two pyrometers simultaneously. Based on the experiments, the main conclusions are:
The temperature measured at a specific point on a part manufactured by WAAM when referred to as interlayer temperature (IT) should be taken as a reference and not as an absolute value. The absolute value changes accordingly to the measuring approach, sensor positioning and calibration and it varies along the length of the wall.
Using as a temperature reference, both strategies (Upper Pyrometer and Sideward Pyrometer) can be used in open-loop control to reach repeatability (geometrical and metallurgical) between layers stacked one over the others. Both strategies have limitations. The Upper Pyrometer, concerning long wall lengths and wall extremities. The Sideward, is related to low measurement sensitivity and is not feasible for the first layers. However, the Upper Pyrometer strategy is more flexible (easier to apply from an equipment point of view).
Still taking it as a temperature reference, the Sideward Pyrometer strategy, which represents the molten pool temperature better, is recommended for feedback control of production (close-loop control). The Upper Pyrometer strategy fails for this application for not maintaining the same temperature value along with the layer deposition.
Author Contributions
V.L.J. and F.R.T. Conceptualization and methodology: V.L.J., F.R.T. and A.S. Experimental development: V.L.J. and F.R.T. Analyses of results and manuscript writing: V.L.J., F.R.T., A.S. All authors have read and agreed to the published version of the manuscript.
Funding
This study was supported by the Brazilian National Council for Scientific and Technological Development (CNPq), through grants 165902/2020-5 and 302863/2016-8, and by the Brazilian Coordination for the Improvement of Higher Education Personnel (CAPES), through Finance Code 001.
Institutional Review Board Statement
Not applicable.
Informed Consent Statement
Not applicable.
Data Availability Statement
This study did not report any data.
Acknowledgments
The authors acknowledge the Center for Research and Development of Welding Processes (Laprosolda) at the Federal University of Uberlândia for the laboratory infrastructure and technical support.
Conflicts of Interest
The authors declare no conflict of interest.
References
- Jin, W.; Zhang, C.; Jin, S.; Tian, Y.; Wellmann, D.; Liu, W. Wire Arc Additive Manufacturing of Stainless Steels: A Review. Appl. Sci. 2020, 10, 1563. [Google Scholar] [CrossRef] [Green Version]
- Wu, B.; Pan, Z.; Ding, D.; Cuiuri, D.; Li, H.; Xu, J.; Norrish, J. A review of the wire arc additive manufacturing of metals: Properties, defects and quality improvement. J. Manuf. Process. 2018, 35, 127–139. [Google Scholar] [CrossRef]
- Derekar, K.; Lawrence, J.; Melton, J.; Addison, A.; Zhang, X.; Xu, L. Influence of interpass temperature on wire arc additive manufacturing (WAAM) of aluminium alloy components. MATEC Web Conf. 2019, 269, 05001. [Google Scholar] [CrossRef]
- Knezović, N.; Garašić, I.; Jurić, I. Influence of the Interlayer Temperature on Structure and Properties of Wire and Arc Additive Manufactured Duplex Stainless Steel Product. Materials 2020, 13, 5795. [Google Scholar] [CrossRef] [PubMed]
- Müller, J.; Hensel, J.; Dilger, K. Mechanical properties of wire and arc additively manufactured high-strength steel structures. Weld. World 2021, 66, 395–407. [Google Scholar] [CrossRef]
- Spencer, J.D.; Dickens, P.M.; Wykes, C.M. Rapid prototyping of metal parts by three-dimensional welding. Proc. Inst. Mech. Eng. Part B J. Eng. Manuf. 1998, 212, 175–182. [Google Scholar] [CrossRef]
- Wu, B.; Ding, D.; Pan, Z.; Cuiuri, D.; Li, H.; Han, J.; Fei, Z. Effects of heat accumulation on the arc characteristics and metal transfer behavior in Wire Arc Additive Manufacturing of Ti6Al4V. J. Mater. Process. Technol. 2017, 250, 304–312. [Google Scholar] [CrossRef]
- Shen, C.; Pan, Z.; Cuiuri, D.; Ding, D.; Li, H. Influences of deposition current and interpass temperature to the Fe3Al-based iron aluminide fabricated using wire-arc additive manufacturing process. Int. J. Adv. Manuf. Technol. 2017, 88, 2009–2018. [Google Scholar] [CrossRef]
- Geng, H.; Li, J.; Xiong, J.; Lin, X. Optimisation of interpass temperature and heat input for wire and arc additive manufacturing 5A06 aluminium alloy. Sci. Technol. Weld. Join. 2016, 22, 472–483. [Google Scholar] [CrossRef]
- Wang, Z.; Zimmer-Chevret, S.; Léonard, F.; Abba, G. Prediction of bead geometry with consideration of interlayer temperature effect for CMT-based wire-arc additive manufacturing. Weld. World 2021, 65, 2255–2266. [Google Scholar] [CrossRef]
- Montevecchi, F.; Venturini, G.; Grossi, N.; Scippa, A.; Campatelli, G. Idle time selection for wire-arc additive manufacturing: A finite element-based technique. Addit. Manuf. 2018, 21, 479–486. [Google Scholar] [CrossRef]
- Bai, X.; Zhang, H.; Wang, G. Improving prediction accuracy of thermal analysis for weld-based additive manufacturing by calibrating input parameters using IR imaging. Int. J. Adv. Manuf. Technol. 2013, 69, 1087–1095. [Google Scholar] [CrossRef]
- Scotti, A. The Potential of IR Pyrometry for Monitoring Interpass Temperature in Wire + Arc Additive Manufacturing. Evol. Mech. Eng. 2019, 3, 1–4. [Google Scholar] [CrossRef]
- Ma, C.; Li, C.; Yan, Y.; Liu, Y.; Wu, X.; Li, D.; Han, Y.; Jin, H.; Zhang, F. Investigation of the in-situ gas cooling of carbon steel during wire and arc additive manufacturing. J. Manuf. Process. 2021, 67, 461–477. [Google Scholar] [CrossRef]
- Bai, X.; Zhang, H.; Wang, G. Modeling of the moving induction heating used as secondary heat source in weld-based additive manufacturing. Int. J. Adv. Manuf. Technol. 2014, 77, 717–727. [Google Scholar] [CrossRef]
- Rodrigues, T.; Duarte, V.; Avila, J.; Santos, T.G.; Miranda, R.; Oliveira, J.P. Wire and arc additive manufacturing of HSLA steel: Effect of thermal cycles on microstructure and mechanical properties. Addit. Manuf. 2019, 27, 440–450. [Google Scholar] [CrossRef]
- Ali, Y.; Henckell, P.; Hildebrand, J.; Reimann, J.; Bergmann, J.; Barnikol-Oettler, S. Wire arc additive manufacturing of hot work tool steel with CMT process. J. Mater. Process. Technol. 2019, 269, 109–116. [Google Scholar] [CrossRef]
- Cadiou, S.; Courtois, M.; Carin, M.; Berckmans, W.; Le Masson, P. 3D heat transfer, fluid flow and electromagnetic model for cold metal transfer wire arc additive manufacturing (Cmt-Waam). Addit. Manuf. 2020, 36, 101541. [Google Scholar] [CrossRef]


Publisher’s Note: MDPI stays neutral with regard to jurisdictional claims in published maps and institutional affiliations. |
© 2022 by the authors. Licensee MDPI, Basel, Switzerland. This article is an open access article distributed under the terms and conditions of the Creative Commons Attribution (CC BY) license (https://creativecommons.org/licenses/by/4.0/).