
Characterization of the Microstructure Changes Induced by a Rolling Contact Bench Reproducing Wheel/Rail Contact on a Pearlitic Steel

 ,
,  ,
,
Abstract
:1. Introduction
2. Materials and Methods
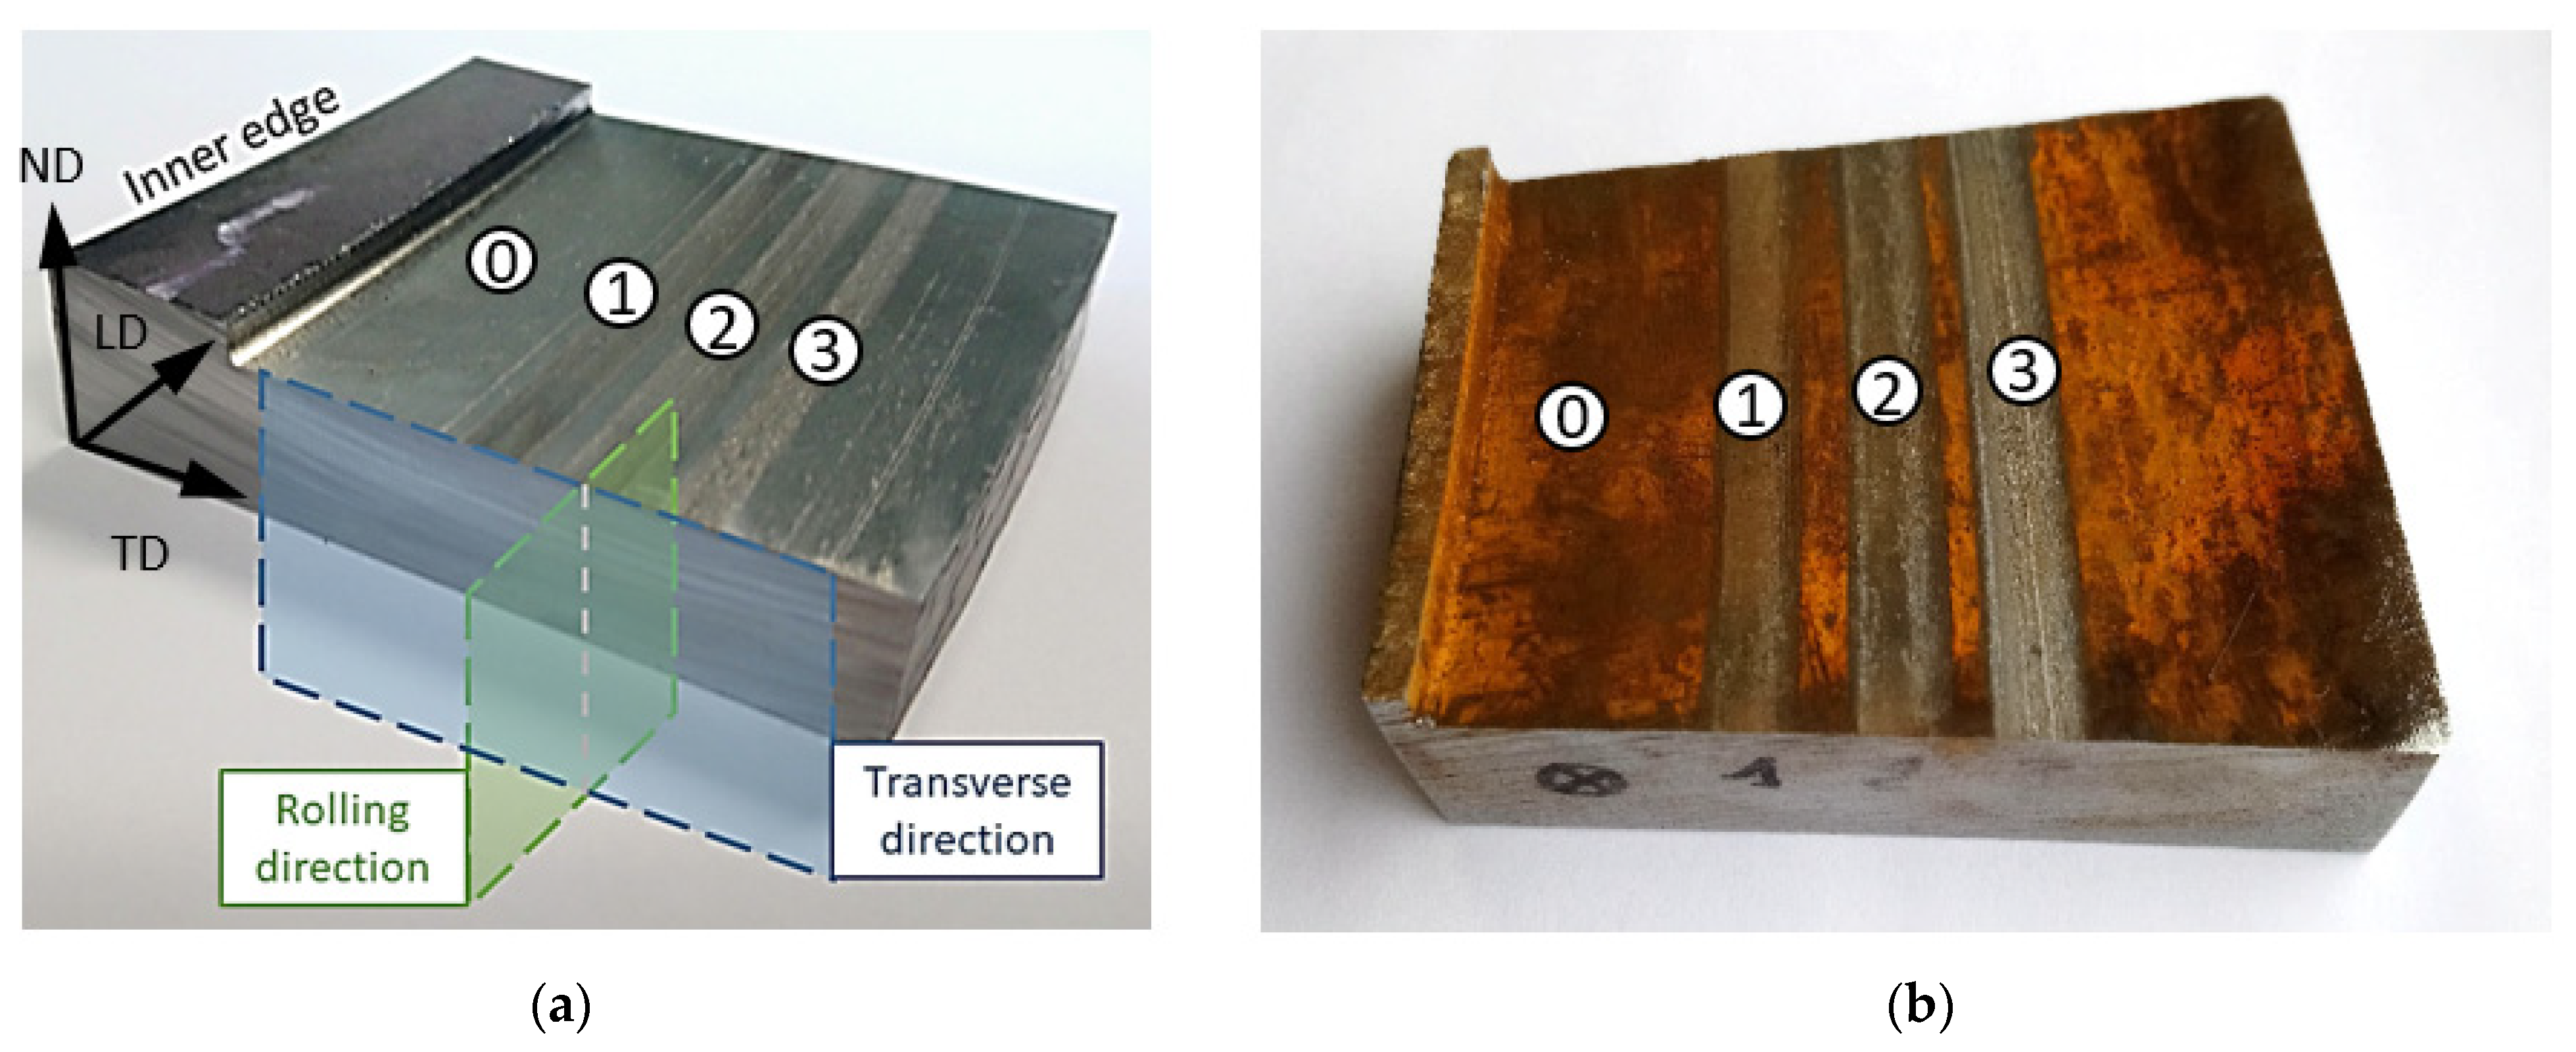
2.1. Test Bench Conditions and Material
2.2. Microstructure Analysis and Microhardness
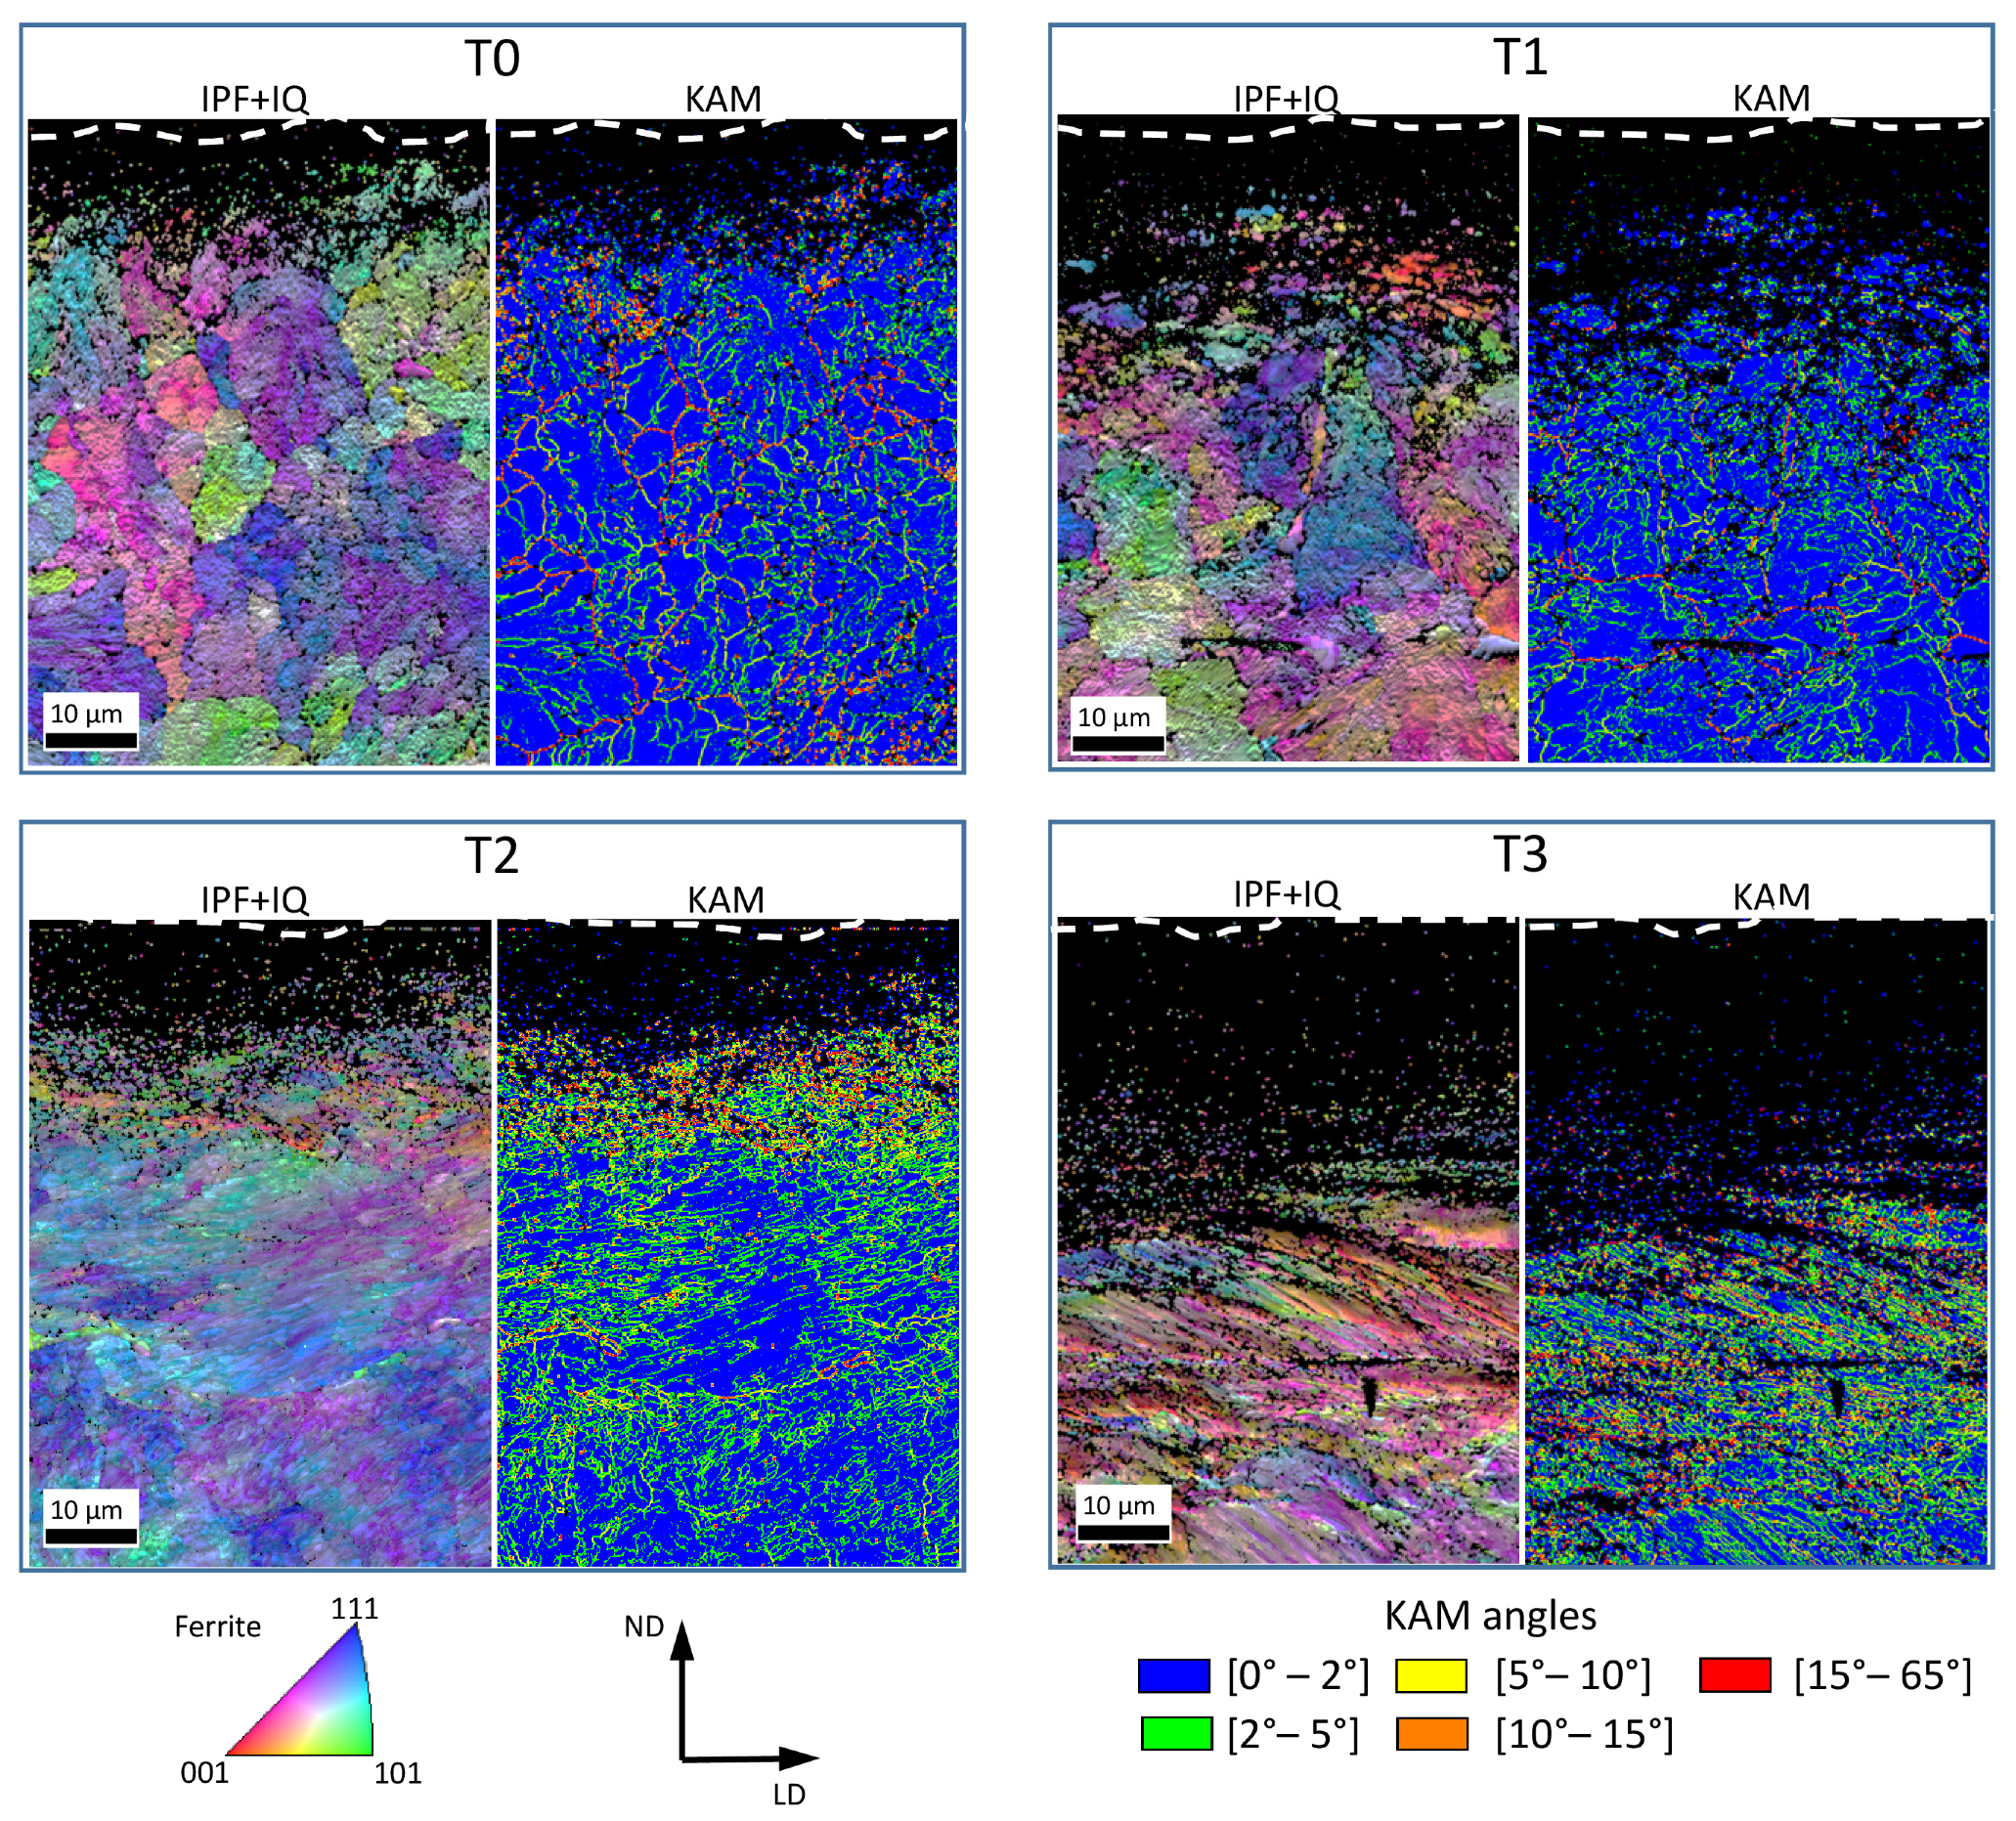
3. Results
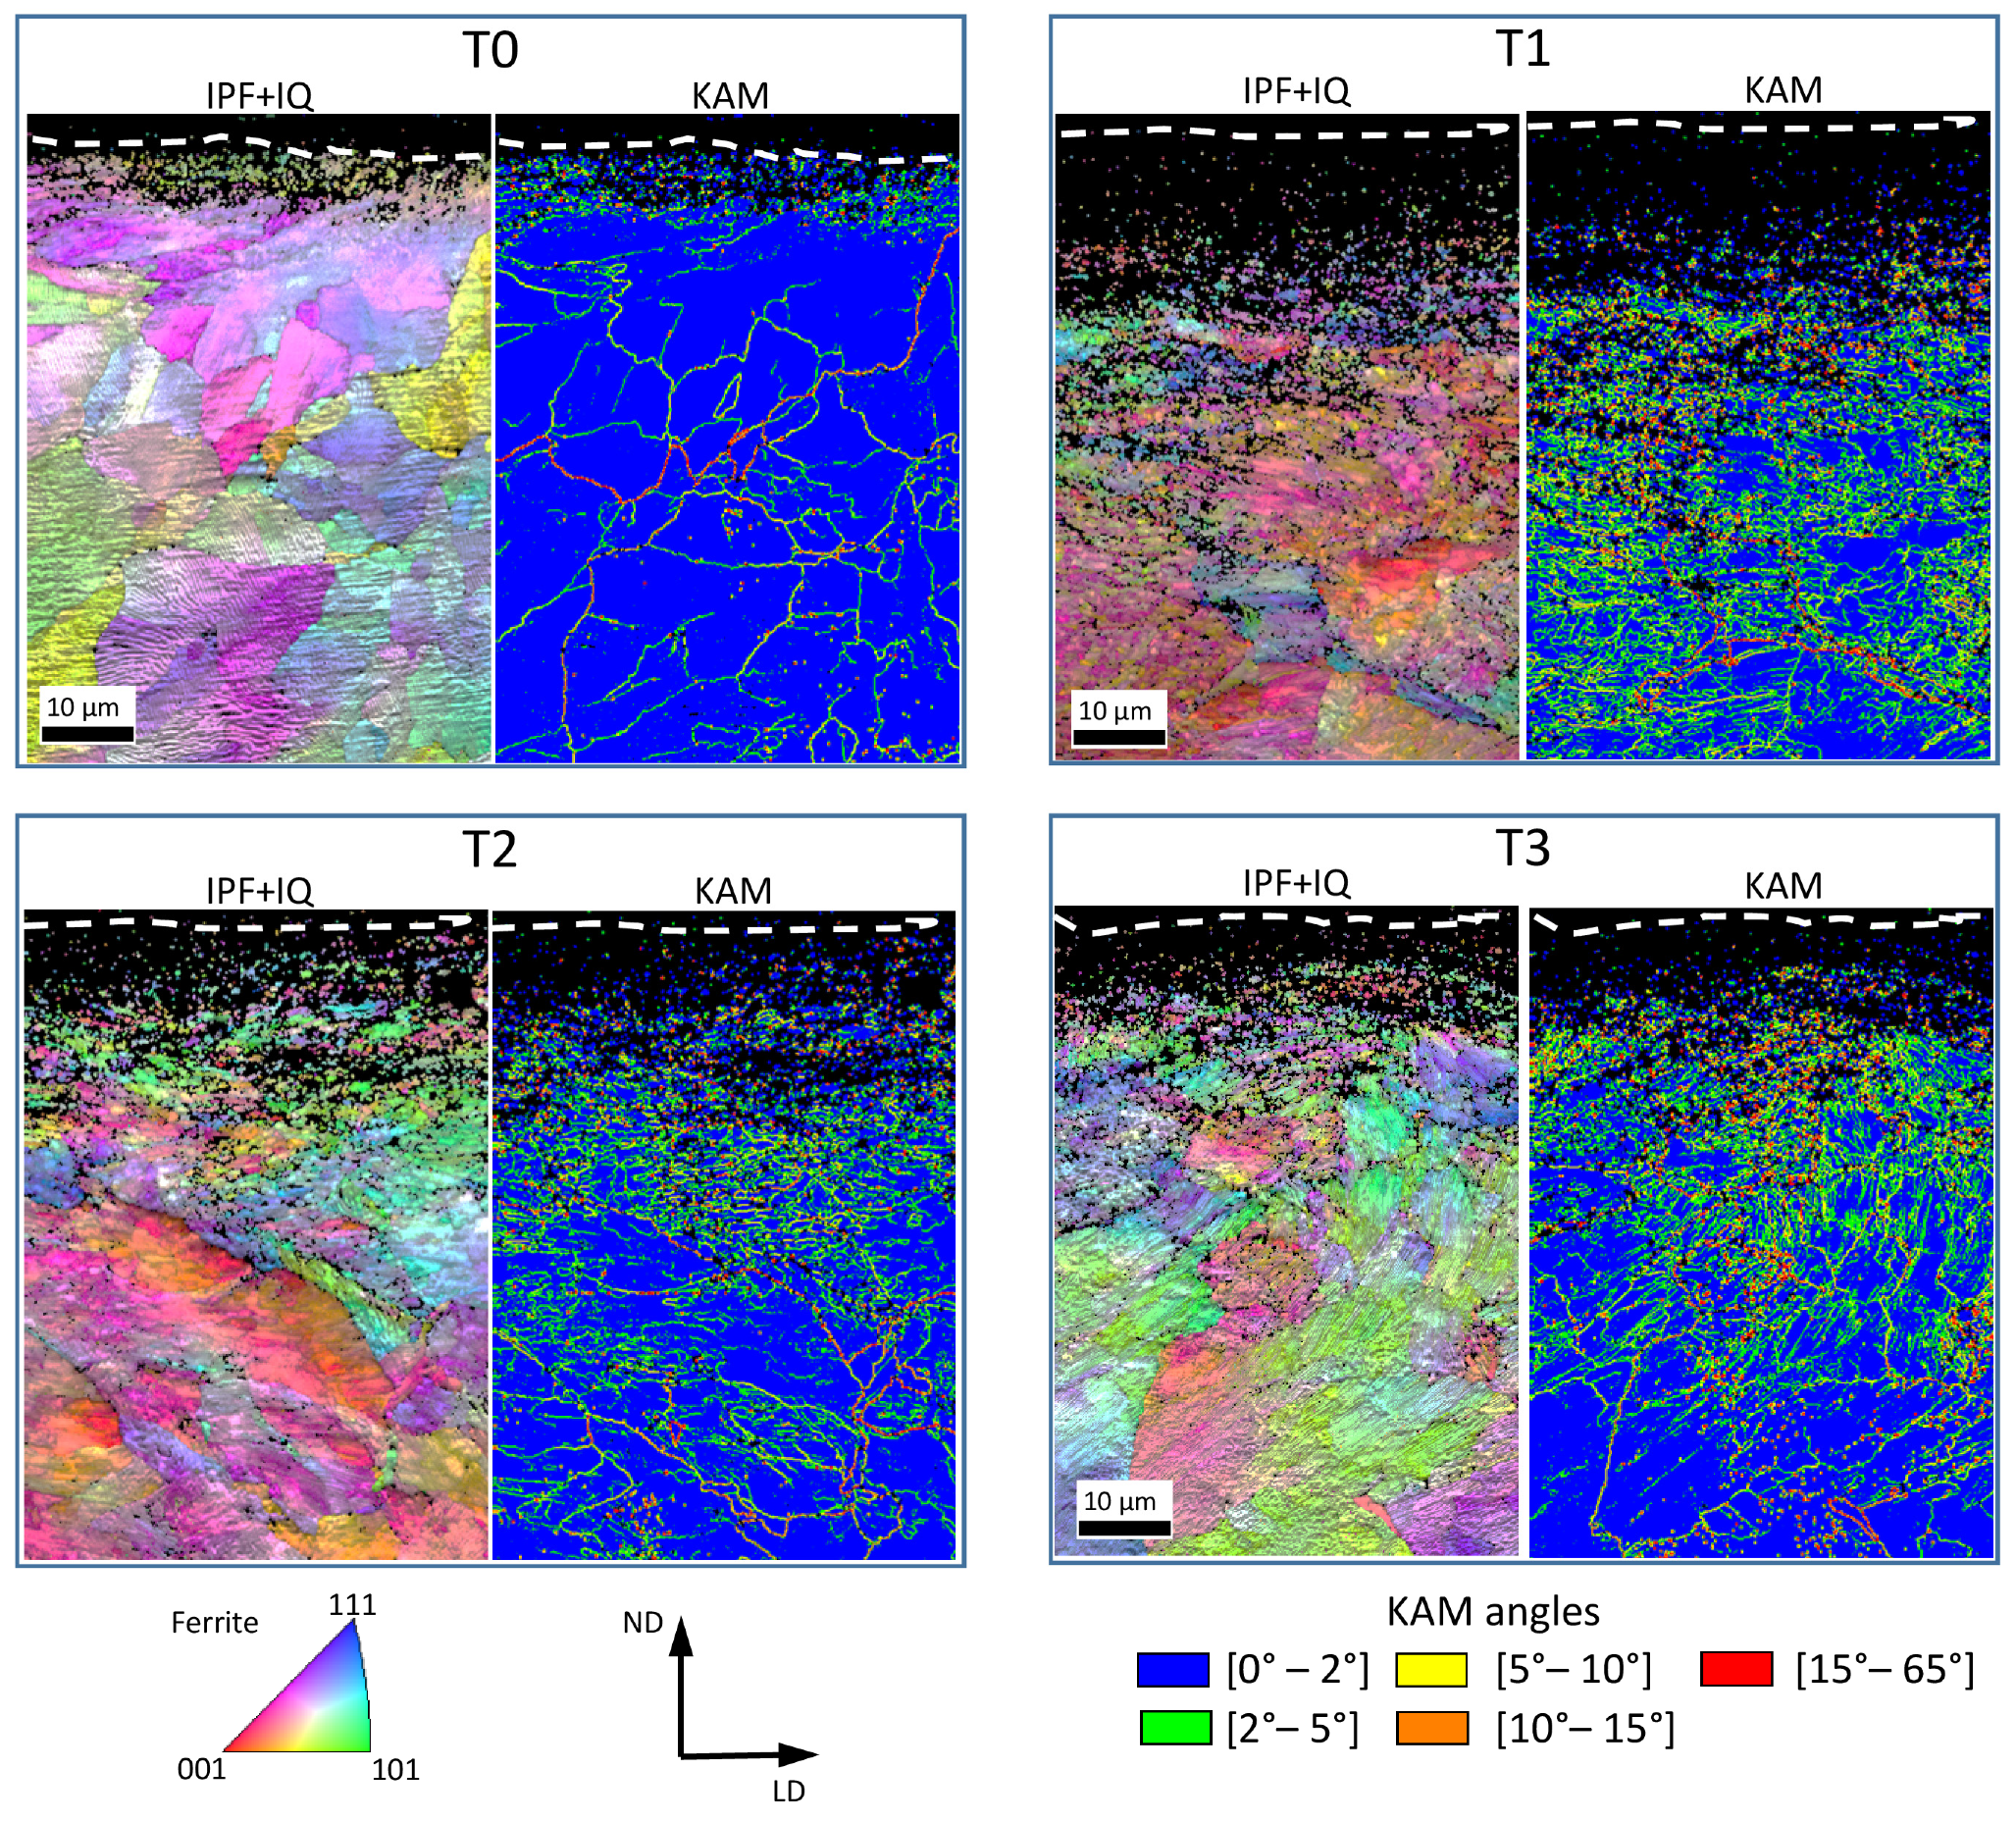
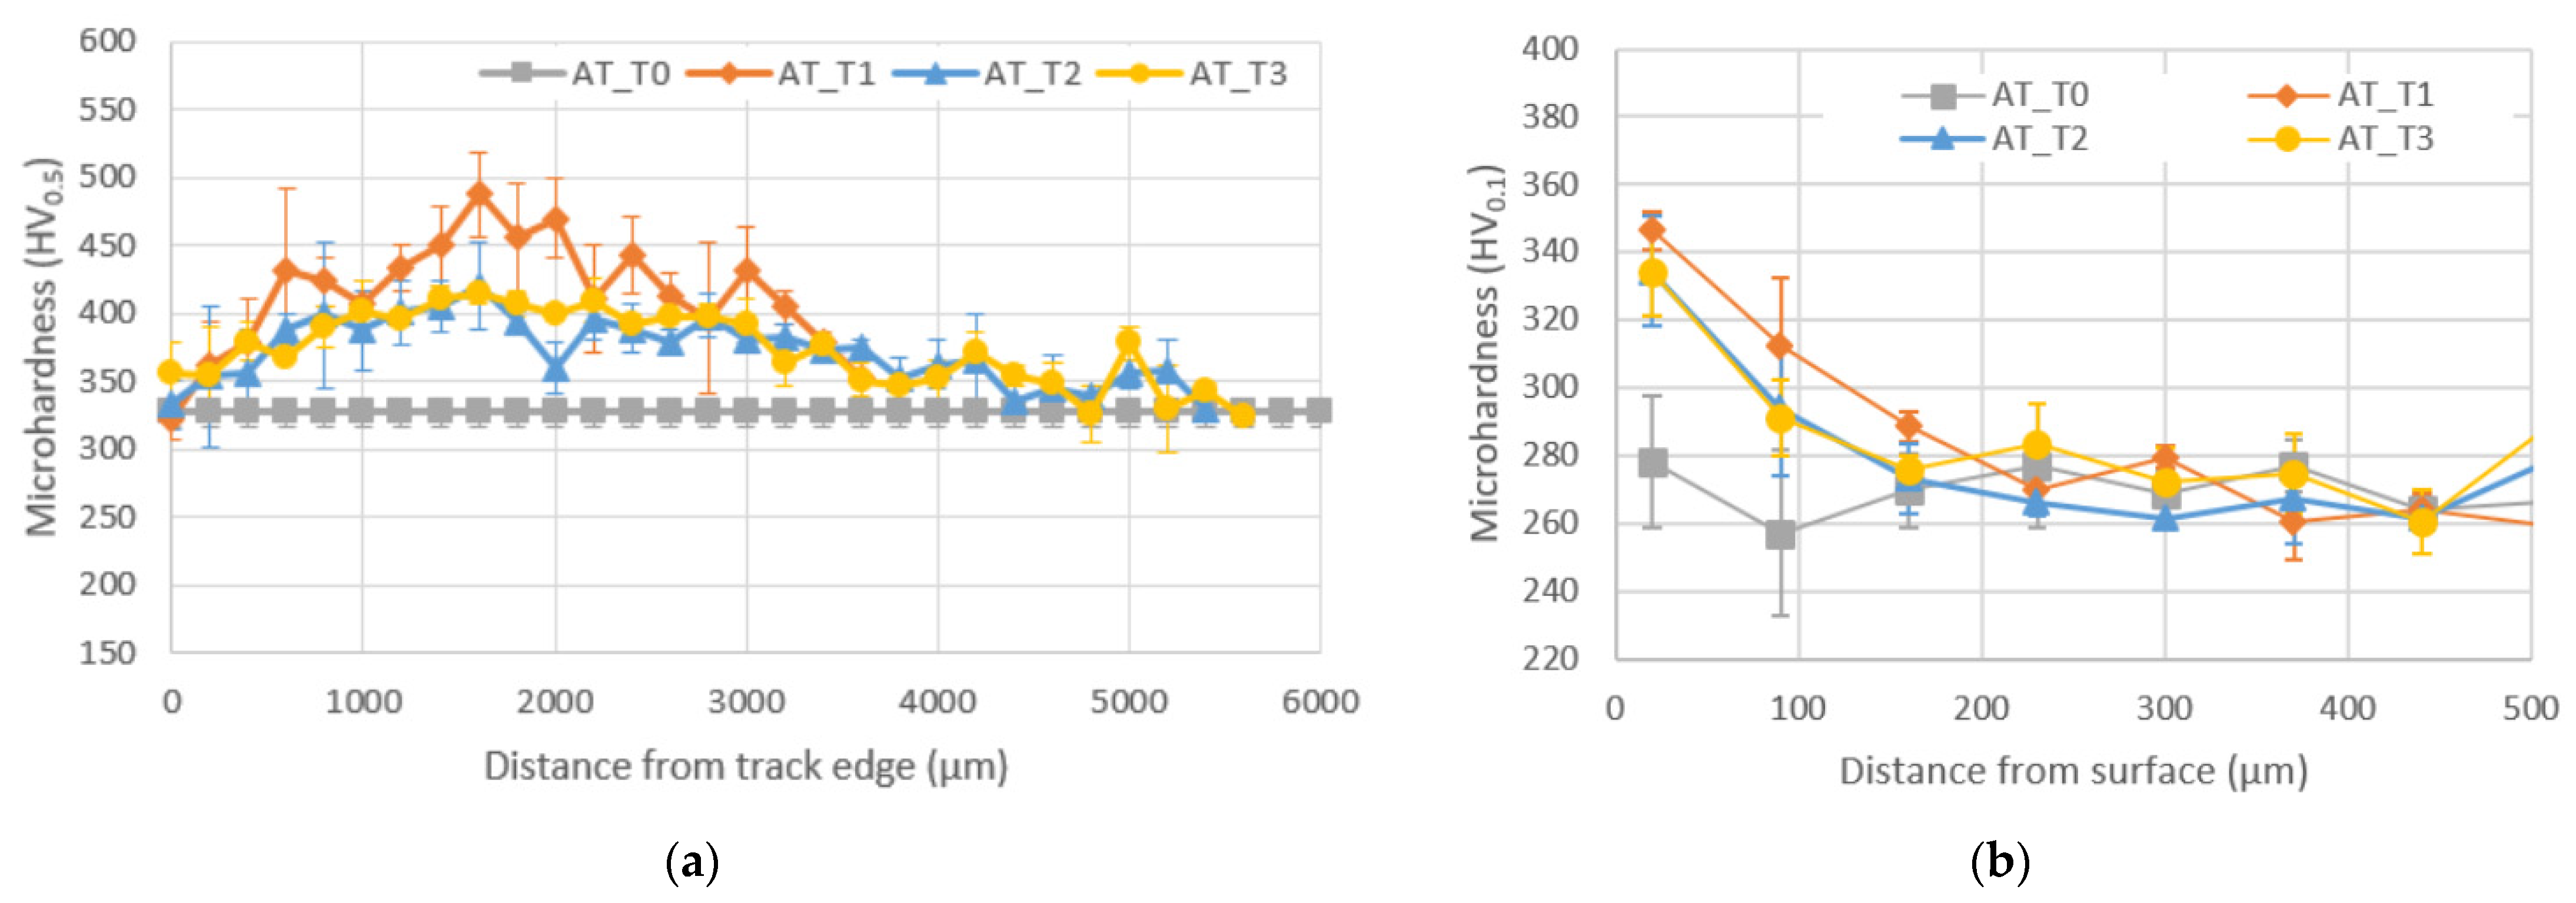
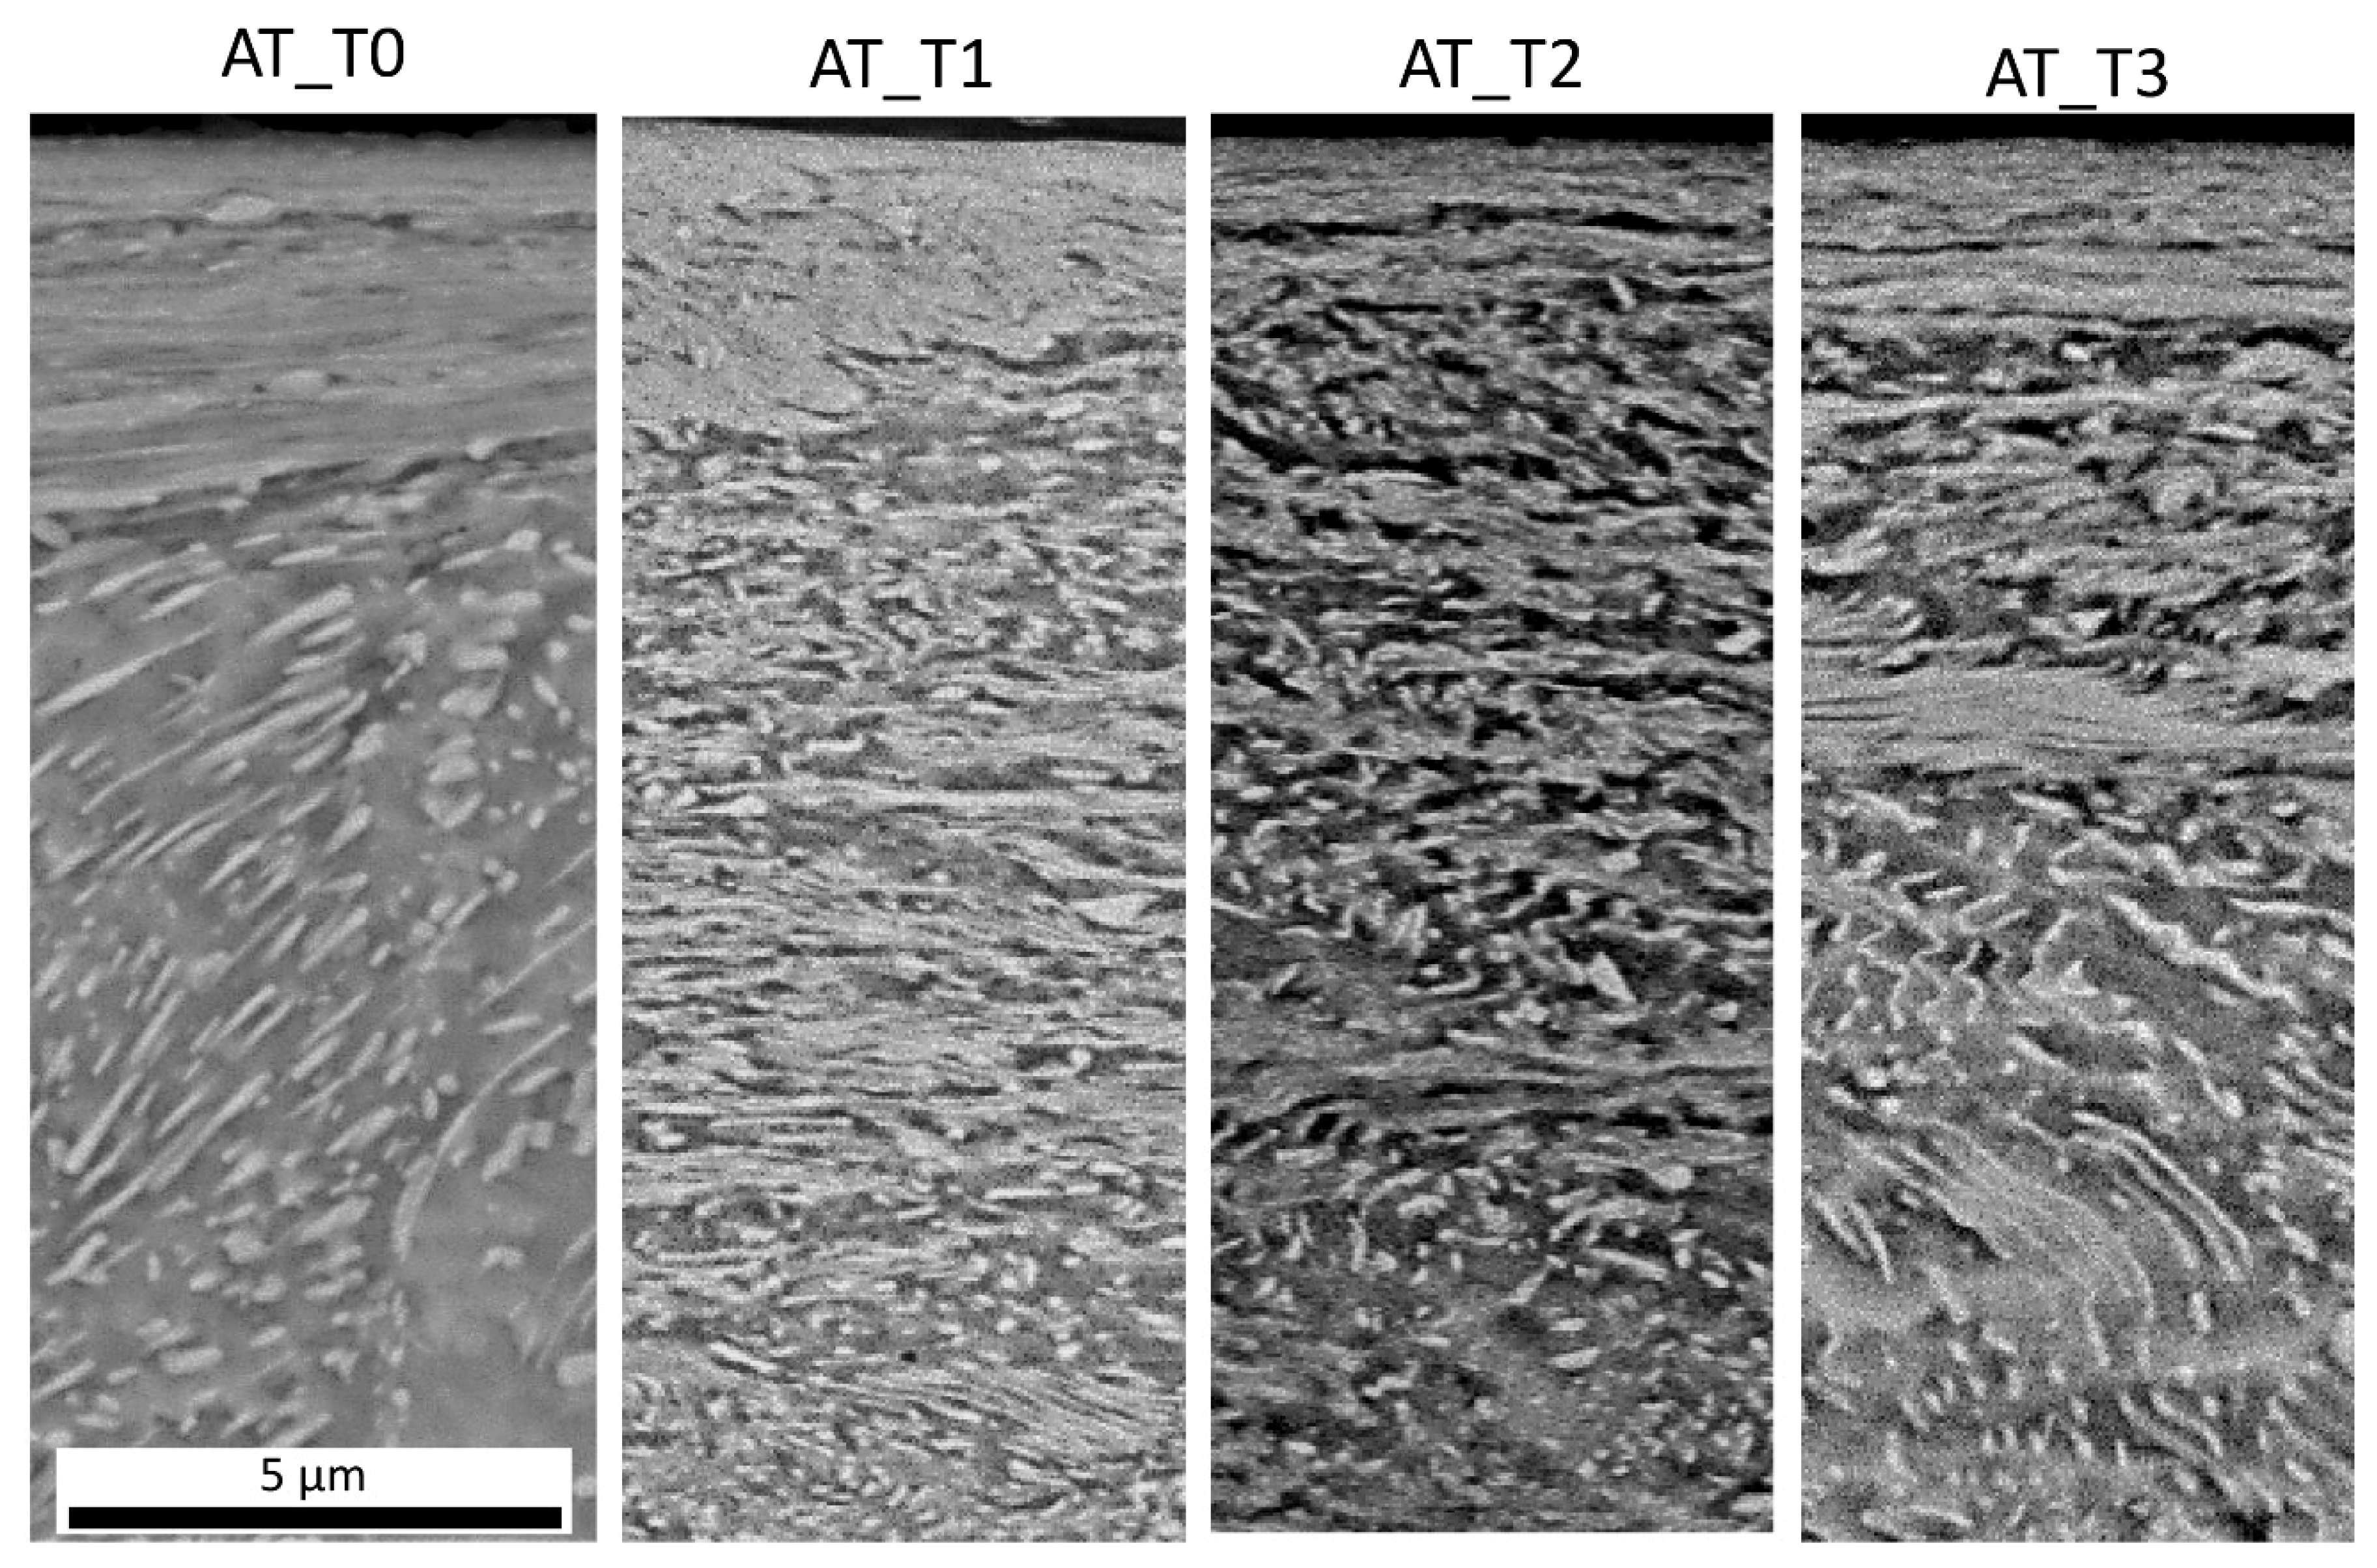
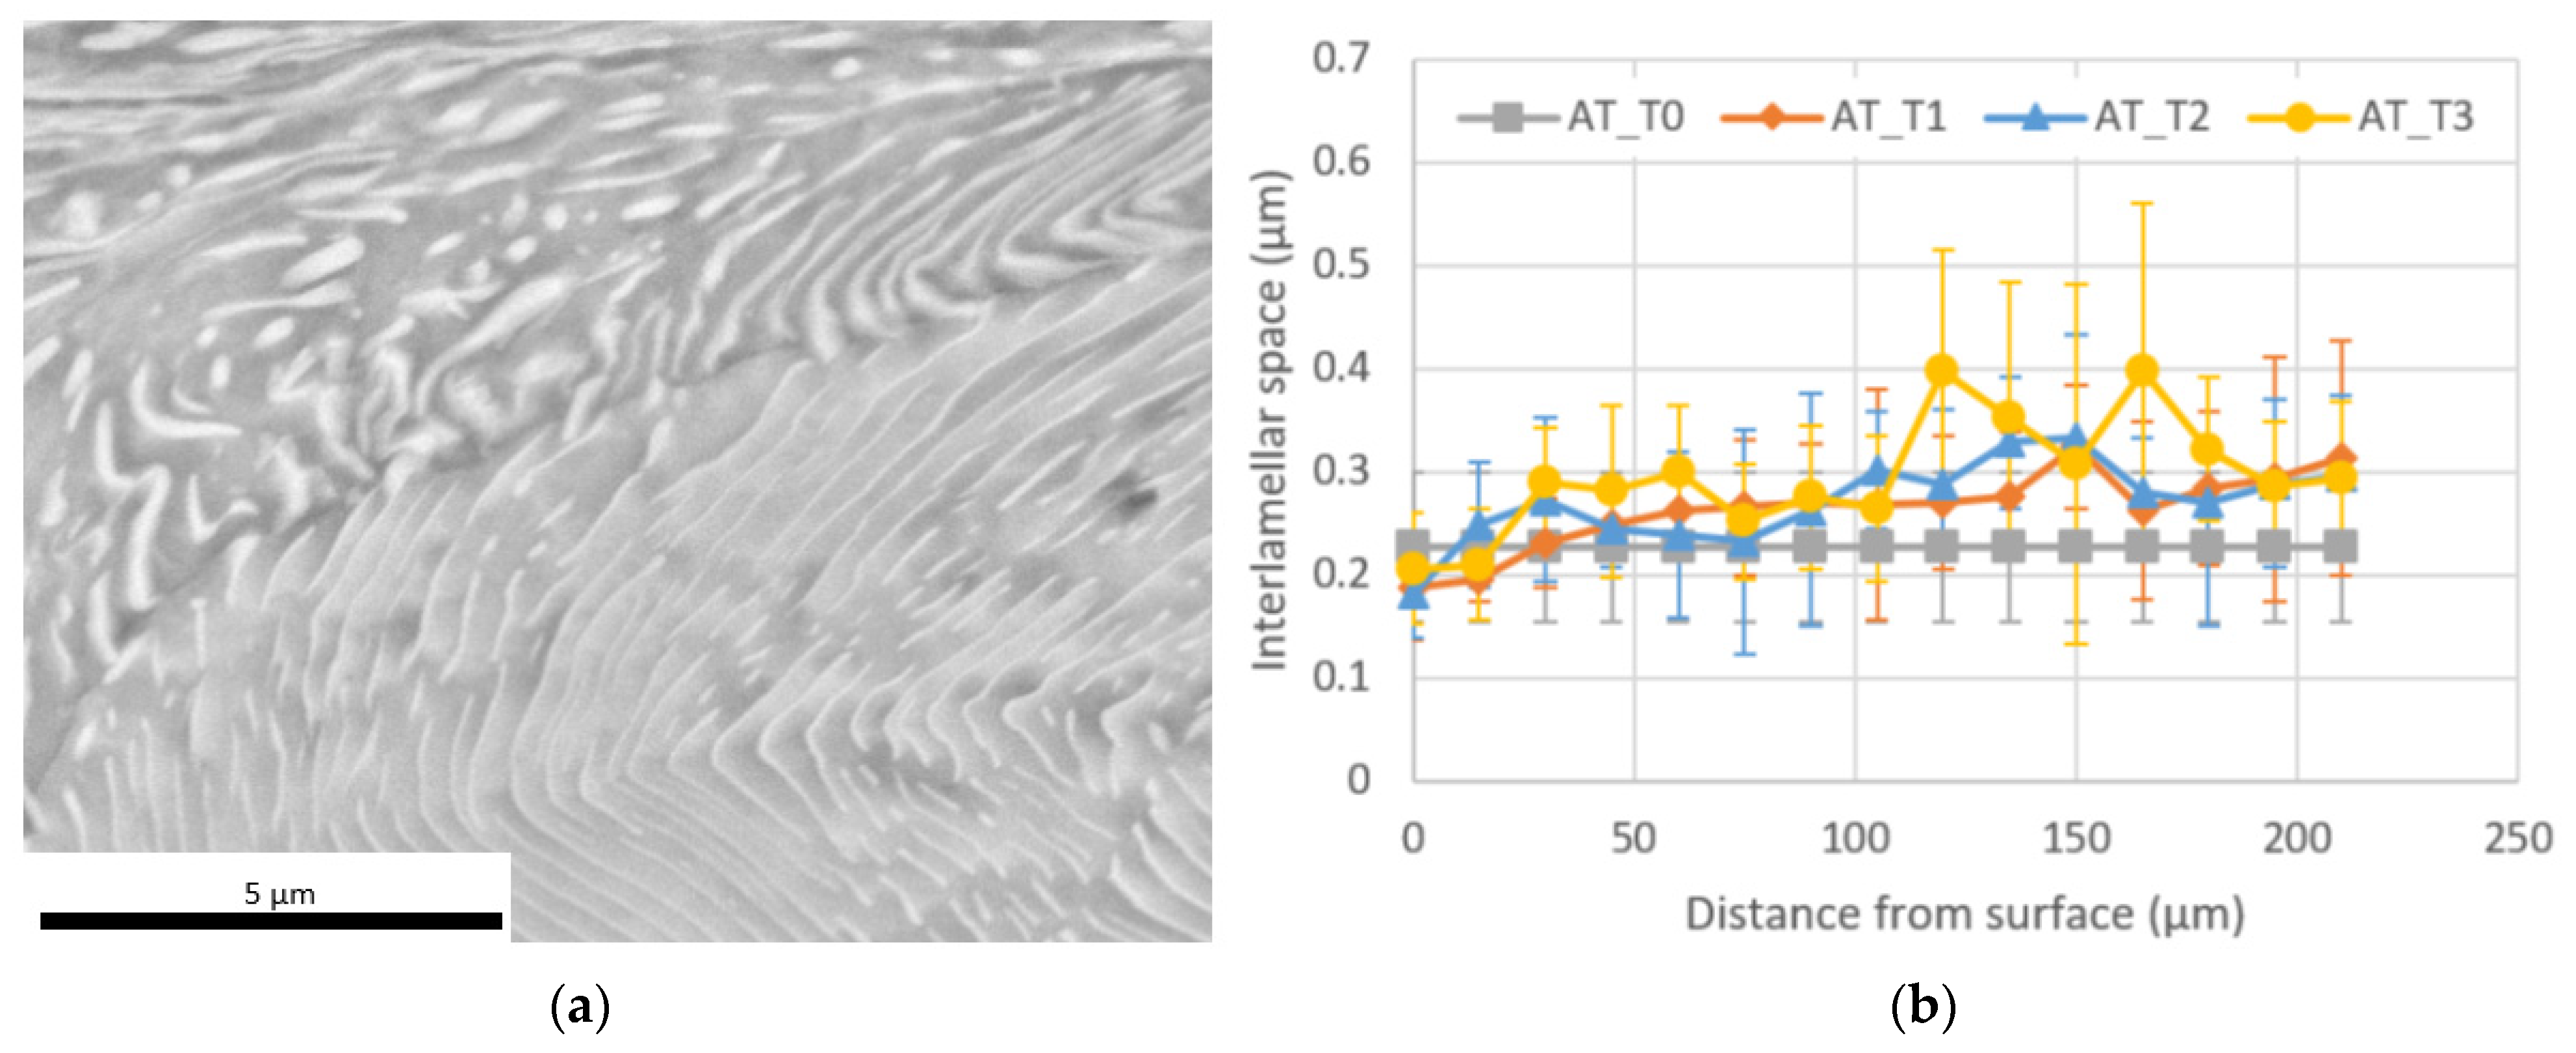
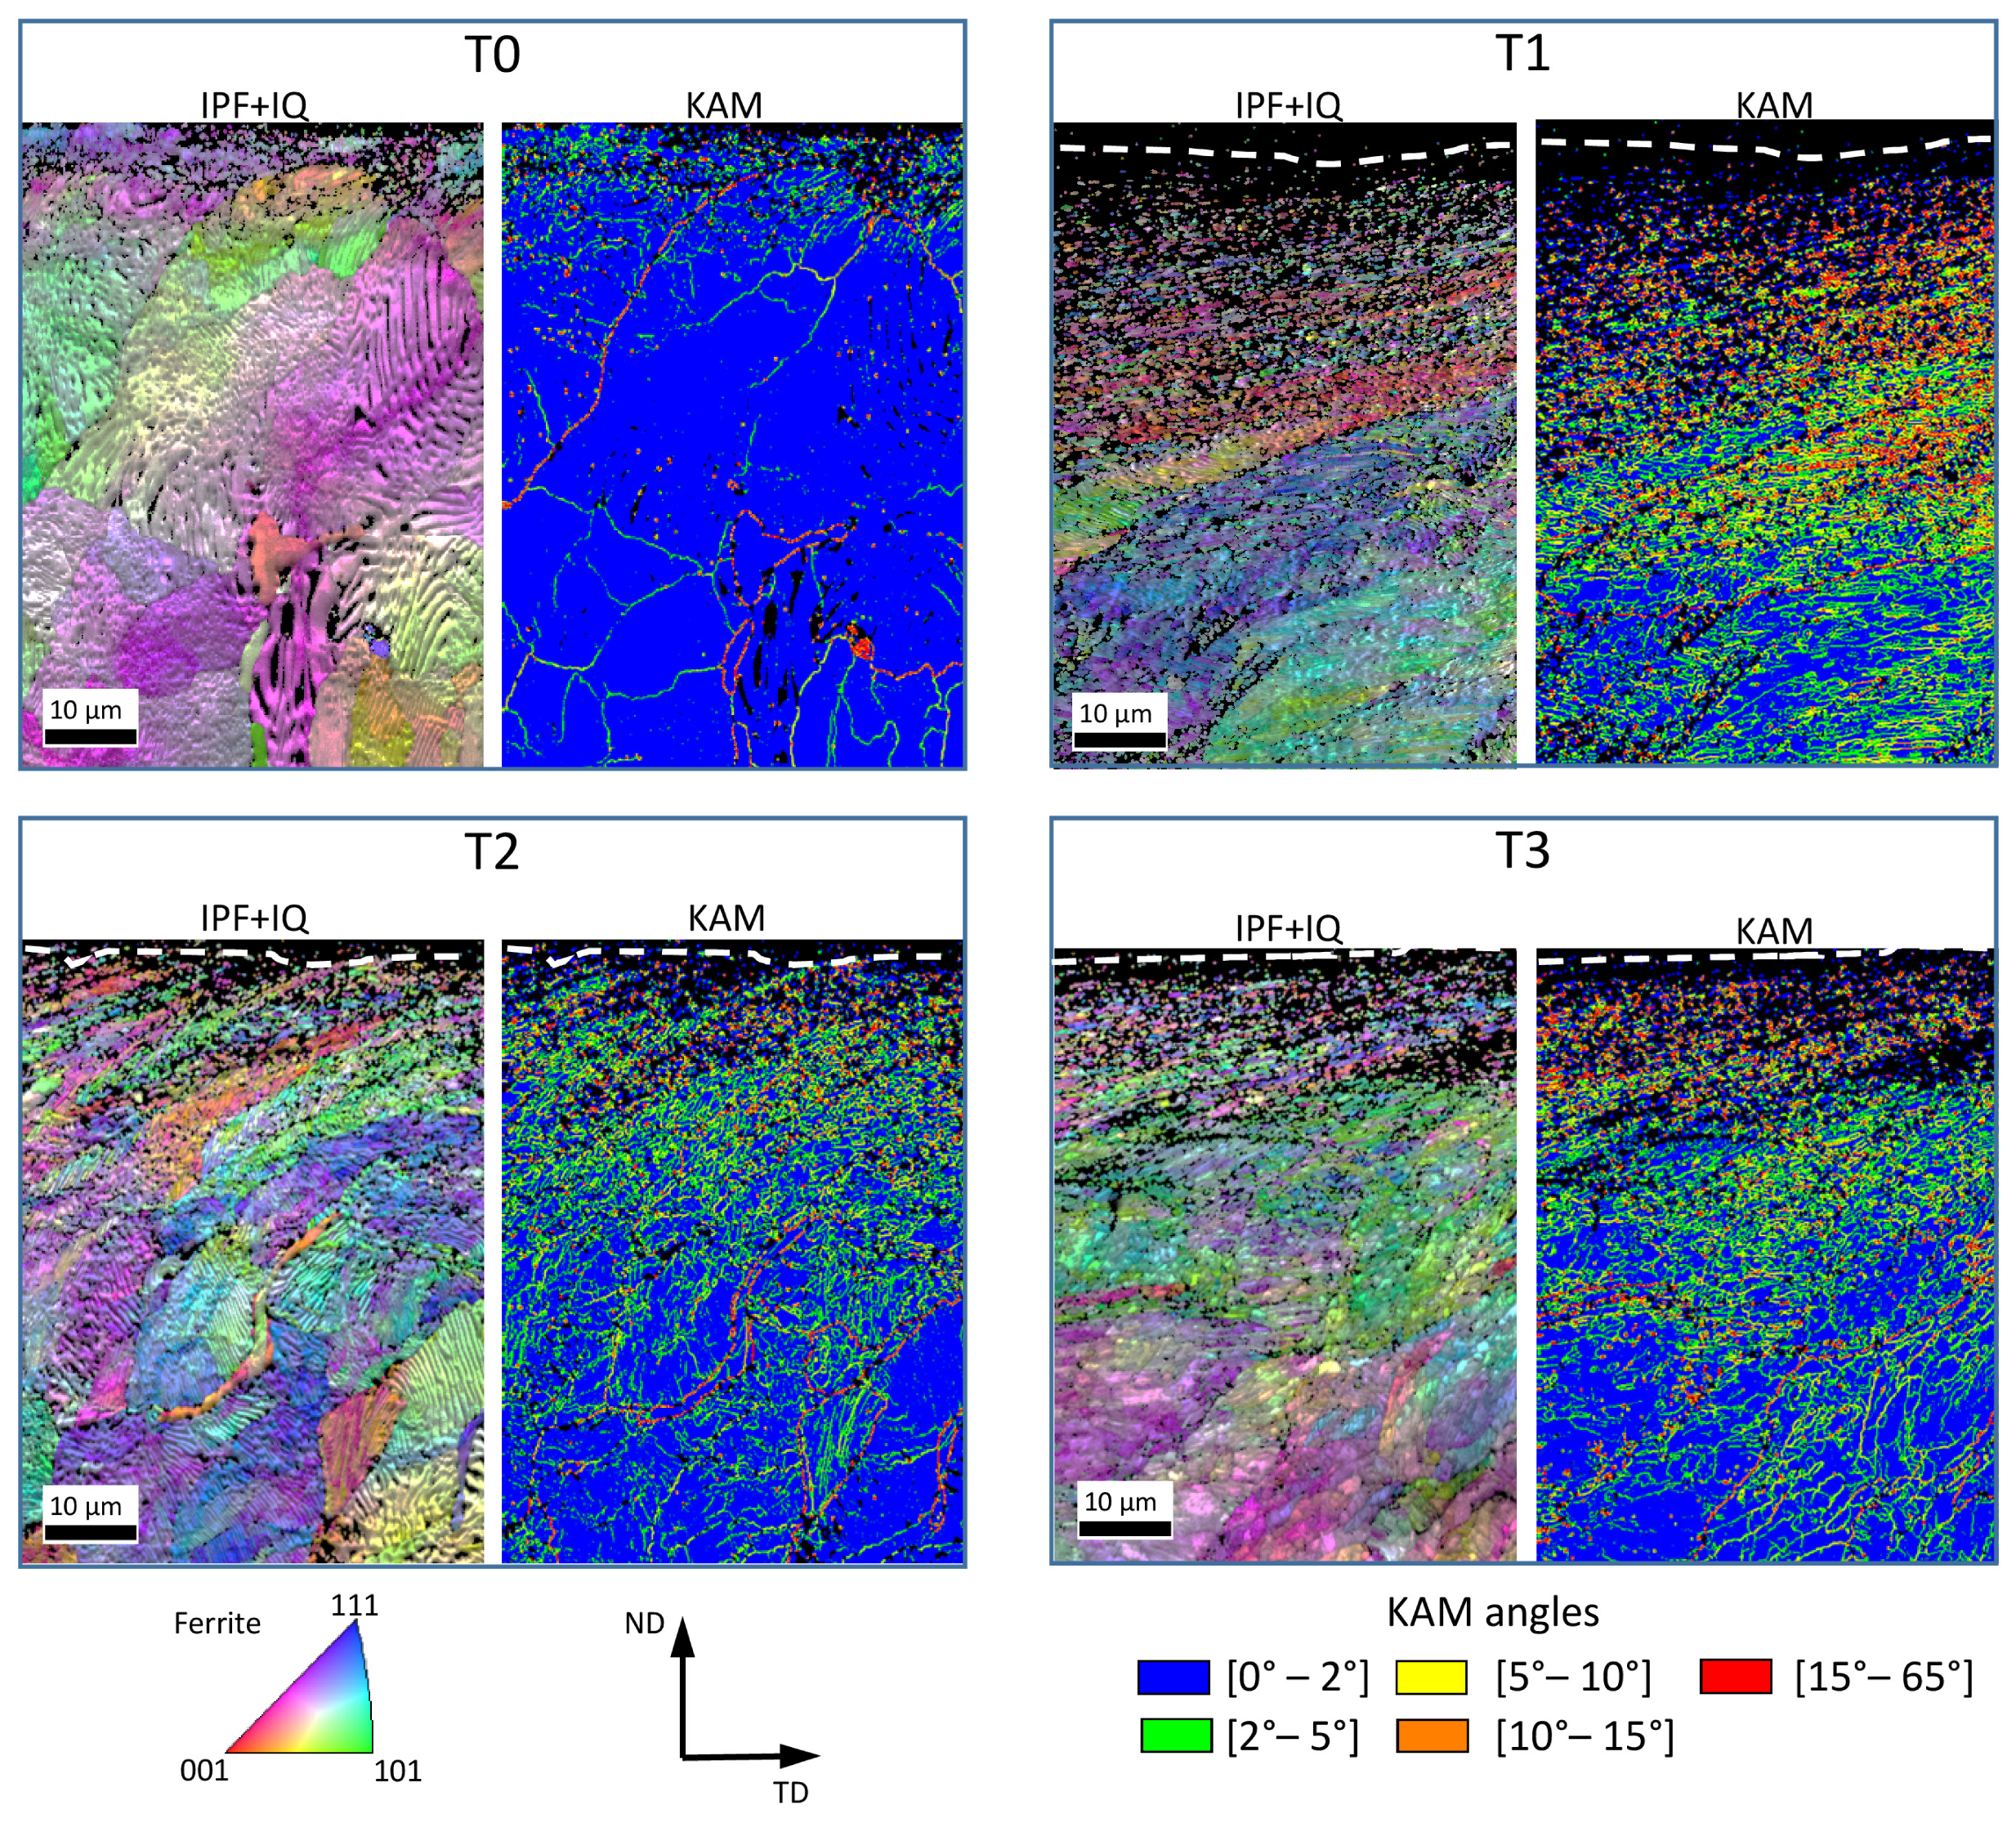
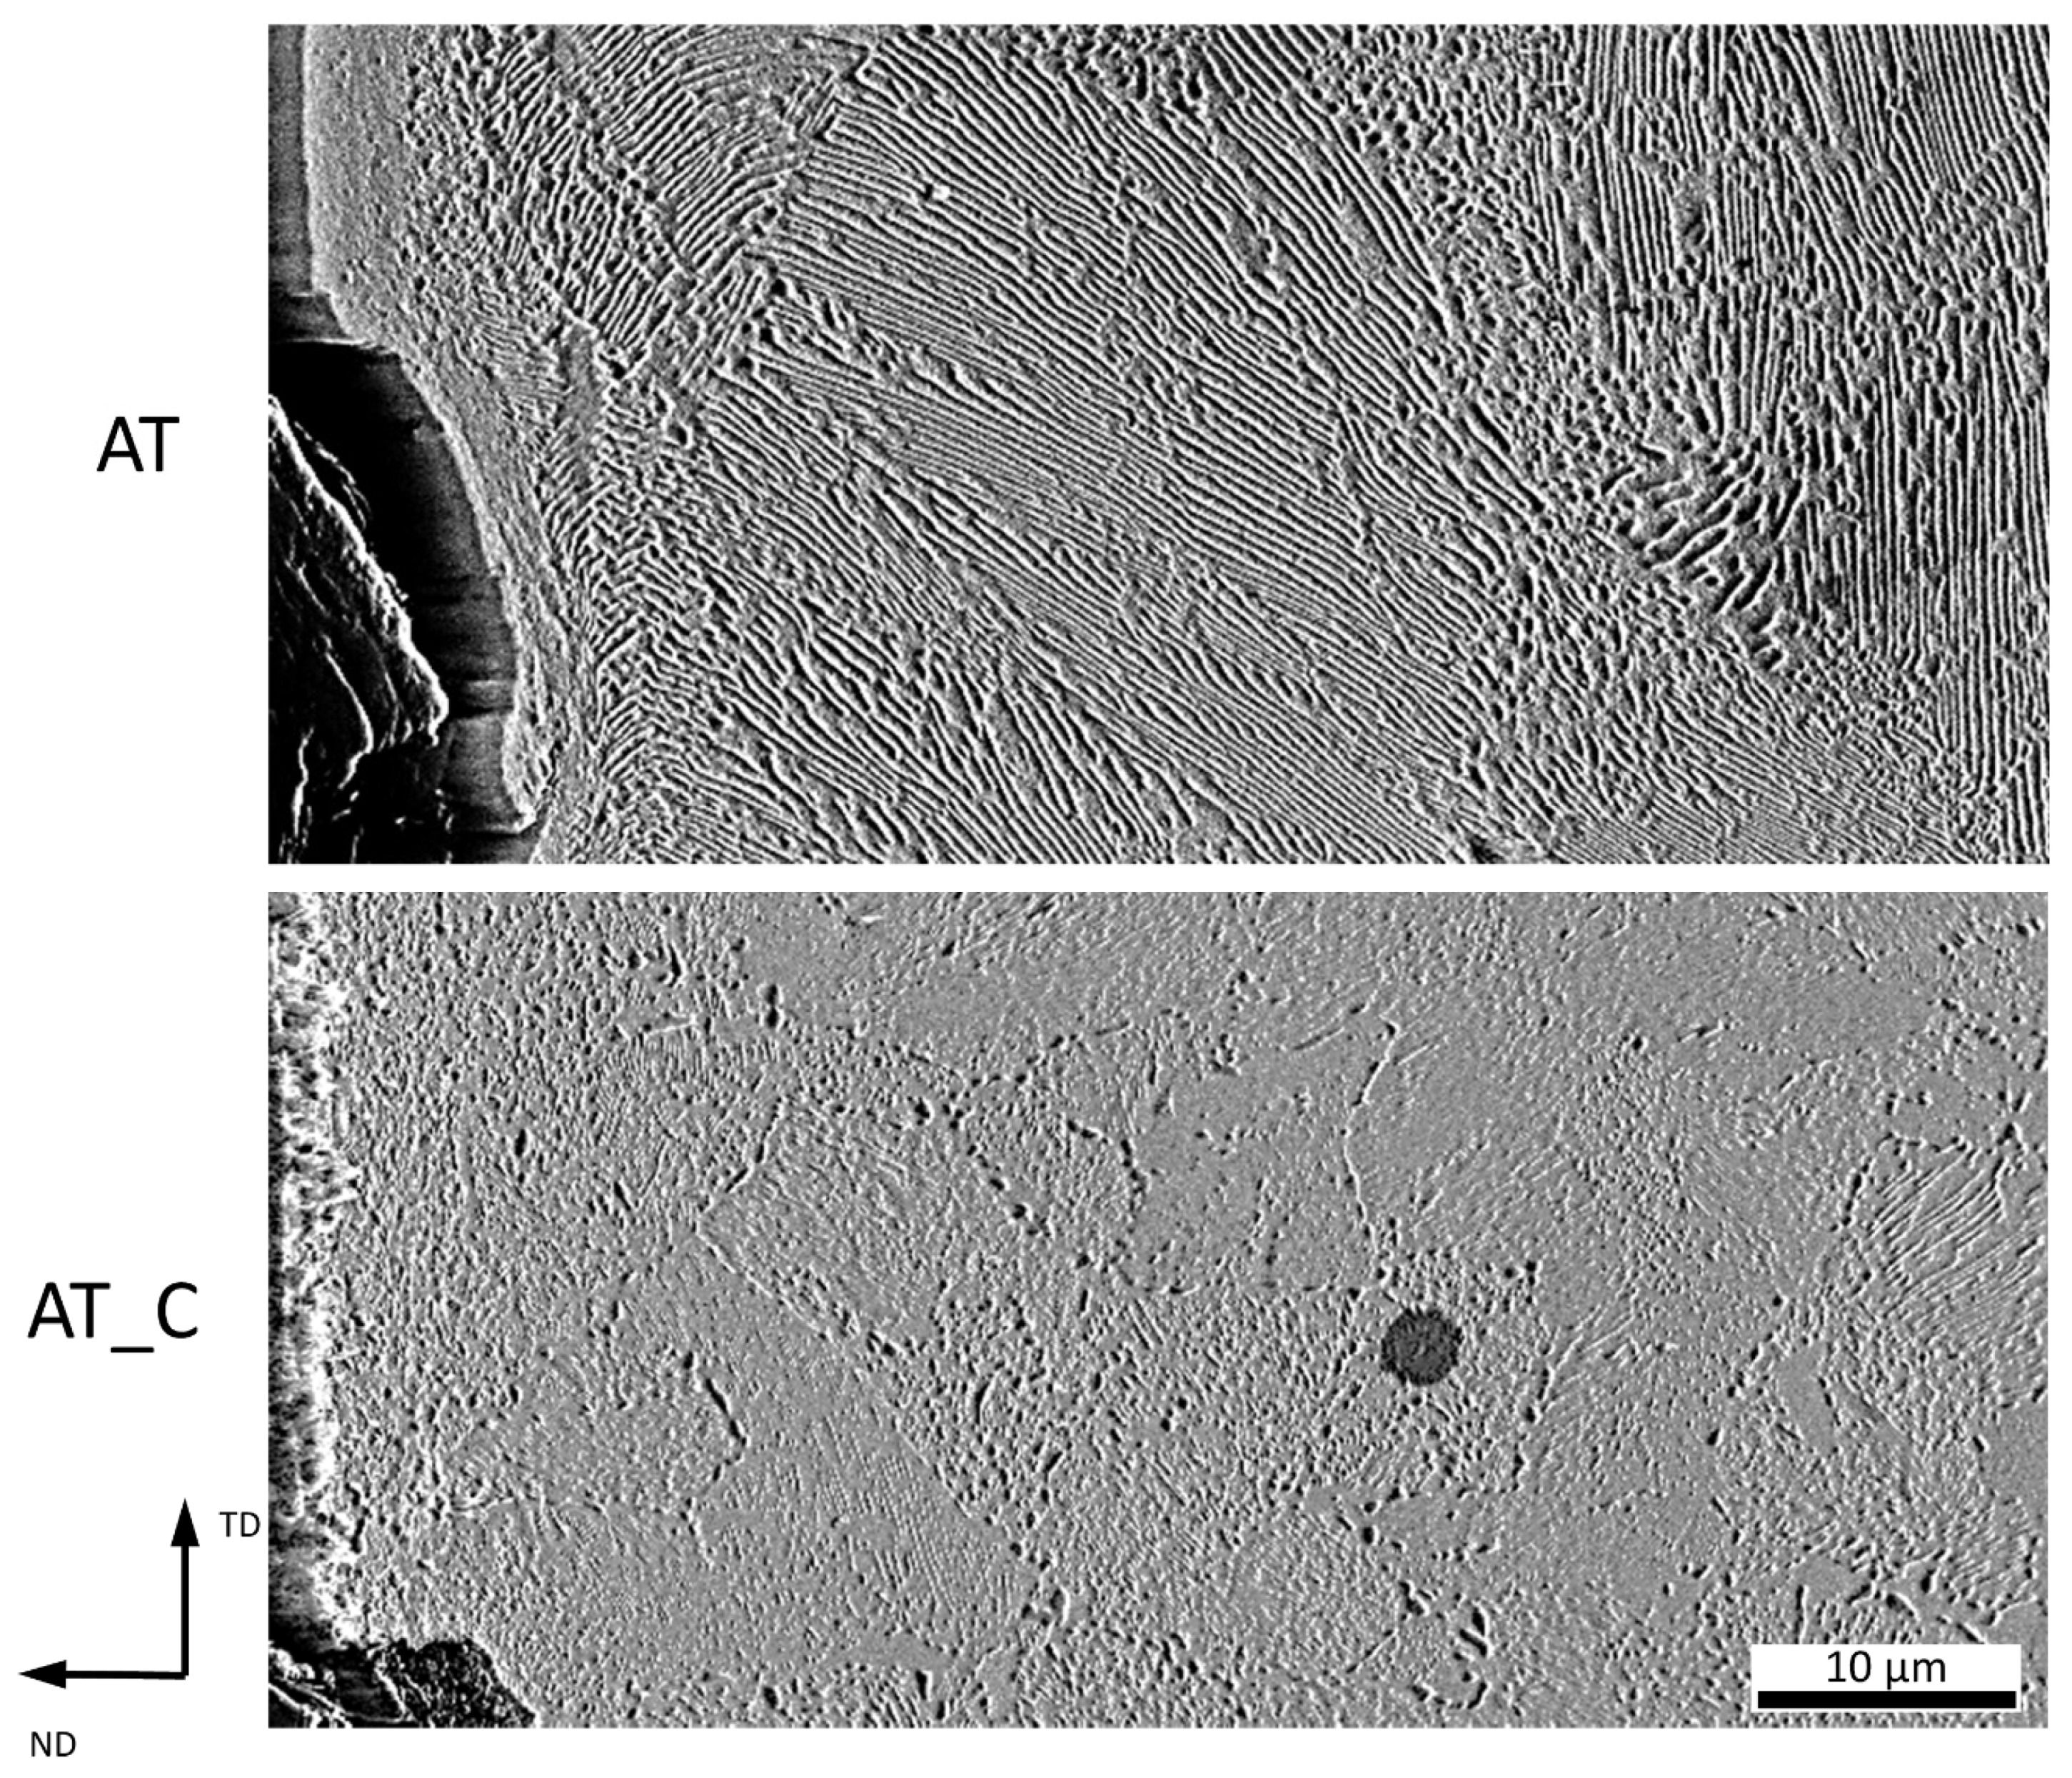
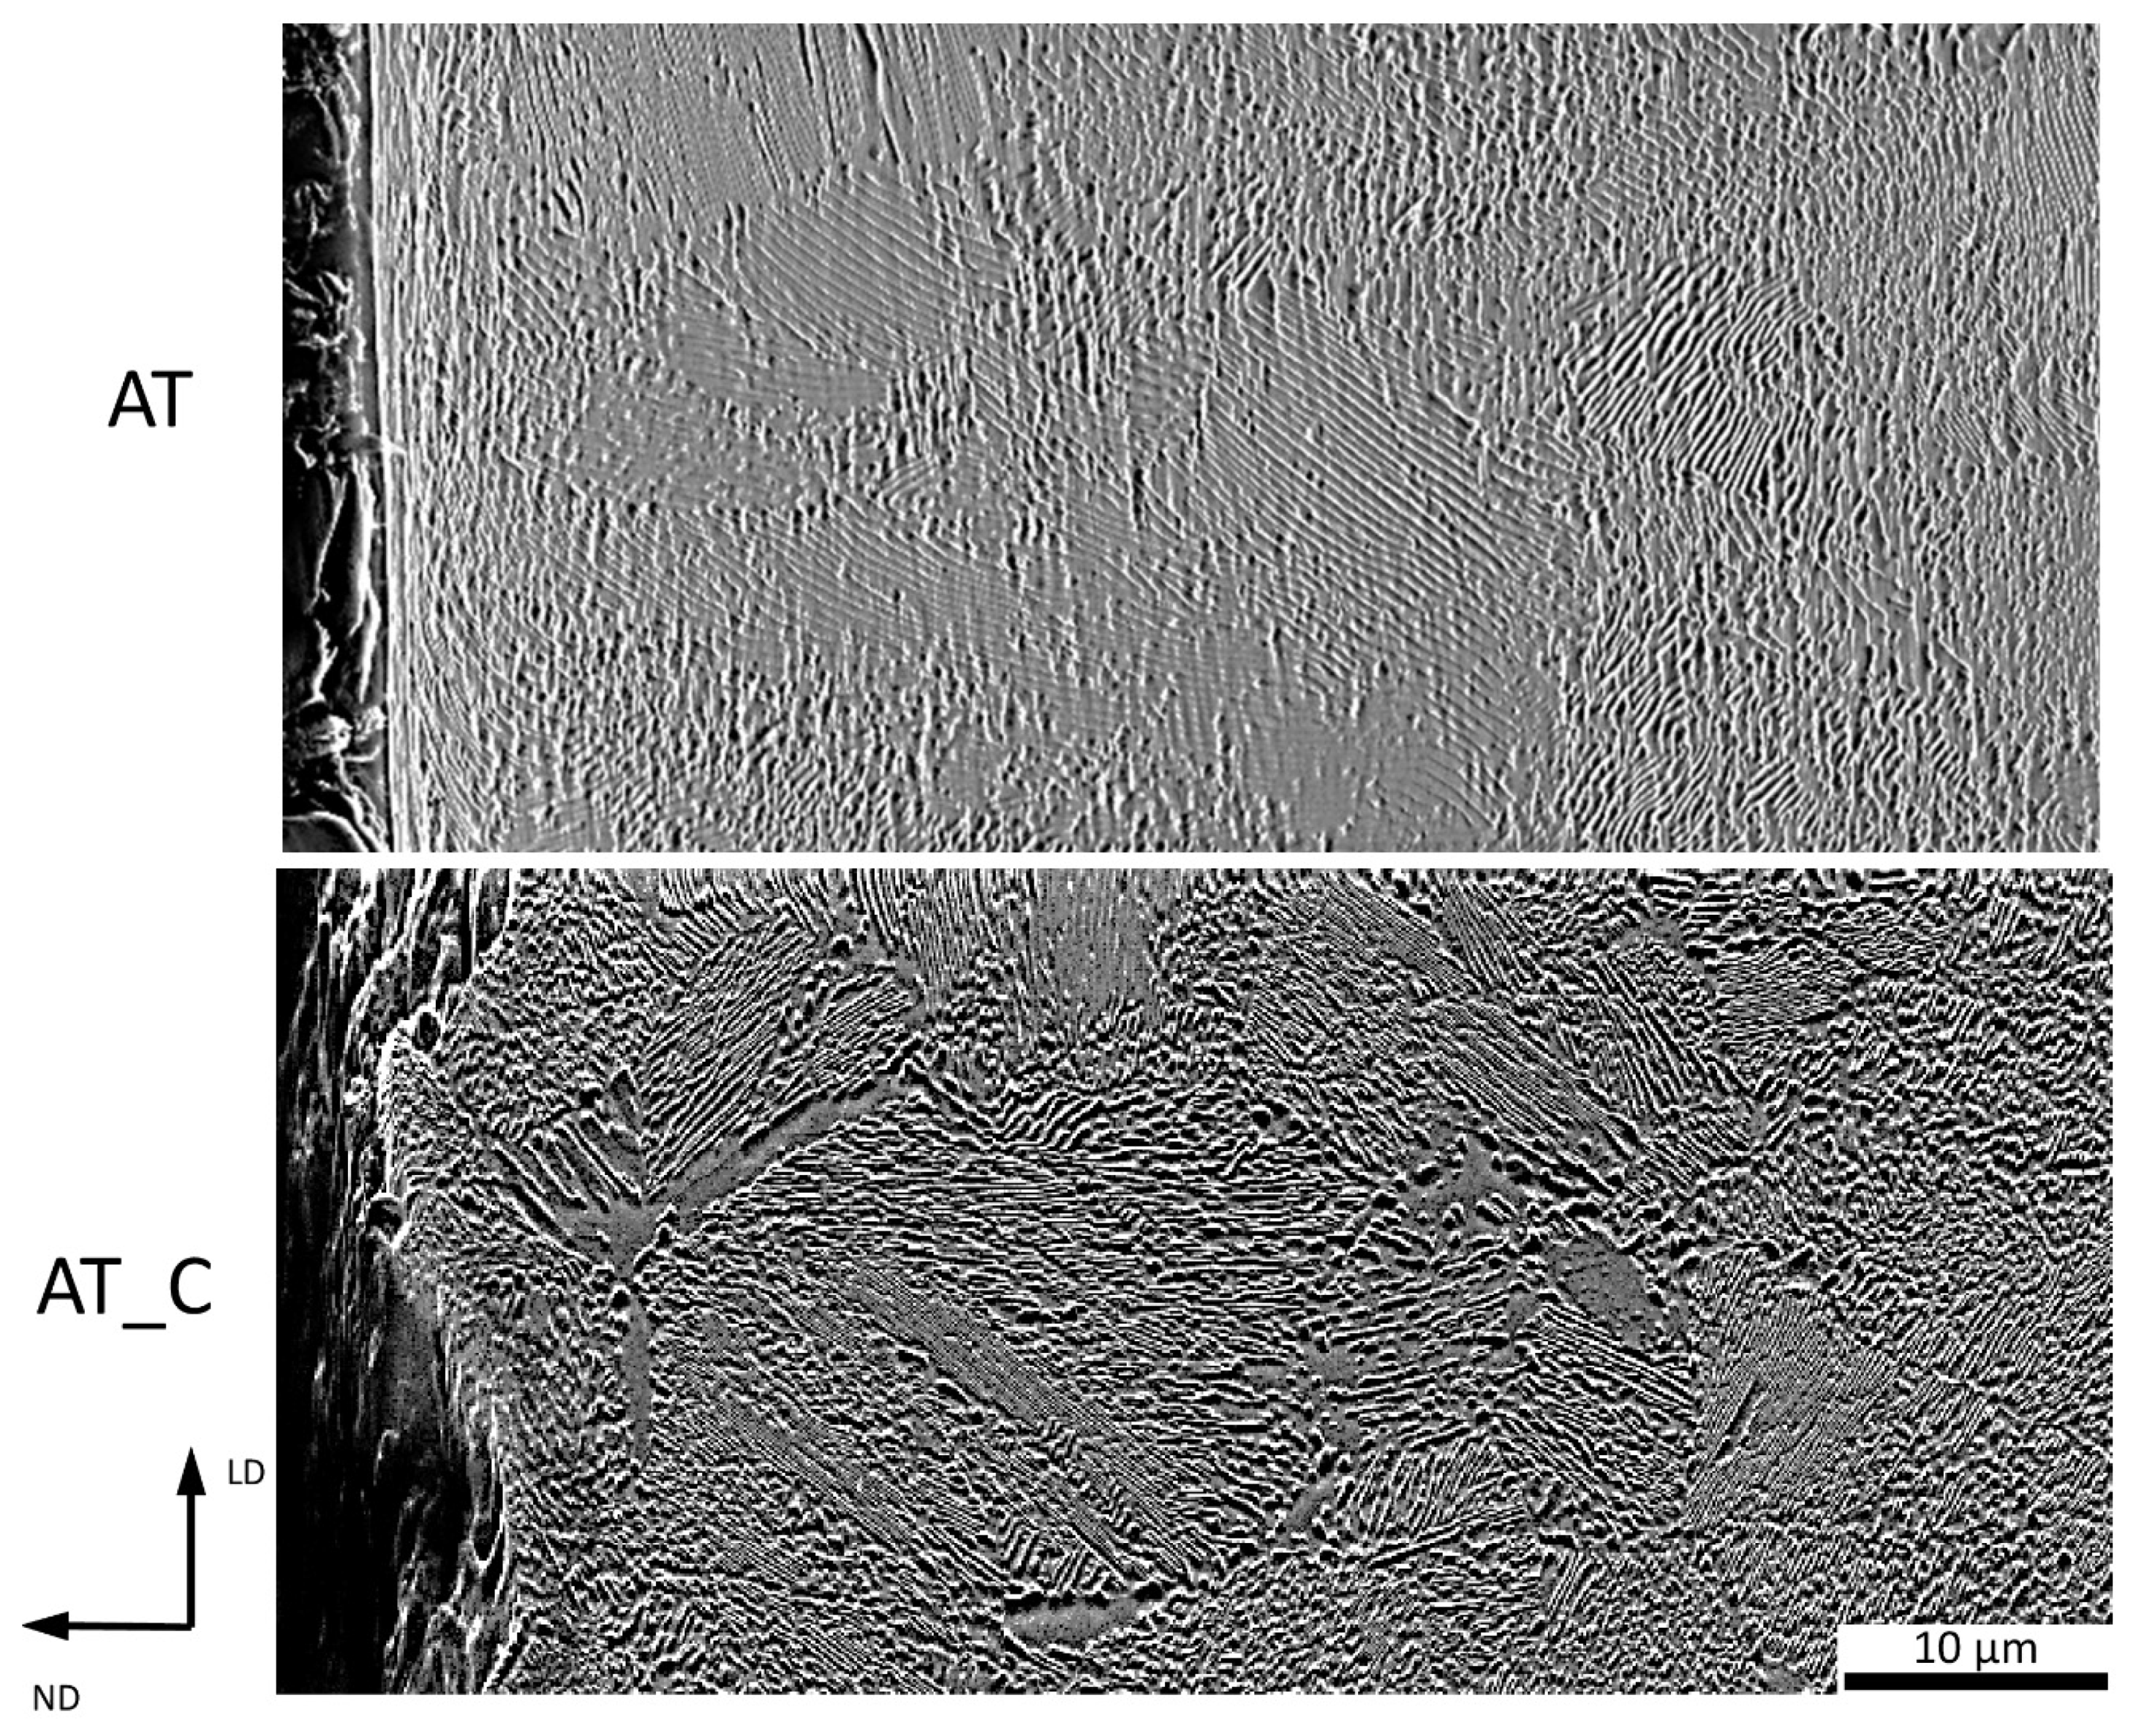
3.1. Ring AT
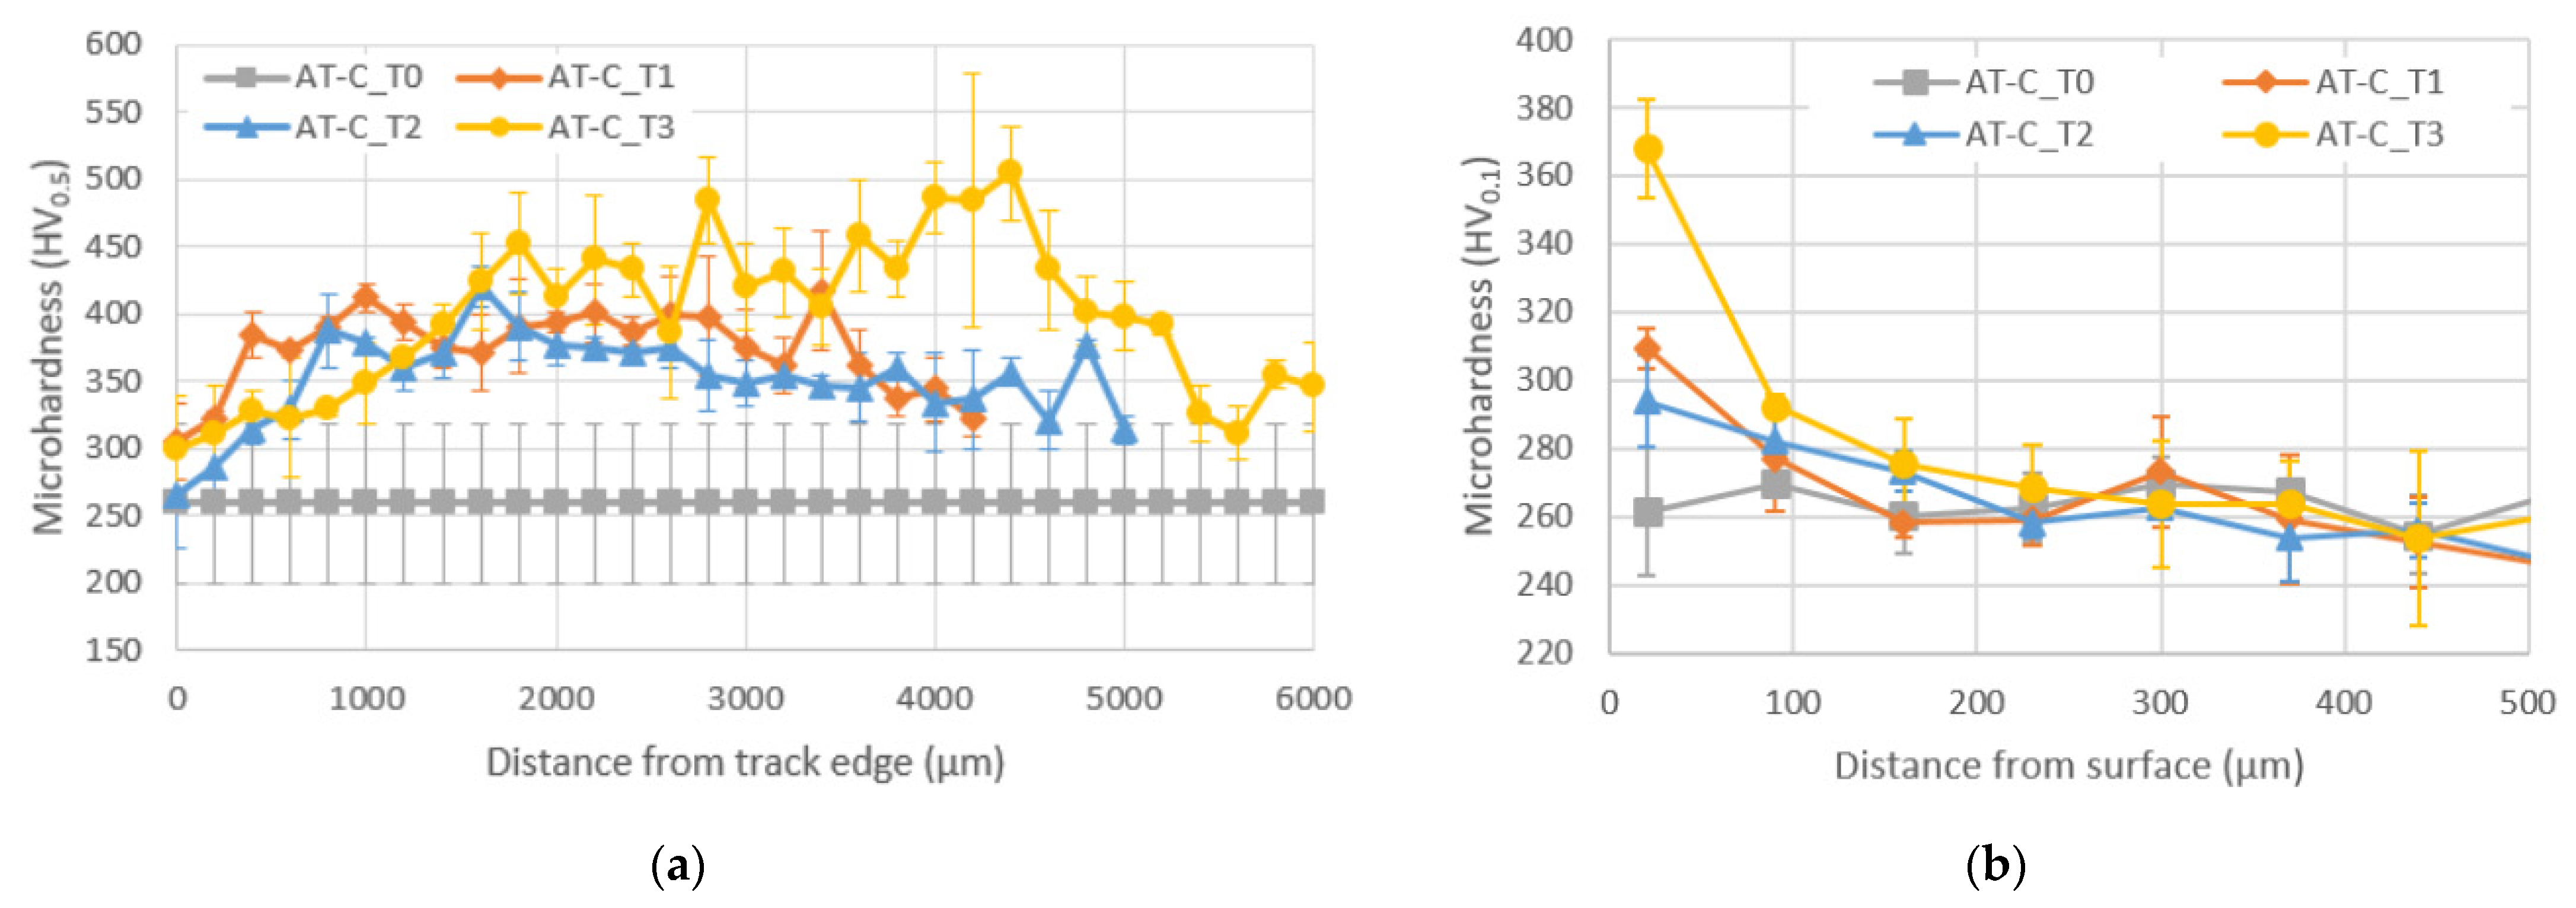
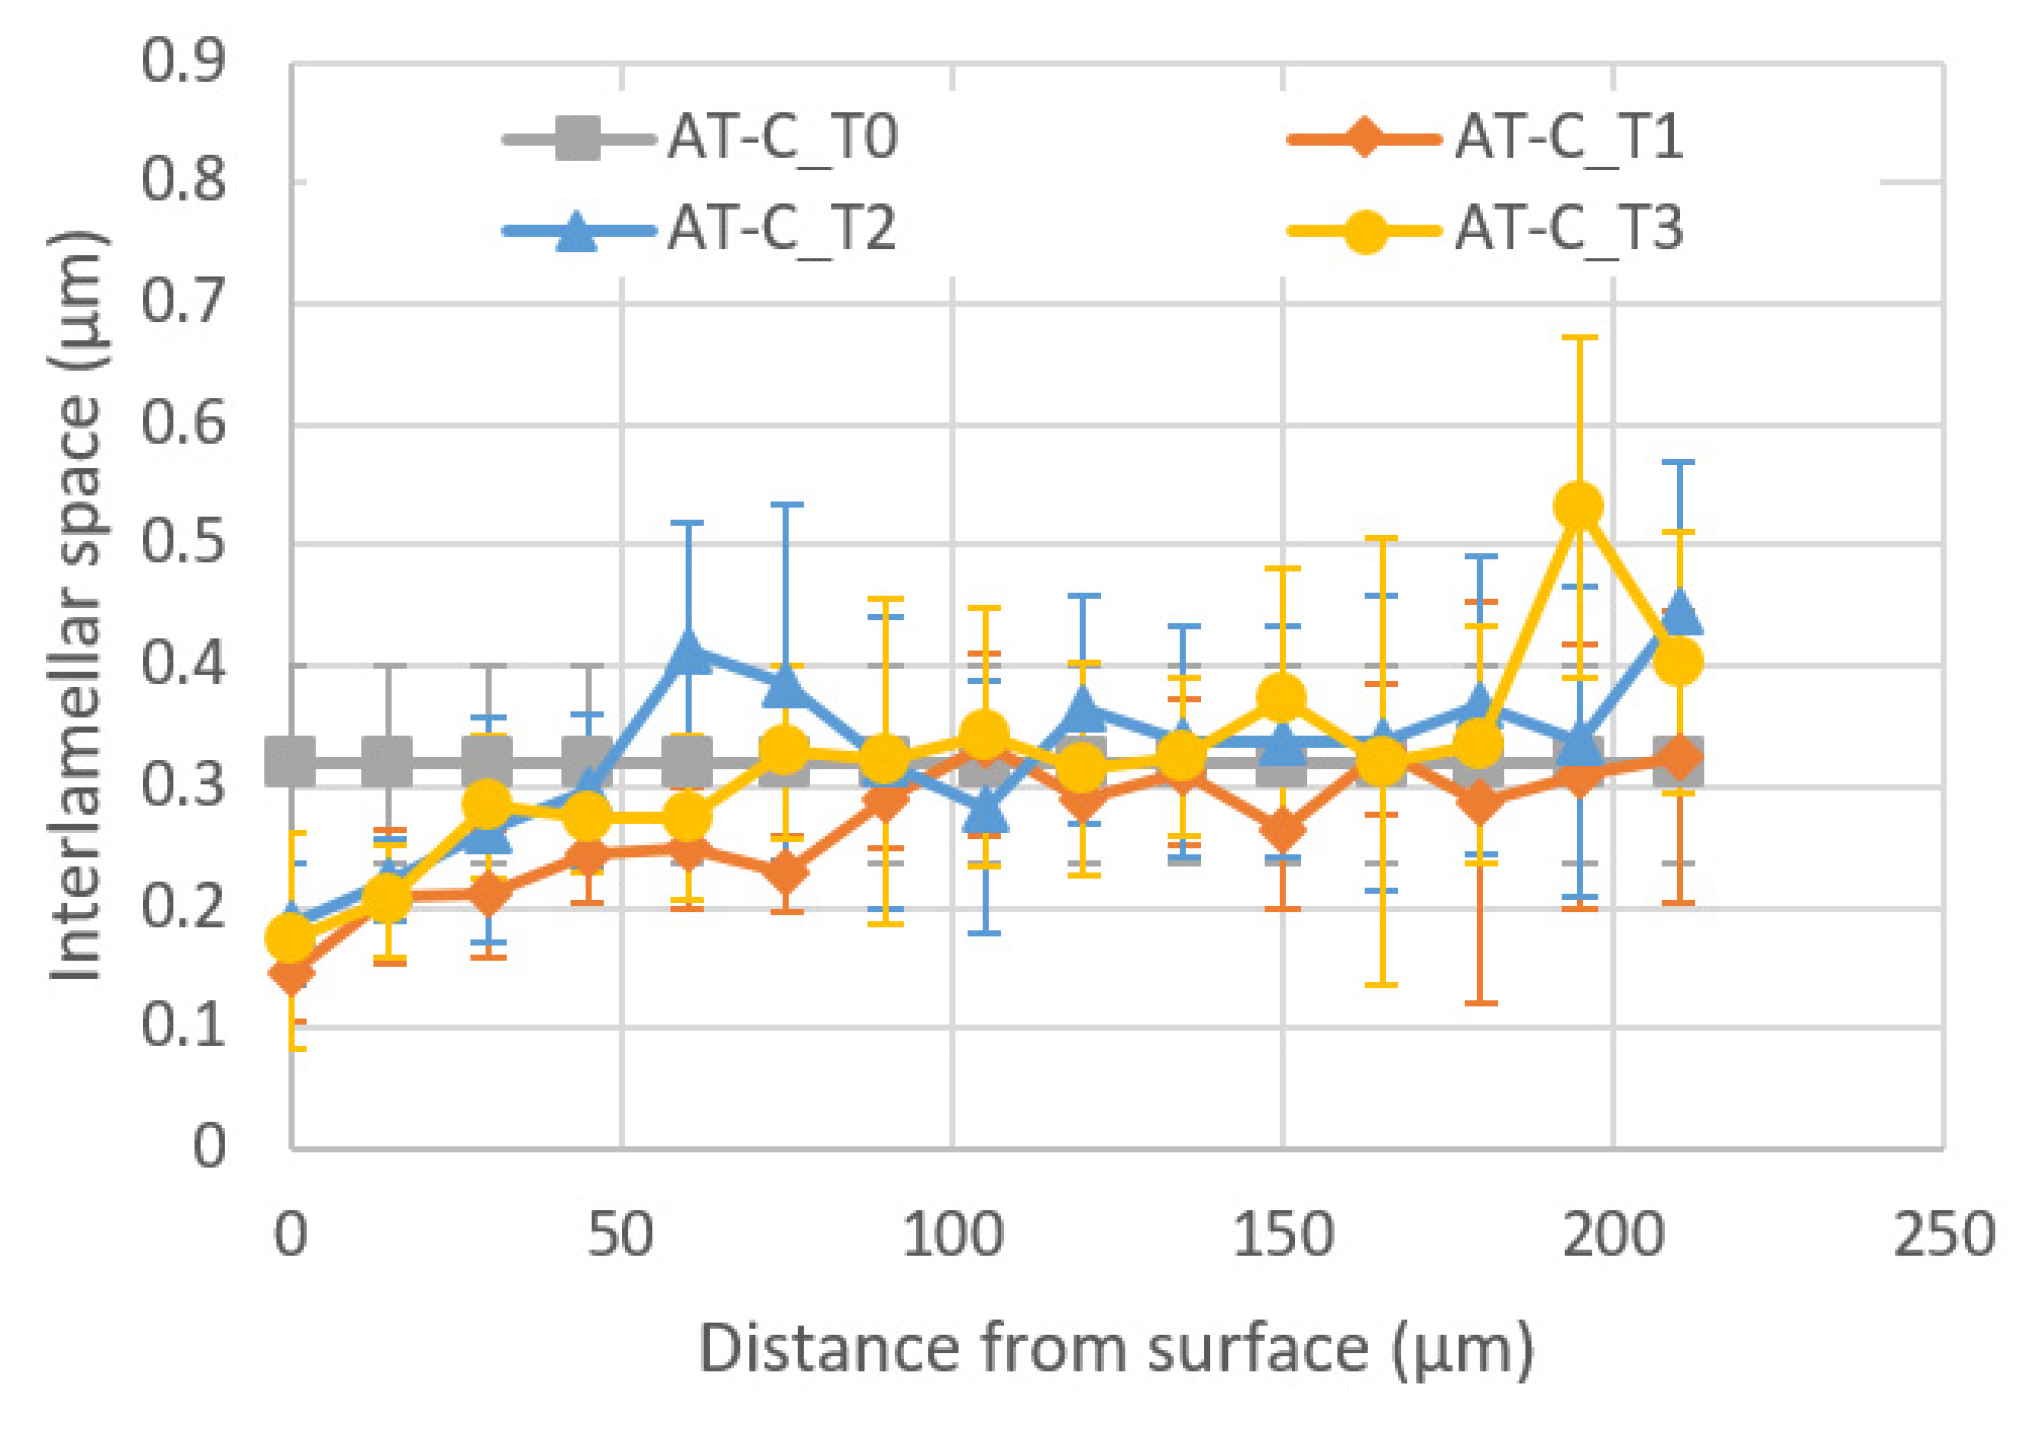
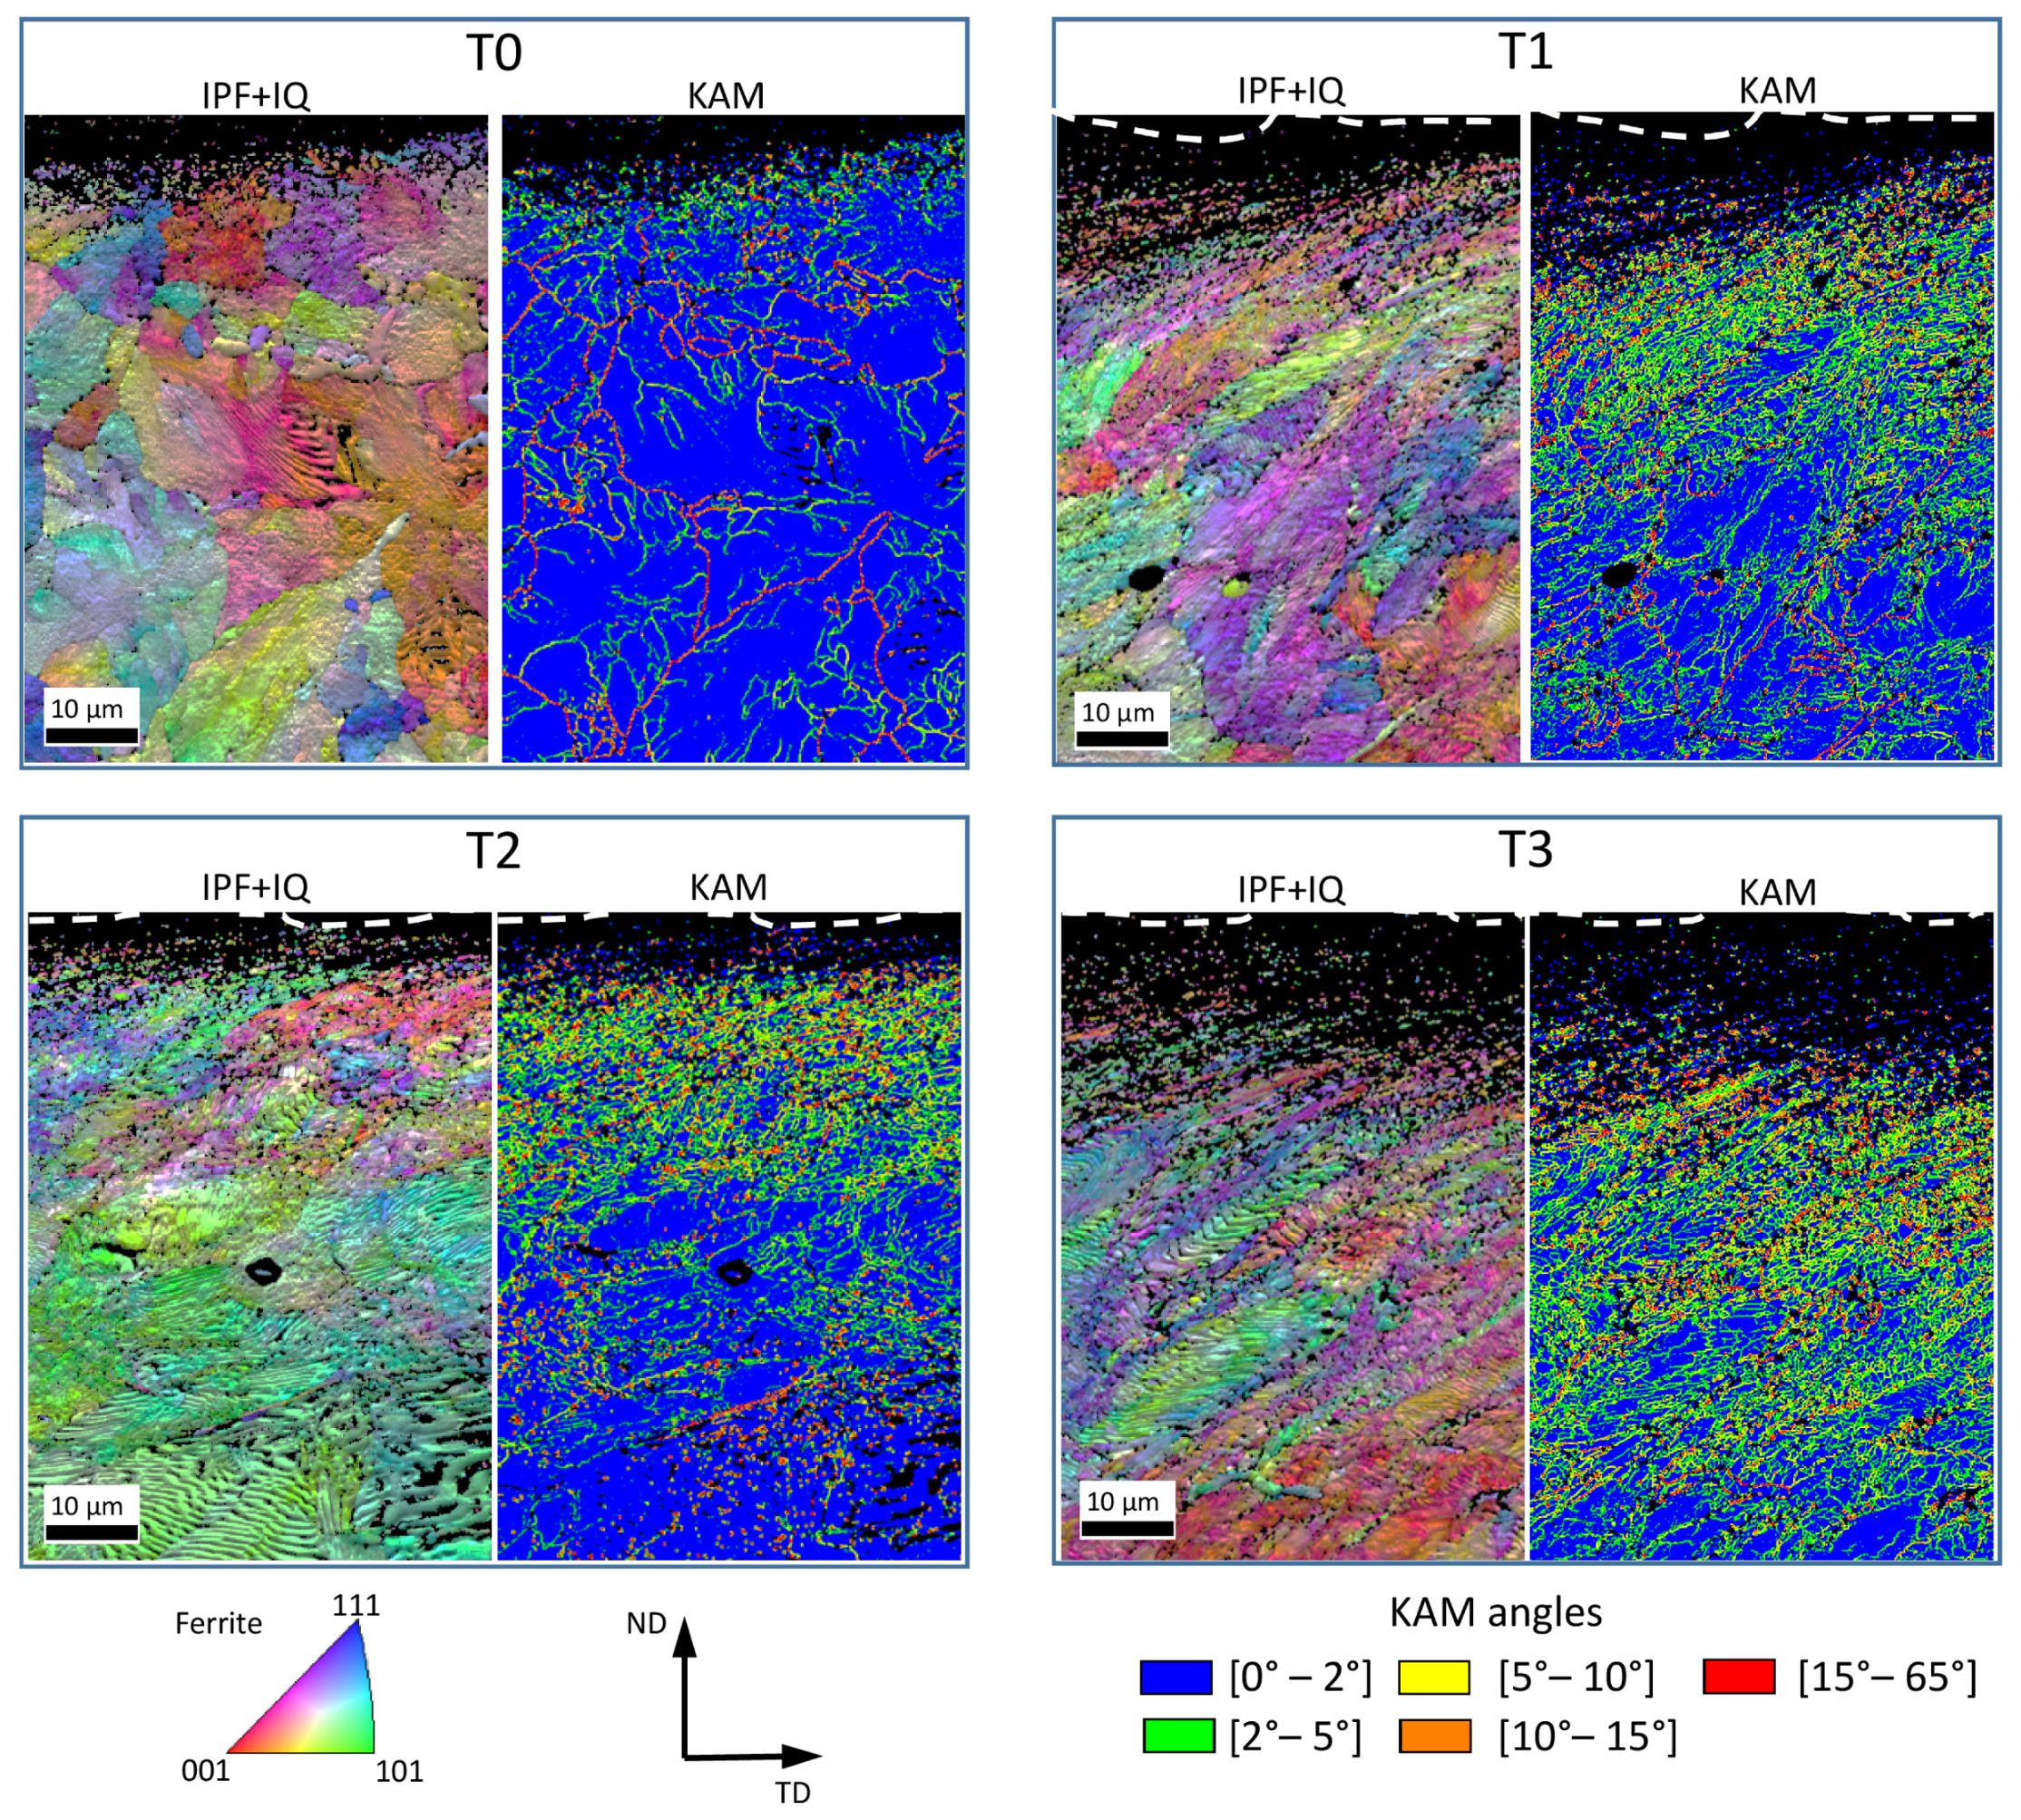
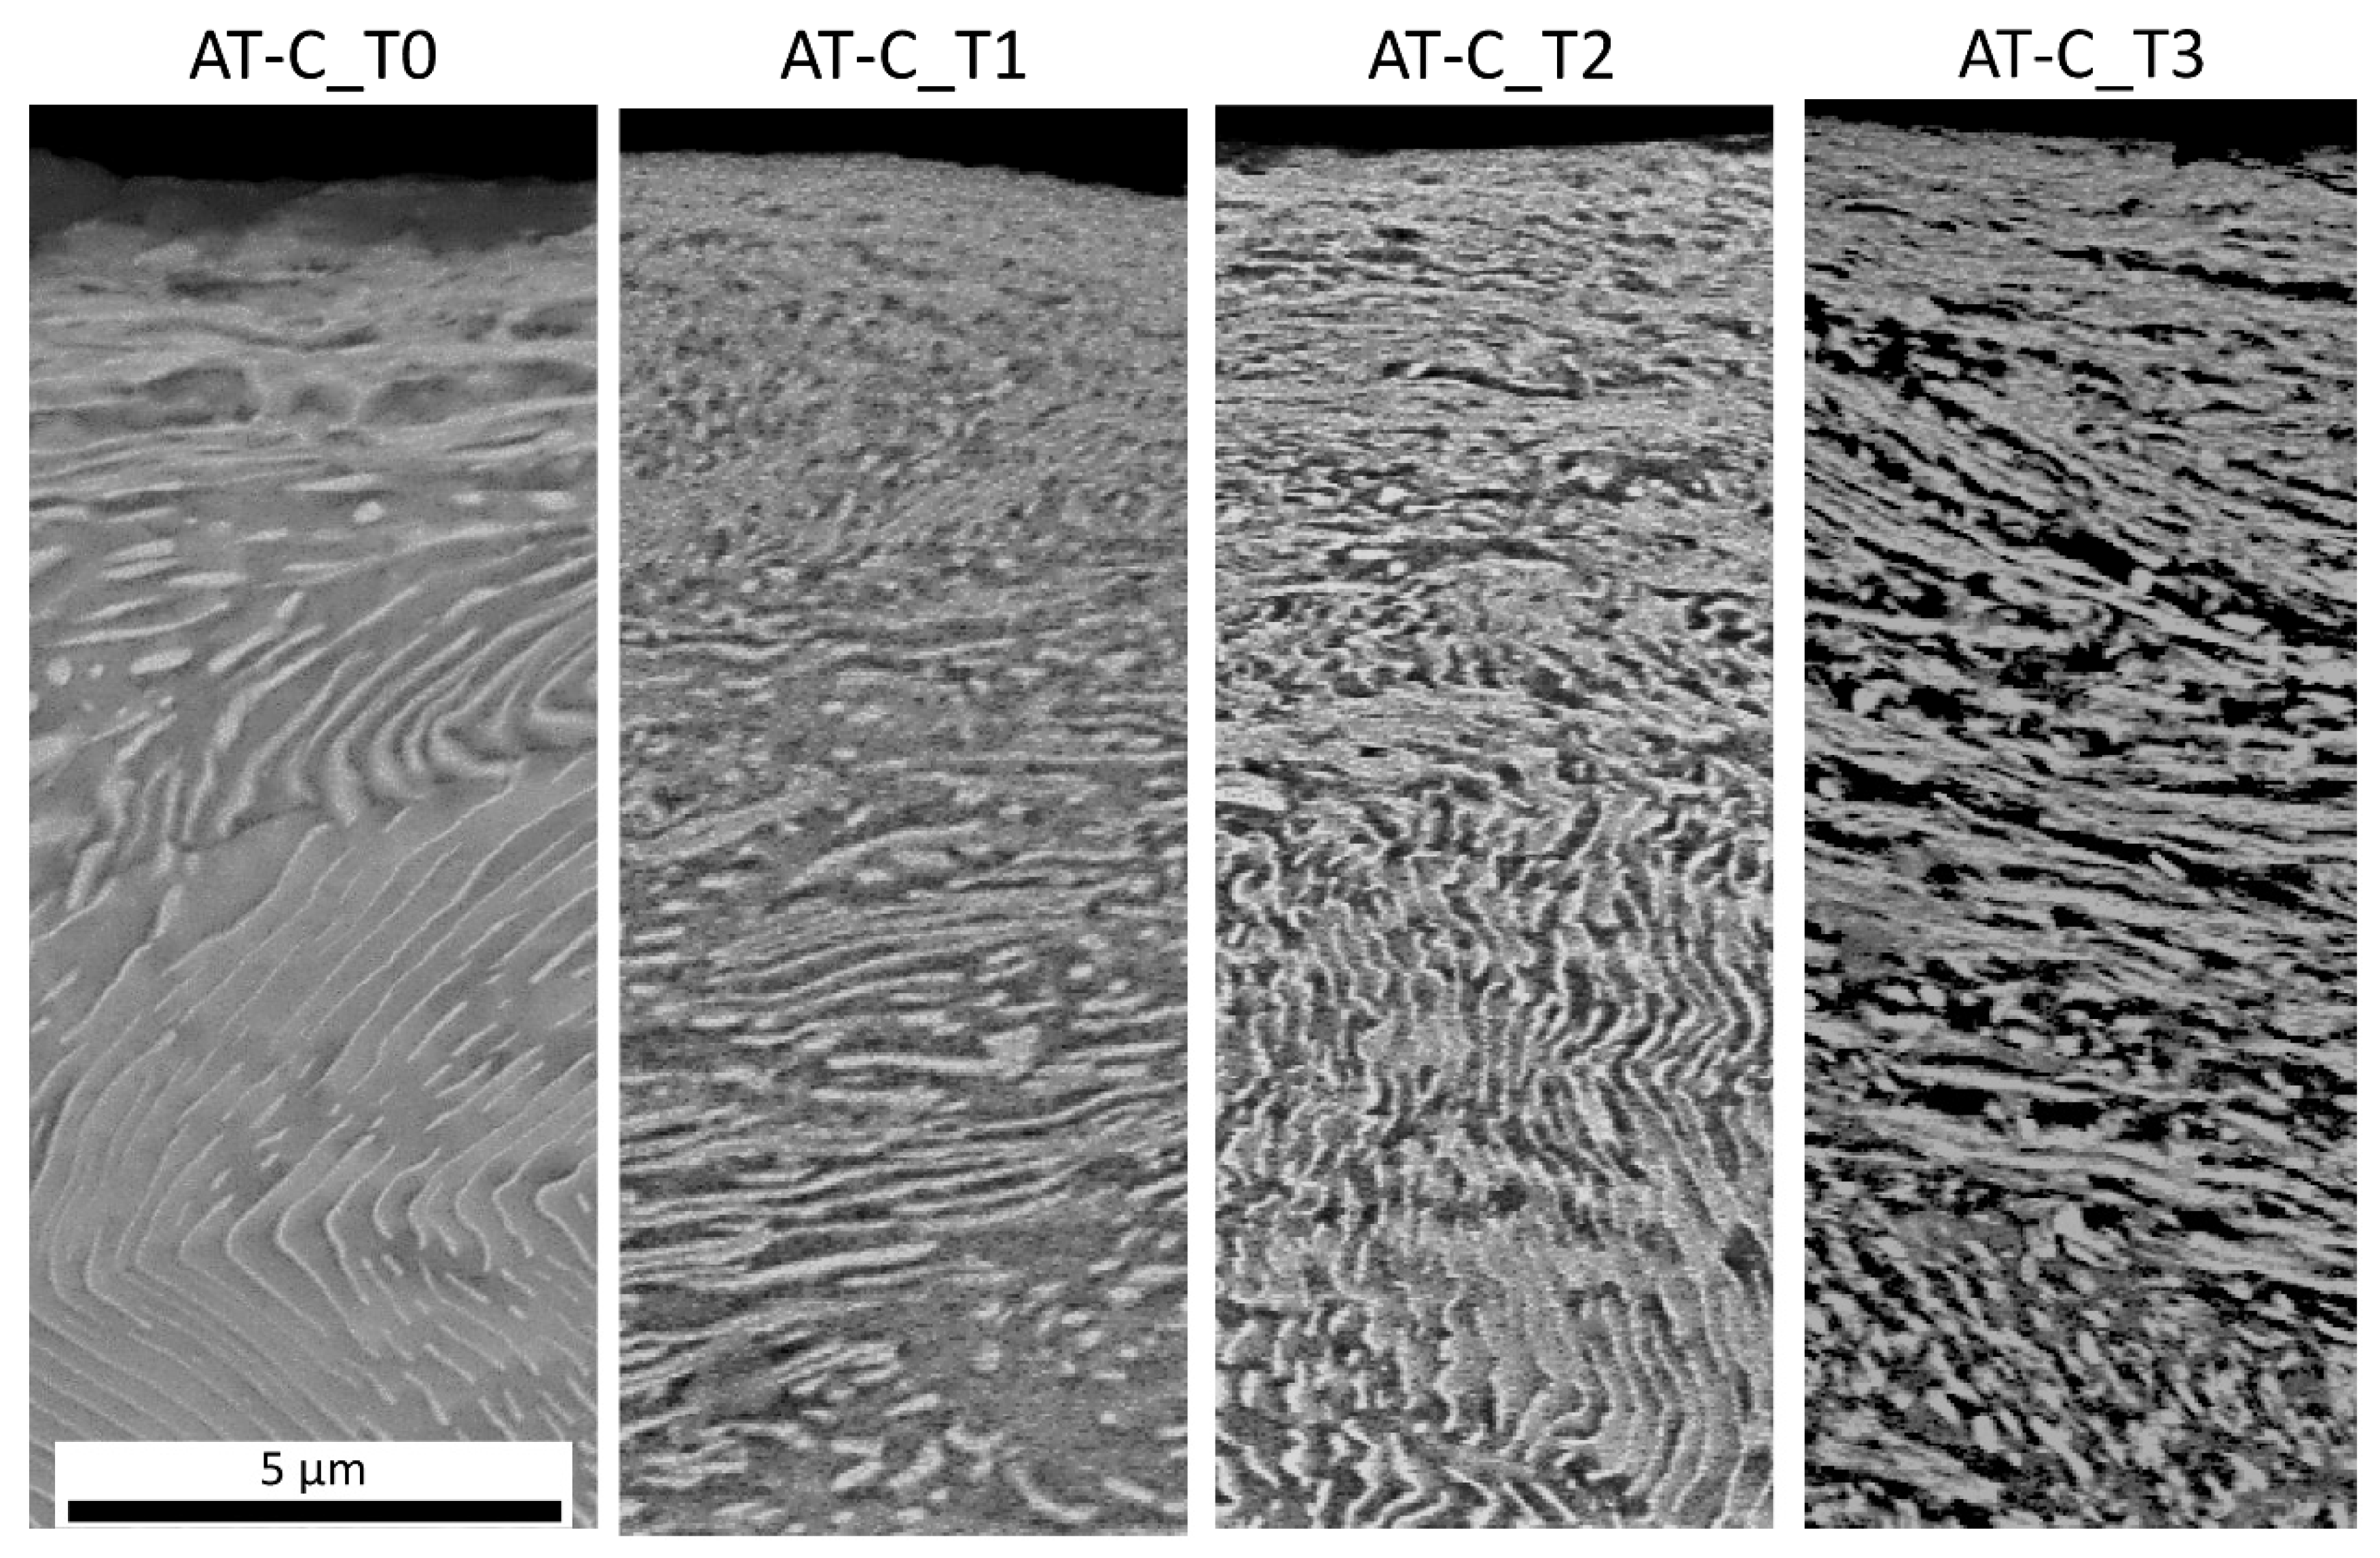
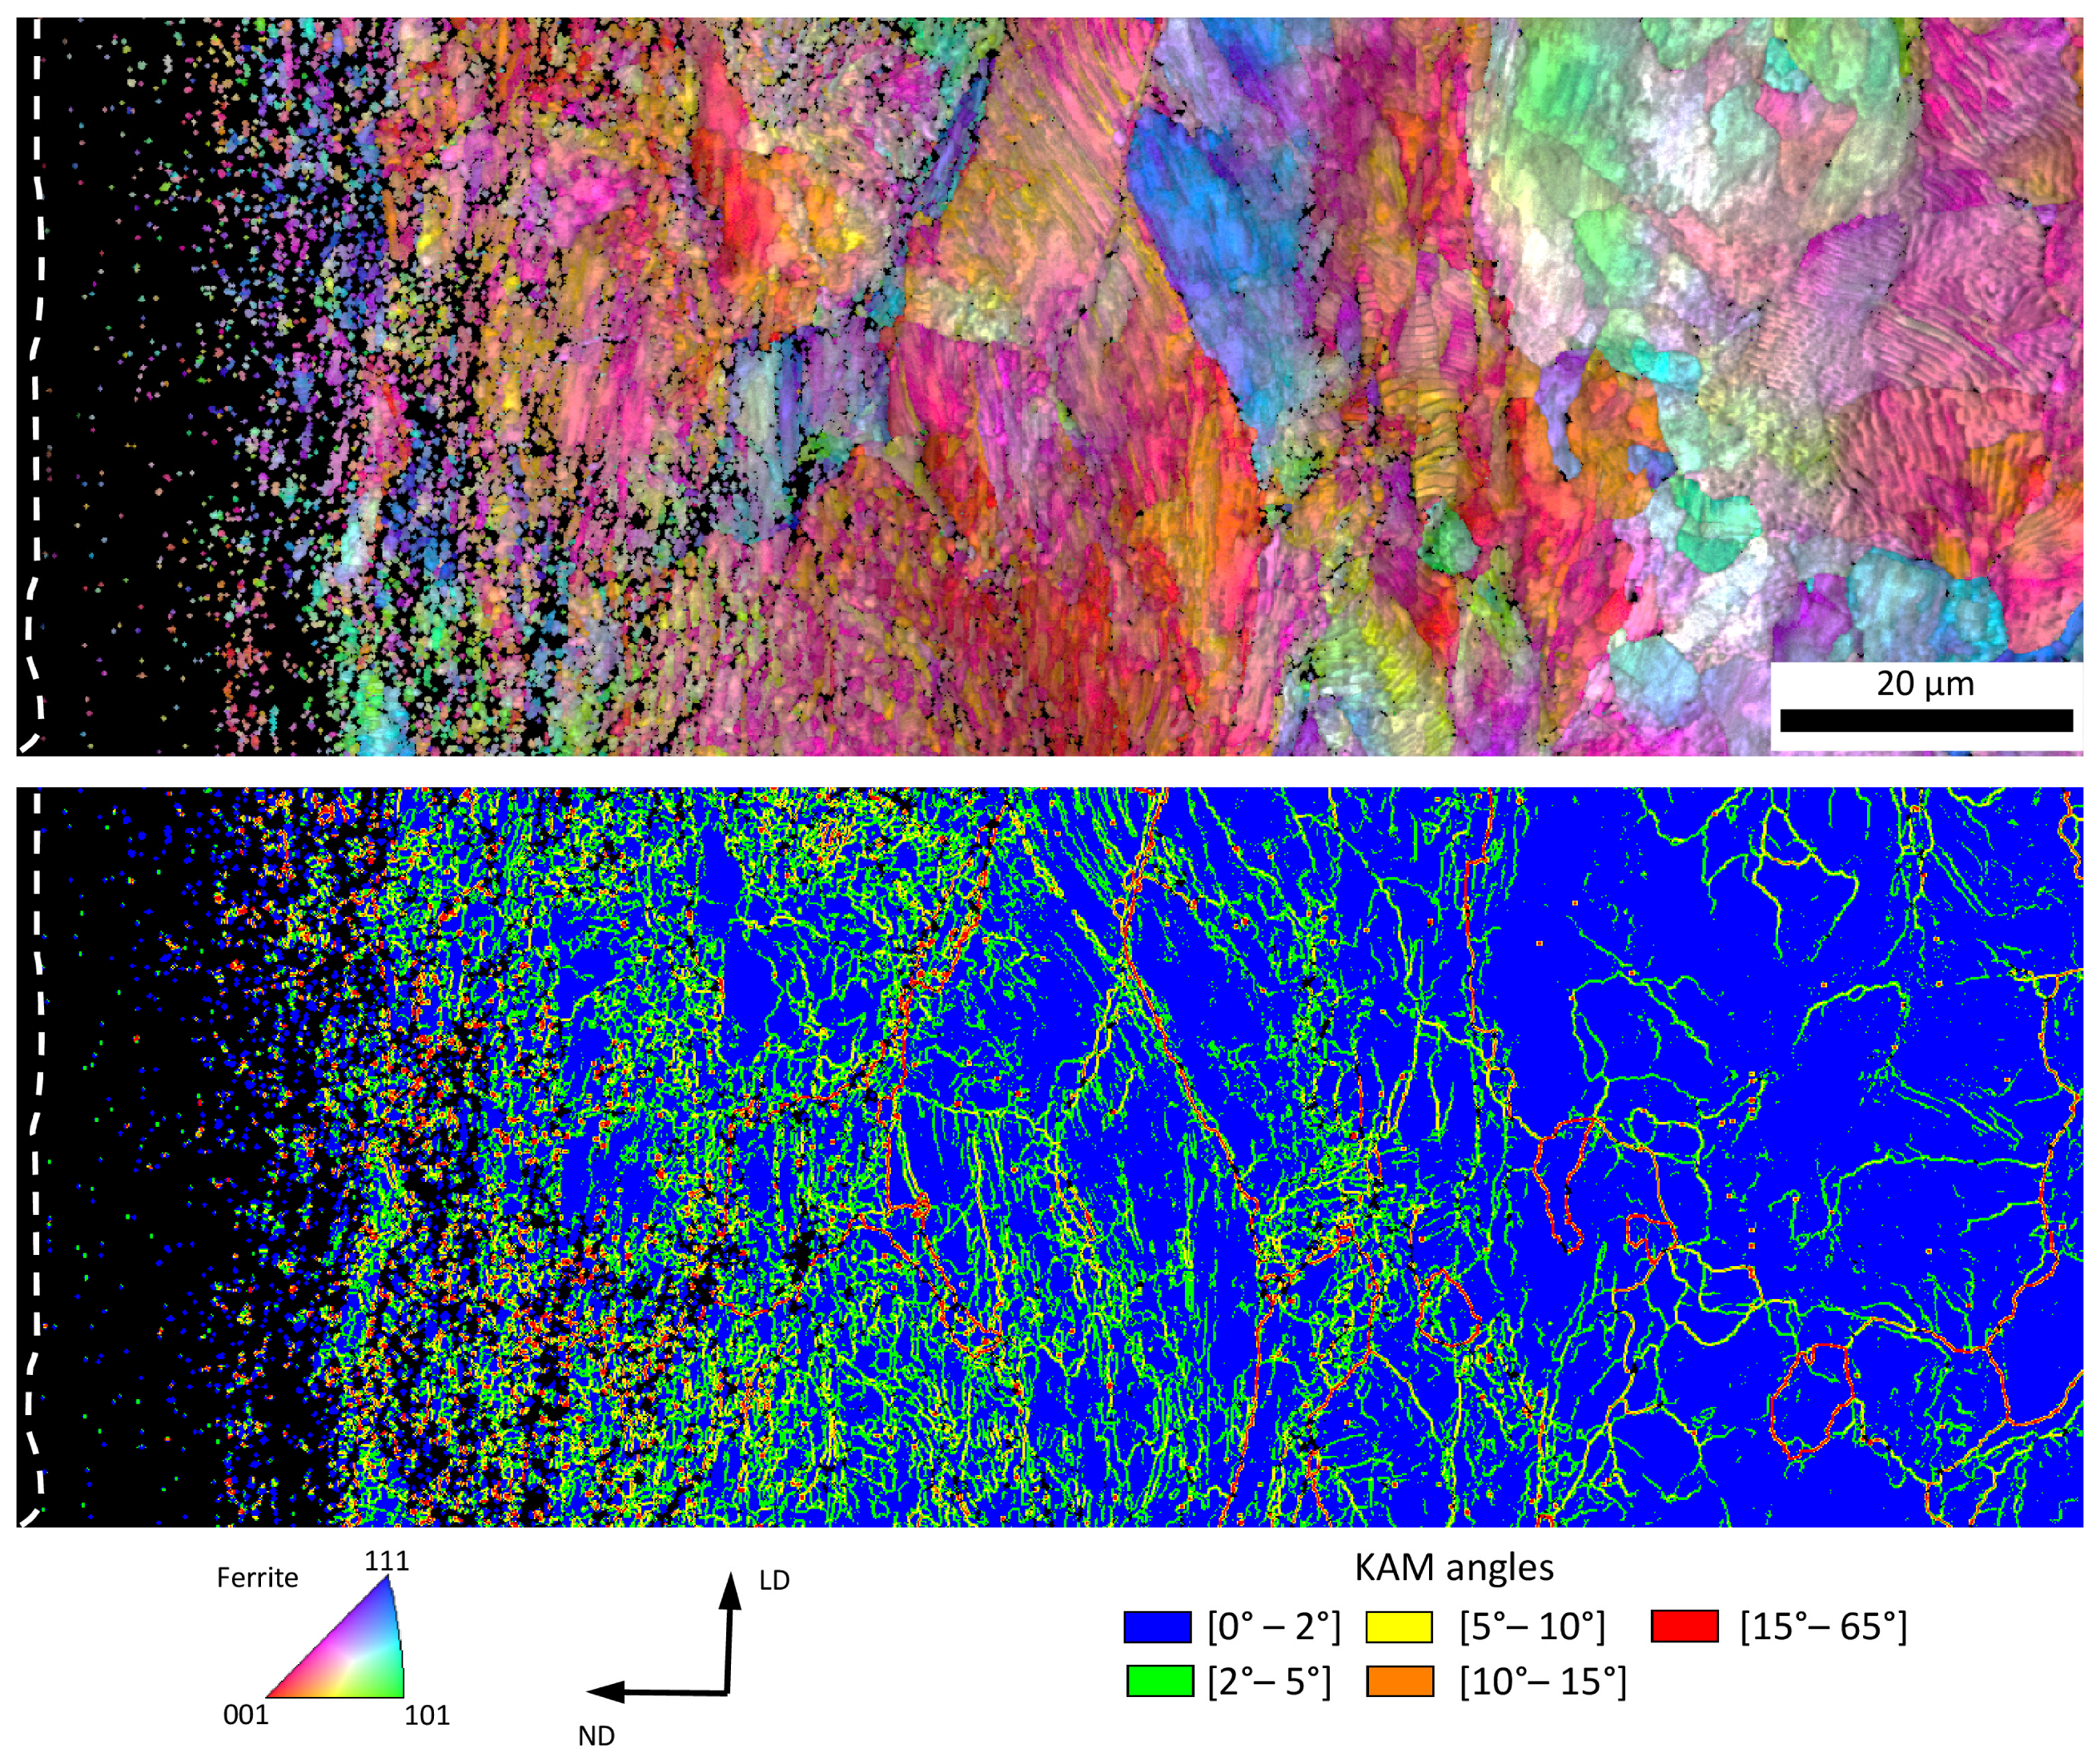
3.2. Ring AT-C
4. Discussion
5. Conclusions
Author Contributions
Funding
Institutional Review Board Statement
Informed Consent Statement
Data Availability Statement
Acknowledgments
Conflicts of Interest
Appendix A


References
- Alwahdi, F.A.M.; Kapoor, A.; Franklin, F.J. Subsurface microstructural analysis and mechanical properties of pearlitic rail steels in service. Wear 2013, 302, 1453–1460. [Google Scholar] [CrossRef]
- Zhao, X.J.; Guo, J.; Wang, H.Y.; Wen, Z.F.; Liu, Q.Y.; Zhao, G.T.; Wang, W.J. Effects of decarburization on the wear resistance and damage mechanisms of rail steels subject to contact fatigue. Wear 2016, 364–365, 130–143. [Google Scholar] [CrossRef]
- Garnham, J.E.; Davis, C.L. The role of deformed rail microstructure on rolling contact fatigue initiation. Wear 2008, 265, 1363–1372. [Google Scholar] [CrossRef]
- Maya-Johnson, S.; Ramirez, A.J.; Toro, A. Fatigue crack growth rate of two pearlitic rail steels. Eng. Fract. Mech. 2015, 138, 63–72. [Google Scholar] [CrossRef]
- Athukorala, A.C.; De Pellegrin, D.V.; Kourousis, K.I. Characterisation of head-hardened rail steel in terms of cyclic plasticity response and microstructure for improved material modelling. Wear 2016, 366–367, 416–424. [Google Scholar] [CrossRef]
- Wetscher, F.; Stock, R.; Pippan, R. Changes in the mechanical properties of a pearlitic steel due to large shear deformation. Mater. Sci. Eng. A 2007, 445–446, 237–243. [Google Scholar] [CrossRef]
- Takahashi, T.; Ponge, D.; Raabe, D. Investigation of Orientation Gradients in Pearlite in Hypoeutectoid Steel by use of Orientation Imaging Microscopy. Steel Res. Int. 2007, 78, 38–44. [Google Scholar] [CrossRef]
- Debehets, J.; Tacq, J.; Favache, A.; Jacques, P.; Seo, J.W.; Verlinden, B.; Seefeldt, M. Analysis of the variation in nanohardness of pearlitic steel: Influence of the interplay between ferrite crystal orientation and cementite morphology. Mater. Sci. Eng. A 2014, 616, 99–106. [Google Scholar] [CrossRef]
- Wen, J.; Marteau, J.; Bouvier, S.; Risbet, M.; Cristofari, F.; Secordel, P. Comparison of microstructure changes induced in two pearlitic rail steels subjected to a full-scale wheel/rail contact rig test. Wear 2020, 456–457, 203354. [Google Scholar] [CrossRef]
- Zhao, X.J.; Guo, J.; Liu, Q.Y.; Butini, E.; Marini, L.; Meli, E.; Rindi, A.; Wang, W.J. Effect of spherical dents on microstructure evolution and rolling contact fatigue of wheel/rail materials. Tribol. Int. 2018, 127, 520–532. [Google Scholar] [CrossRef]
- Zhou, L.; Bai, W.; Han, Z.; Wang, W.; Hu, Y.; Ding, H.; Lewis, R.; Meli, E.; Liu, Q.; Guo, J. Comparison of the damage and microstructure evolution of eutectoid and hypereutectoid rail steels under a rolling-sliding contact. Wear 2022, 492–493, 204233. [Google Scholar] [CrossRef]
- Merino, P.; Cazottes, S.; Lafilé, V.; Risbet, M.; Saulot, A.; Bouvier, S.; Marteau, J.; Berthier, Y. An attempt to generate mechanical white etching layer on rail surface on a new rolling contact test bench. Wear 2021, 482–483, 203945. [Google Scholar] [CrossRef]
- Dylewski, B.; Risbet, M.; Bouvier, S. The tridimensional gradient of microstructure in worn rails—Experimental characterization of plastic deformation accumulated by RCF. Wear 2017, 392–393, 50–59. [Google Scholar] [CrossRef]


| Element | C | Si | Mn | P | S | Cr | Al |
|---|---|---|---|---|---|---|---|
| wt % | 0.62–0.8 | 0.15–0.58 | 0.7–1.2 | ≤0.025 | ≤0.025 | ≤0.15 | ≤0.004 |
| Ring | Test | Loading Cycle |
|---|---|---|
| AT | T1 | 1000 cycles with 0% sliding |
| T2 | 1000 cycles with 0.5% sliding | |
| T3 | 1000 cycles with 0% sliding + 1000 cycles with 0.5% sliding | |
| AT-C | T1 | 1000 cycles with 0% sliding |
| T2 | 1000 cycles with 0.5% sliding | |
| T3 | 2000 cycles with 0.5% sliding + 1000 cycles with 0.5% sliding 1 |
Publisher’s Note: MDPI stays neutral with regard to jurisdictional claims in published maps and institutional affiliations. |
© 2022 by the authors. Licensee MDPI, Basel, Switzerland. This article is an open access article distributed under the terms and conditions of the Creative Commons Attribution (CC BY) license (https://creativecommons.org/licenses/by/4.0/).
Share and Cite
Lafilé, V.; Marteau, J.; Risbet, M.; Bouvier, S.; Merino, P.; Saulot, A. Characterization of the Microstructure Changes Induced by a Rolling Contact Bench Reproducing Wheel/Rail Contact on a Pearlitic Steel. Metals 2022, 12, 745. https://doi.org/10.3390/met12050745
Lafilé V, Marteau J, Risbet M, Bouvier S, Merino P, Saulot A. Characterization of the Microstructure Changes Induced by a Rolling Contact Bench Reproducing Wheel/Rail Contact on a Pearlitic Steel. Metals. 2022; 12(5):745. https://doi.org/10.3390/met12050745
Chicago/Turabian StyleLafilé, Vincent, Julie Marteau, Marion Risbet, Salima Bouvier, Pierrick Merino, and Aurélien Saulot. 2022. "Characterization of the Microstructure Changes Induced by a Rolling Contact Bench Reproducing Wheel/Rail Contact on a Pearlitic Steel" Metals 12, no. 5: 745. https://doi.org/10.3390/met12050745
APA StyleLafilé, V., Marteau, J., Risbet, M., Bouvier, S., Merino, P., & Saulot, A. (2022). Characterization of the Microstructure Changes Induced by a Rolling Contact Bench Reproducing Wheel/Rail Contact on a Pearlitic Steel. Metals, 12(5), 745. https://doi.org/10.3390/met12050745