Article

Kinetics of Reordering in Quenched Ni2Mn0.8Cu0.2Ga Ferromagnetic Shape Memory Alloys

by
Concepció Seguí
Departament de Física, Universitat de les Illes Balears, Campus Cra. Valldemossa, km 7.5, 07122 Palma, Spain
Metals 2022, 12(5), 738; https://doi.org/10.3390/met12050738
Submission received: 15 March 2022 / Revised: 13 April 2022 / Accepted: 22 April 2022 / Published: 26 April 2022

Abstract

:
Quenched Ni2Mn1−xCuxGa ferromagnetic shape memory alloys undergo two consecutive post-quench ordering processes. The kinetics of order recovery has been analysed in detail for Ni2Mn0.8Cu0.2Ga, based on the calorimetric curves obtained during post-quench heating at constant rates. Isoconversional methods have been used to determine the activation energy, the pre-exponential factor, and the reaction model that best fits the two reordering processes. The kinetic analysis has been extended to samples quenched from different temperatures. The kinetic study shows that order improvement processes in quenched Ni2Mn0.8Cu0.2Ga alloys can be described by a first order reaction model, consistent with site-saturation nucleation and homogeneous diffusion-controlled growth, with apparent activation energies around 1.1 eV. The pre-exponential factors, especially those obtained for samples quenched from different temperatures, highlight the crucial role of the vacancies retained by high temperature quenching on the atomic reordering underlying the observed processes.

1. Introduction

Ferromagnetic shape memory alloys (FSMA) show, along with the properties of conventional shape memory alloys, such as shape memory effect and superelasticity, other unique capabilities arising from the coupling between the magnetic and structural phase transitions. The most studied FSMAs are Heusler-type, particularly near-stoichiometric Ni2MnGa alloys, that undergo thermoelastic martensitic transformation (MT) from the cubic L21 parent phase (austenite) to a less symmetric phase (martensite). Reorientation of the martensite variants under magnetic field produces magnetic field-induced strain (MFIS) [1,2,3], which is the most characteristic property of FSMAs. Other multifunctional properties, such as magnetic shape memory, magnetocaloric effect, and magnetoresistance [4,5], appear even more promising for application than MFIS.
The main factors that affect the magnetostructural properties of Ni−Mn−Ga type alloys are composition and atomic order. Both can change the MT (TMT) and Curie (TC) temperatures. If these temperatures can be modified in such a way that the TC be placed, as required, above or below the MT, it is possible to achieve that the high and low temperature phases have the desired magnetic order, thus favouring the magnetostructural coupling and related properties.
Regarding composition, in the case of Ni−Mn−Ga alloys, the greatest achievements have been obtained by Co or Cu-doping [6,7,8,9,10,11]. In that line, Co often replaces Ni or Mn, and it has been found that both TMT and the austenite TC ( T C A ) increase, while the martensite Curie temperature decreases, with increasing electron to atom ratio. As a result, Ni2-xCoxMn1.2Ga0.8 alloys with x = 0.2–0.36 show ferromagnetic austenite to low magnetization martensite MT [6,7]. In the case of Cu-doping, Cu usually replaces Mn, and it is found that Cu-content increases the TMT while both the austenite and martensite TC decrease [8,9,10,11]. Hence, the structural and magnetic transitions can be tuned in such a way that paramagnetic austenite to ferromagnetic martensite transition occurs for Ni2Mn1−xCuxGa with x = 0.22–0.3 [10].
On the other hand, the change of long-range atomic order also affects the MT and the magnetic properties, due to the modification of the electronic structure and the lattice site occupancy by the magnetic atoms. Close to stoichiometric Ni–Mn–Ga alloys solidify from the melt to a cubic B2 structure, from which the austenitic L21 structure is formed through a B2→L21 ordering reaction that takes place on further cooling. Due to the diffusionless character of the MT, the martensite inherits the austenite atomic order [12,13,14]. The degree of long-range atomic order can be easily modified applying thermal treatments [14,15,16,17,18,19]. As a general rule, quenching from temperatures around the B2↔L21 transition (which is approximately 1100 K for ternary Ni–Mn–Ga [12]) results in partial retention of the low L21 atomic order present at high temperatures. The equilibrium order degree in as-quenched alloys can be progressively restored by post-quench ageing at temperatures at which atomic diffusion is possible, as proven by neutron diffraction experiments [14,20,21].
The effect of the atomic order on the MT and magnetic characteristics has been studied both in ternary Ni–Mn–Ga alloys [14,18,19] as well as for Co and Cu-doped Ni−Mn−Ga [6,7,22]. As a general result, it is found that Curie temperatures increase with L21 order, as a consequence of the variation of the magnetic moment of the alloys depending on the position of the Mn atoms, which couple antiferromagnetically when they are nearest neighbours (Mn atoms on the Ga positions) and ferromagnetically when they are next-nearest neighbours (Mn atoms in the Mn sublattice) [23,24]. Moreover, the MT temperatures are modified by changes in atomic order, although there is no unique trend. MT temperatures respond to atom site occupancy through electronic structure (covalent bond strength and Jahn−Teller effects) but through magnetic structure as well, and they have been observed to increase (as in ternary and Cu-doped Ni−Mn−Ga [14,18,19,22]) or to decrease (as in Co-doped Ni−Mn−Ga [6,7]). It is worth mentioning that in the latter case, the opposite evolution of the Curie and MT temperatures with increasing atomic order can lead to changes in the magnetic order of austenite and martensite, with the concurrent modification of magnetostructural properties [6,7]).
As mentioned above, the low L21 order retained after quench can be progressively improved up to the equilibrium value by post-quench ageing. A manifestation of this reordering process is the appearance of a broad exothermic calorimetric peak at temperatures well above the MT, which appears only in the first post-quench heating run [6]. In a recent work, the influence of atomic order on the martensitic and magnetic transformations undergone by Ni2Mn1−xCuxGa ferromagnetic shape memory alloys was investigated [22]. Both the MT and Curie temperatures were found to increase during post-quench aging, but these temperatures evolve at different rates: the MT temperatures increase from the start of aging while the Curie temperature begins to rise at a later stage in the aging process. Furthermore, during post-quench heating of Ni2Mn1−xCuxGa alloys, two consecutive DSC exothermic peaks were observed, indicative of two thermally activated processes.
This behaviour is exclusive to Ni2Mn1−xCuxGa alloys, since it was proven that Ni–Mn–Ga ternary alloys, as well as Co-doped Ni–Mn–Ga and, surprisingly, Ni2−xCuxMnGa alloys, display a single exothermic peak. Additionally, it was observed that the peak that is common to all alloys is suppressed after quench from temperatures well below the B2↔L21 transition. Based in the above results, the process undergone by all alloys, and that is responsible for the change in Curie temperature, is attributed to the improvement of L21 order, due to the exchange of Mn and Ga atoms located at antisites after quench. For the other process, which only occurs in Ni2Mn1−xCuxGa alloys and underlies the rise of martensitic transformation temperatures, the diffusion of Cu atoms, misplaced in the Ni sublattice after quench, towards their most favourable sites in the Mn sublattice is proposed as the responsible mechanism. A preliminary evaluation of the kinetics of the two post-quench aging processes was performed in [22] using Kissinger’s method, yielding different activation energies: 1.16 eV for the process that is common to all alloys and 1.35 eV for the one that is solely observed in Ni2Mn1−xCuxGa alloys.
Beyond the evaluation of activation energies and their comparison with the diffusion energies of the components, the analysis and quantification of the kinetics of the reordering processes can shed light on the mechanisms that govern these processes and the factors that affect them. Despite the crucial influence of the changes in the degree of atomic order on the properties of Ni−Mn−Ga-based alloys, there are hardly any detailed studies of the ordering and reordering kinetics in these alloys.
This work presents the results of the in-depth analysis of the kinetics of the reordering processes in Ni2Mn0.8Cu0.2Ga alloy. The quantification of the fundamental kinetic parameters has been carried out based on the calorimetric curves obtained during post-quench heating at constant rates. Isoconversional methods have been used to determine not only the activation energy, but also the pre-exponential factor and the reaction model that best fit the two post-quench reordering processes described above. The kinetic analysis has been extended to samples quenched from different temperatures, highlighting the crucial role of the vacancies retained by high temperature quenching. Thus, the atomic diffusion that gives rise to the atomic reordering underlying the observed processes is enhanced by vacancies.

2. Materials and Methods

The study has focused on a Ni2Mn0.8Cu0.2Ga alloy, (hereinafter called Cu5), although for comparison purposes, the ternary Ni2.1MnGa0.9(Cu0) has also been analysed. All used alloys are polycrystalline, prepared by induction melting in argon atmosphere using high purity elemental metals. The ingots have been melted several times and homogenized for 24 h at 1170 K in a vacuum quartz tube, followed by quench in water at room temperature. Long range atomic order has been modified by means of additional thermal treatments, consisting of annealing for 1 h at temperatures TWQ = 570–1170 K, followed by quench into water at room temperature, and subsequent post-quench ageing. The latter has been carried out by continuous heating up to 670 K.
The martensitic and magnetic transitions, as well as the reordering processes, have been monitored by differential scanning calorimetry measurements (DSC 2920, TA Instruments Inc., New Castle, DE, USA). Runs have been performed at temperature rates ranging between 1 and 20 K/min. The broad exothermic DSC peaks observed at temperatures well above the MT during the first post-quench heating run are considered to be proportional to the rate of progress of the thermally activated process that takes place at the corresponding temperature interval. Thus, the conversion fraction, x, is calculated as:
x ( T ) = Δ Q ( T ) Δ Q t o t  
where ΔQ(T) is the heat flow integrated up to T, after the proper baseline correction, and ΔQtot is the overall heat released in the whole process. To minimize the errors that could arise from the choice of the baseline, the DSC curve corresponding to a second heating has been used as guide for baseline selection. Although calibration with Pb (melting at 600.61 K) and In (melting at 429.75 K) at different heating rates proves that thermal inertia is rather small (error below 1 K), these standards have been used to correct the measured temperatures.
The basis of the kinetic analysis is the rate equation:
d x d t = K ( T ) f ( x )  
which gives the conversion rate as a function of the separable variables x and T. The kinetic factor K(T) follows the Arrhenius equation:
K ( T ) = k o e E a c R T
where ko and Eac are the pre-exponential factor and the activation energy, respectively, and R is the universal gas constant. f ( x ) is the reaction model, which can take a number of forms depending on the nature and steps of the studied process.
The combined equation:
d x d t = k o e E a c R T f ( x )  
is valid for any temperature program [25], including constant heating rate for which
d x d t = d x d T · d T d t = β d x d T  
For each temperature rate βi, the fraction x is reached at a temperature T x i , at which conversion rate has a value ( d x / d t ) |   x i . Two different approaches have been used to quantify the kinetic parameters [25]. First, the integral isoconversional method called Kissinger−Akahira−Sunose (KAS), is expressed by:
l n ( β i T x i 2 ) = C E a c ( x ) R T x i  
The plots of l n ( β i / T x i 2 )   vs .   ( 1 / T x i ) for different x should be straight lines whose slope would give the activation energy associated with each x, Eac(x). It is worthwhile to mention that this method reduces to the classic Kissinger’s when the temperature of the maximum of (dx/dt) is used as Tx.
Second, the most common differential isoconvertional method, developed by Friedman, is based on the equation:
l n ( d x d t ) | x i   = l n [ k o f ( x ) ] x i E a c ( x ) R T x i
which again provides Eac(x) from the plots of l n ( d x / d t ) | x i   vs .   ( 1 / T x i ) for different x. It is worth keeping in mind that the above expressions allow to obtain activation energies without the need to set a reaction model.
Even though (6) and (7) provide activation energies dependent on the fraction x, the principle of separation of variables implicit in (2) requires that Eac be constant. To advance in the determination of the kinetic parameters, an activation energy valid for the entire process must be set. Should that be done, ko and f(x) can be determined choosing a generic type of reaction model. In our case, owing to the sigmoidal shape of the x(T) curves and according to the literature [25,26,27], a n-order reaction model, f ( x ) = ( 1 x ) n is assumed. Therefore, Equation (7) becomes:
l n ( d x d t ) + E a c R T = l n ( k o ) + n l n ( 1 x )
and the straight lines obtained by plotting [ l n ( d x / d t ) + ( E a c / R T ) ]   vs .   l n ( 1 x ) for each temperature rate yield the corresponding values of ln(ko) and the exponent n.

3. Results and Discussion

Figure 1 shows the DSC curve obtained on cooling down to 210 K and subsequent heating up to 670 K, at the temperature rate of 5 K/min, of a Cu5 sample quenched from 1020 K. The exothermic and endothermic peaks observed at low temperatures correspond to the forward (cooling) and reverse (heating) MT, respectively, whereas the anomaly around 300 K is associated with the ferromagnetic transition taking place in the austenitic phase. The temperatures taken as characteristic for the structural (MP and AP) and magnetic transitions ( T C A ) are labelled in Figure 1. As stated in Section 1, a low degree of L21 atomic order is retained after water quench from temperatures around the B2↔L21 transition (1020 K for alloy Cu5 [22]), and the equilibrium order degree can be progressively restored by post-quench ageing at temperatures at which atomic diffusion is possible. In Figure 1, complete reordering occurs during continuous heating up to 670 K, and in the course of that process two broad exothermic peaks are observed, labelled as P1 and P2. The MT and Curie temperatures change due to order improvement, but with different kinetics. To highlight and summarize those changes, Figure 2 shows the DSC curves obtained during cooling and subsequent heating up to 500 K just after quench (blue curve); subsequent cooling after overcoming P2 and heating up to 670 K (red curve), and cooling followed by heating after passing P1 (black curve). In the latter curve, heating continues up to 670 K (dotted black line) to show that the exothermic peaks P1 and P2 are irreversible, since they do not appear in subsequent heating runs. On heating above P2, a significant change in the MT temperatures (MP and AP) is observed (compare blue and red curves), but T C A does not change, as shown in the inset in Figure 2. By additional heating up to 670 K (above P1), the Curie temperature increases as well (compare red and black curves). More details about the evolution of the MT and Curie temperatures during progressive ageing can be found in [22], but from Figure 2 it is easy to relate each one of the broad exothermic peaks with the evolution of the MT and Curie temperatures: P2 accounts for a process which produces an increase in the MT temperatures, while P1 accounts for a second process that results in an increase of Curie temperature. The time evolution of the transition temperatures during isothermal ageing [22] proves that both processes are thermally activated.
All tested Ni2Mn1−xCuxGa alloys (x = 0.12–0.36) present these two post-quench exothermic peaks, with the interesting feature that the magnitude of the lowest temperature peak (P2) decreases with decreasing copper content. Instead, the ternary Ni−Mn−Ga, Co-doped and Cu-doped Ni−Mn−Ga alloys where Cu replaces Ni display a single exothermic peak (P1). The role of Cu, specifically Cu replacing Mn, is therefore decisive for the phenomenon associated with the peak as-called P2 [22]. Figure 3 shows the DSC curves obtained during heating up to 670 K of Cu5 and ternary Cu0 samples previously quenched from 1020 K.
Another relevant characteristic of the studied processes is their evolution when the quenching temperature (TWQ) changes. In this sense, the most relevant observation is the suppression of P1 for TWQ below 770 K, the lower temperature exothermic peak P2 being the only one left after quench from temperatures at which L21 order is complete. However, it is also interesting to note that the peak temperatures for both P1 and P2 shift towards higher temperatures as TWQ is lowered. These features are shown in Figure 4, where the DSC curves obtained during heating Cu5 samples previously quenched from the indicated TWQ temperatures are displayed.
Based in the above results, the process associated to P1, that all alloys undergo and that is responsible for the change in Curie temperature, is attributed to the improvement of L21 order mainly due to Mn diffusion. For the other process causing P2, which is only observed in Ni2Mn1−xCuxGa alloys and underlies the rise of martensitic transformation temperatures, the diffusion of Cu atoms, misplaced in the Ni sublattice after quench, towards their most favourable sites in the Mn sublattice is proposed as the responsible mechanism [22].
Figure 5a shows the DSC curves for Cu5 samples as-quenched from 970 K, corresponding to P2 after baseline correction, and recorded during heating at different rates between 1 and 20 K/min. According to the conversion fraction given by Equation (1), these curves provide (dx/dt), and their normalized integral up to temperature T gives x(T). Figure 5b shows the x(T) curves obtained for the different heating rates. Application of the Kissinger−Akihara−Sunose method expressed by Equation (6) is shown in Figure 5c, from which an activation energy E a c K A S is calculated for x = 0.1−0.9. Similarly, Friedman’s method based on Equation (7) is applied, giving rise to the straight lines shown Figure 5d, which yield activation energies E a c F for each x. Figure 5e shows the obtained apparent activation energies as a function of the conversion fraction. Both E a c K A S and E a c F vary with x. A systematic dependence of Eac on x indicates the occurrence of several stages with different activation energies, that is, a multi-step process. This being the case, we must not forget that the beginning and end of the conversion are much more affected by the errors that could be made in the baseline correction, so the activation energy values provided at low and high x will undoubtedly be less precise. In Figure 5e, a star symbol indicates the Eac that was obtained in [22] from the Kissinger’s method, fitting, as expected, with KAS method around x = 0.5. The average activation energies are 1.3 eV (130 kJ/mol) for KAS method and 1.2 eV (118 kJ/mol) for Friedman’s. Since Equation (8) derives from Friedman’s method, the last one will be used to calculate the other kinetic parameters. The straight lines that according to Equation (8) result from the plots of [ l n ( d x / d t ) + ( E a c / R T ) ]   vs .   l n ( 1 x ) for each temperature rate are shown in Figure 5f, and the obtained values of n and ln(ko) are given in the inset.
The same steps have been taken with DSC curves corresponding to P1 after baseline correction, recorded during heating at different rates between 1 and 20 K/min, giving rise to Figure 6a,f, the last obtained using an average activation energy of 1.1 eV (107 kJ/mol).
For comparison purposes, the DSC curves obtained during heating at chosen temperature rates for samples of the ternary alloy Cu0, corresponding to the single exothermic peak (P1) after quench from 970 K, have been analysed along the same lines, and the results are shown in Figure 7a,f (average activation energy 1.2 eV = 117 kJ/mol).
Table 1 summarizes the average values of the kinetic parameters obtained for the thermally activated processes underlying P1 (for Cu5 and Cu0 samples) and P2. When interpreting these parameters, several aspects have to be considered. Atomic diffusion, as needed to restore quenched-in disorder in the studied alloys, is mediated by vacancies [28]. We can assume that the rate of atom diffusion in a particular process at a given temperature is proportional to the atomic vibration frequency (ν), the number of present vacancies cv(T), and the rate of successful jumps of the energy barrier (Eac) for that process, exp(−Eac/RT). For quenched samples, the retained excess vacancy concentration is much higher than the equilibrium concentration at T. Thus, cv(T) can be approached by the vacancy concentration at the quenching temperature TWQ, cv(TWQ). Finally, a factor (α) accounting for the correlation factor for diffusion, the lattice parameter, and the number of jumps has to be included. Thus, we can assume that
K ( T ) ~ α · ν · c v ( T W Q ) e x p ( E a c R T )

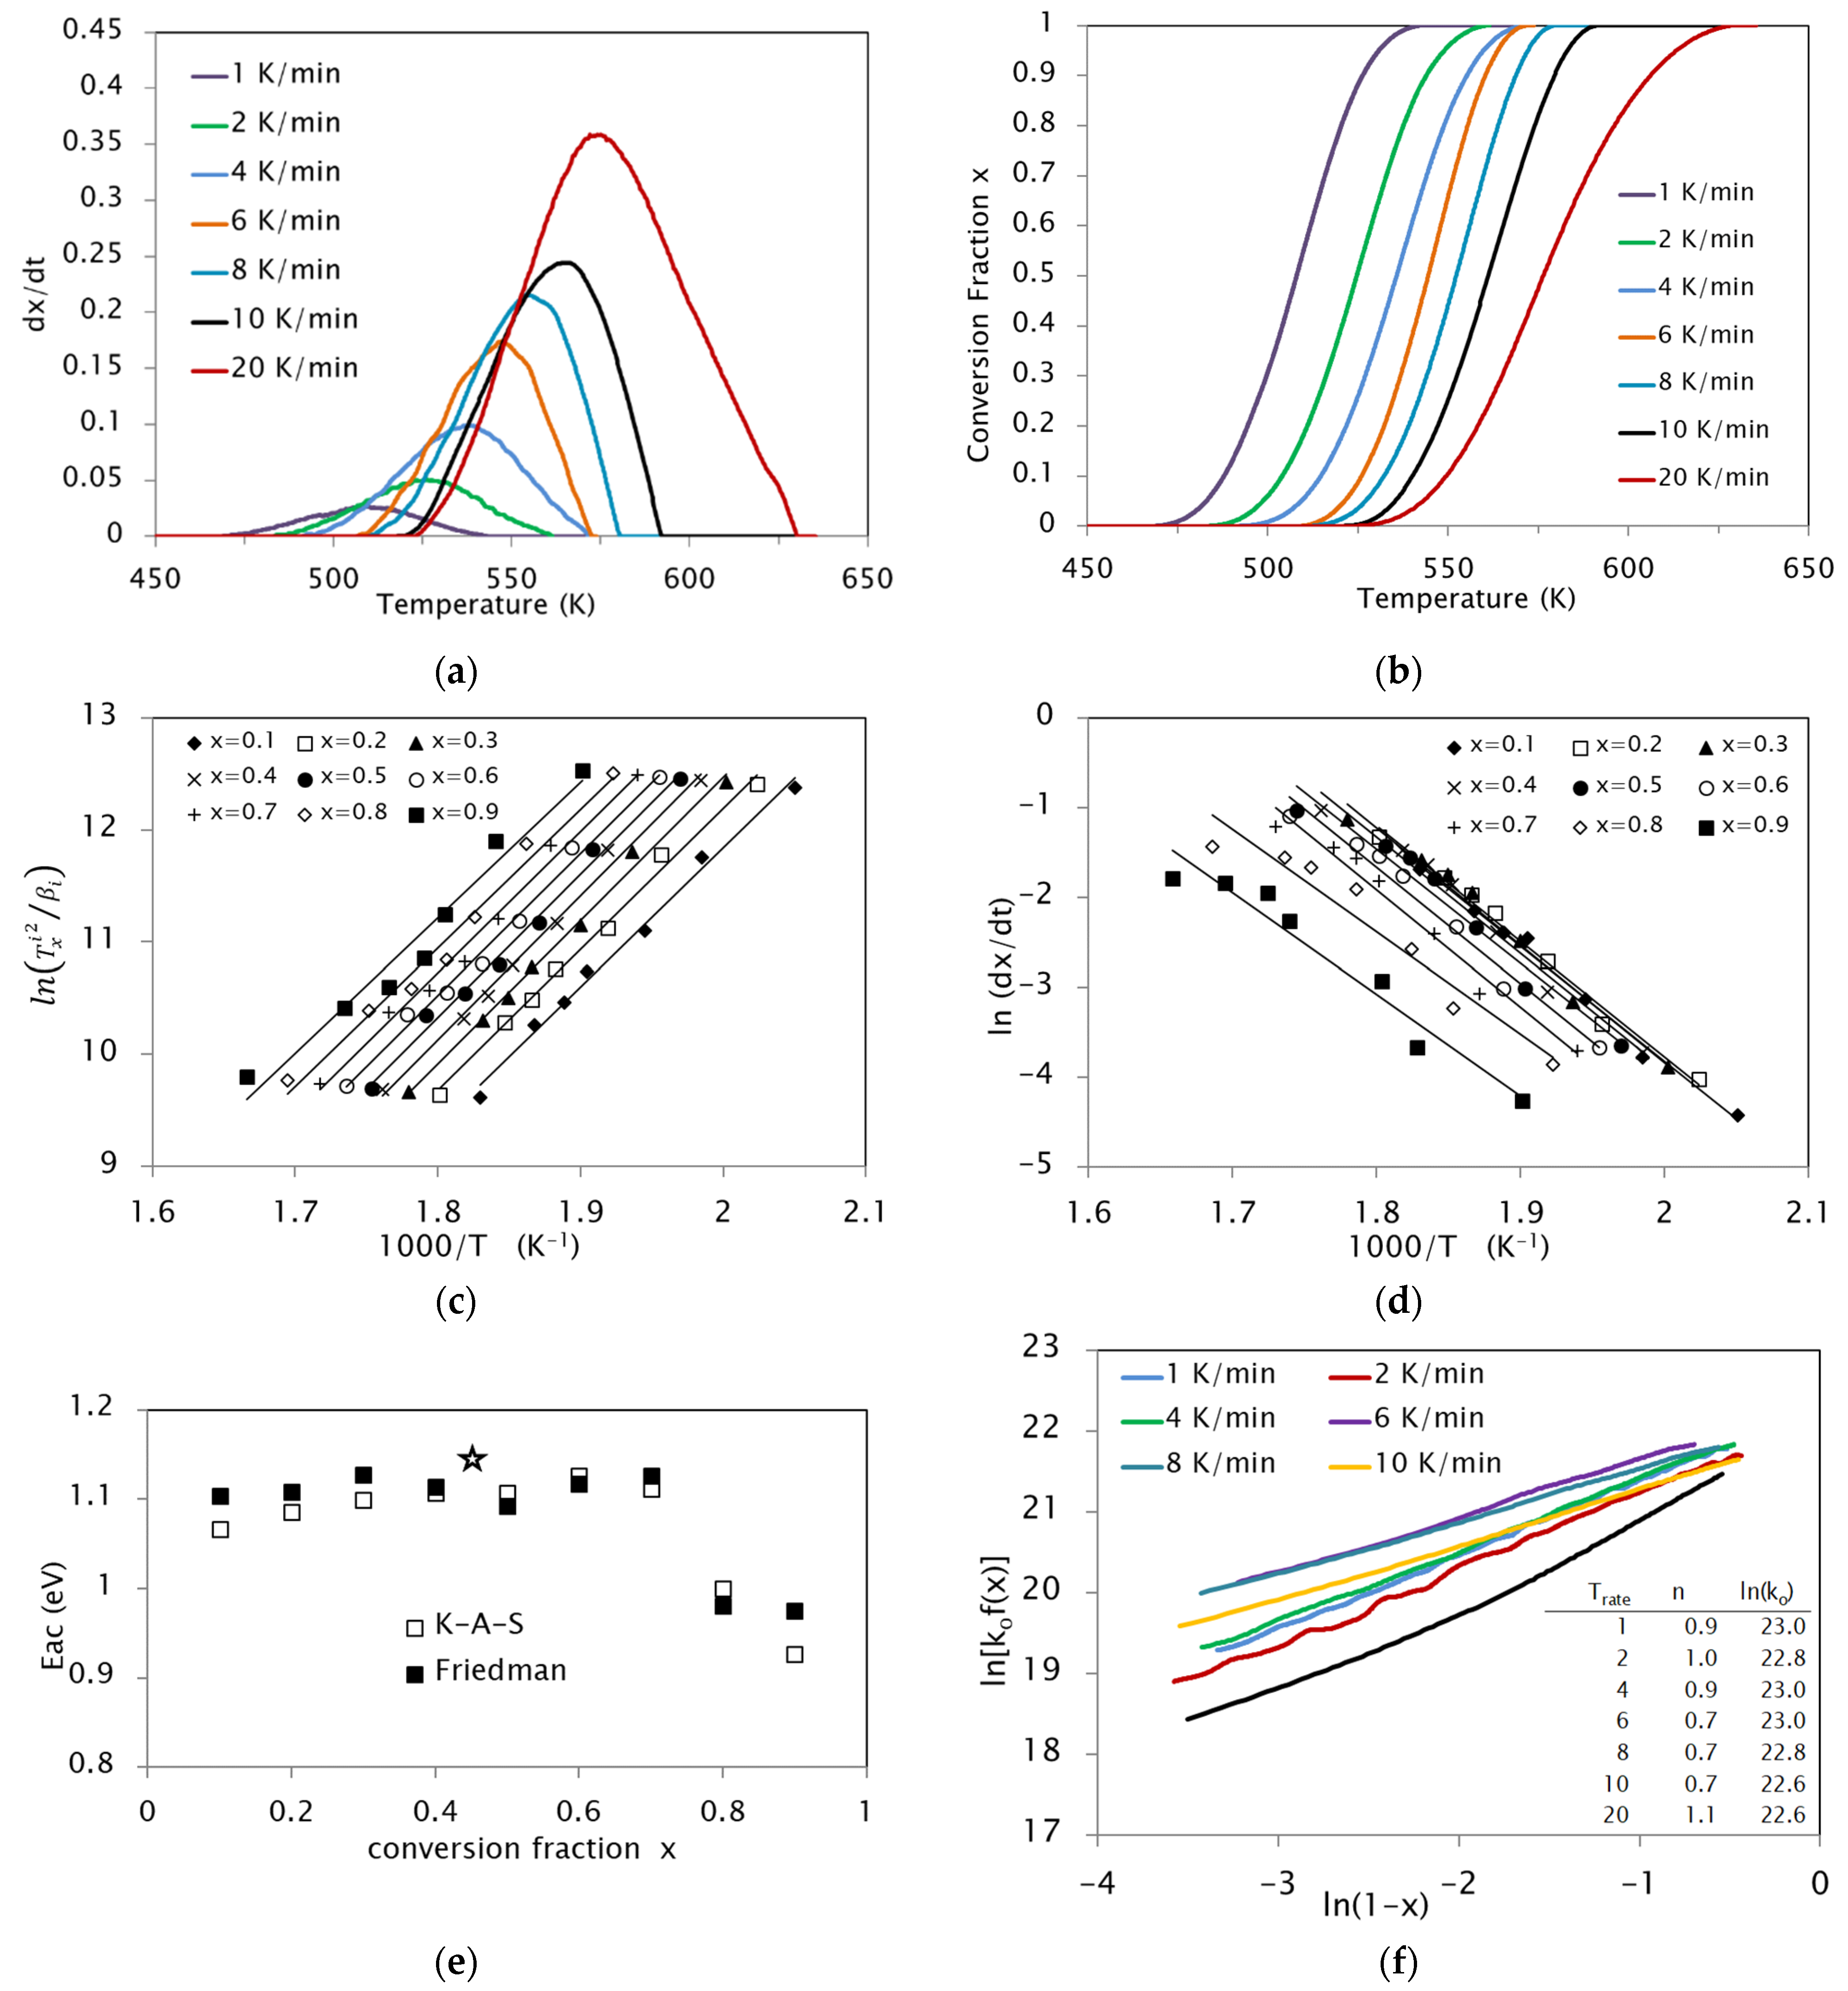
3.1. Activation Energies

The activation energy for a vacancy-mediated diffusive mechanism includes the vacancy migration energy, but also the energy barriers that an atom must overcome to reach a given position. In the actual case, the scenario to consider includes different types of atoms, an ordered structure, and the contribution of defects. Therefore, the displacement of a certain type of atom to a specific position requires a number of steps with a complex collective action of different migration barriers. Given the complexity of atomic motion, the activation energy cannot be approached by a simple migration energy, as we do for the case of self-diffusion in a unary system.
It has been also indicated above that the obtained activation energies depend on the conversion fraction x, i.e., they depend on temperature. As explained before, this reveals the existence of multistep reactions where the energy barriers evolve with x and/or T. Nevertheless, the overall variation of Eac in the range x = 0.2–0.8 is about 10%, which justifies the choice of a single activation energy as representative of the whole process. The activation energies obtained by KAS or Friedman’s methods also differ by less than 10%, which can be attributed to the errors associated with the correction and integration of the DSC curves.
According to the mechanisms proposed in [22] as responsible for the observed phenomena, namely the improvement of L21 order, due to the diffusion of Mn atoms located at Ga sites after quench (P1) and diffusion of Cu atoms, misplaced in the Ni sublattice after quench, towards their most favourable sites in the Mn sublattice (P2), the obtained activation energies should be compared with those for diffusion of the corresponding atoms. To establish a comparison framework, Table 2 presents some activation energy values worthy of comparison.
The apparent activation energies obtained for the processes underlying P1 and P2 lie between those for the formation and migration of vacancies in Ni−Mn−Ga [28] and those for the diffusion of Mn in L21 Ni2MnGa [31] and Cu in DO3 Cu−Al−Be [33]. They are very close to those for vacancy-mediated improvement of atomic ordering in quenched Ni−Mn−Ga [32] and Cu3Mn [27]. The presence of a high concentration of non-equilibrium vacancies after quench, favouring the reordering processes, is likely lowering the activation energies in the present case with respect to Mn and Cu self-diffusion [29,30].

3.2. Pre-Exponentional Factor

The pre-exponential factors ko obtained for the reordering phenomena related to P1 and P2 are presented in Table 1, and are in reasonable agreement with Equation (9); being ν~1013 s−1 for most metals and cv(TWQ = 970 K)~2 × 10⁻³ [28], the expected values would be around 2 × 10¹⁰ s−1. Furthermore, according to [28], during continuous post-quench heating up to the temperatures where P1 and P2 occur, part of the retained excess vacancies are eliminated (without formation of new vacancies), and we can estimate the concentration of vacancies to be cv(TP1)~1.6 10−3 and cv(TP2)~10−4 [28]. Table 2 shows values of the pre-exponential factors for the diffusion of Cu and Mn in different cases. These values also lie between the atomic frequency of vibration and the effect of vacancies, and it is worthwhile to notice that taking the values for Cu and Mn self-diffusion (1.9 × 10¹⁴ [29] and 1.3 × 10¹³ [30] respectively) as (α·ν), the effect of quenched-in vacancies would lead to (1.9 × 1014 × 1.5 × 10−3) = 3 1011 for Cu, and (1.3 × 1013 × 10−4) = 1.3 × 10⁹ for Mn, very similar to the obtained values. In that sense, it is interesting to realize that the ko values for P1 are the same for the Cu5 and Cu0 alloys and differ from those of P2.
Unfortunately, given the complexity of the atomic movements invoked above, we cannot use correlation factors proper to simpler structures and diffusion mechanisms (see for example [34]), and therefore we can only compare the order of magnitude. In fact, it can be observed in Table 2 that the pre-exponential factors for complex structures and mechanisms are lower than those for self-diffusion. In any case, the pre-exponential factors here obtained highlight the role of the vacancies in the ordering processes.

3.3. Reaction Model

As stated in Section 2, owing to the sigmoidal shape of the x(T) curves and according to the literature [25,26,27], a n-order reaction model, f ( x ) = ( 1 x ) n has been assumed. Order-based reaction models are the simplest solid-state reaction models, commonly used in homogeneous kinetics [26]. The exponents n corresponding to the reordering reactions P1 and P2 have been determined according to Equation (8), giving rise to values around n = 1 in all cases, although with high scatter, attributable, on the one hand, to the multistep nature of the processes, and on the other, to the errors derived from the manipulation of the experimental DSC curves. Altogether, an effective value of n = 1 can be taken as indicative of the reaction model followed by both the processes associated with P1 and P2. Therefore, a first order, also called Mampel, kinetic model is ruling these processes. Such a model can be seen as a special case of the Avrami–Erofeyev model with exponent n = 1. The Avrami exponent includes contributions from both the nucleation and growth of the product phase from the parent phase. The nucleation contribution to the Avrami exponent is zero for site-saturation and is one for continuous nucleation. Hence, in the case of overall Avrami exponent n = 1, there is no other choice than site-saturation nucleation [26]. Thus, nucleation sites already exist or are formed immediately at the beginning of the process. As for the growth mechanism, a contribution of 1 to the exponent is consistent either with interface-controlled growth or with homogeneous diffusion-controlled growth [25,26,35]. Since there is no interface displacement in the processes here studied [22], the latter seems the most likely scenario. The order reaction n determined for order-disorder transformations as well as for order improvement processes in other alloys [27,35] has also been n = 1, which seems to indicate that it is a common characteristic of the development of atomic order.

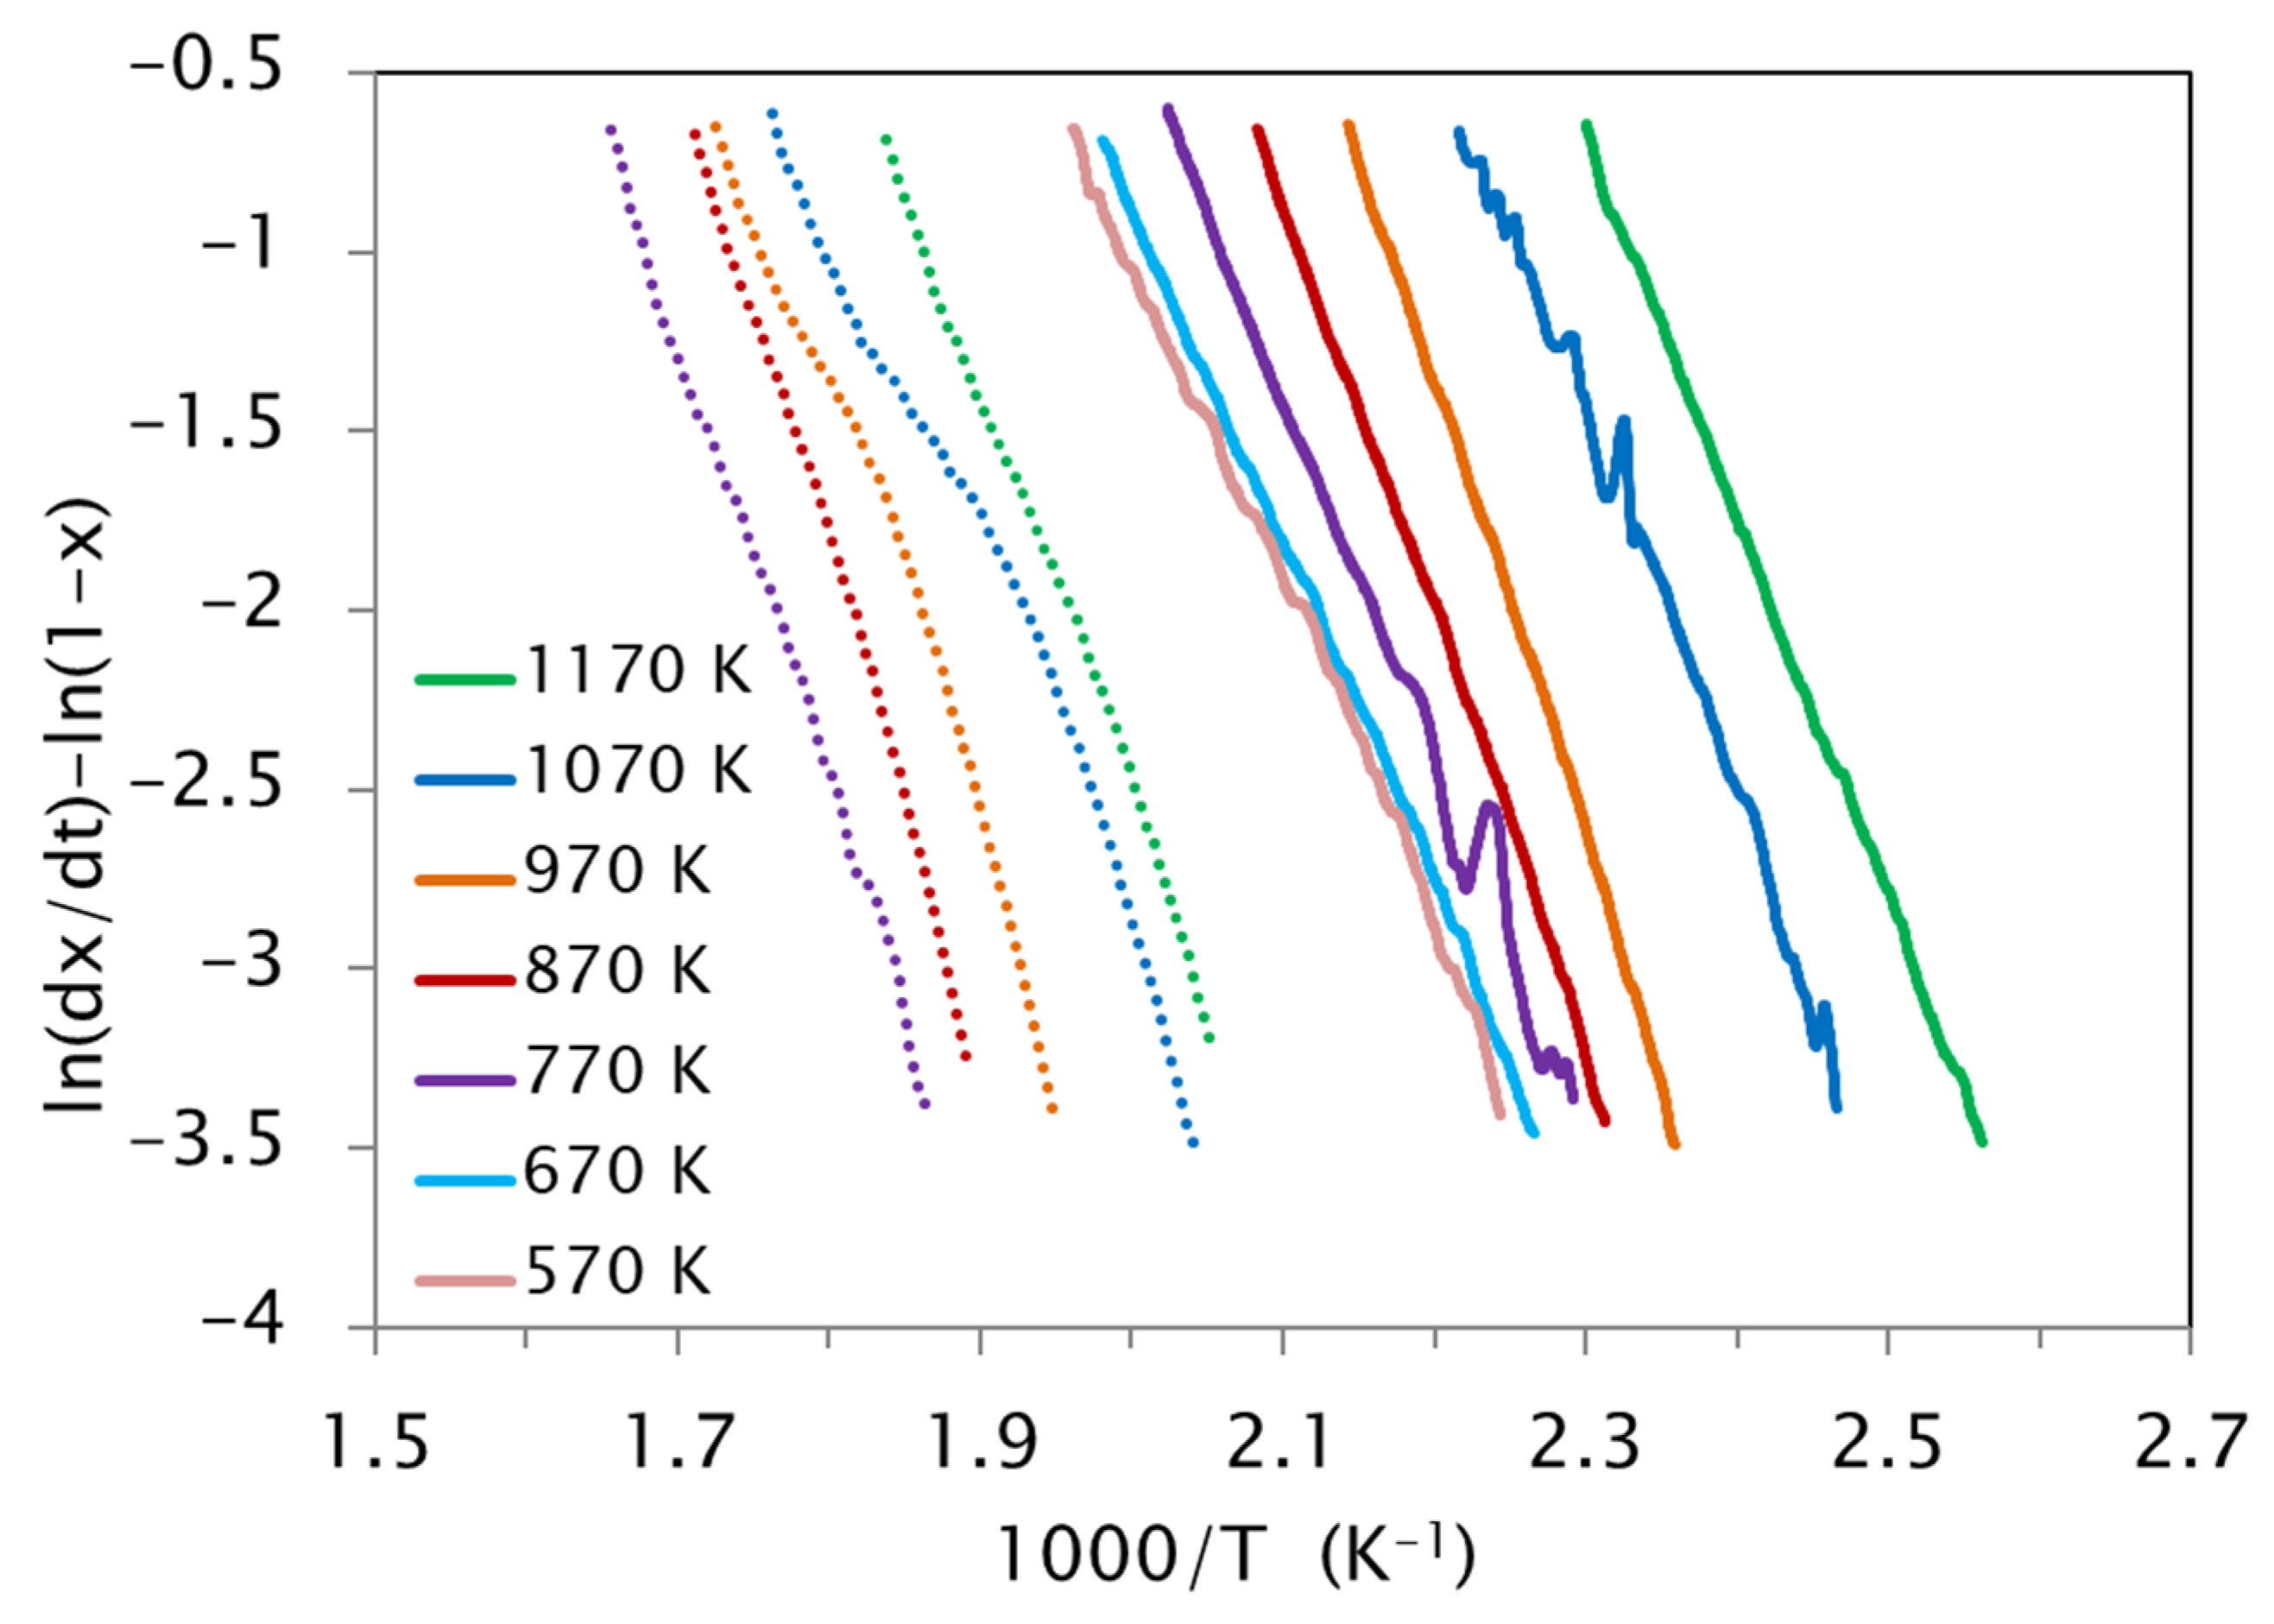
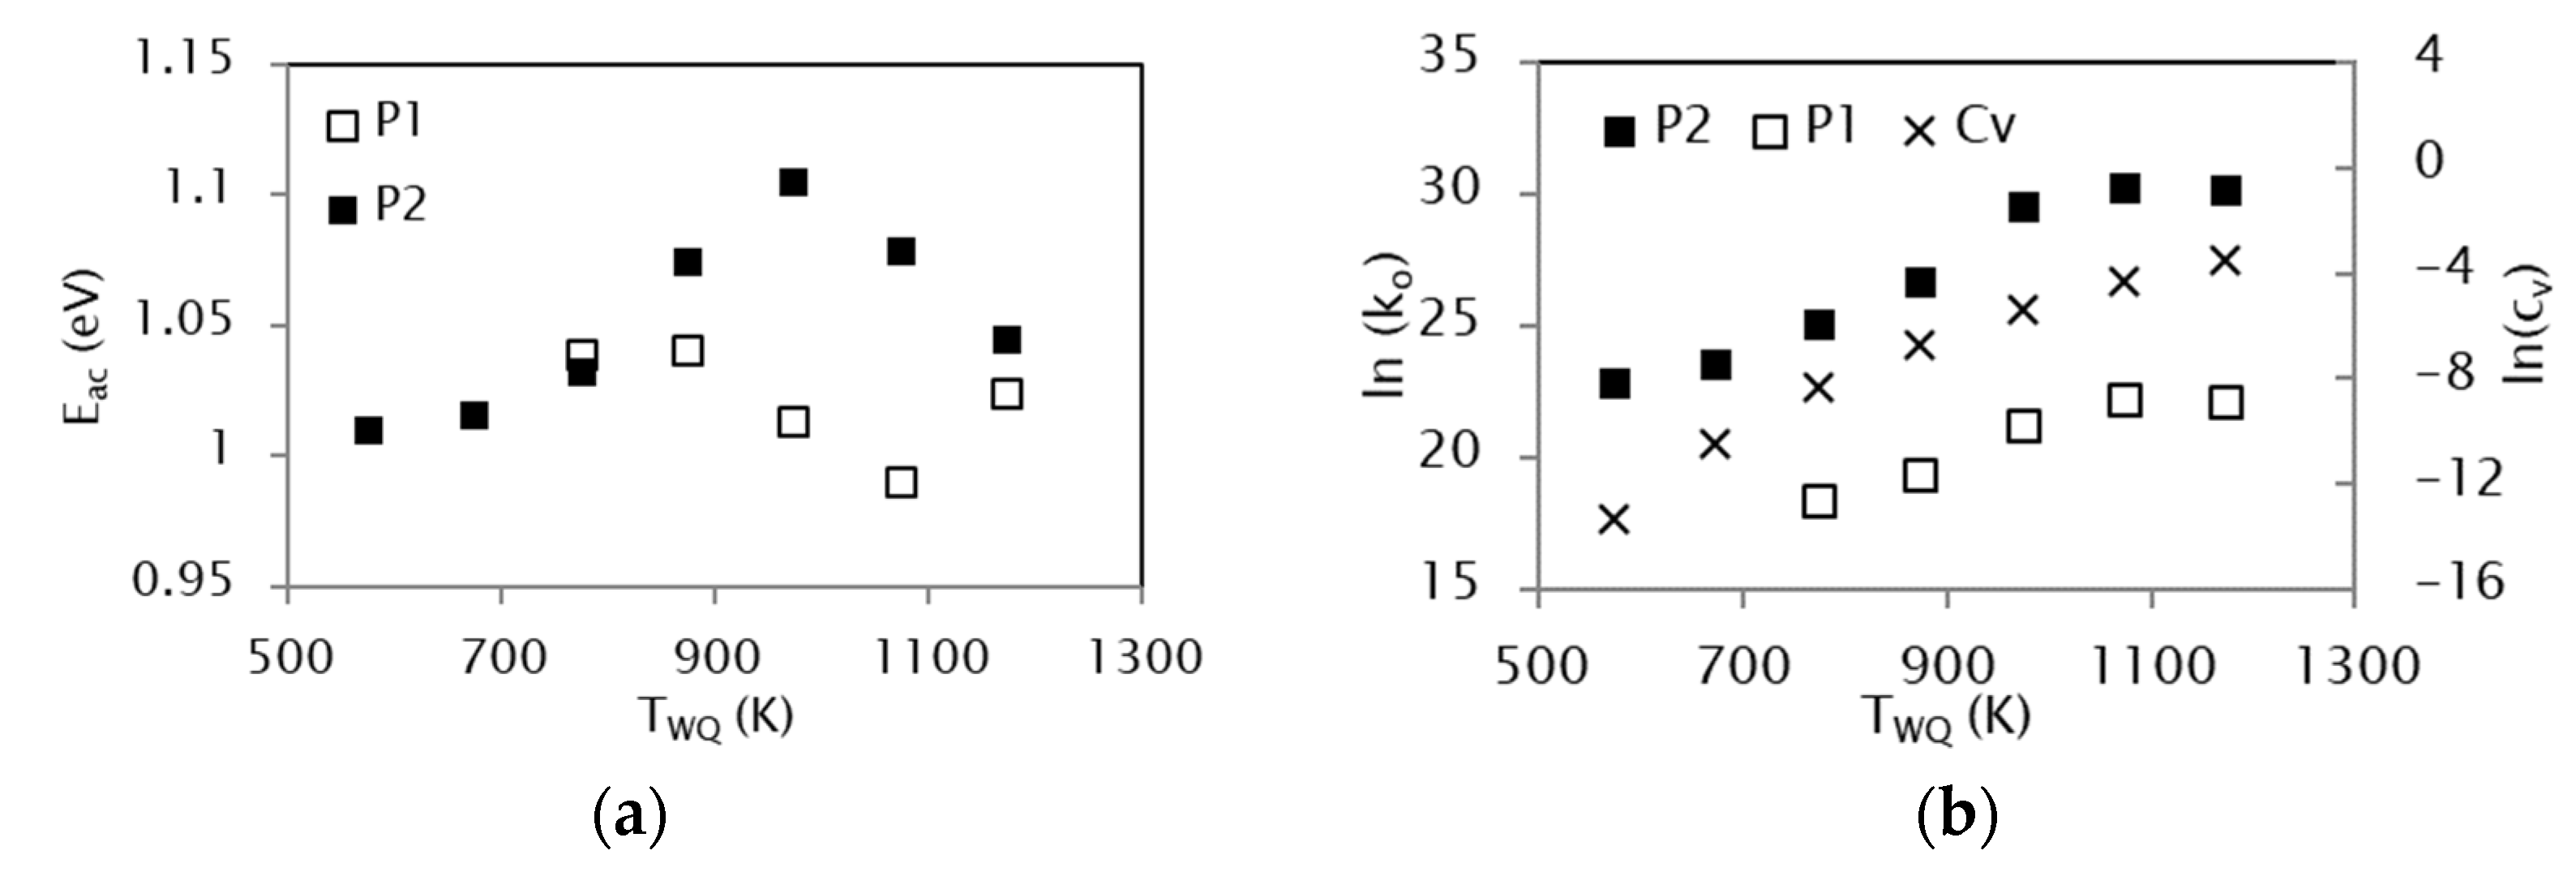
3.4. Effect of the Quenching Temperature on the Kinetic Parameters

The kinetic analysis has been extended to the DSC curves obtained during heating samples of alloy Cu5 quenched from different temperatures TWQ. These curves are shown in Figure 4, where it can be noted that the peak temperatures for both P1 and P2 shift towards higher temperatures as TWQ is lowered, indicating that the processes require less energy after quenching from higher temperatures.
In this case, to obtain the kinetic parameters from the available curves, a first order reaction model has been assumed, so that Equation (8) results
l n ( d x d t ) l n ( 1 x ) = l n ( k o ) + E a c R T
and the plots of [ l n ( d x / d t ) l n ( 1 x ) ]   vs .   ( 1 / T ) for each quenching temperature should be straight lines that yield the corresponding values of ln(ko) and Eac. Clearly, the kinetic parameters obtained from a single curve will be less precise than those gathered Figure 5, Figure 6 and Figure 7, but they could still be compared with each other in order to elucidate the effect of the quenching temperature. Figure 8 presents the [ l n ( d x / d t ) l n ( 1 x ) ]   vs .   ( 1 / T ) lines corresponding to P2 (full lines) and P1 (dotted lines) for different TWQ.
The corresponding activation energies and pre-exponential factors are displayed in Figure 9a,b as a function of TWQ. The changes in Eac are rather small, as anticipated by the minor slope changes in Figure 8, yet they are important since they show a tipping point around 1000 K, where the B2−L21 order-disorder transition takes place [22]. Indeed, it is well known that the activation energy depends on the order degree [31,34], since the atomic environment of the jumping atoms varies with it. Obviously, the L21 order frozen by quench is absolutely TWQ dependent, as is the activation energy. However, the evolution of Eac for P1 and P2 differs, which can be imputed to the different jumping walks required in each case. Furthermore, P1 is directly related to the L21 order and P2 is not. Of course, the effect of quenched excess vacancies on the activation energy cannot be underestimated: for higher TWQ, more vacancies are frozen, lowering, as a general rule, the energy barriers.
The effect of quenched vacancies becomes much more evident when examining the evolution of pre-exponential factors with TWQ. The equilibrium vacancy concentration at TWQ calculated from [28] is also shown in Figure 9b, allowing to observe a parallel evolution. Corroborating this parallelism, the plots of ln(ko) vs. 1/TWQ (Figure 10) yield activation energies of 0.8 eV (P1) and 1.0 eV (P2), very close to the formation energy of vacancies in Ni2MnGa given in [28].

4. Summary and Conclusions

The kinetics of the reordering processes in Ni2Mn1−xCuxGa alloys have been studied in detail. The quantification of the fundamental kinetic parameters has been carried out based on the DSC curves obtained during post-quench heating, at constant rates, of samples of Ni2Mn0.8Cu0.2Ga alloy. Isoconversional methods have been used to determine not only the activation energy, but also the pre-exponential factor and the reaction model that best fits the two post-quench reordering processes undergone by these alloys. The obtained results can be summarized as follows:
  • The activation energies associated with the two reordering processes are very close to each other (1.1−1.2 eV) and lower than those corresponding to Mn and Cu self-diffusion. The presence of a high concentration of non-equilibrium vacancies after quench, favouring the reordering processes, is likely lowering the activation energies.
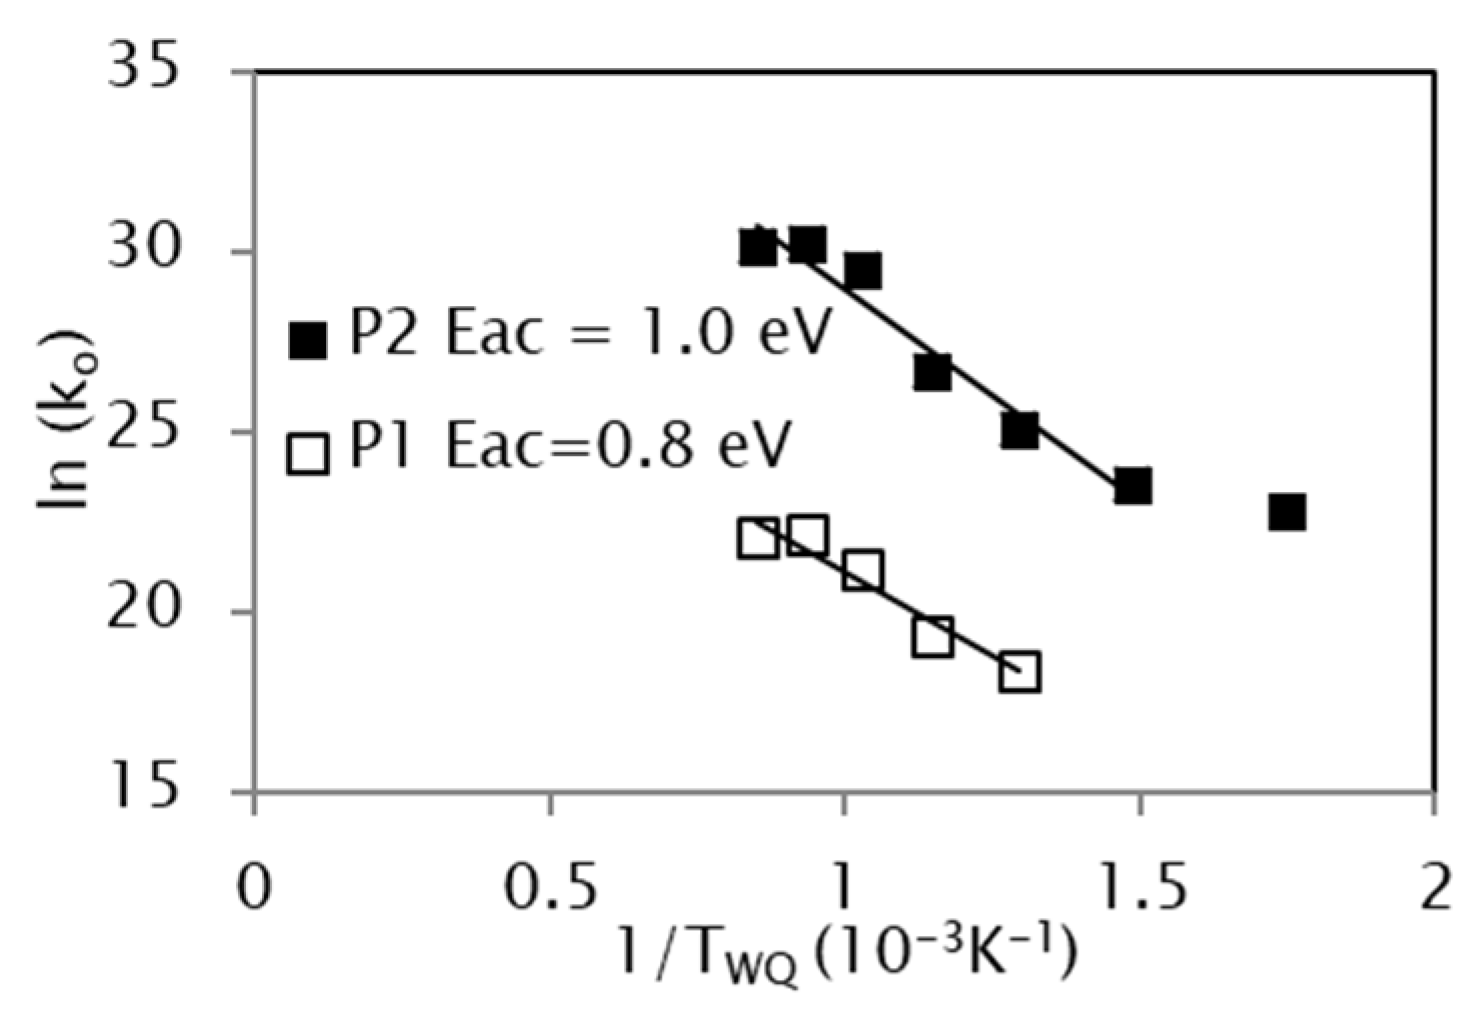
  • The pre-exponential factors obtained for the reordering phenomena are basically affected by the quenched excess vacancy concentrations. During post-quench heating, part of the retained excess vacancies is eliminated, which partly explains why the pre-exponential factor for the two processes are different. Therefore, the pre-exponential factors here obtained emphasize the role of the vacancies in the atomic diffusion related to ordering processes.
  • An effective exponent of n = 1 can be taken for the reaction model of both the analysed processes. Therefore, a first-order kinetic model is ruling these reactions. Such a model is consistent with the site-saturation nucleation and homogeneous diffusion-controlled advance of the processes.
  • The kinetic analysis extended to samples quenched from different temperatures TWQ shows a dependence of the activation energy on TWQ, attributable to the different degree of frozen atomic disorder when quenching from different temperatures. In turn, the evolution of pre-exponential factors runs parallel to the equilibrium vacancy concentration at TWQ, making evident the crucial role of vacancies in assisting the reordering processes.
In summary, the kinetic study shows that order improvement processes in quenched Ni2Mn1−xCuxGa alloys can be described by a first order reaction model with apparent activation energies around 1.1 eV. The pre-exponential factors, especially those obtained for samples quenched from different temperatures, highlight the crucial role of the vacancies retained by high temperature quenching on the atomic reordering underlying the observed processes.

Funding

This research was supported by Spanish Ministerio de Ciencia, Innovación y Universidades—Agencia Estatal de Investigación (MCIN/AEI/ 10.13039/501100011033/) and Fondo Europeo de Desarrollo Regional (“FEDER Una manera de hacer Europa”, EU), Project RTI 2018-094683-B-C51.

Data Availability Statement

The data presented in this study are available on request from the corresponding author.

Conflicts of Interest

The authors declare no conflict of interest.

References

  1. O’Handley, R.C.; Murray, S.J.; Marioni, M.; Nembach, H.; Allen, S.M. Phenomenology of giant magnetic-field-induced strain in ferromagnetic shape-memory materials (invited). J. Appl. Phys. 2000, 87, 4712–4717. [Google Scholar] [CrossRef]
  2. Ullakko, K.; Huang, J.K.; Kantner, C.; O’Handley, R.C.; Kokorin, V.V. Large magnetic-field-induced strains in Ni2MnGa single crystals. Appl. Phys. Lett. 1996, 69, 1966–1968. [Google Scholar] [CrossRef]
  3. Webster, P.J.; Ziebeck, K.R.A.; Town, S.L.; Peak, M.S. Magnetic order and phase transformation in Ni2MnGa. Philos. Mag. Part B 1984, 49, 295–310. [Google Scholar] [CrossRef]
  4. Planes, A.; Mañosa, L.; Acet, M. Magnetocaloric effect and its relation to shape-memory properties in ferromagnetic Heusler alloys. J. Phys. Condens. Matter 2009, 21, 233201. [Google Scholar] [CrossRef] [PubMed] [Green Version]
  5. Liu, Z.H.; Liu, H.; Zhang, X.X.; Xiao, J.Q.; Zhu, Z.Y.; Dai, X.F.; Liu, G.D.; Chen, J.L.; Wu, G.H. Large negative magnetoresistance in quaternary Heusler alloy Ni50Mn8Fe17Ga25 melt-spun ribbons. Appl. Phys. Lett. 2005, 86, 182507. [Google Scholar] [CrossRef] [Green Version]
  6. Segui, C.; Cesari, E. Composition and atomic order effects on the structural and magnetic transformations in ferromagnetic Ni–Co–Mn–Ga shape memory alloys. J. Appl. Phys. 2012, 111, 043914. [Google Scholar] [CrossRef]
  7. Seguí, C. Effects of the interplay between atomic and magnetic order on the properties of metamagnetic Ni-Co-Mn-Ga shape memory alloys. J. Appl. Phys. 2014, 115, 113903. [Google Scholar] [CrossRef]
  8. Kataoka, M.; Endo, K.; Kudo, N.; Kanomata, T.; Nishihara, H.; Shishido, T.; Umetsu, R.Y.; Nagasako, M.; Kainuma, R. Martensitic transition, ferromagnetic transition, and their interplay in the shape memory alloys Ni2Mn1−xCuxGa. Phys. Rev. B 2010, 82, 214423. [Google Scholar] [CrossRef]
  9. Kanomata, T.; Endo, K.; Kudo, N.; Umetsu, R.Y.; Nishihara, H.; Kataoka, M.; Nagasako, M.; Kainuma, R.; Ziebeck, K.R. Magnetic Moment of Cu-Modified Ni2MnGa Magnetic Shape Memory Alloys. Metals 2013, 3, 114–122. [Google Scholar] [CrossRef] [Green Version]
  10. Seguí, C.; Torrens-Serra, J.; Cesari, E.; Lázpita, P. Optimizing the Caloric Properties of Cu-Doped Ni–Mn–Ga Alloys. Materials 2020, 13, 419. [Google Scholar] [CrossRef] [Green Version]
  11. Kanomata, T.; Nozawa, T.; Kikuchi, D.; Nishihara, H.; Koyama, K.; Watanabe, K. Magnetic properties of ferromagnetic shape memory alloys Ni2−xCuxMnGa. Int. J. Appl. Electromagn. Mech. 2005, 21, 151–157. [Google Scholar] [CrossRef]
  12. Overholser, R.; Wuttig, M.; Neumann, D. Chemical ordering in Ni-Mn-Ga Heusler alloys. Scr. Mater. 1999, 40, 1095–1102. [Google Scholar] [CrossRef]
  13. Khovailo, V.V.; Takagi, T.; Vasilev, A.N.; Miki, H.; Matsumoto, M.; Kainuma, R. On Order–Disorder (L21→B2′) Phase Transition in Ni2+xMn1−xGa Heusler Alloys. Phys. Status Solidi 2001, 183, R1–R3. [Google Scholar] [CrossRef]
  14. Sánchez-Alarcos, V.; Recarte, V.; Pérez-Landazábal, J.; Cuello, G. Correlation between atomic order and the characteristics of the structural and magnetic transformations in Ni–Mn–Ga shape memory alloys. Acta Mater. 2007, 55, 3883–3889. [Google Scholar] [CrossRef]
  15. Tsuchiya, K.; Ohtoyo, D.; Umemoto, M.H.; Ohtsuka, H. Effect of Isothermal Aging on Martensitic Transformations in Ni-Mn-Ga Alloy. Trans. Mater. Res. Soc. Jpn. 2000, 25, 521–524. [Google Scholar]
  16. Kreissl, M.; Neumann, K.-U.; Stephens, T.; Ziebeck, K.R.A. The influence of atomic order on the magnetic and structural properties of the ferromagnetic shape memory compound Ni2MnGa. J. Phys. Condens. Matter 2003, 15, 3831–3839. [Google Scholar] [CrossRef]
  17. Goryczka, T.; Gigla, M.; Morawiec, H. Effect of quenching on martensitic transformation course in non-stoichiometric NiMnGa alloy. Int. J. Appl. Electromagn. Mech. 2006, 23, 81–88. [Google Scholar] [CrossRef]
  18. Richard, M.L.; Feuchtwanger, J.; Allen, S.M.; O’Handley, R.C.; Lázpita, P.; Barandiaran, J.M.; Gutierrez, J.; Ouladdiaf, B.; Mondelli, C.; Lograsso, T.; et al. Chemical order in off-stoichiometric Ni–Mn–Ga ferromagnetic shape-memory alloys studied with neutron diffraction. Philos. Mag. 2007, 87, 3437–3447. [Google Scholar] [CrossRef]
  19. Sánchez-Alarcos, V.; Pérez-Landazábal, J.; Gómez-Polo, C.; Recarte, V. Influence of the atomic order on the magnetic characteristics of a Ni–Mn–Ga ferromagnetic shape memory alloy. J. Magn. Magn. Mater. 2008, 320, e160–e163. [Google Scholar] [CrossRef]
  20. Sánchez-Alarcos, V.; Recarte, V.; Pérez-Landazábal, J.; Gómez-Polo, C.; Rodríguez-Velamazán, J. Role of magnetism on the martensitic transformation in Ni–Mn-based magnetic shape memory alloys. Acta Mater. 2012, 60, 459–468. [Google Scholar] [CrossRef]
  21. Recarte, V.; Pérez-Landazábal, J.; Sánchez-Alarcos, V.; Rodríguez-Velamazán, J. Dependence of the martensitic transformation and magnetic transition on the atomic order in Ni–Mn–In metamagnetic shape memory alloys. Acta Mater. 2012, 60, 1937–1945. [Google Scholar] [CrossRef]
  22. Seguí, C.; Cesari, E. Ordering mechanism and kinetics in Ni2Mn1−Cu Ga ferromagnetic shape memory alloys. J. Alloys Compd. 2021, 887, 161302. [Google Scholar] [CrossRef]
  23. Soto-Parra, D.; Moya, X.; Mañosa, L.; Planes, A.; Flores-Zúñiga, H.; Alvarado-Hernández, F.; Ochoa-Gamboa, R.; Matutes-Aquino, J.; Ríos-Jara, D. Fe and Co selective substitution in Ni2MnGa: Effect of magnetism on relative phase stability. Philos. Mag. 2010, 90, 2771–2792. [Google Scholar] [CrossRef] [Green Version]
  24. Kopecký, V.; Rameš, M.; Veřtát, P.; Colman, R.; Heczko, O. Full Variation of Site Substitution in Ni-Mn-Ga by Ferromagnetic Transition Metals. Metals 2021, 11, 850. [Google Scholar] [CrossRef]
  25. Vyazovkin, S.; Burnham, A.K.; Criado, J.M.; Pérez-Maqueda, L.A.; Popescu, C.; Sbirrazzuoli, N. ICTAC Kinetics Committee recommendations for performing kinetic computations on thermal analysis data. Thermochim. Acta 2011, 520, 1–19. [Google Scholar] [CrossRef]
  26. Khawam, A.; Flanagan, D.R. Solid-State Kinetic Models: Basics and Mathematical Fundamentals. J. Phys. Chem. B 2006, 110, 17315–17328. [Google Scholar] [CrossRef]
  27. Donoso, E.; Diaz, G.; Varschavsky, A. Thermal behavior of short-range-order in quenched Cu-12 at% Mn assessed by DSC. J. Therm. Anal. 2005, 81, 425–433. [Google Scholar] [CrossRef]
  28. Merida, D.; García, J.; Sánchez-Alarcos, V.; Pérez-Landazábal, J.; Recarte, V.; Plazaola, F. Characterisation and modelling of vacancy dynamics in Ni–Mn–Ga ferromagnetic shape memory alloys. J. Alloys Compd. 2015, 639, 180–186. [Google Scholar] [CrossRef]
  29. Erdélyi, G.; Mehrer, H.; Imre, A.; Lograsso, T.; Schlagel, D. Self-diffusion in Ni2MnGa. Intermetallics 2007, 15, 1078–1083. [Google Scholar] [CrossRef]
  30. López-Ferreño, I.; Breczewski, T.; López, G.; Nó, M.; Juan, J.S. Stress-assisted atomic diffusion in metastable austenite D03 phase of Cu-Al-Be shape memory alloys. Scr. Mater. 2016, 124, 155–159. [Google Scholar] [CrossRef] [Green Version]
  31. Sánchez-Alarcos, V.; Pérez-Landazábal, J.; Recarte, V.; A Rodriguez-Velamazán, J.; Chernenko, V. Effect of atomic order on the martensitic and magnetic transformations in Ni–Mn–Ga ferromagnetic shape memory alloys. J. Phys. Condens. Matter 2010, 22, 166001. [Google Scholar] [CrossRef] [PubMed]
  32. Askill, J. Tracer Diffusion Data for Metals, Alloys and Simple Oxides; Springer: Boston, MA, USA, 1970. [Google Scholar] [CrossRef]
  33. Abrahams, K.; Zomorodpoosh, S.; Khorasgani, A.R.; Roslyakova, I.; Steinbach, I.; Kundin, J. Automated assessment of a kinetic database for fcc Co–Cr–Fe–Mn–Ni high entropy alloys. Model. Simul. Mater. Sci. Eng. 2021, 29, 055007. [Google Scholar] [CrossRef]
  34. Murch, G.E. Diffusion Kinetics in Solids, in Phase Transformations in Materials; Kostorz, G., Ed.; Wiley-VCH: Weinheim, Germany, 2001. [Google Scholar]
  35. Liu, J.; Riddiford, L.; Floristean, C.; Goncalves-Neto, F.; Rezaeeyazdi, M.; Lewis, L.; Barmak, K. Kinetics of order-disorder transformation of L12 FeNi3 in the Fe-Ni system. J. Alloys Compd. 2016, 689, 593–598. [Google Scholar] [CrossRef]
Figure 1. DSC curve obtained on cooling and subsequent heating, at temperature rate of 5 K/min, for a Cu5 sample as-quenched from 1020 K. The temperatures taken as characteristic for the structural (MP and AP) and magnetic transitions ( T C A ) are labelled. Adapted from [22].
Metals 12 00738 g001
Figure 2. DSC curves obtained on cooling and subsequent heating at 5 K/min, for a Cu5 sample just after quench from 1020 K (blue curve), after overcoming P2 (red curve), and after passing P1 (full and dotted black curve). The inset shows an enlargement of the curves around the Curie temperature. Adapted from [22].
Metals 12 00738 g002
Figure 3. DSC curves obtained during heating up to 670 K of Cu5 and ternary Cu0 samples previously quenched from 1020 K. Adapted from [22].
Metals 12 00738 g003
Figure 4. DSC curves obtained during heating up to 670 K Cu5 samples previously quenched from the indicated TWQ temperatures.
Metals 12 00738 g004
Figure 5. (a) ( d x / d t ) curves, corresponding to DSC curves of P2 after baseline correction, recorded during heating Cu5 samples quenched from 970 K, at different rates βi = 1–20 K/min; (b) normalized integrals giving the x(T) curves for the different βi; application of the Kissinger−Akihara−Sunose method (c), and Friedman’s method (d); (e) apparent activation energies as a function of x obtained after those methods; (f) plots of [ l n ( d x / d t ) + ( E a c / R T ) ]   vs .   l n ( 1 x ) for each βi using Eac = 1.2 eV, yielding the values of n and ln(ko) given in the inset.
Metals 12 00738 g005
Figure 6. (a) ( d x / d t ) curves, corresponding to DSC curves of P1 after baseline correction, recorded during heating Cu5 samples quenched from 970 K, at different rates βi = 1–20 K/min; (b) normalized integrals giving the x(T) curves for the different βi; application of the Kissinger−Akihara−Sunose method (c), and Friedman’s method (d); (e) apparent activation energies as a function of x obtained after those methods; (f) plots of [ l n ( d x / d t ) + ( E a c / R T ) ]   vs .   l n ( 1 x ) for each βi using Eac = 1.1 eV, yielding the values of n and ln(ko) given in the inset.
Metals 12 00738 g006
Figure 7. (a) ( d x / d t ) curves, corresponding to DSC curves of P1 after baseline correction, recorded during heating Cu0 samples quenched from 970 K, at different rates βi = 2–20 K/min; (b) normalized integrals giving the x(T) curves for the different βi; application of the Kissinger−Akihara−Sunose method (c), and Friedman’s method (d); (e) apparent activation energies as a function of x obtained after those methods; (f) plots of [ l n ( d x / d t ) + ( E a c / R T ) ]   vs .   l n ( 1 x ) for each βi using Eac = 1.2 eV, yielding the values of n and ln(ko) given in the inset.
Metals 12 00738 g007
Figure 8. [ l n ( d x / d t ) l n ( 1 x ) ]   vs .   ( 1 / T ) lines corresponding to P2 (full lines) and P1 (dotted lines), for Cu5 samples quenched from different TWQ temperatures.
Metals 12 00738 g008
Figure 9. Activation energies (a) and pre-exponential factors (b) as a function of TWQ obtained after Equation (10) using n = 1 from the lines in Figure 8.
Metals 12 00738 g009
Figure 10. ln(ko) vs. 1/TWQ plots for P1 and P2, and activation energies calculated from the slopes.
Metals 12 00738 g010
Table 1. Average values of the kinetic parameters obtained for the thermally activated processes underlying P1 (for Cu5 and Cu0 samples) and P2.
KASFriedman
Eac (eV)Eac (kJ/mol)Eac (eV)Eac (kJ/mol)nko (s−1)
Cu5 P21.31301.21181.11.1 × 1011
Cu5 P11.11071.11070.91.4 × 108
Cu0 P11.31261.21171.21.5 × 108
Table 2. Activation energy and pre-exponential factors collected from the literature for the diffusion of Cu and Mn in different cases.
DiffusionEac (eV)ko (s−1)Ref.
Vacancy migration in Ni−Mn−Ga1.31.1[28]
Vacancy formation in Ni−Mn−Ga1.10.9[28]
Cu−FCC self-diffusion1.31.2[29]
Mn−BCC self-diffusion2.231.3 × 1013[30]
Mn (tracer) diffusion in L21 Ni2MnGa1.465.3 × 1010[31]
Improvement of L21 ordering in Ni−Mn−Ga1.18 (TWQ = 1173 K)
1.46 (TWQ = 873K)
[32]
Cu in DO3 Cu−Al−Be1.38 [33]
SRO in Cu3Mn0.9 (TWQ = 1073K)6.5 × 10⁹[27]
Publisher’s Note: MDPI stays neutral with regard to jurisdictional claims in published maps and institutional affiliations.

