1. Introduction
The die-cast Mg-Al-Ba-Ca alloy, called DieMag633, was developed as a creep resistant alloy based on Mg-Al. Rare earths elements (REE) are often chosen as alloying elements when a good creep resistance is desired in Mg-Al alloys. This is based on the formation of precipitates like Al
11RE
3, Al
4RE and Al
2RE [
1,
2]. Alloying with Ba and Ca replaces the expensive and limited REE, strengthening precipitates where expected. Based on AXJ520 [
3] and AX52/AX53 [
4], where (Mg,Al)
2Ca precipitates strengthen the alloys, and based on Mg-Zn alloys, where alloying with Ba promotes both the formation of strengthening precipitates by stimulating the precipitate nucleation and the acceleration of the kinetics of precipitation during artificial and natural ageing [
5], a Mg-Al-Ba-Ca alloy was developed as a creep resistant alloy [
6,
7].
In this study the DieMag633 alloy, according to their alloying elements also known as ABaX633, consists mainly of primary dendrites of α-Mg and two interdendritic phases of different morphology. Increasing the amount of Al, Ca and Ba in the DieMag-series (DieMag211, DieMag422 and DieMag633—numbers stand for amount of Al, Ca and Ba in wt.%) increases strength and creep resistance based on the increasing amount of Al
2Ca and Mg
21Al
3Ba
2 [
7]. In the study by Dieringa et al. [
6] it can be seen that the DieMag422 shows higher threshold stresses than AE42 and MRI230D, which results in an excellent creep resistance. EDXS point measurements in [
8] show little to no Ba-content in the lamellar Al
2Ca phase and a significant concentration of Ba in the Mg
21Al
3Ba
2 phase. The as-cast DieMag633 in study [
8] had a porosity of 1.48%, a tensile yield strength (TYS) of 202.6 ± 0.7 MPa, an ultimate tensile strength (UTS) of 229.6 ± 5.8 MPa, an elongation at fracture (El.) of 1.6 ± 0.5%, and a compression yield strength (CYS) of 117.6 ± 15.1 MPa. The DieMag633 in study [
8] showed the best creep resistance at higher stresses of 90 and 100 MPa among the alloys investigated: AE42, AE44, MRI230D, DieMag211, DieMag422 and DieMag633.
DieMag422 was investigated with the mechanical properties of TYS, here 0.01, at 15 MPa, UTS at 122 MPa and El at 1.72% [
9,
10,
11]. Scanning electron microscope (SEM) images and EDX studies showed that the grain boundaries of the primary α-Mg phase separate the compact Ba-rich phase with an area fraction of approximately 5.0%, and the lamellar Ca-rich phase of an area fraction of approximately of 10.8%. Potentiodynamic polarization measurements studies showed a selective corrosive attack between the α-Mg phase and the lamellar Ca-rich phase. The estimated endurance limit was found to be 45 MPa at 10 Hz at a load ratio of R = −1 and a failure stress amplitude 72 MPa, respectively in [
9,
10], and to be 64 MPa for the estimated fatigue limit and 99 MPa for the failure stress amplitude in [
11]. The DieMag422 shows strong concentration-dependent corrosion resistance in chloride-containing electrolytes. The alloy exhibits a poor corrosion resistance but a homogeneous material corrosion and therefore, a linear relation between fatigue strength and corrosion rate [
12].
The cast DieMag442 in the study by Teschke et al. [
13], where the fatigue behavior was of interest in comparison to AE42, showed large irregularly distributed pores. Most of the pores had a diameter between 25 and 175 µm and a few pores were even larger than 290 µm. The following mechanical properties were presented in that study: TYS at 78.1 ± 0.6 MPa, UTS at 114.6 ± 3.5 MPa, CYS at 128.0 ± 4.9 MPa and ultimate compression strength (UCS) at 286.8 ± 2.9 MPa. These properties resulted in a tension–compression yield asymmetry of 0.61—opposite in character to many other studies [
14,
15,
16] and to the investigated AE42 in the study by Teschke et al. [
13] with a value of 1.51. In a study by Park et al. [
16] the yield-asymmetry below 1 in a cast AZ31 alloy was explained by the high value of the Schmid factors in the {1012} twin formation in the tensile direction. However, in study [
13] the compression–compression fatigue strength of DieMag422 at increased temperature was higher than that of AE42. The results of the quasi-static compression and compression–compression fatigue tests show a ~45° fracture with respect to the compression test axis, which respects the direction of maximum shear stress. The fracture was found to grow intercrystalline (intergranular/interdendritic) in the middle of the specimen, whereas in the edge areas, the crack grew transcrystalline (transgranular within the dendritic Mg-matrix). Parallel to the main crack, further small transcrystalline sub-cracks were observed at an angle of 45°. A correlation with the accumulation of pores of various sizes was expected. Fatigue cracks initiating from porosity were also seen in the study in [
17] on AZ91D-T6 alloy samples. A dependence of the crack propagation on the fracture mode was found in [
18]; here transdendritic cracking occurred under fatigue and interdendritic cracking in overload.
The influence of interdendritic precipitations on fracture behavior was studied in various alloys: in Al-Zn-Mg-Cu alloys, where the network structure of grain boundary precipitates S-(Al
2CuMg) and Al
7Cu
2Fe link together to create the crack propagation [
19]; in A356.2, where Si particles or β-Al
5FeSi platelets split due to their brittleness and guide the crack or the crack propagates through the well-modified Si eutectic regions [
20], which was also seen in [
21] for the low-pressure die cast A356 alloy.
In the study by Zyka et al. [
22] on mechanical properties and microstructure of large IN713LC nickel superalloy castings, several non-connected cracks were seen at interdendritic carbides as sub-cracks near the main fracture surface. The orientation of the interdendritic carbides influences the elongation at fracture: in specimens with low elongation, carbide platelets are oriented perpendicular to the tensile stress, thus promoting their longitudinal cracking and interconnecting of such cracks while in specimens with high tensile elongation, the angle between carbide platelets and tensile direction is smaller.
The cast 20Cr32Ni + Nb alloy investigated in [
23] consisted of brittle NbC carbide particles, which showed cracks at the macroscopic scale, well below the final failed interdendritic fracture surface. However, the fracture surface was also characterized by dimples at the microscale, so cracking via micro-void nucleation and coalescence, intermixed with cleavage in the carbide particles was concluded. Due to the austenitic matrix being tough enough to stop initial cracks generated in the carbide particles, this study showed, that NbC cracking cannot be the determinant factor for final sample fracture. However, the nucleated carbide microfracture still triggers ductile fracture along the austenite grain boundary, which leads to final fracture.
Obviously, the crack growth is guided by hard and brittle inderdendritic second phases, which fail much earlier than the softer matrix because of lack of deformation ability. In the DieMag-series, the second phases are also found to be harder than the dendritic Mg-matrix. In [
6] the DieMag422 had a Vickers hardness of 51 ± 2 HV10, where the individual phases showed HV0.005 of 166 ± 24 HV for Mg
21Al
3Ba
2, 95 ± 9 HV for Al
2Ca and 59 ± 11 HV for the α-Mg matrix. The total phase fraction from the Mg
21Al
3Ba
2 and Al
2Ca phases was ~9.5% and 6.6%, respectively. In [
9] the DieMag422 had a Vickers hardness of 53 ± 2.0 HV10, where the individual phases showed HV0.005 of 222 HV for Mg
21Al
3Ba
2, 116 HV for Al
2Ca and 67 HV for the α-Mg matrix at the edge of the sample, and in the sample middle: 353 HV for Mg
21Al
3Ba
2, 78 HV for Al
2Ca and 67 HV for the α-Mg matrix.
Based on previous studies, especially in [
13] and the literature review, to determine more detail of the microstructure-oriented crack growth was of interest. The role of the phases in deformation and crack propagation under different load conditions will help the understanding of fracture mechanics in Mg-Al-Ba-Ca alloys and will provide information about preferred load conditions or limited load conditions, and thus the selected application sites. It was also thought to be of interest of how pores and shrinkage cavities influence mechanical properties and fracture location.
3. Results
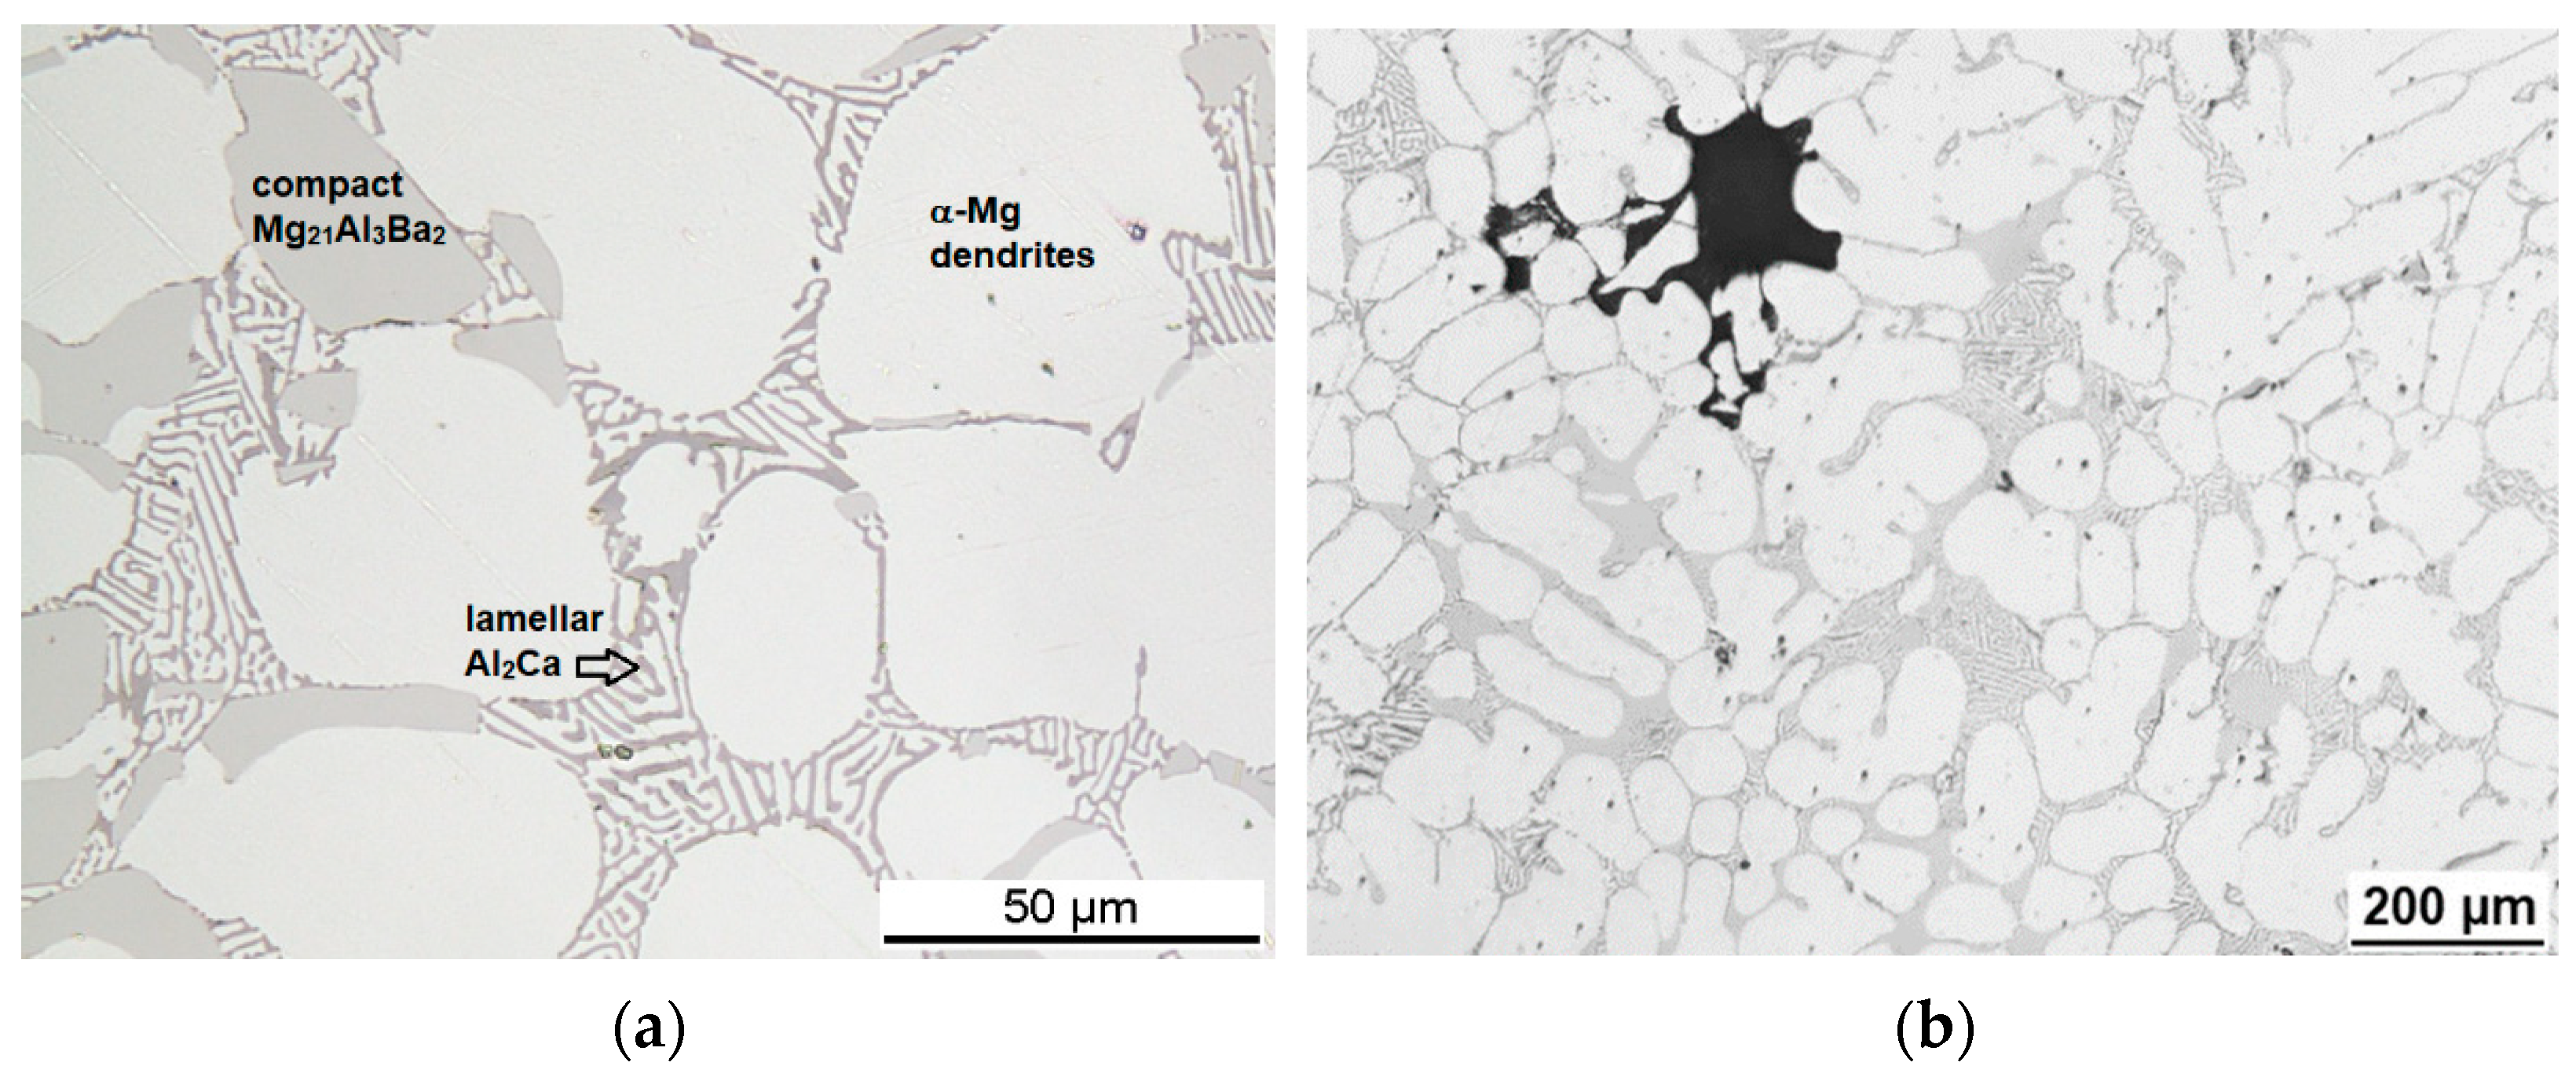
The DieMag633 alloy in this study consisted of 6.54 wt.% Al, 2.71 wt.% Ba and 2.76 wt.% Ca and showed a coarse dendritic microstructure. The micrograph in
Figure 1a shows the microstructure consisting of primary dendrites of α-Mg and the two interdendritic and intergranular phases Al
2Ca and Mg
21Al
3Ba
2. Al
2Ca is the lamellar Ca-rich phase (eutectic part of the microstructure), where lamellae have a thickness of 1–3 µm and Mg
21Al
3Ba
2 is the Ba-rich blocky compact phase, both forming an almost closed network along the dendritic arm spacings [
6]. The alloy in this study had inhomogeneously distributed shrinkage cavities of significant amount and sizes in the mm-range, see
Figure 1b.
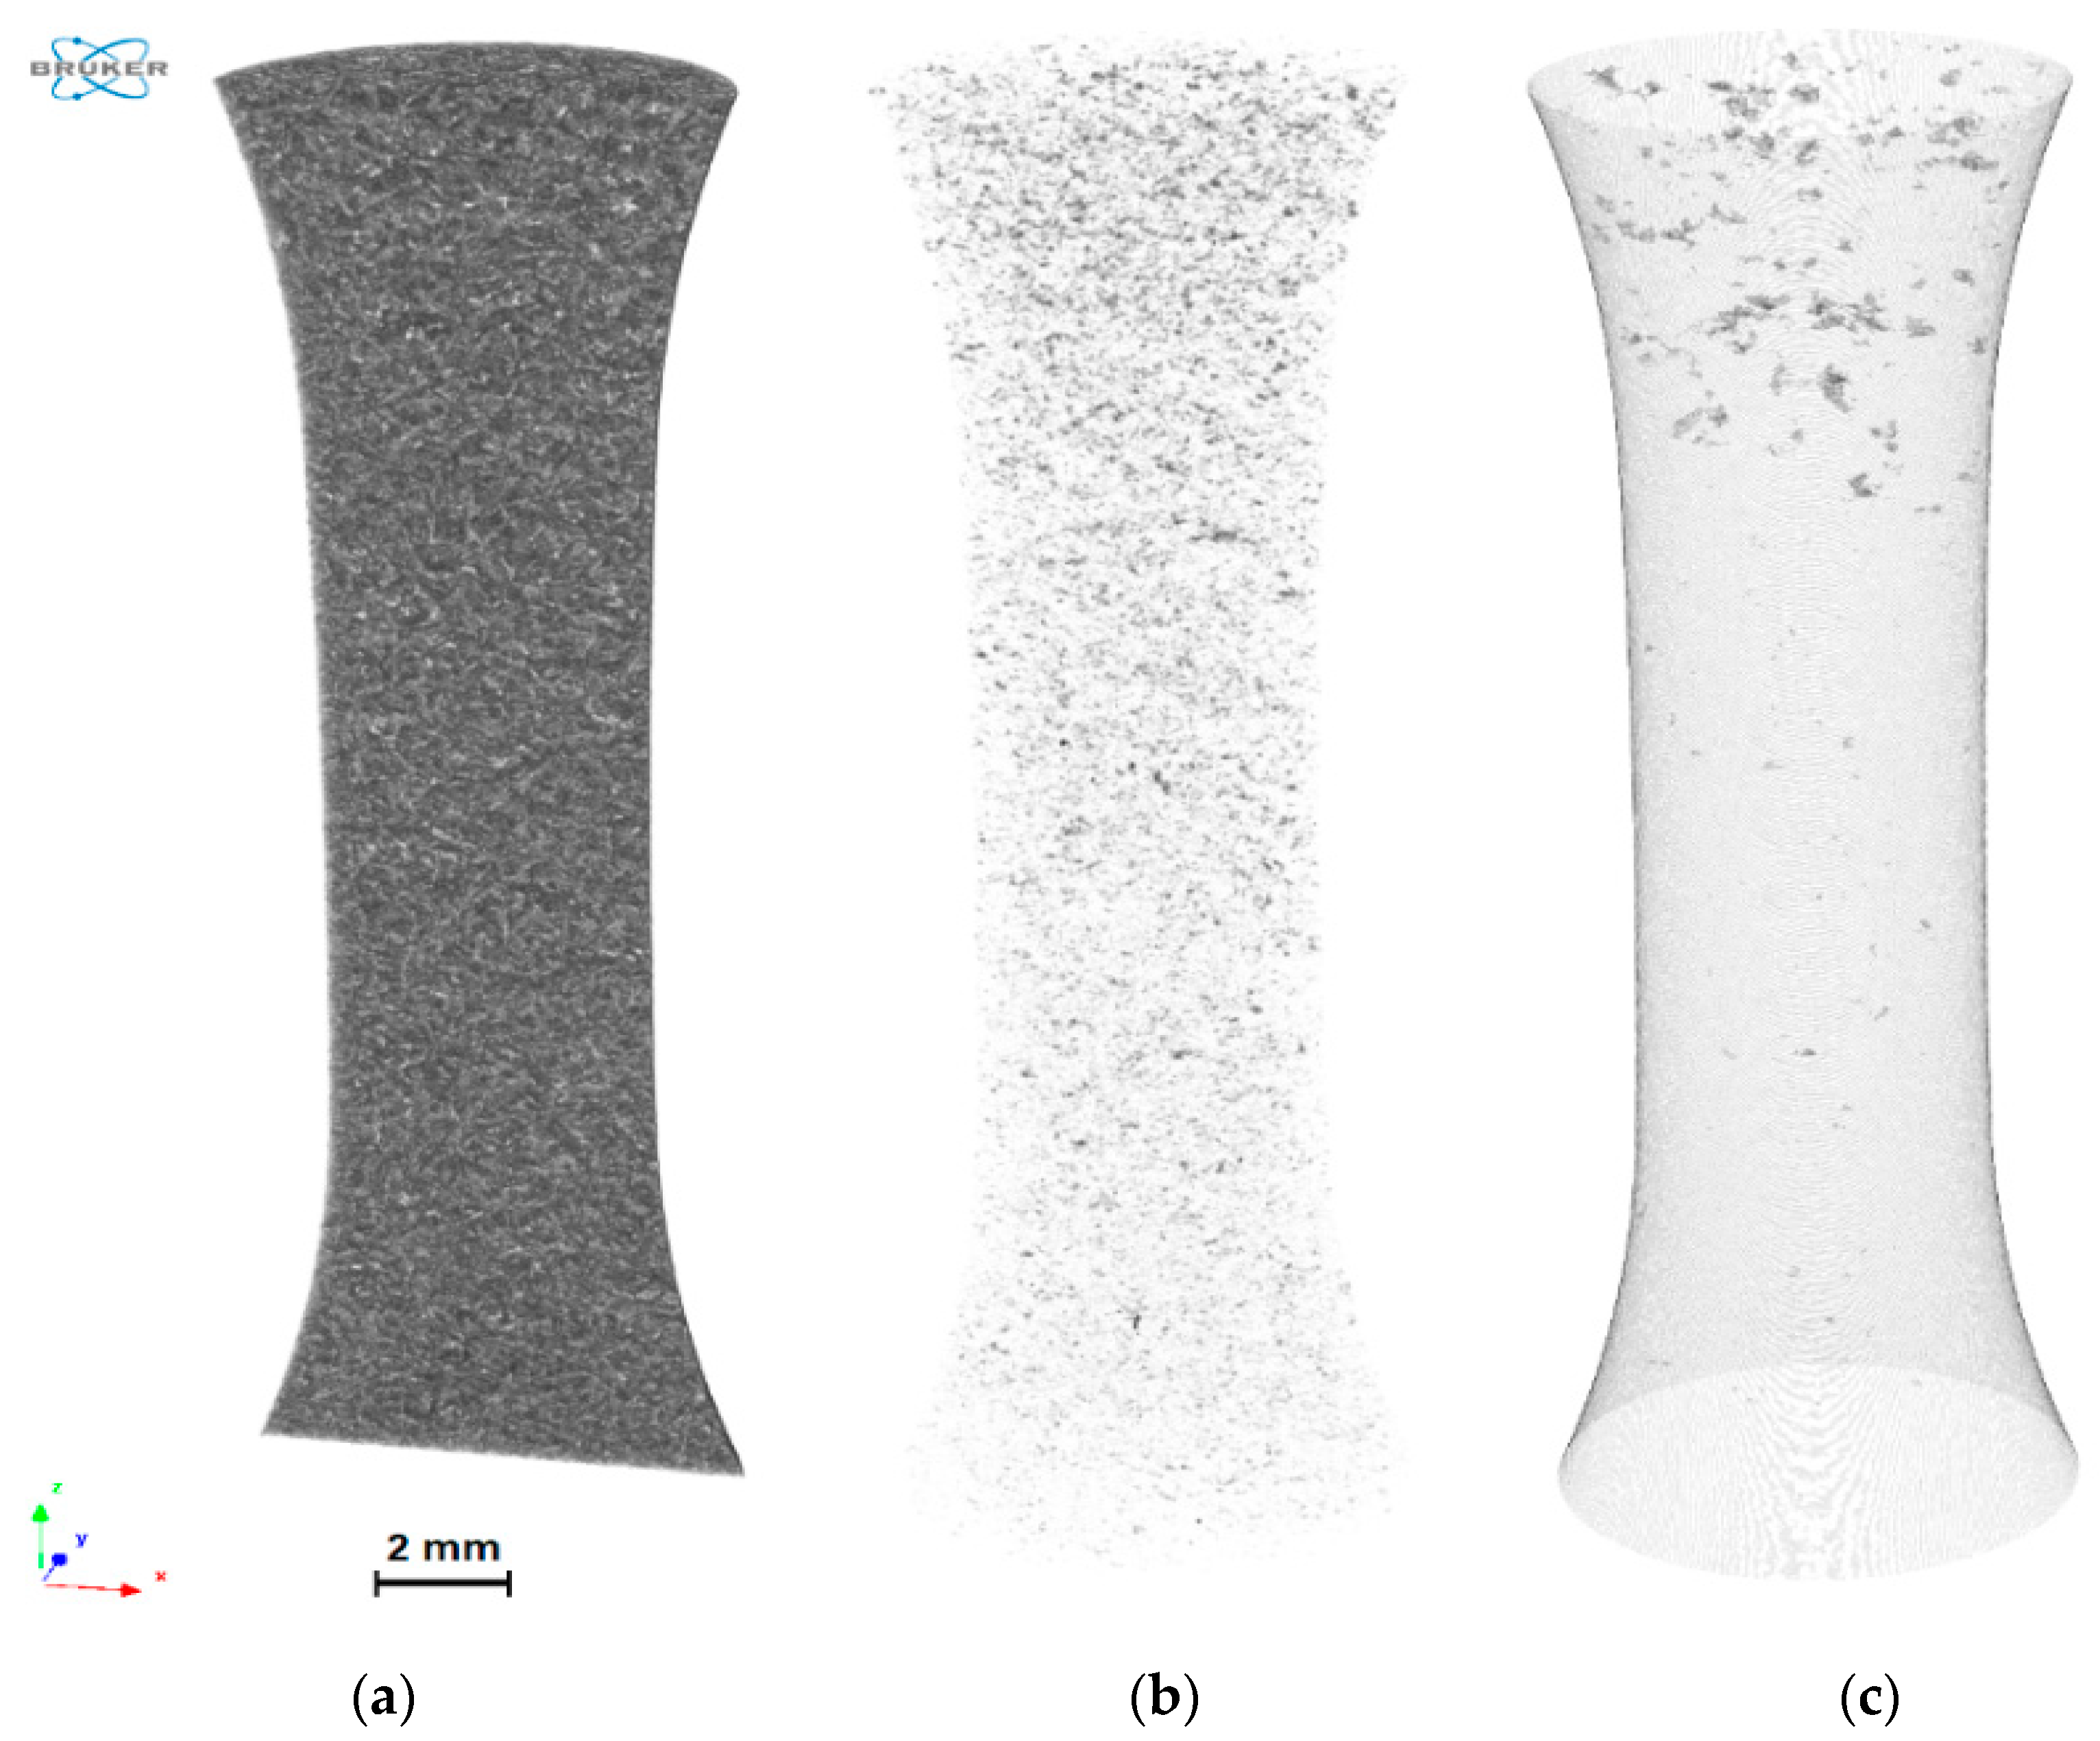
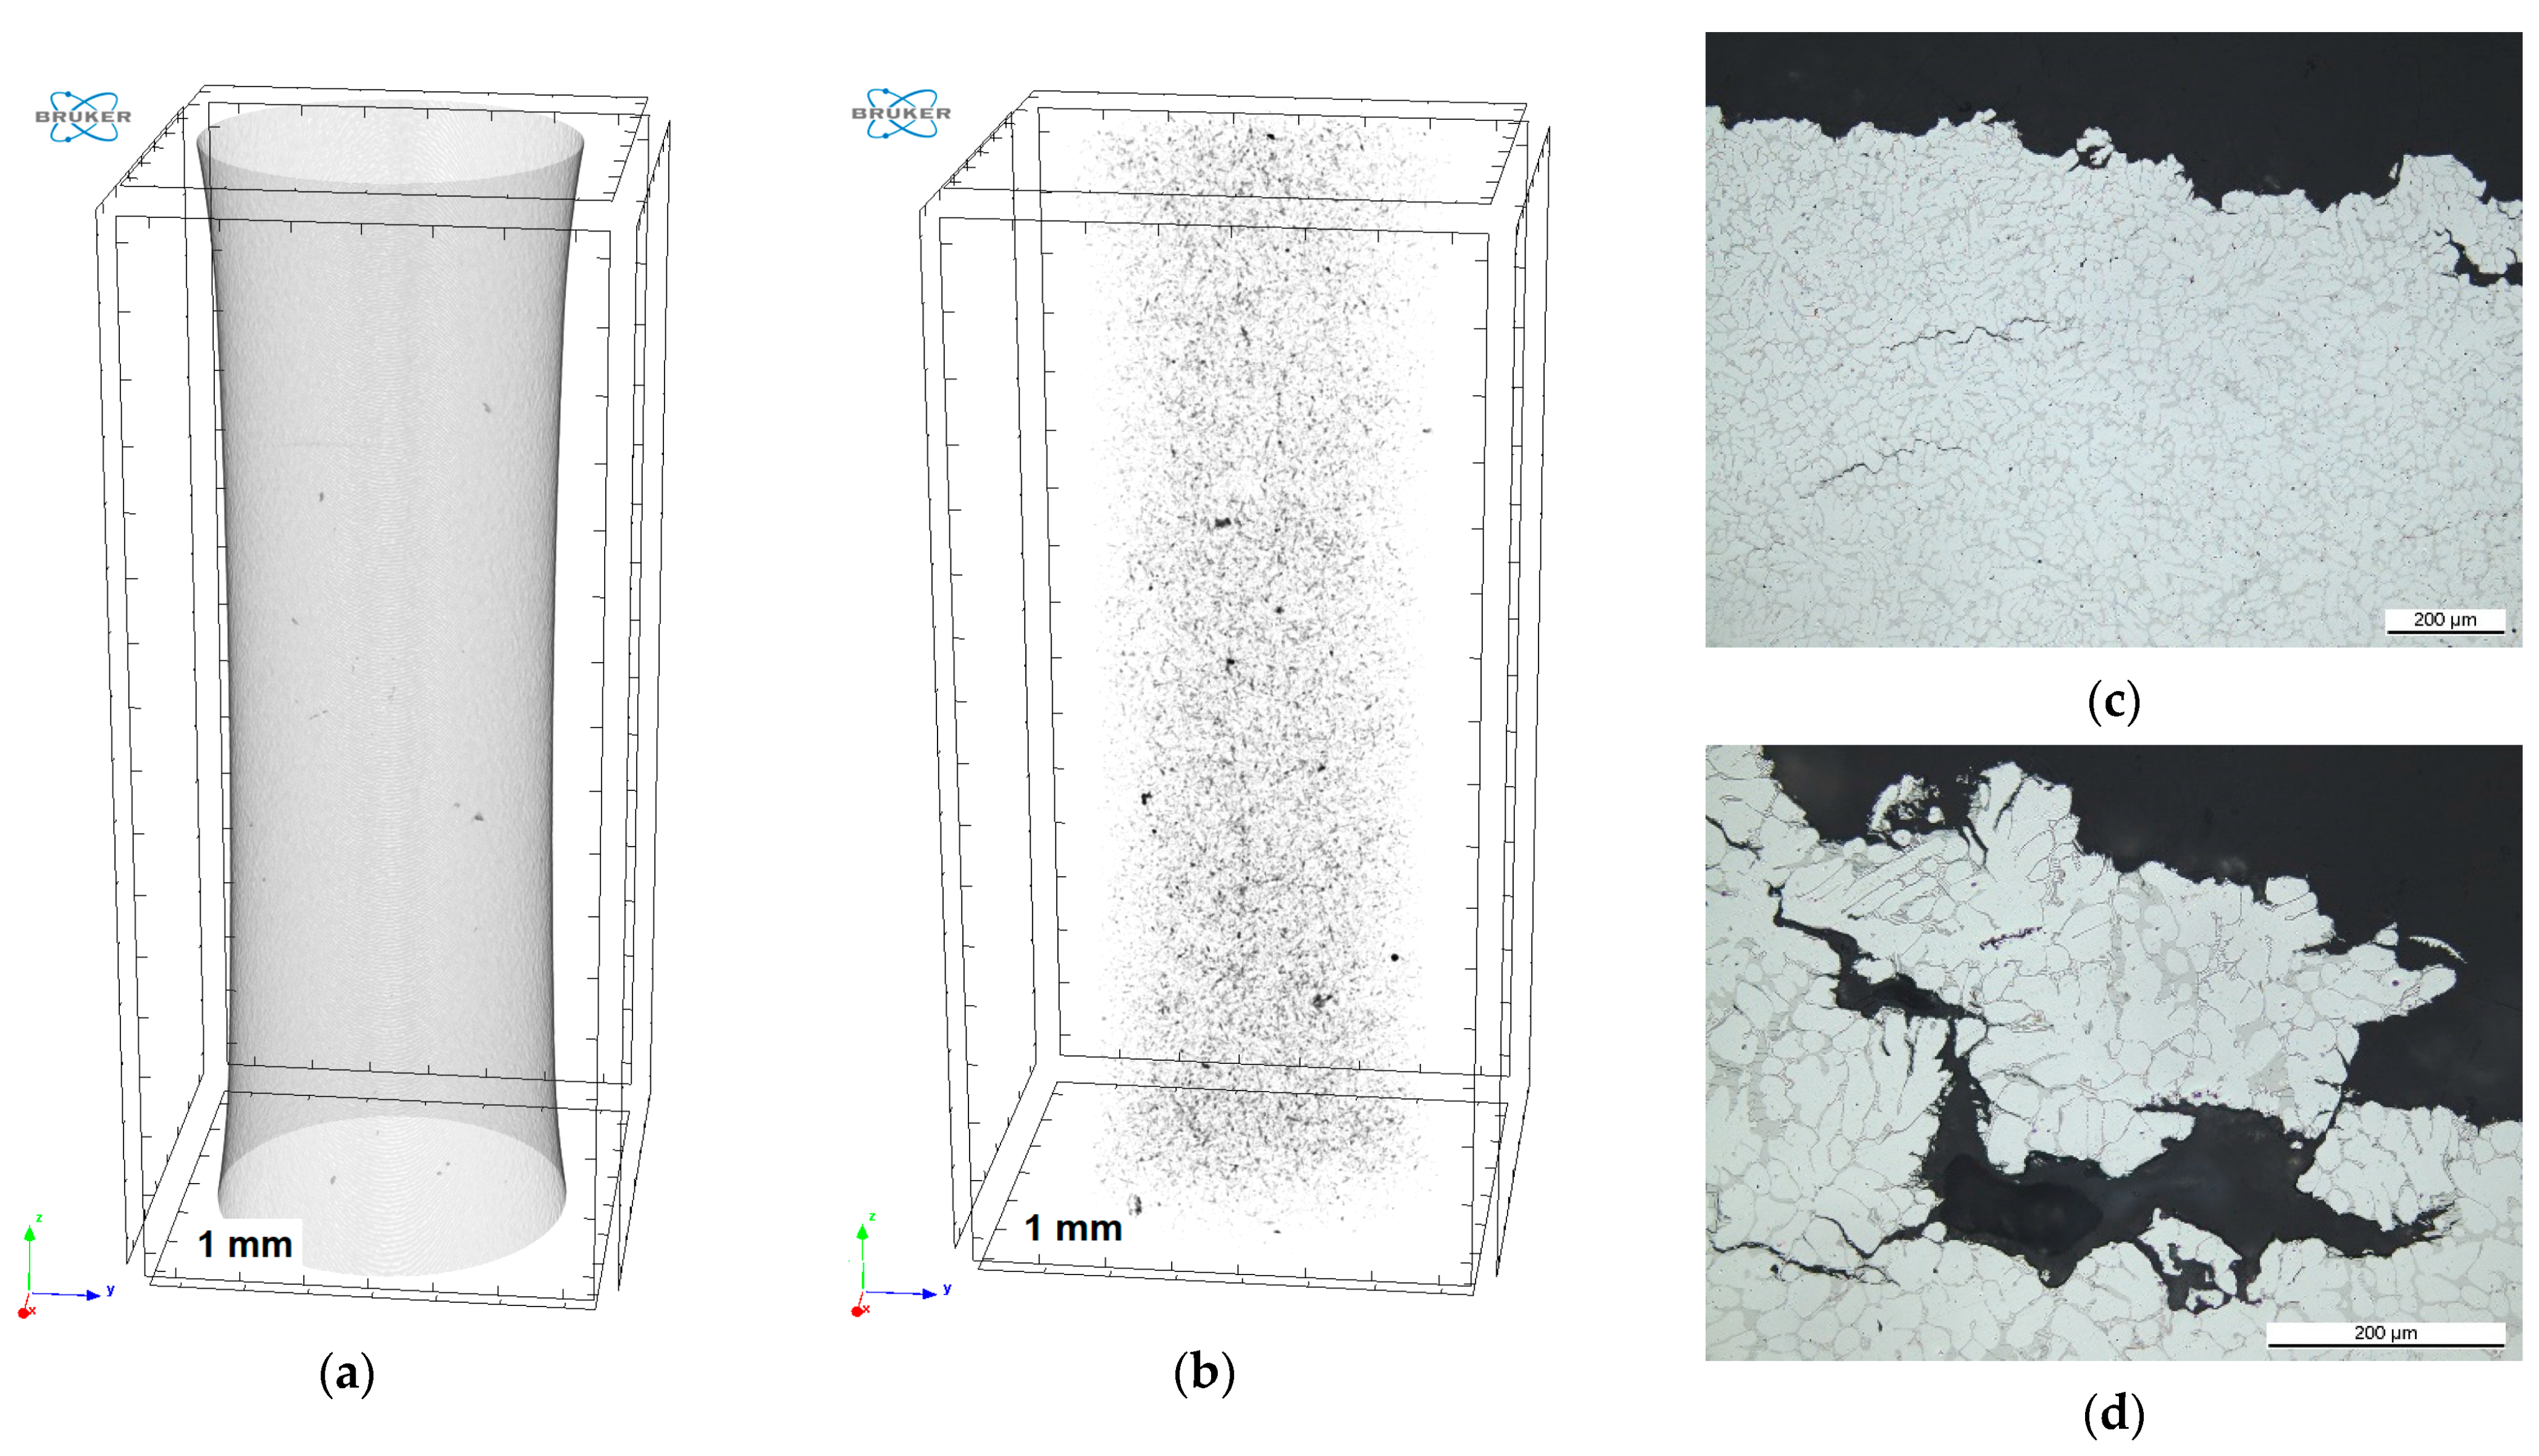
The representative µ-CT images in
Figure 2a–c show the gauge length of the sample before loading.
Figure 2a,b present the homogeneous distribution of the second phases, which are made visible by filtering in
Figure 2b. The pores and shrinkage cavities are highlighted in darker grey in
Figure 2c. There are shrinkage cavities, which reach the mm-range—in the case of the gauge length in
Figure 2c, in the upper part near the transition to the larger diameter. Due to the significant amount and size of the large shrinkage cavities, low mechanical properties under tensile load are found as well as a high scattering under fatigue load. Other than that seen in [
8], but in more agreement with [
9,
10,
11,
12,
13], the TYS was 51.57 ± 2.36 MPa, the UTS 102.11 ± 3.48 MP and the El. only 0.58 ± 0.05%. The fracture surface was not always located at the region of the lowest diameter in the gauge length—most likely influenced by larger shrinkage cavities which could sometimes be seen on the surface of the gauge length. Under compression, the CYS was 135.00 ± 9.17 MPa, the UCS 282.55 ± 4.42 MPa and the deformation at fracture 11.18 ± 0.60%. The following samples according to their cycles at fracture were used for characterization in this study: fully reversed testing at 50 MPa (R = −1) with 12,000 cycles at fracture; fully reversed testing at 50 MPa (R = −1) with 2 × 10
6 cycles run out followed by a tensile test; unidirectional testing at 50 MPa (R = 0) with 43,300 cycles at fracture; unidirectional testing at −50 MPa (R = −∞) with 2 × 10
6 cycles run out followed by a tensile test.
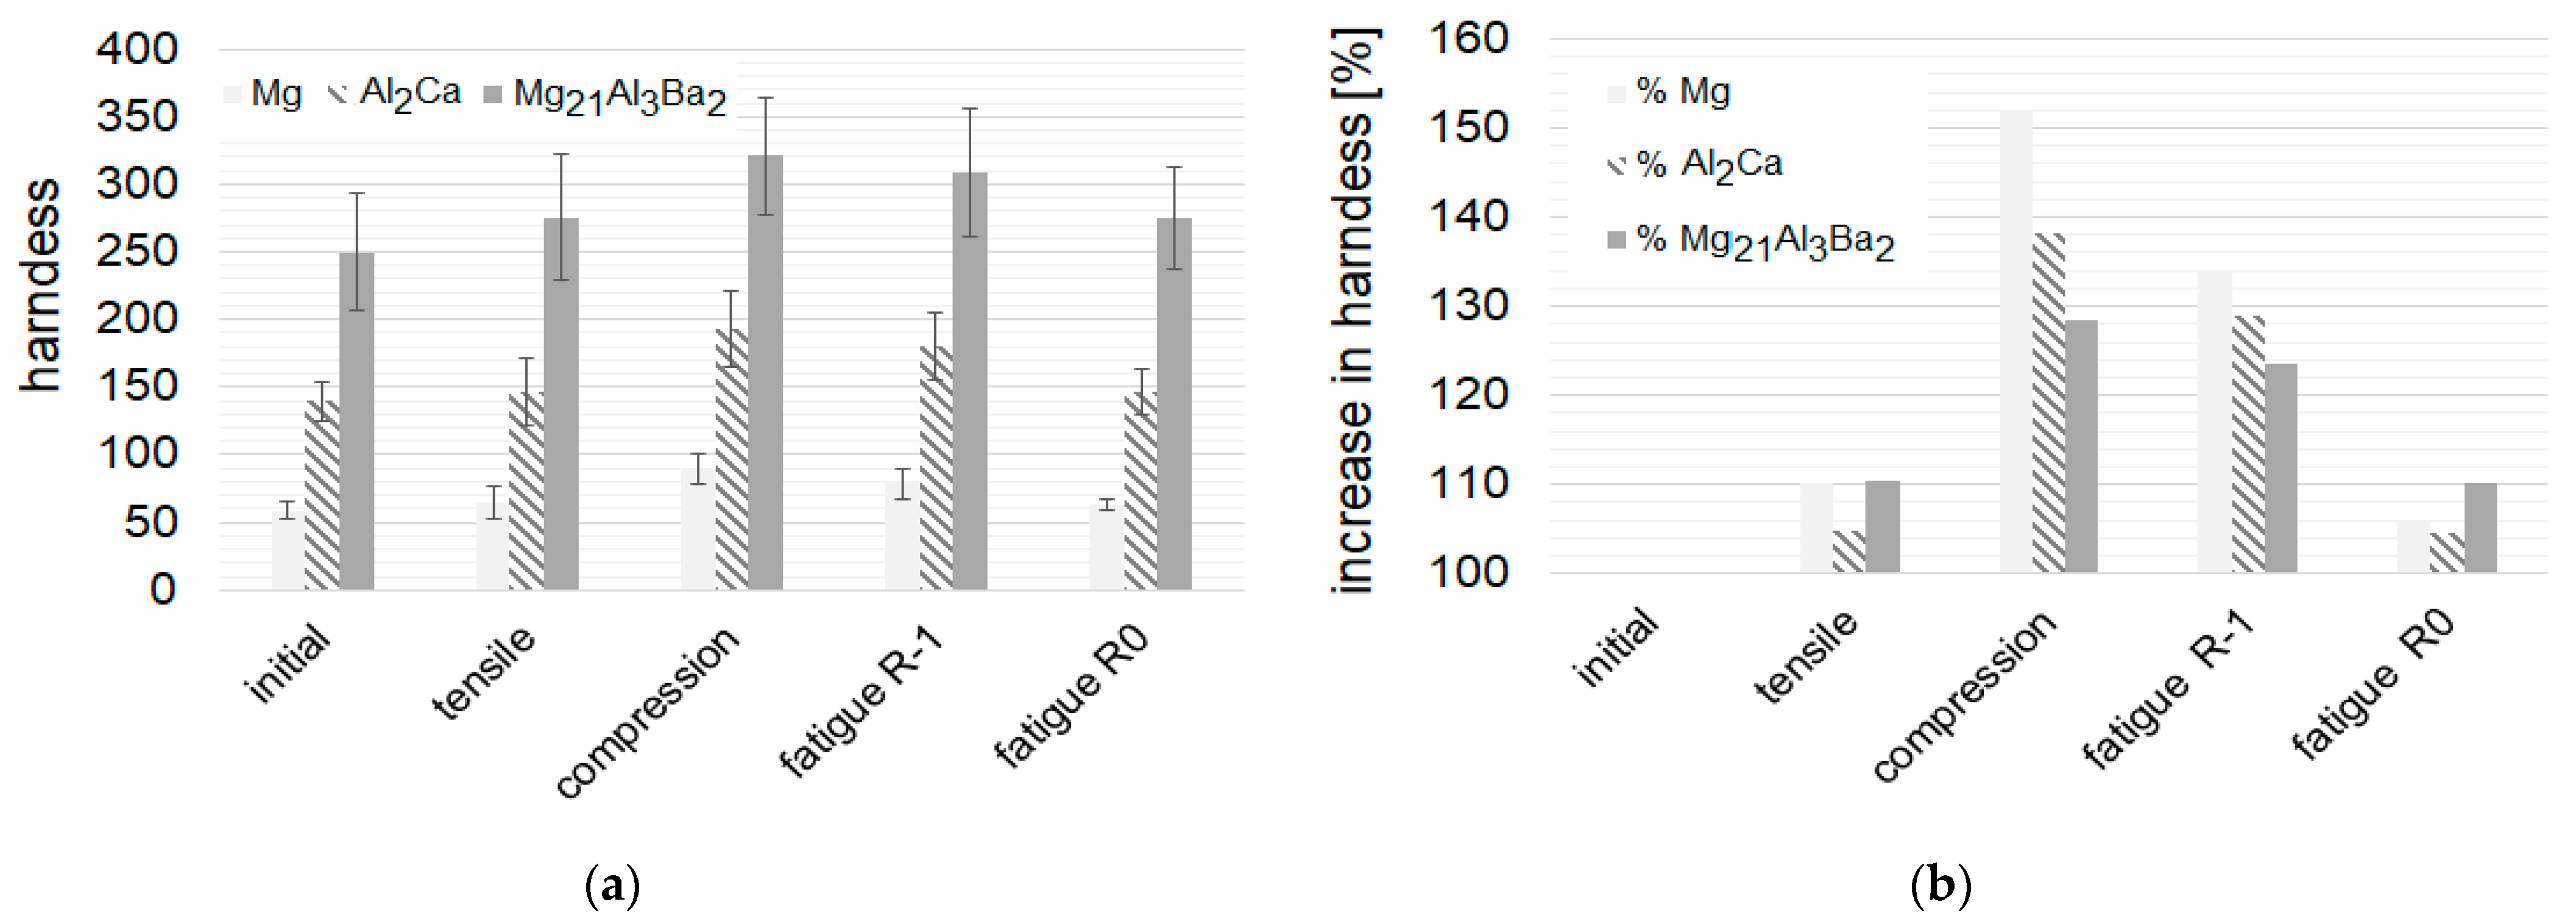
Table 1 shows that the compact Ba-rich phase Mg
21Al
3Ba
2 shows the highest initial hardness and the dendritic Mg-matrix the lowest value. The hardness of the lamellar Al
2Ca is obviously influenced by the Mg-matrix in between the thin Al
2Ca lamellae (eutectic part of the microstructure). It can be seen that the phases do not change significantly in hardness under tensile and fatigue loading (R = 0), but rather under compression and fatigue (R = −1). The Mg-matrix strain-hardens the most under compression, followed by fatigue (R = −1). The hardness increase of the Ba-rich phase Mg
21Al
3Ba
2 Mg-matrix is less pronounced than that of the lamellar Ca-rich phase Al
2Ca.
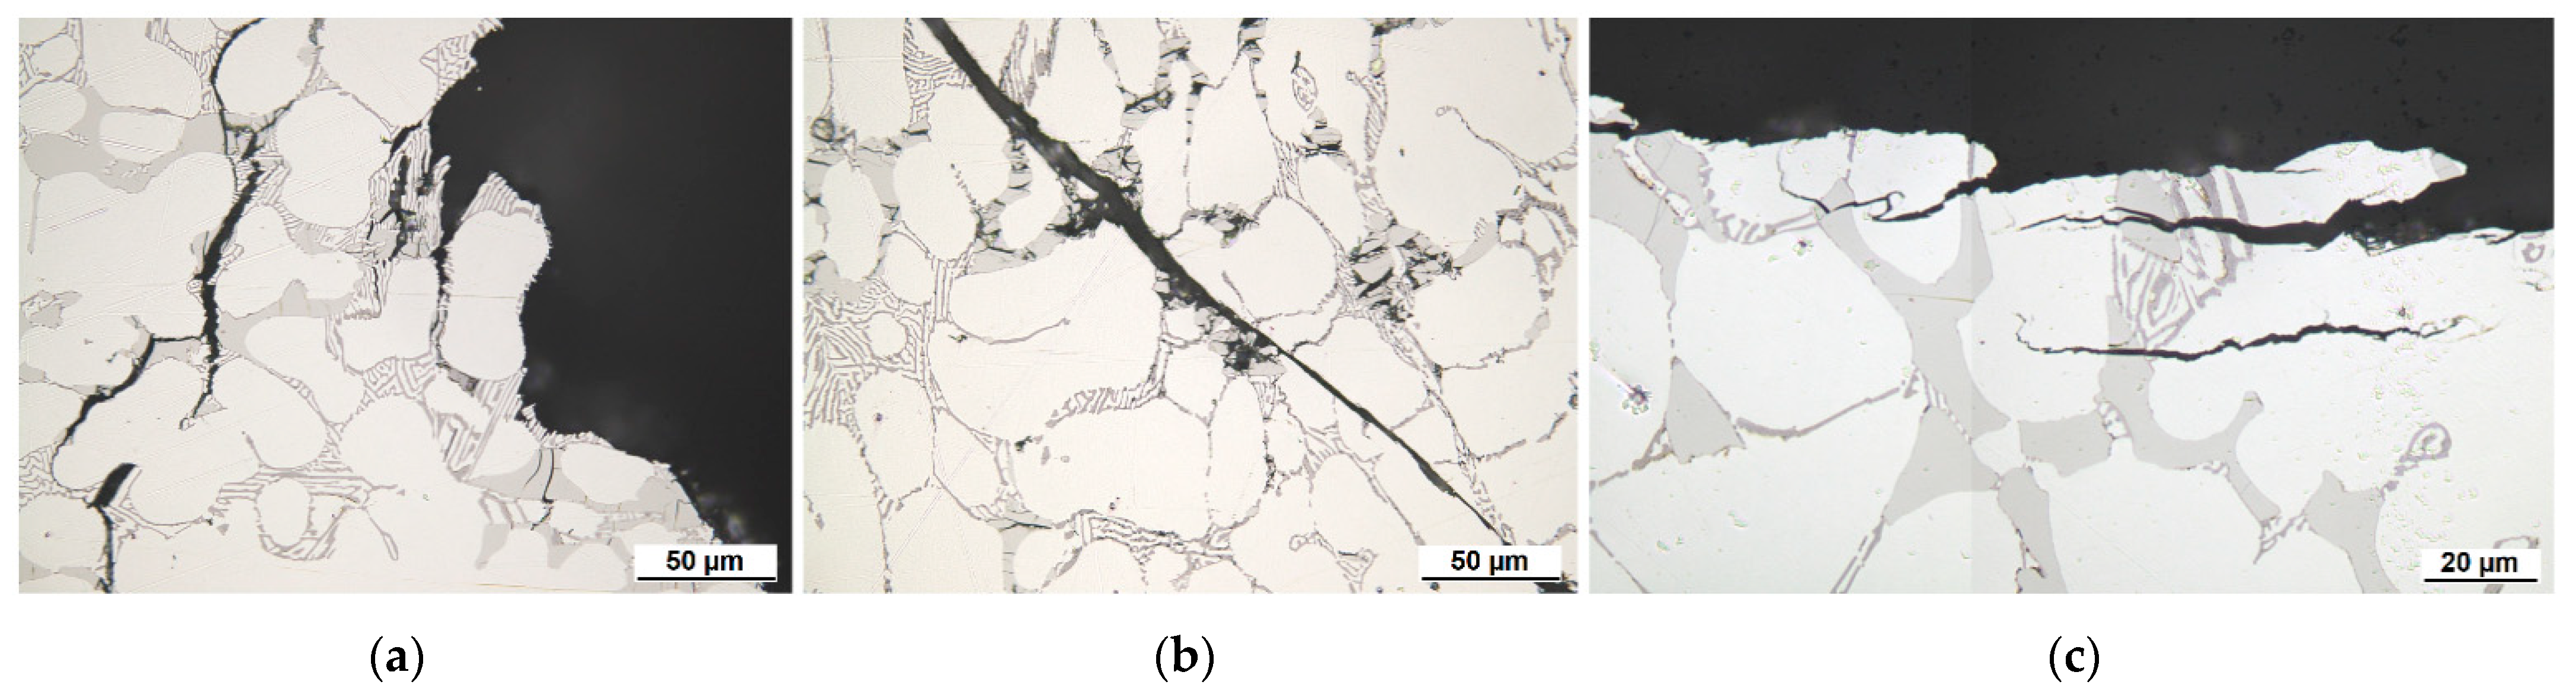
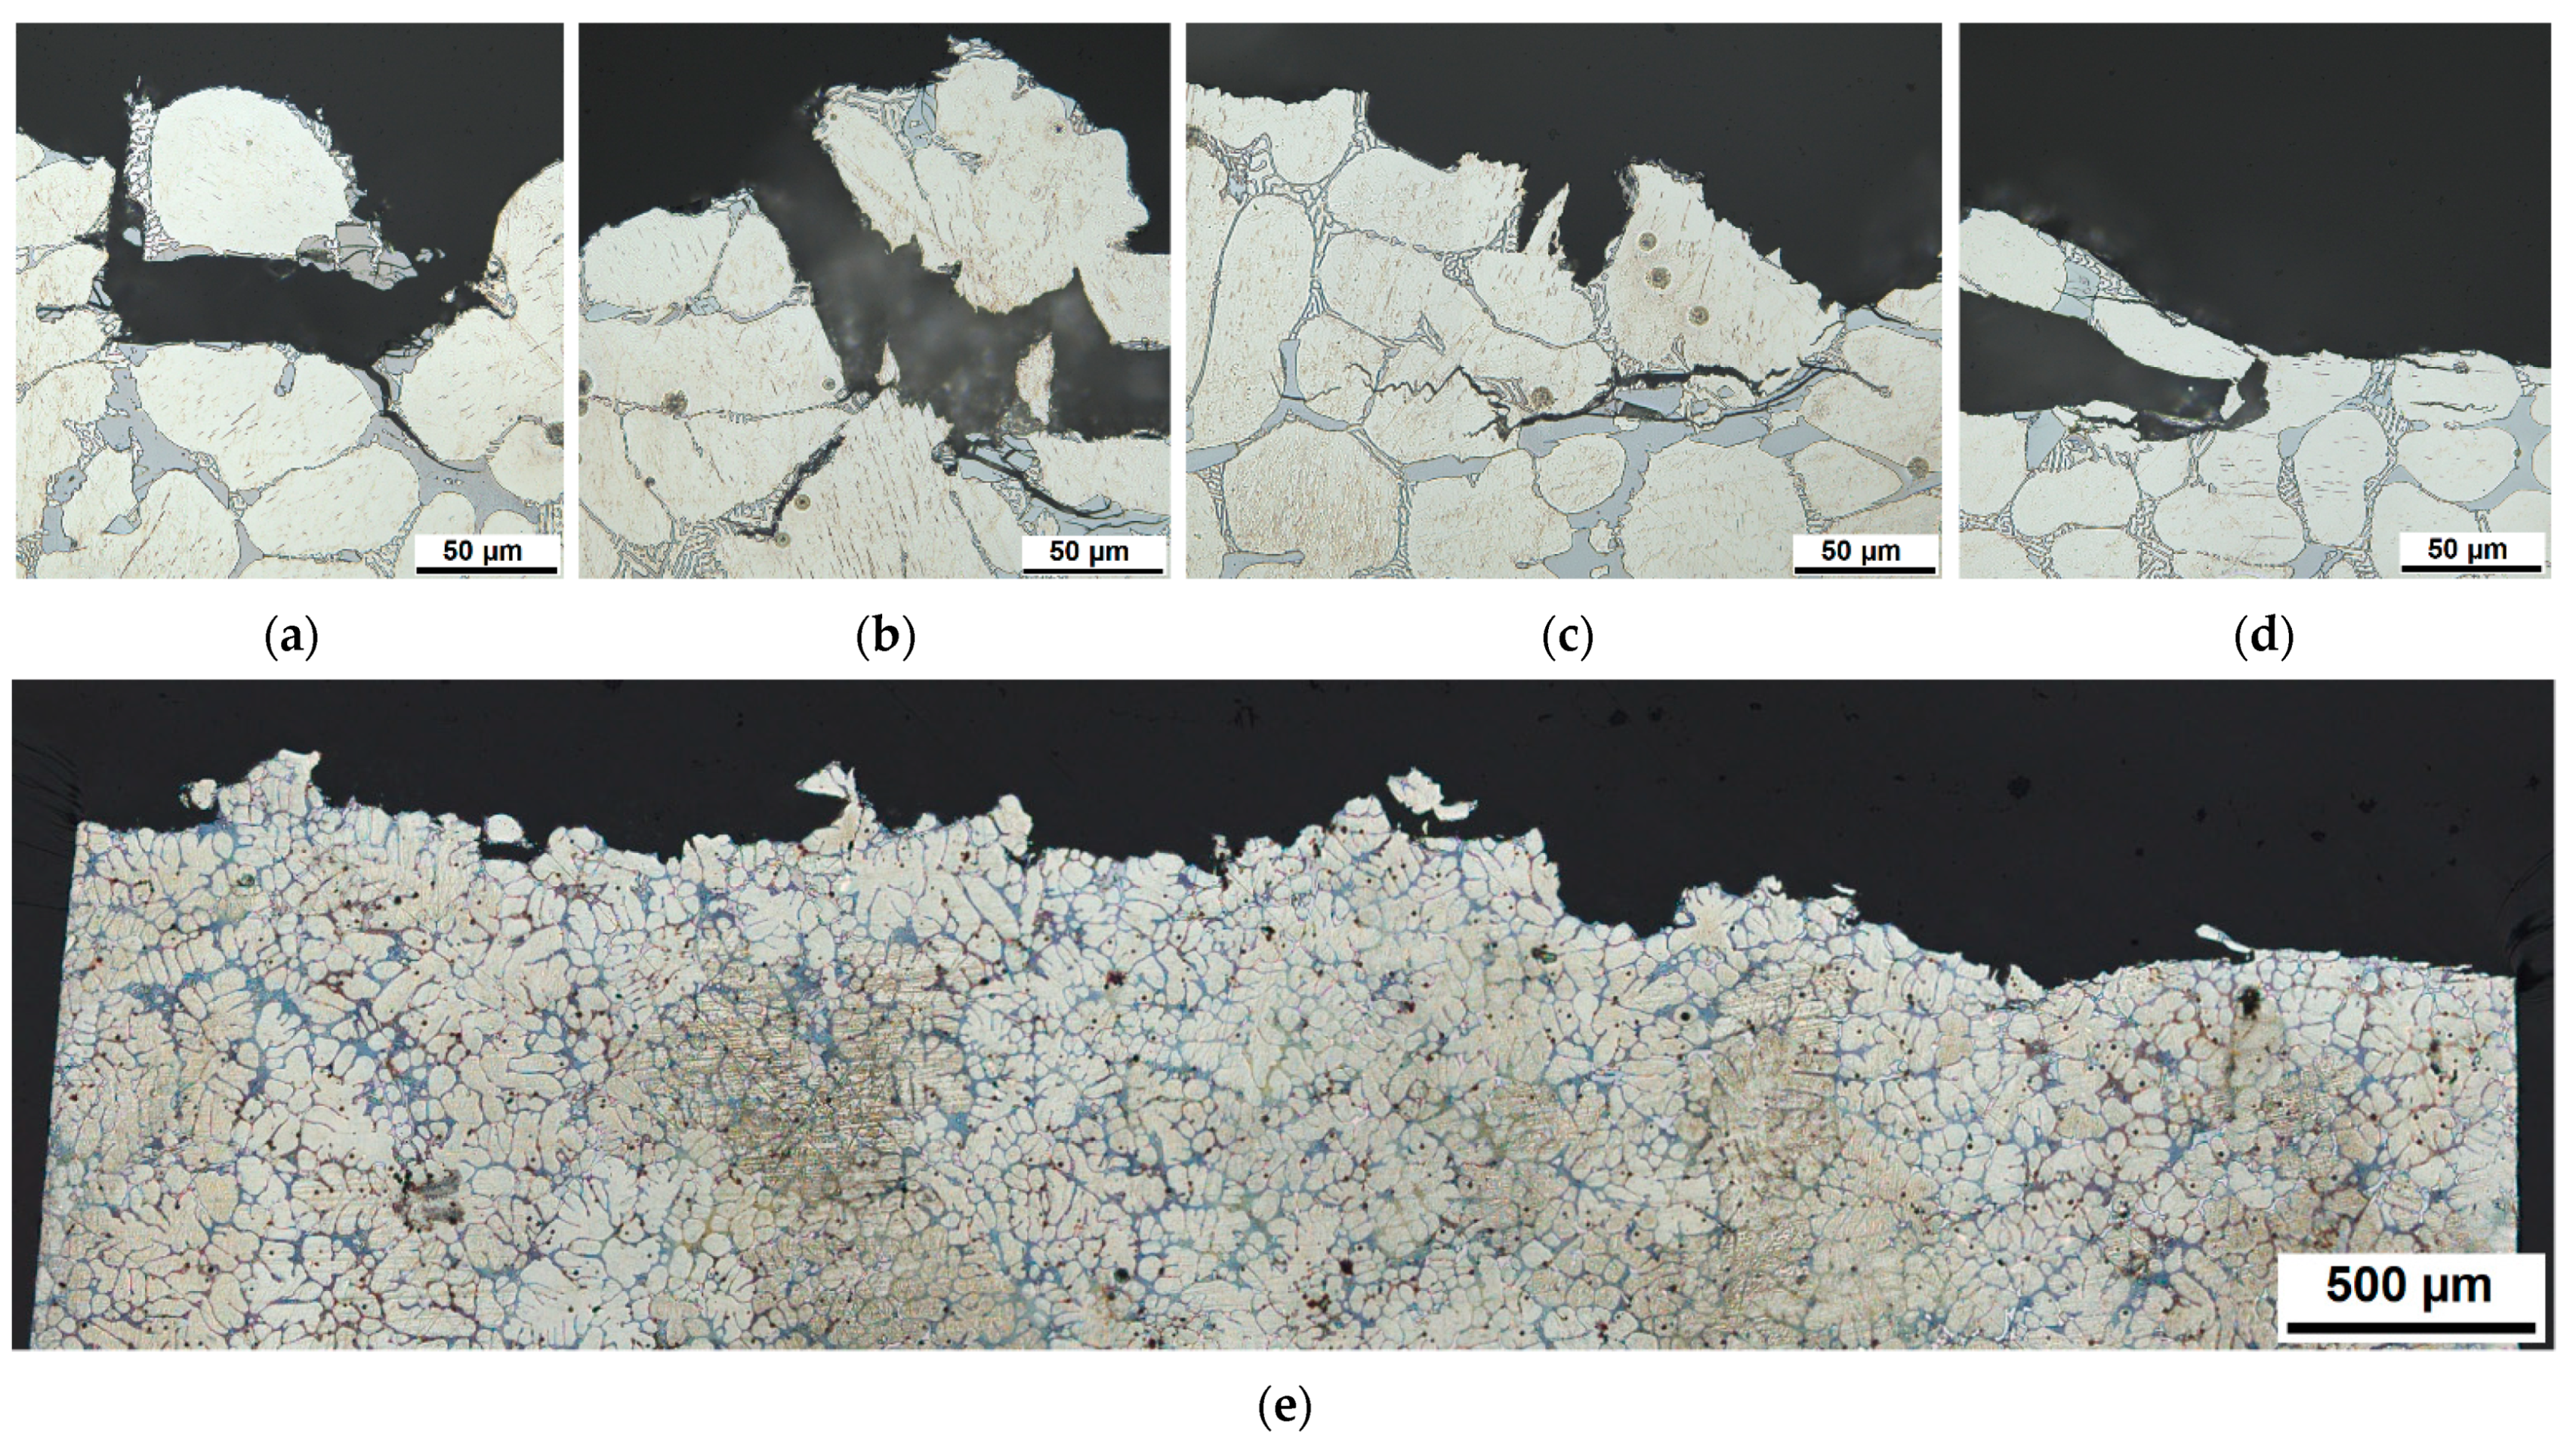
Figure 3 shows representative cross-sectional micrographs of the fracture surfaces after tensile load (
Figure 3a), compression load (
Figure 3b) and fatigue load (
Figure 3c). The main crack and the sub-cracks follow the networked blocky and lamellar second phases. The images in
Figure 4 and
Figure 5 show the crack propagation of the sub-cracks near the main crack and its interaction with the microstructural features in more detail for tensile and compressive loading. Under tension, the crack initiates and propagates mainly through the compact Ba-rich phase Mg
21Al
3Ba
2 due to its high hardness and brittleness (transgranular cracking). The lamellar Ca-rich phase Al
2Ca bridges the crack also mainly transgranular into the next compact Ba-rich phase Mg
21Al
3Ba
2, see
Figure 3a and
Figure 4a–c. Only very small lamellae of Al
2Ca show intergranular cracking along their interface to the α-Mg matrix.
Under compression, see
Figure 3b and
Figure 5a,b, the Mg-matrix also bridges the crack between the compact Ba-rich phases of Mg
21Al
3Ba
2, mainly supported by the Ca-rich Al
2Ca lamellae due to final high shear stress. Compression samples show a rather large plastic deformation zone: the compact Ba-rich phases of Mg
21Al
3Ba
2 near the main crack up to the surface of the sample, show transgranular fractures, see microcracks in the compact in
Figure 3b and
Figure 5b, reach even into several narrow dendritic arm spacings. The hardness increase of the compact Ba-rich phases of Mg
21Al
3Ba
2—up to 128% with the highest initial and strain-hardened value—is significant under compression, see
Table 1.
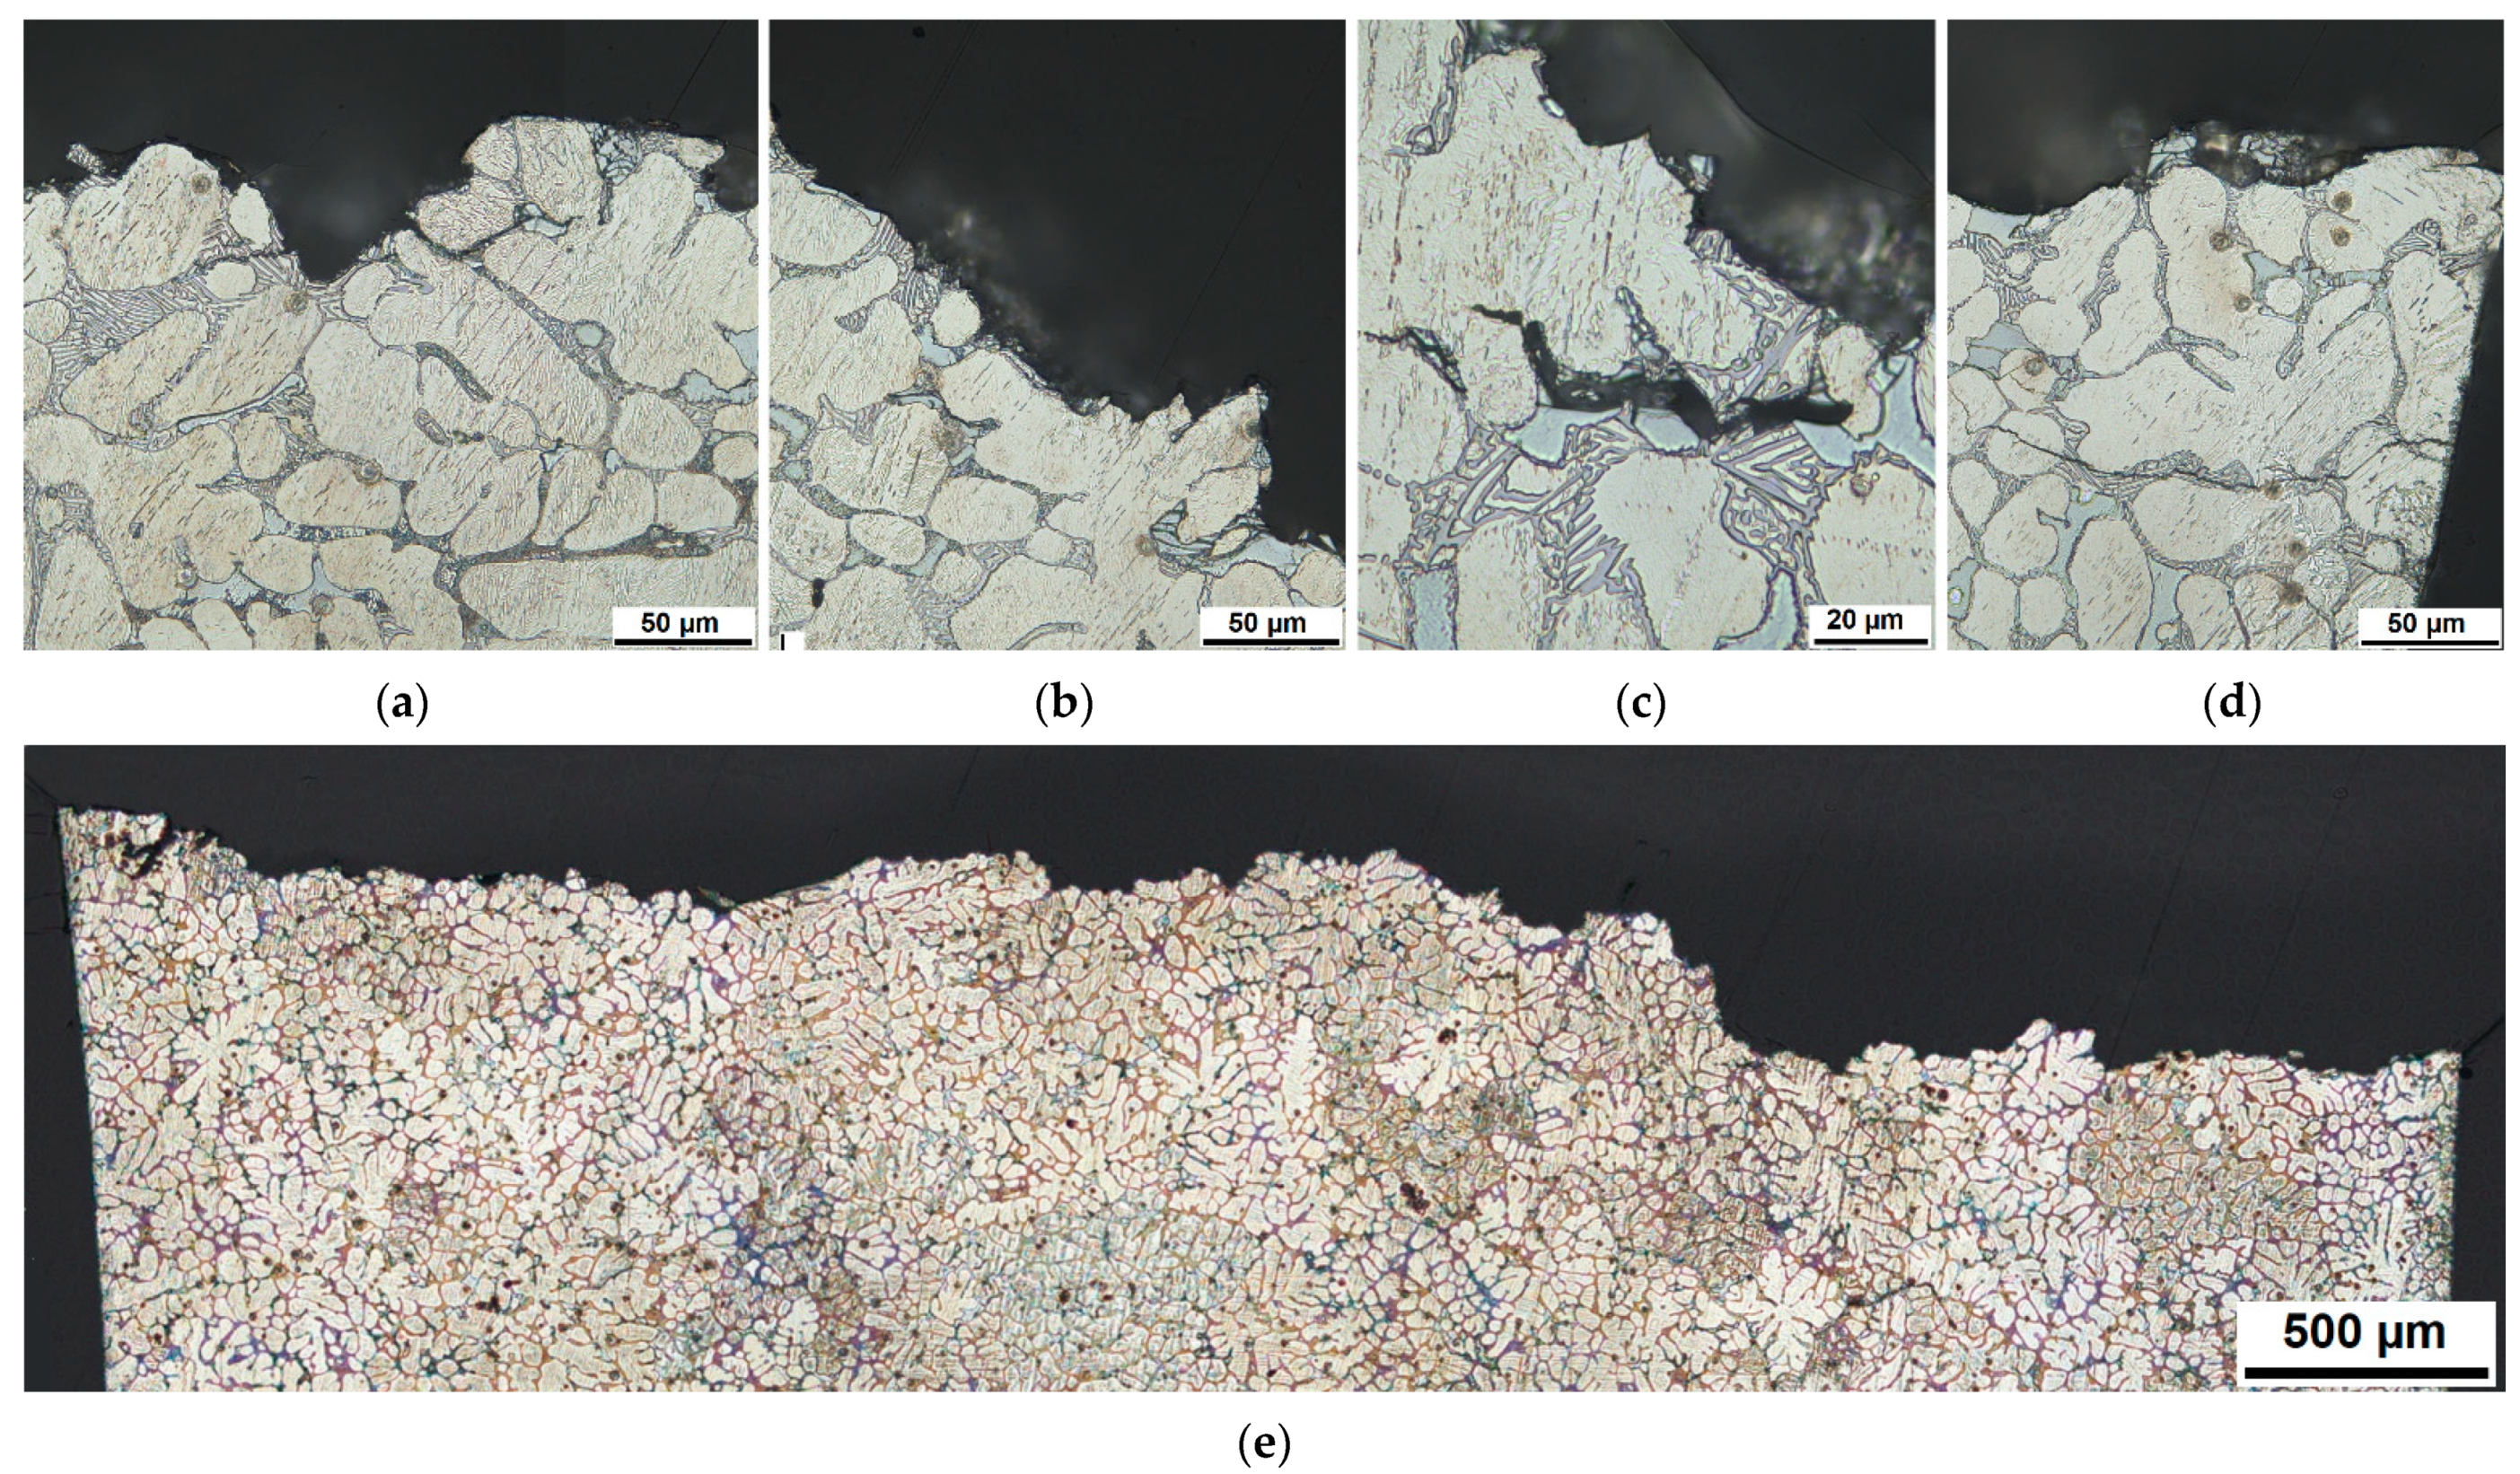
Figure 6a–e show that under fatigue loading with a load ratio R = 0 (sample reached 43,300 cycles at fracture) mainly transgranular cracking within the brittle second phases Mg
21Al
3Ba
2 and Al
2Ca can be found. However, there is also transgranular cracking within the dendritic α-Mg grains, see
Figure 6c,d. The cross-sectional micrograph of the fractured surface in
Figure 6e cuts the sample half-way along the crack propagation (crack initiation on the right and residual fractured surface on the left). It can be seen that the transgranular cracks within the dendritic α-Mg grains are only present along the fatigue crack propagation region within the first 25% of the fractured surface. Monitoring the hysteresis revealed strain hardening during tensile creep with ongoing fatigue.
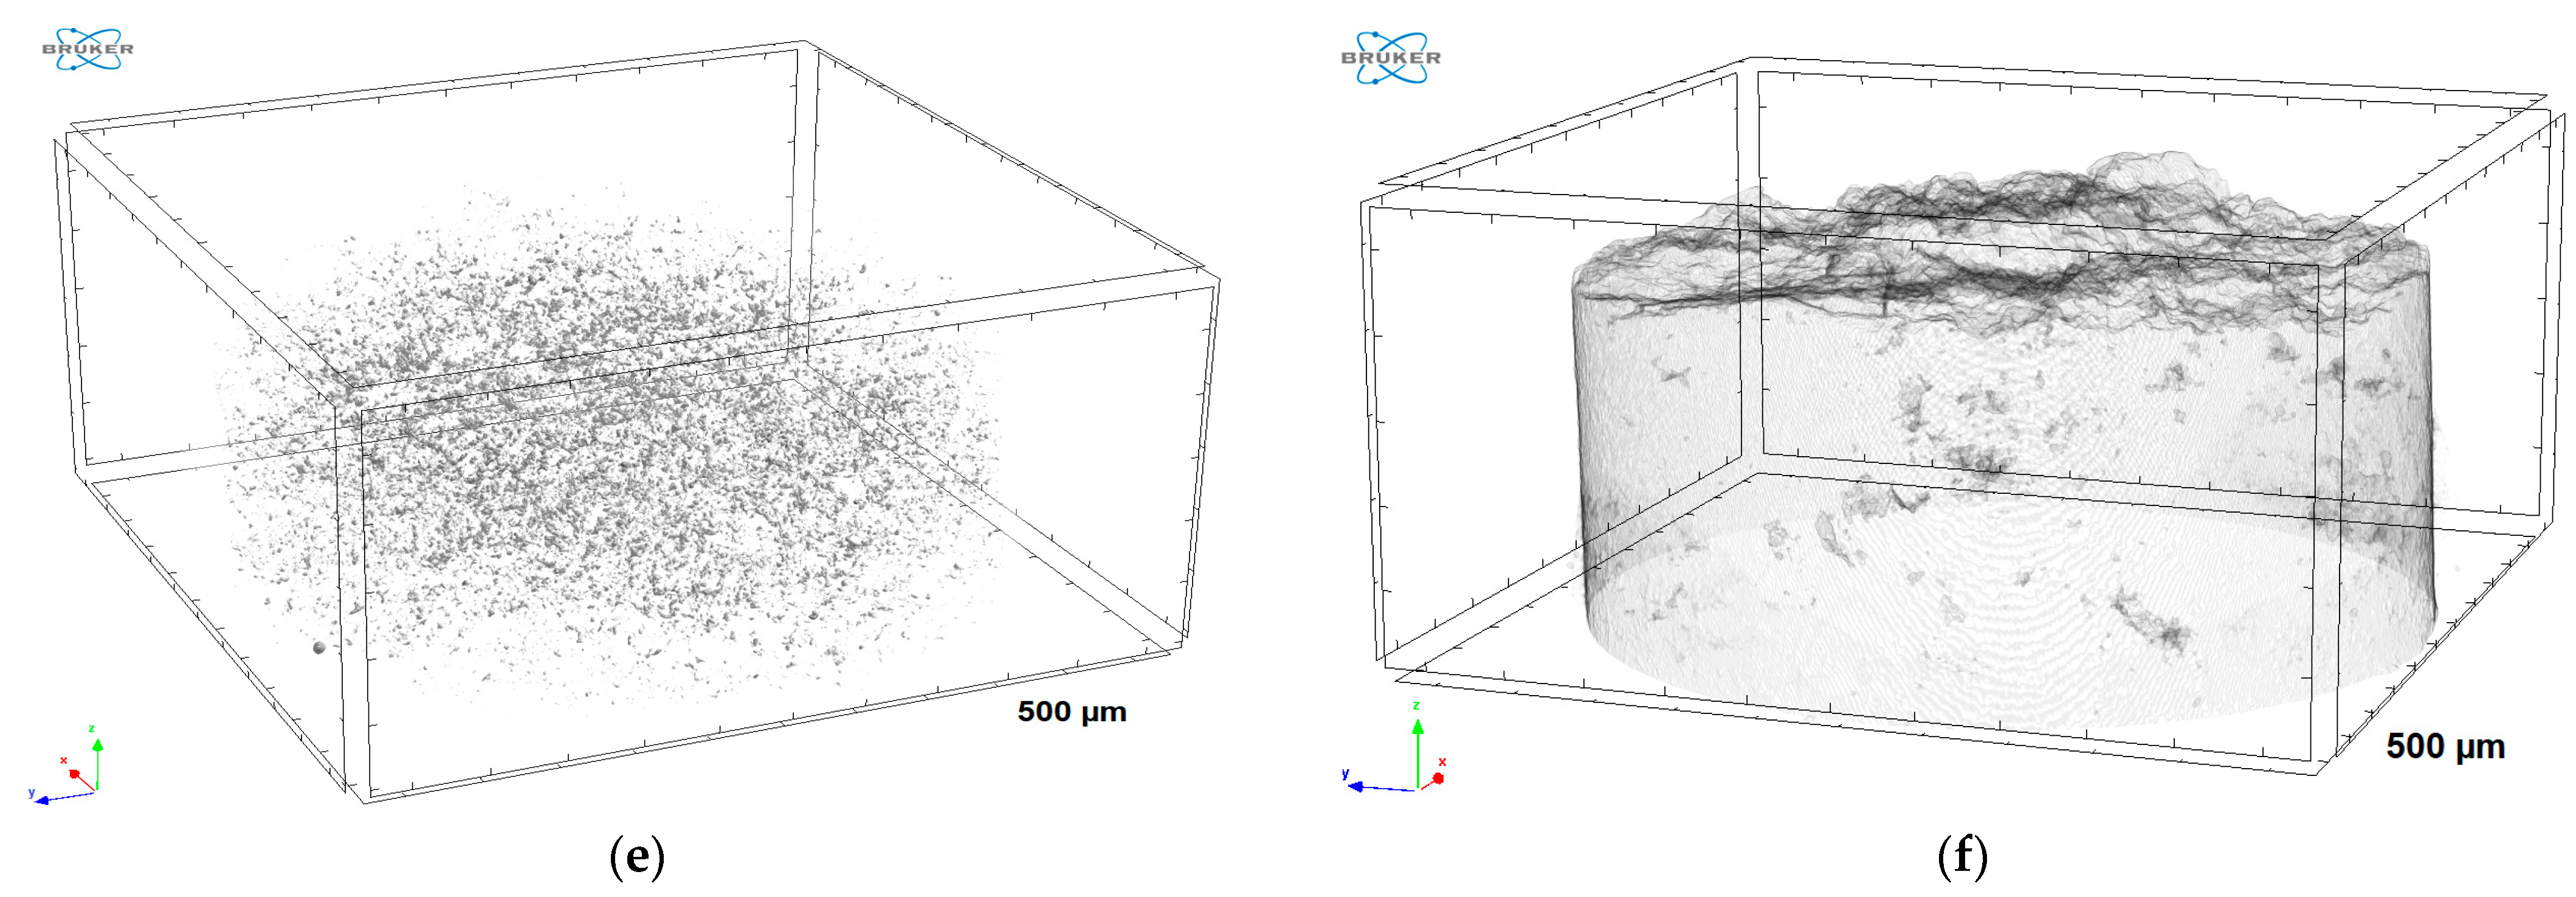
In addition to the cross-sectional micrographs in
Figure 6,
Figure 7 shows the results of the µ-CT analysis of a fracture surface after fatigue loading at a ratio R = 0. The top view in
Figure 7a images the fractured sample in the direction of the crack propagation, starting from the crack initiation to the residual fracture surface. Sub-cracks become very visible. The cut to size fracture surface in
Figure 7b shows the sub-cracks propagating inside the sample, even of more depth and in connection to the shrinkage cavities in the cut to the smaller size fractured surface in
Figure 7c—see here the white arrows marking a sub-crack connected with a shrinkage cavity below the fracture surface. By using a cross-sectional micrograph,
Figure 7d presents the depth of the sub-cracks and their connection to several cavities, which are located near the fractured surface. The network of the second phases is seen in
Figure 7e with the pores and shrinkage cavities in
Figure 7f, respectively.
Figure 8a–e show cross-sectional micrographs of the fracture surface after fully reversed fatigue loading (R = −1); the sample reached 12,000 cycles to fracture. The micrograph in
Figure 8e cuts the sample halfway along the crack propagation-crack initiation on the right and the residual fractured surface on the left. Similar to the fatigue loading with a load ratio R = 0, the crack mainly follows the brittle second phases of Mg
21Al
3Ba
2 and Al
2Ca. Only near the fatigue crack propagation region,
Figure 6d, can transgranular cracking within the dendritic α-Mg grains be seen. At this sample, a sub-crack below the main crack starts off in the α-Mg grain. The crack is guided by the deformation twins, crossing via Al
2Ca lamellae into the adjacent α-Mg grains. Transgranular cracking within the dendritic α-Mg grains disappears after the fatigue crack propagation region has been passed. The fatigue hysteresis reveals strain hardening and compression creep with ongoing fatigue.
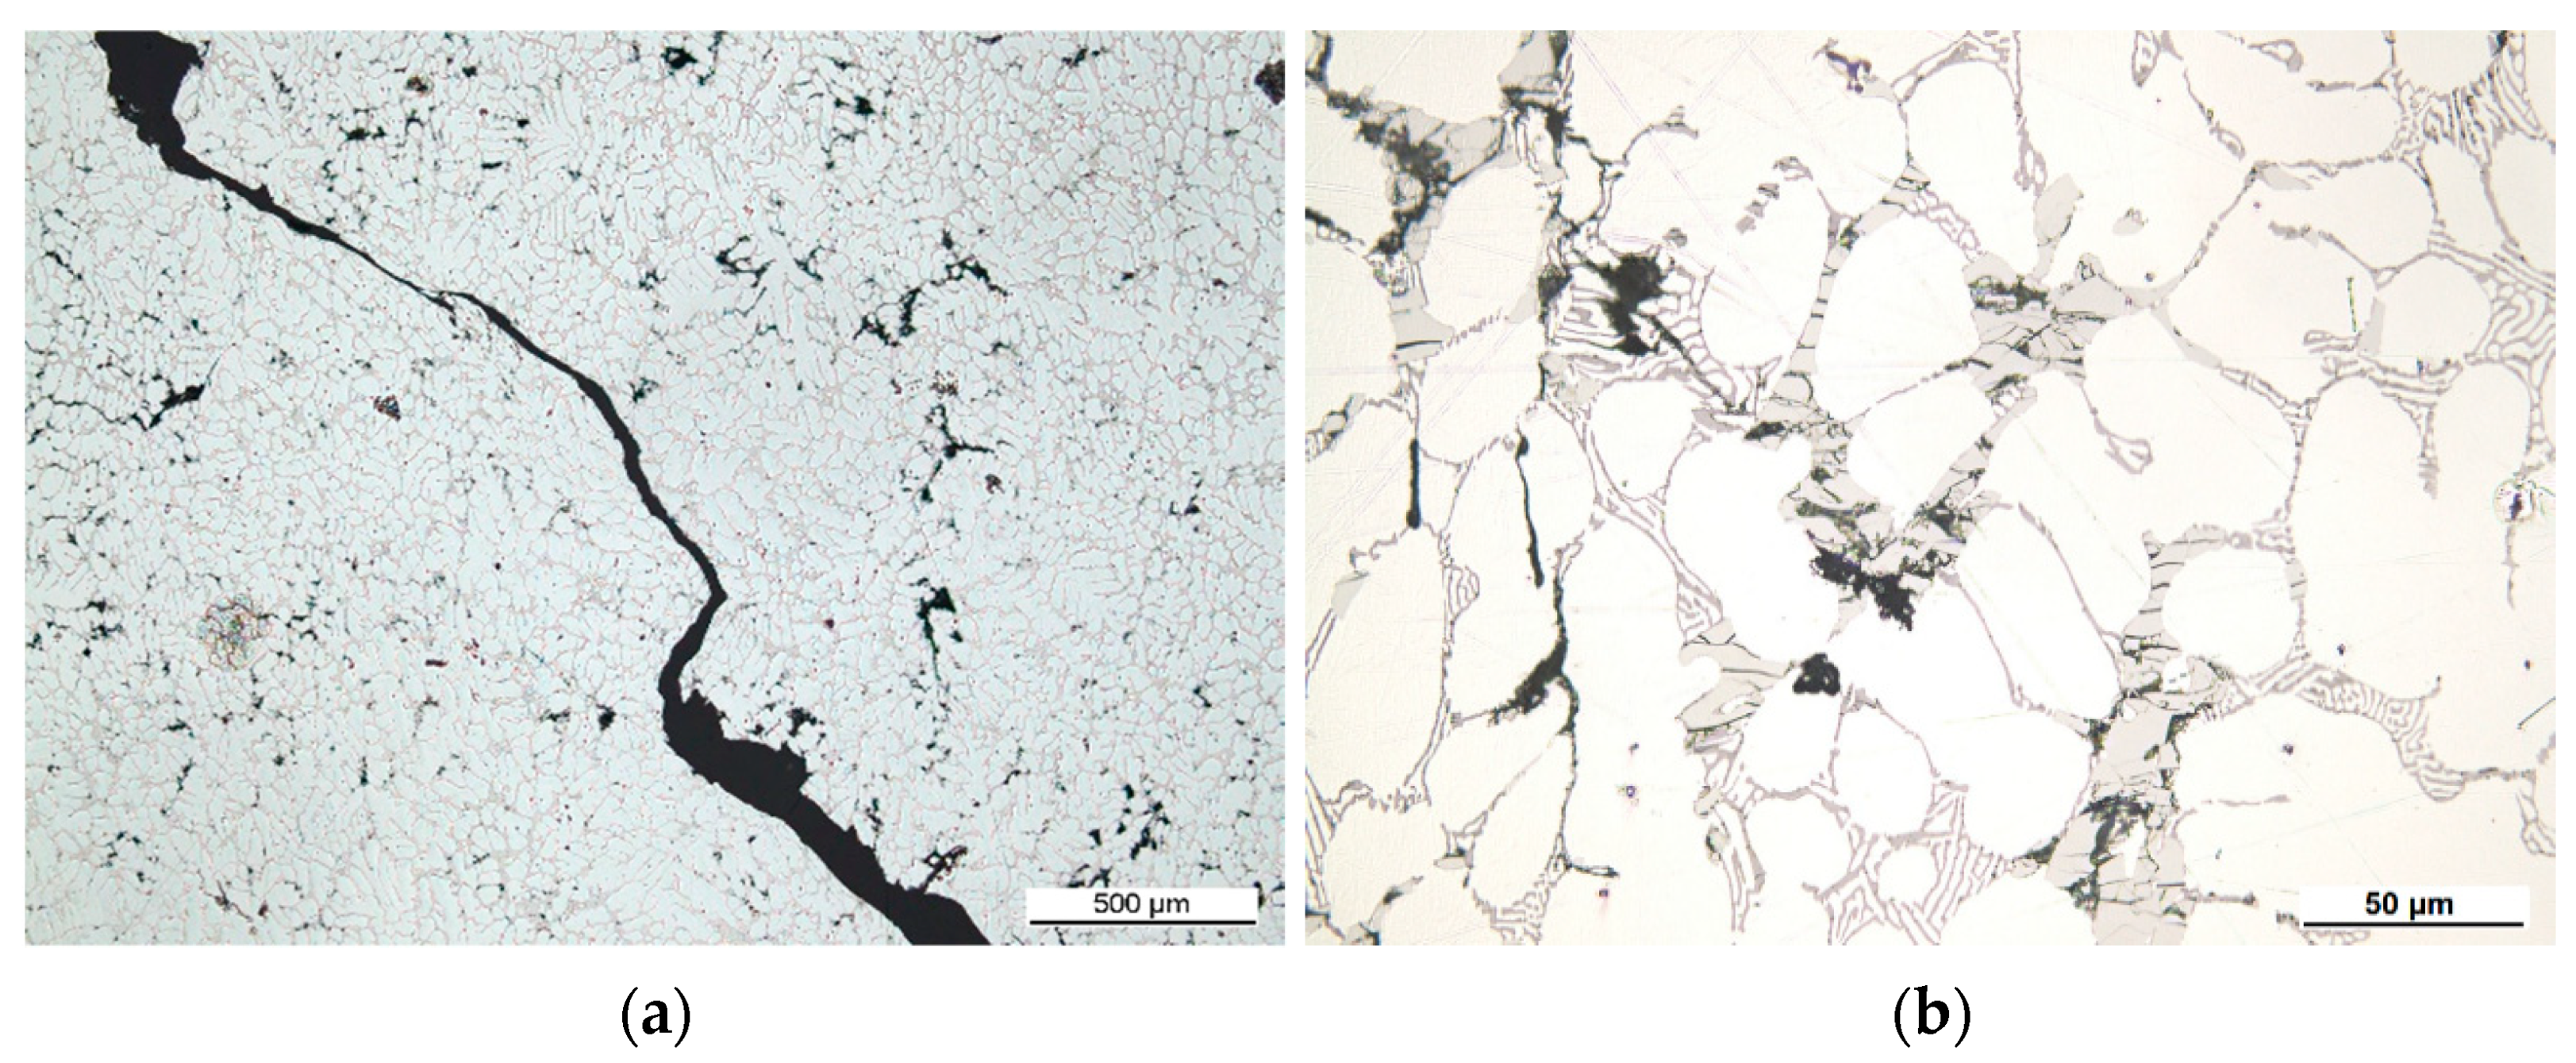
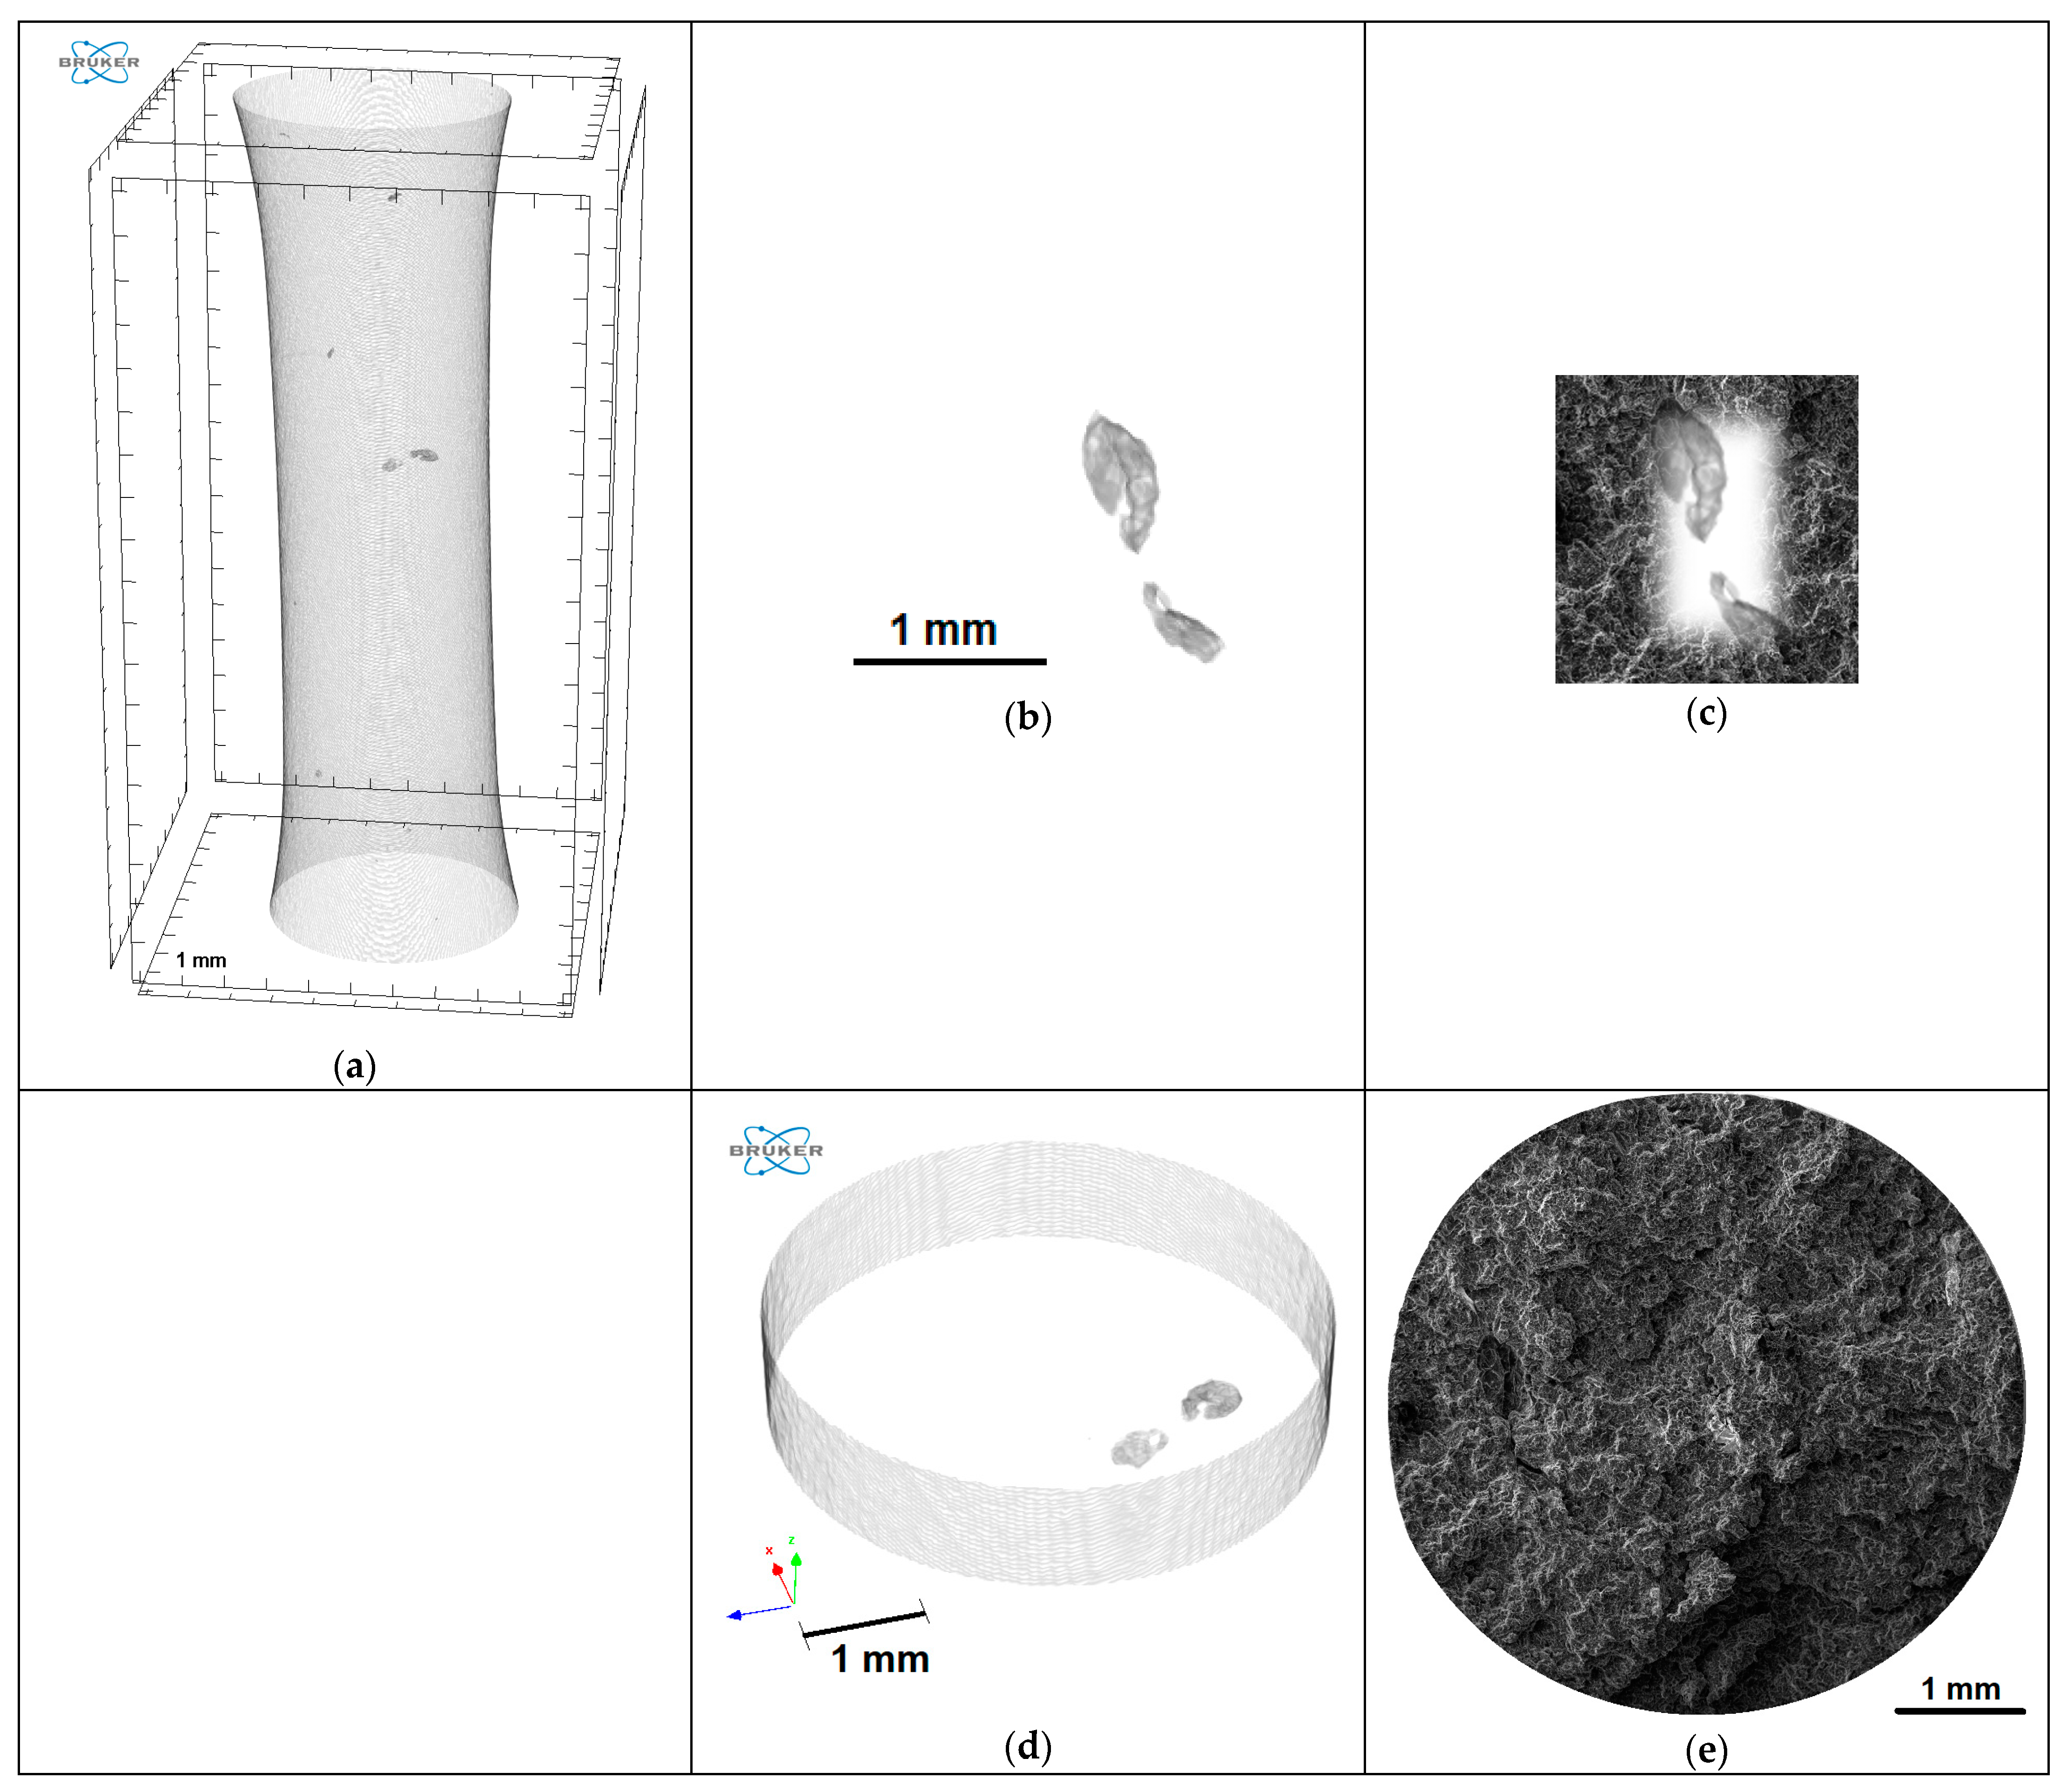
The gauge length of a sample before loading reveals several large shrinkage cavities by µ-CT analysis (
Figure 9a,b)—two of them are located near the middle of the gauge length, where the diameter is the smallest. It is of interest whether these cavities locate the failure position. The SEM image and the reconstructed pores by the µ-CT analysis in
Figure 9c–e highlight the large shrinkage cavities in the fracture surface after the sample failed by tensile loading. During fatigue testing, the monitoring of the hysteresis loops revealed strain-hardening and showed compression creep. The following parameters were measured by the tensile test (after 2 × 10
6 cycles as a “run out” at R = −1)): TYS of 97.4 MPa, UTS of 130.6 MPa, and an elongation at fracture 0.43%. The hardness increase was found mostly in the dendritic Mg-matrix of up to 124% (especially near the pore due to stress accumulation), both second phases increase up to 112%.
The gauge length of a sample in
Figure 10a reveals no defects of significant size while only a few small shrinkage cavities and pores are seen in the µ-CT analysis.
Figure 10b shows the network of second phases and only a few clusters can be seen. Unidirectional fatigue loading (compression load of −50 MPa at R = −∞) was applied. It was of interest whether these pores and second phase clusters influence the failure position. The sample did not fail under fatigue loading up to 2 × 10
6 cycles. The following parameters were measured by the final tensile test: TYS of 79 MPa, UTS of 129 MPa, and an elongation at fracture 0.61%. The hardness values after final fracture are mostly increased in the dendritic Mg-matrix (116%) and blocky Ba-rich phases (110%). The micrograph in
Figure 10c shows horizontal micro cracks further away from the main crack, which did not open up significantly under the final tensile test, other than that seen in
Figure 10d, where the secondary sub cracks closer to the main crack open by a great amount.
4. Discussion
The shrinkage cavities of a significant amount and the sizes lower the mechanical properties under tensile load and fatigue loading where tensile stress is involved. When the porosity [
8] is at a low level of 1.48%, the tensile properties were found to be higher: TYS at 202.6 ± 0.7 MPa, UTS at 229.6 ± 5.8 MPa, and El. at 1.6 ± 0.5%. The influence of large pores on the tensile properties were also seen in [
13] where a TYS of 78.1 ± 0.6 MPa was found. The mechanical properties under compression are less dependent on the porosity; in [
8] the CYS was found to be 117.6 ± 15.1 MPa, in [
13] the CYS was 128.0 ± 4.9 MPa and the UCS was 286.8 ± 2.9 MPa. The compressive properties of this alloy are slightly higher, even with a CYS of 135.00 ± 9.17 MPa, and the UCS with 282.55 ± 4.42 MPa is in the range seen in [
13]. Less increase of stress intensity around pores (defects), which is more significant under tension [
24,
25] and the ability to strain-harden the most under compression—see here the highest hardness values in
Figure 11a and the highest hardness increase under compression in
Figure 11b—makes this loading condition more bearable and independent of porosity.
According to
Figure 11a the compact Ba-rich phase Mg
21Al
3Ba
2 shows the highest initial hardness and remains at the highest value, which is almost twice as hard as the lamellar Ca-rich Al
2Ca region. The dendritic Mg-matrix has the lowest value, but hardens the most under compression, followed by the fully reversed fatigue testing method (R = −1), where there is a significant part of the compression forces. By the increase in hardness,
Figure 11b shows that the second phases do not change much under tensile and fatigue loading (R = 0), but rather under compression and fully reversed fatigue, R = −1, where the monitoring of the hysteresis reveals compression creep with ongoing fatigue at stresses of 97% of TYS and 37% of CYS (50 MPa). The dendritic Mg-matrix strain-hardens significantly under compression, up to 152%. The twinned microstructure reveals a certain amount of plastic deformation. However, the low initial hardness remains at the lowest level in comparison to the second phases. The hardness increase of lamellar Ca-rich phase Al
2Ca is comparable with the dendritic Mg-matrix, and the Ba-rich phase Mg
21Al
3Ba
2 is less pronounced under tensile and unidirectional fatigue testing, R = 0—this phase does not play a significant role under tensile deformation. With R = 0 at 50 MPa the samples last 43,000 cycles at fracture and obviously show tensile creep, but the strain hardening is similar to the tensile quasi-static overload.
By the cross-sectional micrographs of the fracture surfaces after tensile compression and fatigue load, it becomes clear that only fatigue loading causes transgranular cracking within the dendritic α-Mg grains within the fatigue crack propagation region. In the region of residual fracture, the crack transforms into interdendritic cracking, where the hard and brittle second phases are located. In tensile and compression loading the crack initiates and propagates mainly through the compact Ba-rich phase Mg
21Al
3Ba
2 via transgranular cracking, bridged by the lamellar Ca-rich phase Al
2Ca. Only when the shear deformation under compression is very high, just before final failure, does the crack appear to run through the α-Mg dendrites. The second phases are more than twice (Al
2Ca) and four times as hard (Mg
21Al
3Ba
2) as the dendritic α-Mg matrix, even after deformation; when the dendritic α-Mg matrix hardens the most, the Mg
21Al
3Ba
2 phase remains twice as hard as Al
2Ca. That means that in quasi-static loading the irreversible deformation is only concentrated on the hard and brittle phases, in agreement with the simple fracturing mode. Microstructural investigation in the study by [
18] also confirmed that the crack growth mode changed from transdendritic to interdendritic. The transdendritic cracks occurred by a fatigue mechanism and the interdendritic cracks by overload. This study claims that this cracking mode transition phenomenon is one of the typical features of casting fracture by a fatigue mechanism.
Only during fatigue loading does the crack propagate into the softer dendritic α-Mg matrix. The fully reversed loading mode causes increased stress intensity in the softer dendritic α-Mg matrix near the interface to the brittle phases. Microcracks are the result of an accumulation of twins and slip bands in the softer dendritic α-Mg matrix, which has a higher possibility to deform by having a quarter of the hardness of the Mg
21Al
3Ba
2 phase. The fatigue crack initiation of Mg-alloys is also closely related to the deformation mechanisms of twinning [
26]. Máthis et al. [
27] interpreted their results on the investigation of tension–compression asymmetry in Mg by the dominant effect of twinning up to 200 °C and greater slip activity at higher temperatures. The dynamic crack propagation is therefore found in the form of three-dimensional fracturing with crack branching, see magnified image in
Figure 12a from
Figure 8.
Figure 12b shows fine sub-crack branching into the softer dendritic α-Mg matrix, where a redirection by the twinned microstructure can be seen.
The high hardness increase (
Figure 11b) under compression can be explained by the delayed initiation and appearance of microcrack-compression loading being rather defect closing than crack opening [
24,
25]: even though [
28] deformation modes are missing, all phases strain-harden the most under compression. The dendritic α-Mg grain, which is the most deformable one among the three phases (lowest initial hardness), strain-hardens the highest, up to 152%. However, the compact Ba-rich phase Mg
21Al
3Ba
2 stays at the highest hardness by a significant amount and is the phase which cracks first due to brittleness.
In addition to being interested in the change of the mean hardness value by the different loading modes, the hardness along the fractured surface is also of concern. The cross-sectional micrographs of fracture surfaces after fatigue load from
Figure 6 (R = 0, 43,000 cycles) and
Figure 8 (R = −1, 12,000 cycles) were used to evaluate the hardness at different regions. The hardness was measured within the fatigue crack propagation region near crack initiation, where transgranular cracking within the dendritic α-Mg grains was seen in the middle of the fractured surface, where clearly only transgranular cracking within the brittle blocky Ba-rich phase Mg
21Al
3Ba
2 and lamellar Ca-rich phase Al
2Ca occurs, and also within the residual fracture surface at the opposite side to the crack initiation region. It can be seen during unidirectional testing at 50 MPa (R = 0) that up to 43,300 cycles to fracture the hardness of the blocky Ba-rich phase Mg
21Al
3Ba
2 in the middle of the sample within the residual fracture region, is higher than within the fatigue crack propagation region, and is reduced at the final part of the residual fracture region, see
Figure 13a. The lamellar Ca-rich phase Al
2Ca on the other hand increases slightly only at the final part of the residual fracture region. The softer dendritic α-Mg grains increase slightly during fatigue loading with a slight decrease towards the final part of the residual fracture region. The fully reversed testing at 50 MPa (R = −1) with the number of cycles to fracture of 12,000 shows a different picture, see
Figure 13b. Here the highest hardness values were found in the region of the fatigue crack propagation, the blocky Ba-rich phase Mg
21Al
3Ba
2 strain-hardens the most, followed by the softer dendritic α-Mg grains. The increased hardness compared to the undeformed material (initial) remains in the residual fracture region for the blocky Ba-rich phase Mg
21Al
3Ba
2, which strain-hardens the most, followed by the softer dendritic α-Mg grains.
These results show that the three phases in the DieMag633 not only strain-harden in a different amount depending on the loading conditions, tensile, compression, and fatigue, but also depend on the fatigue testing method and the specific region of crack propagation. Whereas in fully reversed loading (R = −1), where compression stress at a level of 37% of the CYS on top of the tensile stress at a level of 97% of the TYS is applied (reversed loading in compression seems to benefit, one sample lasted up to 2,000,000 cycles run out), the blocky Ba-rich phase Mg21Al3Ba2 strain-hardens the most during fatigue crack propagation (together with the lamellar Al2Ca phase). This phase hardens less in this region under unidirectional loading, but more in the region where the crack propagation has changed into interdendritic and transgranular cracking within the hard second phases.
To measure the hardness along the fractured surface in shorter distances is the focus of the current work and will be published together with more statistically validated data from further fatigue testing.
The micrographs as well as the images from the µ-CT analysis reveal many sub-cracks branching from the main crack along or rather within the interdendritic brittle phases (plus transgranular within the α-Mg matrix during fatigue loading), which reach up to 100 µm into the material. These cracks often interconnect with pores and cavities. The microstructure is highly twinned along the main crack and around the sub-cracks, see
Figure 14a,b. Since twinning is a dominant deformation mode in Mg-alloys [
29], the hardness increase can be explained by the visible change of the microstructure, see
Figure 14b. However, the microstructure in the fractured surfaces after tensile loading is highly twinned, but with a lower increase in hardness. It is noticeable that the cross-sectional micrographs of the fracture surfaces after tensile loading show a lot of large sub-cracks, and often further surface cracks, see
Figure 14a. It can be assumed, that the absorbed energy caused the microcracks in the brittle second phases rather than deforming the phases. The ability to play a part in the deformation under tension is low in all three phases, see smaller hardness increase for tensile and fatigue R = 0 testing in
Figure 11b. Even so, the softer dendritic α-Mg matrix still twins before final fracture but the onset twinning is rather low [
30].
The samples failed by fatigue testing showed less large sub-cracks (compare
Figure 6 and
Figure 8 to
Figure 14). They are mainly located at the crack propagation region or the transition region to the residual cracking, and they also give a good indication of the direction of the fatigue crack propagation. The cracks are influenced by the pores and shrinkage cavities, which often accompany the crack growth. When unidirectional loading is applied the hardness value increases are similar to tensile loading. This can be explained by the fact that at the “R = 0” sequences, only (positive) tensile stresses are applied.
In the region where under fatigue loading most of the larger sub-cracks were found, transgranular cracking within the softer dendritic α-Mg matrix was seen, which hardens the most within this fatigue crack propagation region—up to 117% for R = 0 and very significant (together with the other phases) up to 126% for R = −1. Only the compression load causes higher strain hardening with 152%.
First µ-CT analysis reveals that large shrinkage cavities, which are also near the area of the lowest diameter in the gauge length, influence the location of the fracture surface. When large shrinkage cavities are away from the lowest diameter region, they do not influence the fracture under fatigue loading, but rather under tensile loading.
During fully reversed fatigue testing, compression creep was seen accompanied with strain-hardening. The high hardness increase within the brittle second phases, but also in the dendritic α-Mg matrix, can be attributed to the compression part of the reversed loading sequences. This strain-hardening becomes very clear from the tensile test data after 2 × 10⁶ cycles to run out: TYS increases by a factor of 1.9 (98 MPa) and the UTS by a factor of 1.3 (132 MPa), whereas the elongation at fracture was reduced to 74% (0.43%). The hardness increase after the final fracture from the tensile test shows hardness values in which the strain-hardening amount contains parts from fatigue loading strengthening and hardening from the tensile test.
The sample exposed to unidirectional fatigue loading (R = −∞ at −50 MPa) was free of large pores and shrinkage cavities. The strain-hardening amount which was obtained from the final tensile test after the “2 × 10⁶ cycles run out” is smaller than that seen after fully reversed fatigue testing. The TYS increased by 1.53 to 79 MPa, the UTS by 1.26 to 129 MPa, and an elongation at fracture stayed with 0.61% with the range of initially measured values. Even compression loading showed a great effect on the hardness change on all phases, the hardness increase of the fractured surface of the unidirectional fatigue loaded sample was also found to be smaller compared to fully reversed fatigue testing. This can be explained by the stress amount applied: 50 MPa is far less than the CYS (37%), but very close to the TYS (97%). The reduction of elongation at fracture, seen in the tensile test after fully reversed fatigue testing, is a result of the significant increase in yield strength of almost 200%, but also with a large shrinkage cavity. The micrographs of the unidirectional fatigue exposed sample at −50 MPa after tensile testing revealed thinner, horizontal micro-cracks away from the main crack, which might have formed during compression fatigue loading within the brittle second phases but did not open up in a significant amount under the final tensile test. A high amount of larger secondary sub cracks will most certainly have their origin in these thinner cracks. Further, a statistically validated number of tests will show whether this fracture procedure is a characteristic of unidirectional fatigue loading under compression and if less strain-hardening is a result of this. In general, the hardness increase is found to be higher in samples which failed during the fatigue test compared to the “run out” samples, and since the damage was pre-fatigue crack propagation the crack follows the interdendritic network of second phases instead of propagation through the Mg-matrix. Transgranular crack propagation within the Mg-matrix has only been seen under fatigue crack growth.


