Article

Microstructure and Texture of an Aluminum Plate Produced by Multipass Cold Rolling and Graded Annealing Process

1
College of Materials Science and Engineering, Chongqing University of Arts and Sciences, Chongqing 402160, China
2
National Instrument Functional Materials Engineering and Technology Research Center, Chongqing Materials Research Institute Co., Ltd., Chongqing 400707, China
3
College of Materials Science and Engineering, Chongqing University, Chongqing 400044, China
*
Author to whom correspondence should be addressed.
Metals 2022, 12(2), 260; https://doi.org/10.3390/met12020260
Submission received: 13 December 2021 / Revised: 26 January 2022 / Accepted: 27 January 2022 / Published: 29 January 2022

Abstract

:
In order to explore the microstructure, texture, individual performance, and grain size characteristic evolution law during the process of multipass cold rolling, graded annealing process, the experimental design, research approach, and methodology were investigated using the equipment of optical microscope (OM), X-ray diffraction (XRD), electron backscattered diffraction (EBSD), and transmission electron microscope (TEM). The results show that a low interannealing temperature could strengthen the cubic texture after finished product annealing, and a high volume fraction of cubic texture components was subsequently obtained. In view of the nucleation advantage of cubic texture, the Cube-{001}<100> texture formation after annealing was promoted by the cold-rolled texture of Cu-{112}<111> and S-{123}<634>, which mainly depended on the decomposition of Cu and S textures, finally, they were consumed and transformed from Cu and S textures into a cubic texture. In addition, the dislocation configuration and corrosion pit density were clearly visible and distinctive in the observation space of aluminum foil.

1. Introduction

Conventionally, the microstructure and texture of aluminum and its alloys are closely related to mechanical properties and macro performance during cold rolling, heat treatment, and other processing procedures [1]. The heat-treatable type high-purity aluminum foil has been mainly used in two aspects, namely the packaging industry and high-voltage electrolytic capacitors [2,3]. One of the most important properties of aluminum as a packaging material is its inertness compared to most metals [3]. As noted earlier, when exposed to air, aluminum forms a transparent oxide layer, which prevents further oxidation. In the manufacturing industry, one of the biggest uses of high-purity aluminum is in the production of aluminum electrolytic capacitors. This kind of aluminum electrolytic capacitor has the advantages of large capacitance, high working voltage, and low price [4,5,6]; especially in recent years, the performance of aluminum foil has been improved to a certain extent, and the application has been gradually expanded in many areas.
Aluminum is the most abundant metal found in the Earth’s crust (approximately 8%) and is the third most abundant element found on Earth, after oxygen and silicon. Due to its reactive behavior [5], aluminum is never found as a pure metal in nature but combined with hundreds of minerals. In the production of electrolytic capacitor aluminum foil, the specific capacitance value is one of the most important parameters to evaluate its quality and performance [7,8]. On the premise of the same corrosion conditions and other technological parameters in aluminum foil, the specific capacitance value will depend on the microstructure state of the original aluminum foil. Therefore, the cubic texture content and dislocation outcrop density fundamentally determine the specific capacitance in the original foil [9]. In other words, the cubic texture content and dislocation outcrop density in finished foil for high-voltage anode electrolytic capacitor act as the evaluation parameters: the microstructure and the cubic texture should reach a high level, which is the key factor to produce a high-quality product of aluminum foil, and it is used in the field of high-voltage aluminum electrolytic capacitors [10,11].
To obtain a high-quality capacitor aluminum foil, researchers [12,13,14] have completed a series of studies on the microstructure, texture, and grain size evolution of aluminum foil during the process of cold rolling, interannealing, and finished product annealing. For example, the effects of cold-rolled deformation degree and passes [15,16], the volume fraction of texture, interannealing [17], finished product annealing [18], and the impurity elements [19,20] on microstructure, grain boundary character, and recrystallization behavior, which was discussed within a lot of research works [15,16,17,18,19,20,21,22,23]. Although these researchers have completed a lot of research, for the actual production of enterprises, the production efficiency is not high, the resulting cubic texture content is not uniform, and this conventional treatment does not save lead times; it is difficult to ensure the preparation of a high-quality capacitor aluminum foil [12,13,14,15,16,17,18].
In this paper, the different experimental program procedures were designed according to the actual production situation of enterprises and theoretical research; a novel experimental model was developed to obtain the cubic texture efficiently. Therefore, the effects of different preparation technology (including primary cold-rolled deformation degree and passes, primary interannealing, secondary cold-rolled deformation, secondary interannealing, finished product annealing, and final annealing) on the microstructure, dislocation configuration, micro-zone grain orientation, and cubic texture content in aluminum foil were investigated; finally, the nucleation mechanism, recrystallization behavior and texture evolution of cube orientated grains were deeply discussed.

2. Materials and Methods

2.1. Material

The chemical composition of as-received aluminum plate (high-purity aluminium plate, with a purity of 99.99%, marked as LG5) is mainly composed of 99.995% aluminum (Al), 0.001% iron (Fe), 0.0012% copper (Cu), 0.0016% magnesium (Mg), 0.0007% silicon (Si), 0.0002% manganese (Mn), 0.0001% nickel (Ni), 0.0003% zinc (Zn), and 0.0001% titanium (Ti). Table 1 shows the complete chemical composition of the aluminum plate.
In this composition, the aluminum plates were the three-layered liquid electrolysis, hot-rolled, high-purity aluminum plates, which were provided by Southwest Aluminum (Group) Co., Ltd. (Chongqing, China), and the component was detected using a PDA-6000 photoelectric spectrometer (Shimadzu, Izumo, Japan). The high purity only contains trace impurity elements, and these impurity elements all existed in the aluminum matrix in the form of a solid solution, so the influence of impurity, second phase on recrystallization, and grain growth could be ignored.

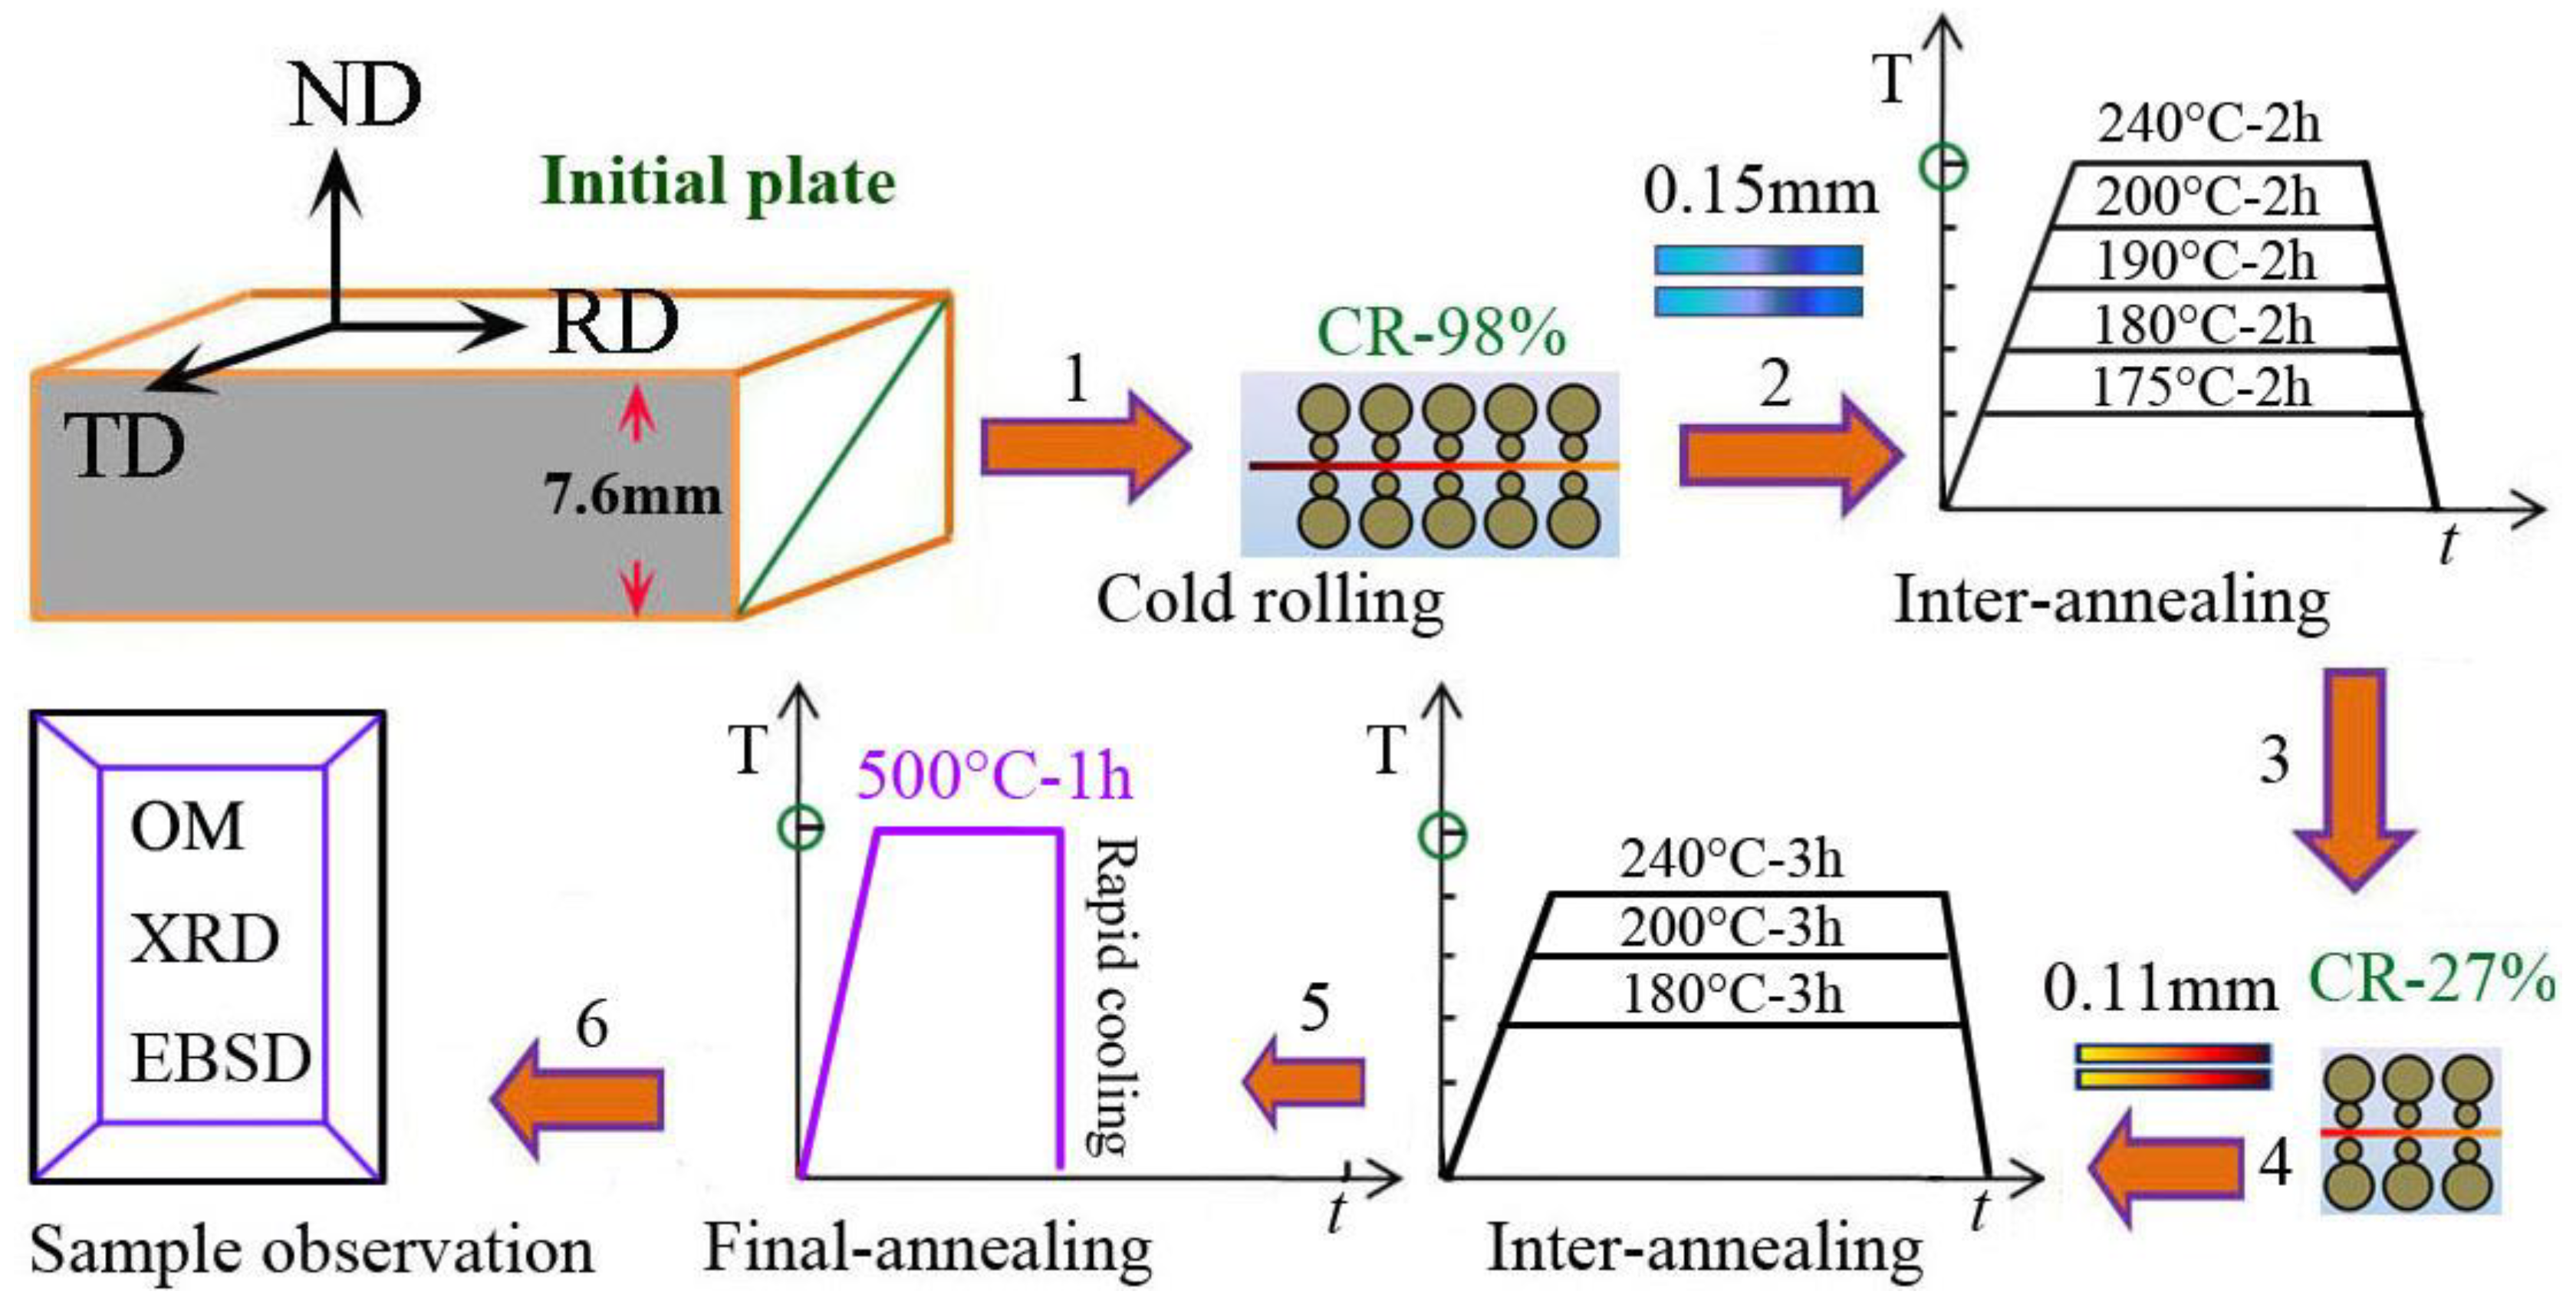
2.2. Experimental Program

Cold rolling and heat treatment were carried out through a multipass rolling mill and resistance furnace in material preparation laboratory. Figure 1 shows the schematic diagram of cold rolling, heat treatment, and sample observation in aluminum plate with the six routes; the details of material production and further processing are mentioned in the next section.
The initial materials of hot-rolled, high-purity aluminum plates were prepared by three-layered liquid electrolysis, which were obtained by the following processes: (1) the 7.6 mm thick aluminum plate was cold-rolled to 0.15 mm thickness with a 98% deformation degree; (2) then, the 0.15 mm sheet was annealed at 175~240 °C for 2 h (interannealing for first time); (3) the treated samples immediately were deformed to 0.11 mm thickness of aluminum foil by cold rolling for second time; (4) then, the samples were annealed at 180, 200, 240 °C for 3 h, respectively (interannealing for second time); (5) the samples were annealed at 500 °C for 1 h followed by rapid water cooling; (6) finally, the finished product of aluminum foil was observed using the methods of OM, XRD, EBSD, and TEM.
The initial aluminum plates were subjected multi-pass cold rolling deformation, such as 27% and 98% (as shown in Figure 1); then, the samples were first cut into 10 mm × 5 mm × 0.11 mm; the cross-sectional surfaces of RD/ND or RD/TD were mechanical polished and observed by optical microscope (OM), X-ray diffraction (XRD), and electron backscattered diffraction (EBSD).
The texture components were examined by X-ray diffraction (XRD, Shimadzu, Shimane, Japan) using Cu-Kα radiation (λ = 1.5406 Å) operated at 35 kV and 40 mA on planes parallel to the aluminum rolling surface. The microstructures of the as-received aluminum plate and its foil were characterized by backscattered electron (BSE) imaging and electron backscattered diffraction (EBSD) with a Zeiss (Oberkochen, Germany) Supra 55 scanning electron microscope (SEM). Specimens of detected areas were 300 µm × 500 µm, and the step size was set as 0.5 µm, the EBSD mapping was prepared by mechanical polishing down to colloidal Al2O3, and samples for BSE observation were slightly etched by Keller reagent (consisting of 2 mL HF, 3 mL HCl, 5 mL HNO3, and 190 mL H2O) after mechanical polishing.

3. Results and Discussion

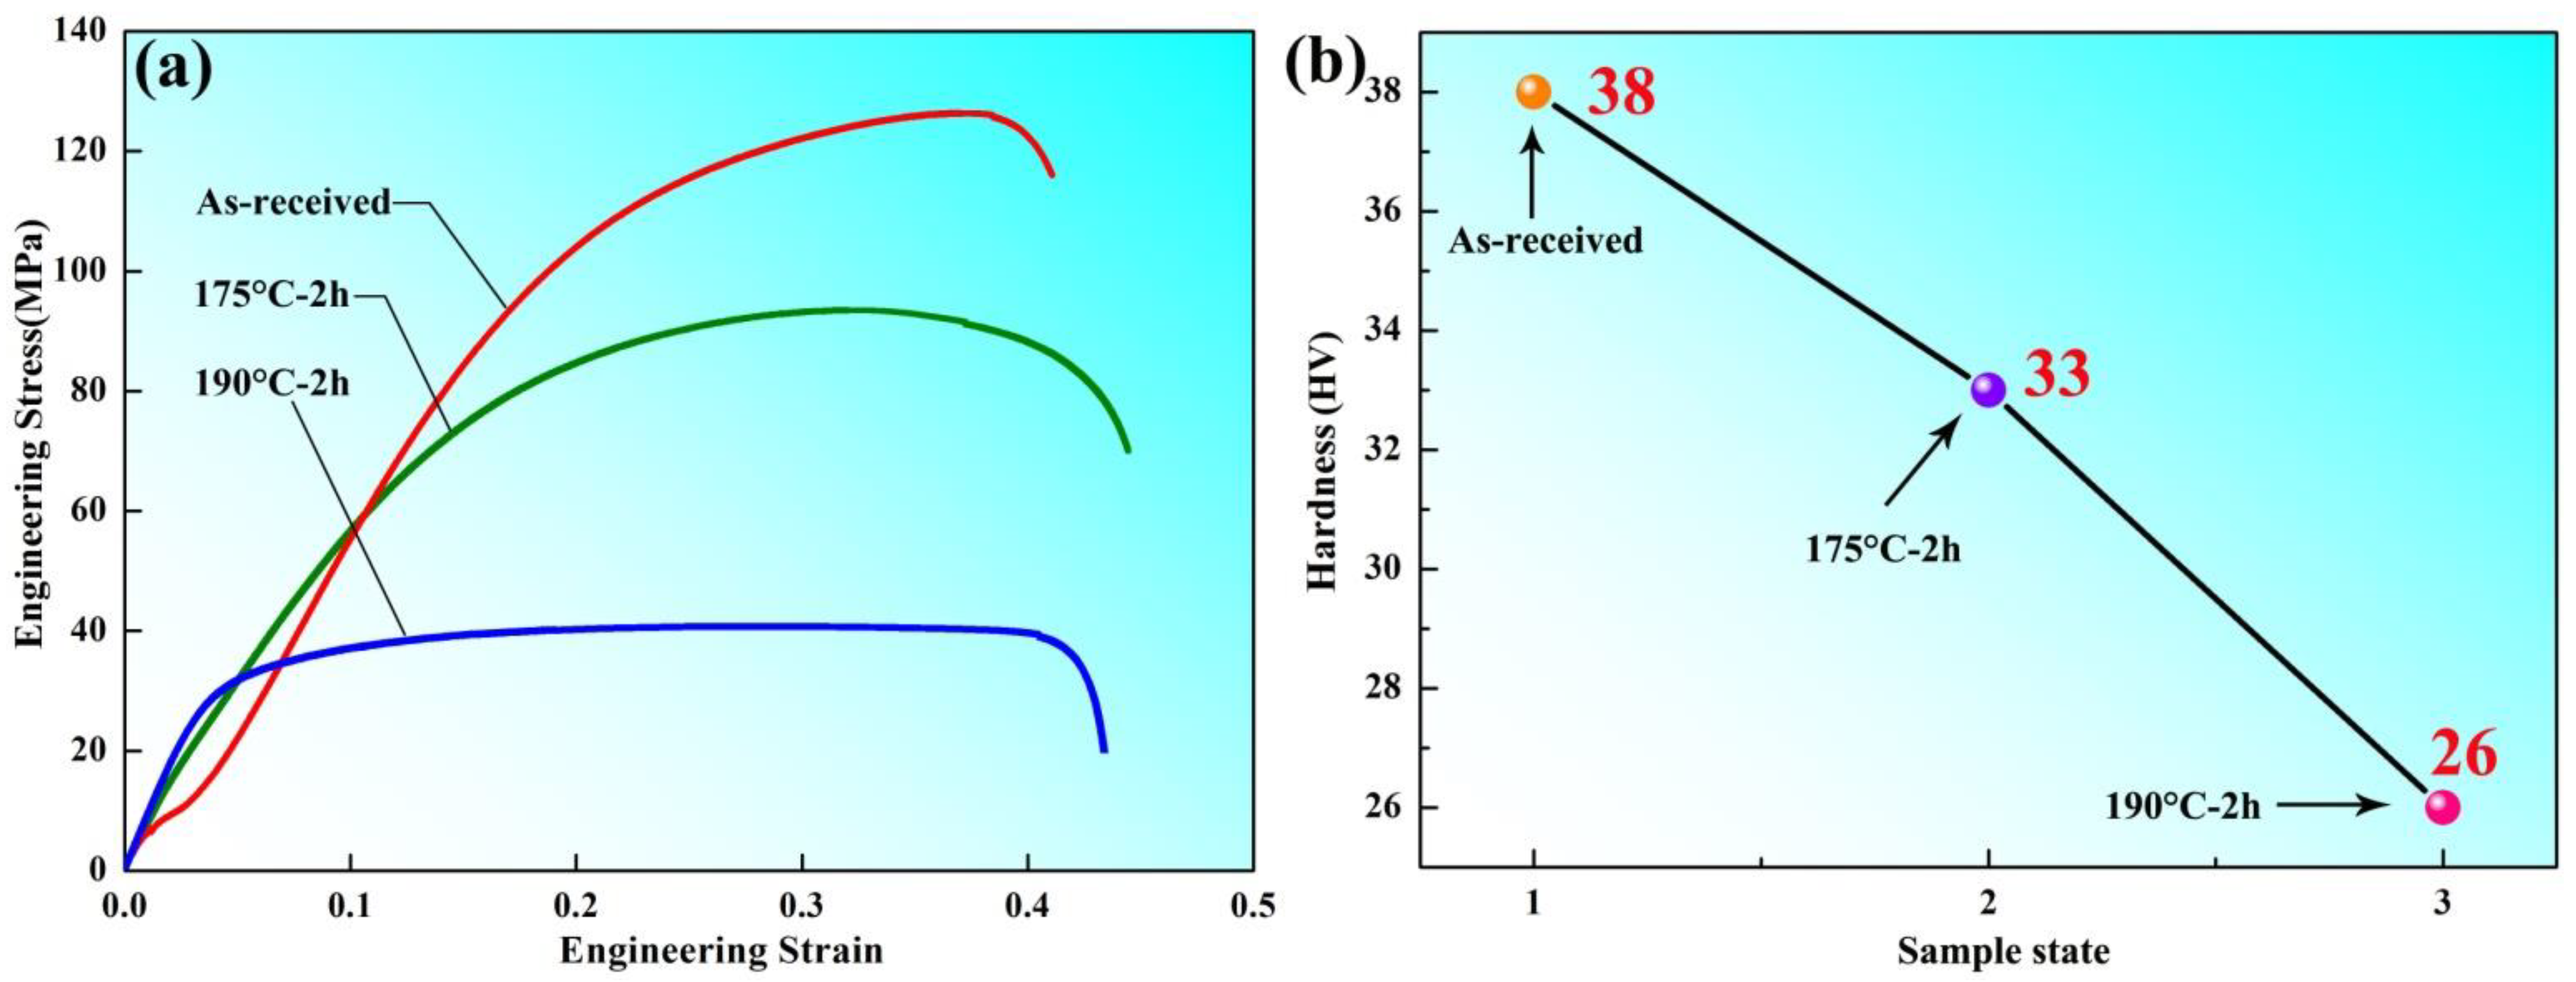
3.1. Mechanical Properties

Figure 2 shows the mechanics performance testing with different samples states, which exhibited the stress–strain analysis and Vickers hardness measurement values. It can be seen that the as-received aluminum plate has a higher hardness than the other annealed samples after cold rolling; the work-hardening and annealing-softening mechanisms [10,11] were found by previous researchers in the material science field and similar studies. The stress–strain curve indicated that the strength decreased with the increasing of annealing temperature, which suggested that the as-received aluminum plate without heat treatment had higher strength than the samples after annealing at 175 °C and 190 °C for 2 h.
Tensile tests were carried out by the electronic universal material testing machine (Shimadzu, Shimane, Japan); the prepared flat shape specimens were uniformly cut for testing standard shape at constant strain rates of 0.05 s−1, which is mainly to obtain the variation trend of stress–strain curves for different samples.
The maximum hardness of 38 HV of the as-received aluminum plate was observed to correspond to a microhardness increase of 33 HV and 26 HV for the samples annealed at 175 °C and 190 °C for 2 h, respectively (as shown in Figure 2b). Combined with Figure 2, through analysis and calculation, we know that the yield stress (YS) and ultimate tensile strength (UTS) were 88 MPa and 132 MPa, respectively.

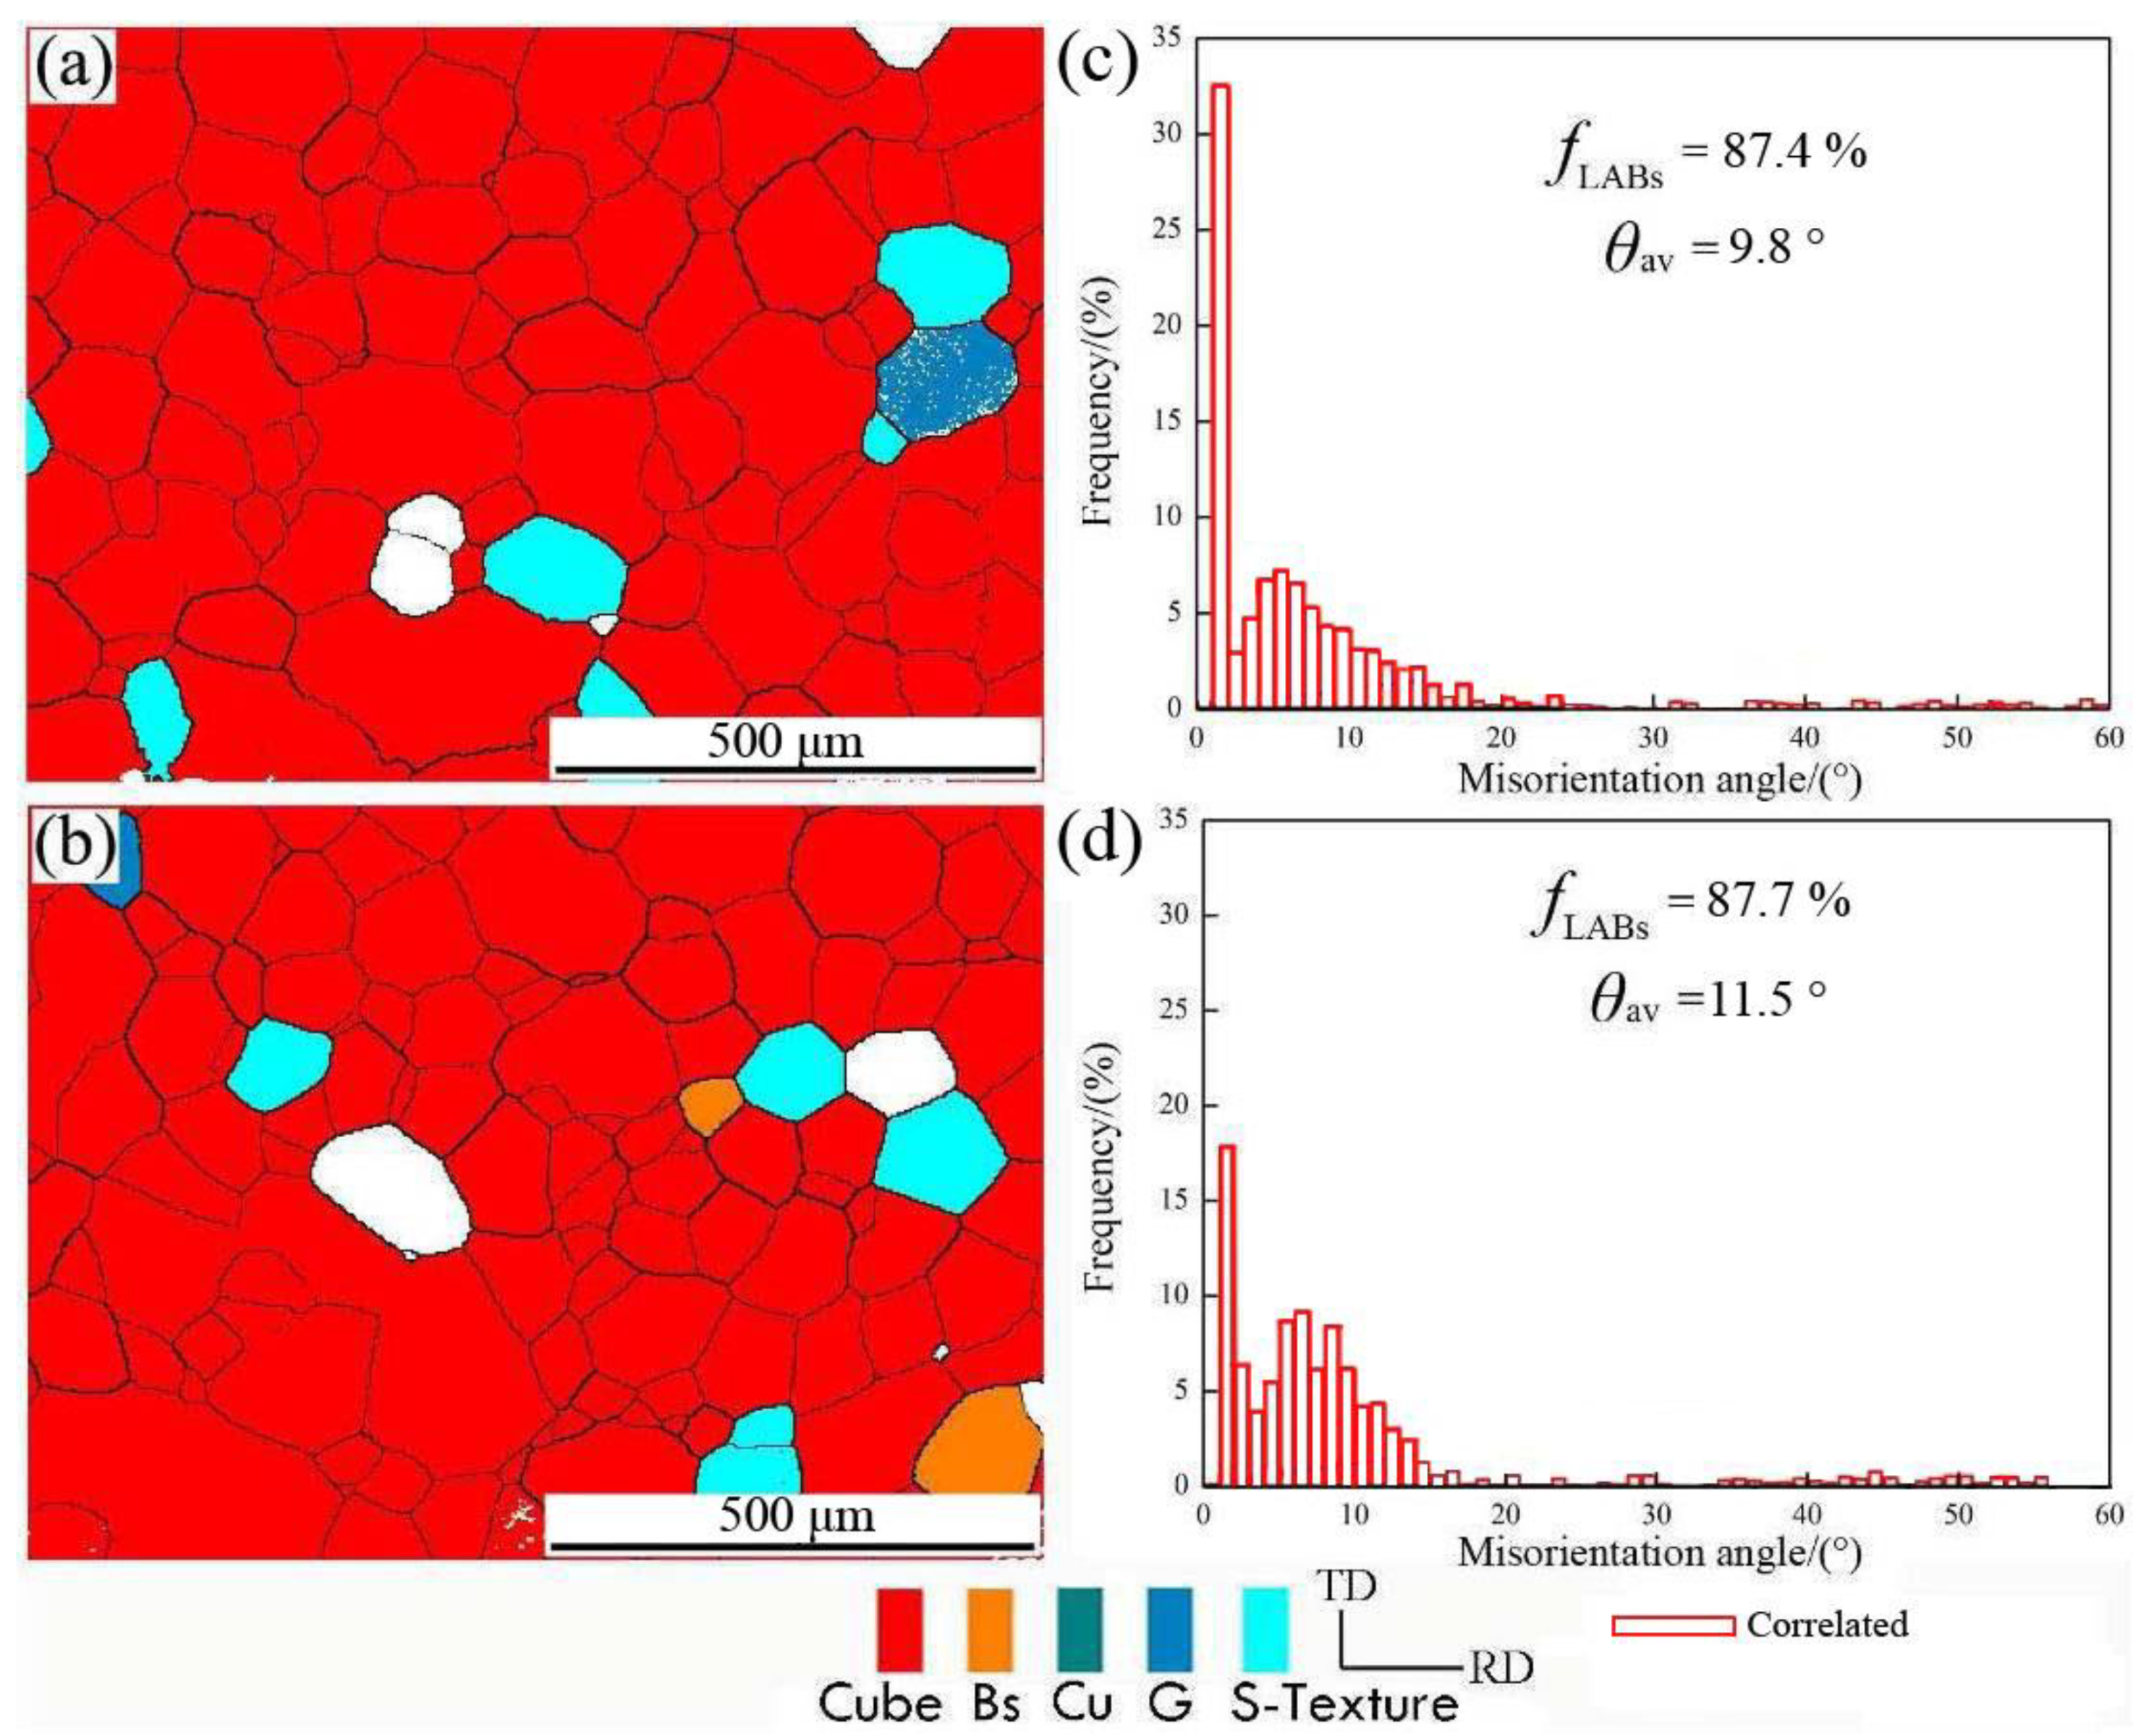
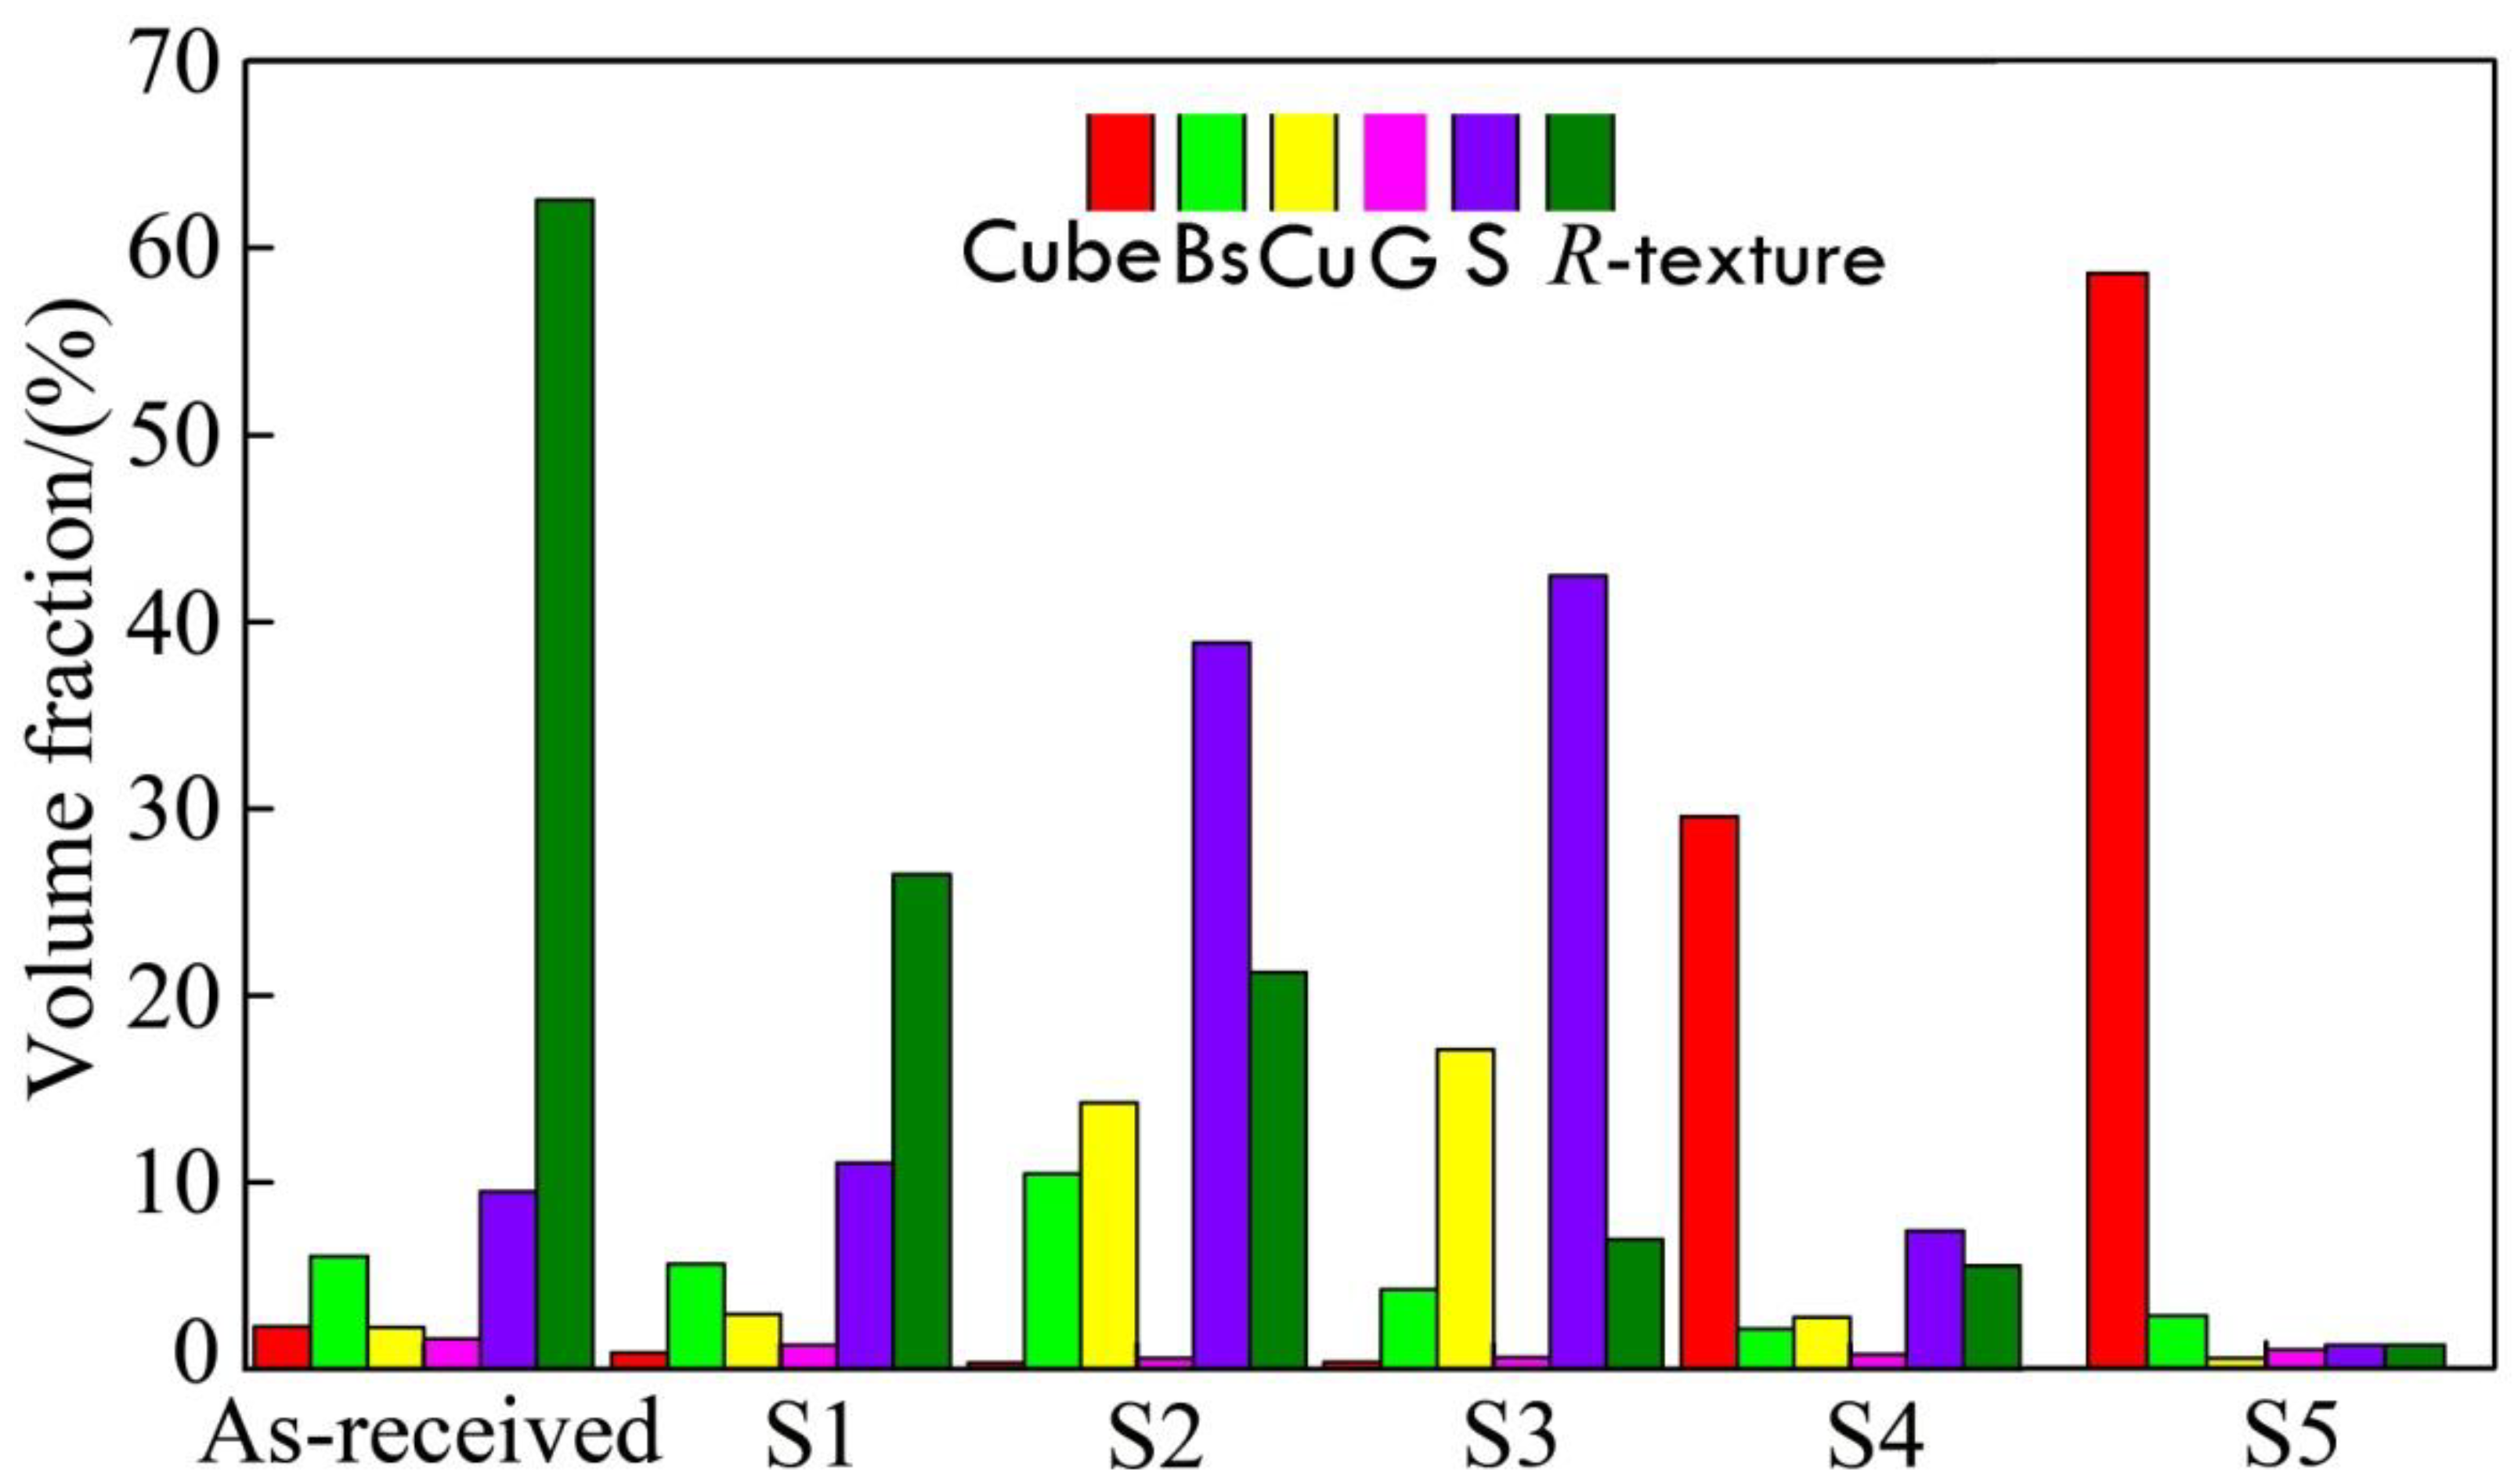
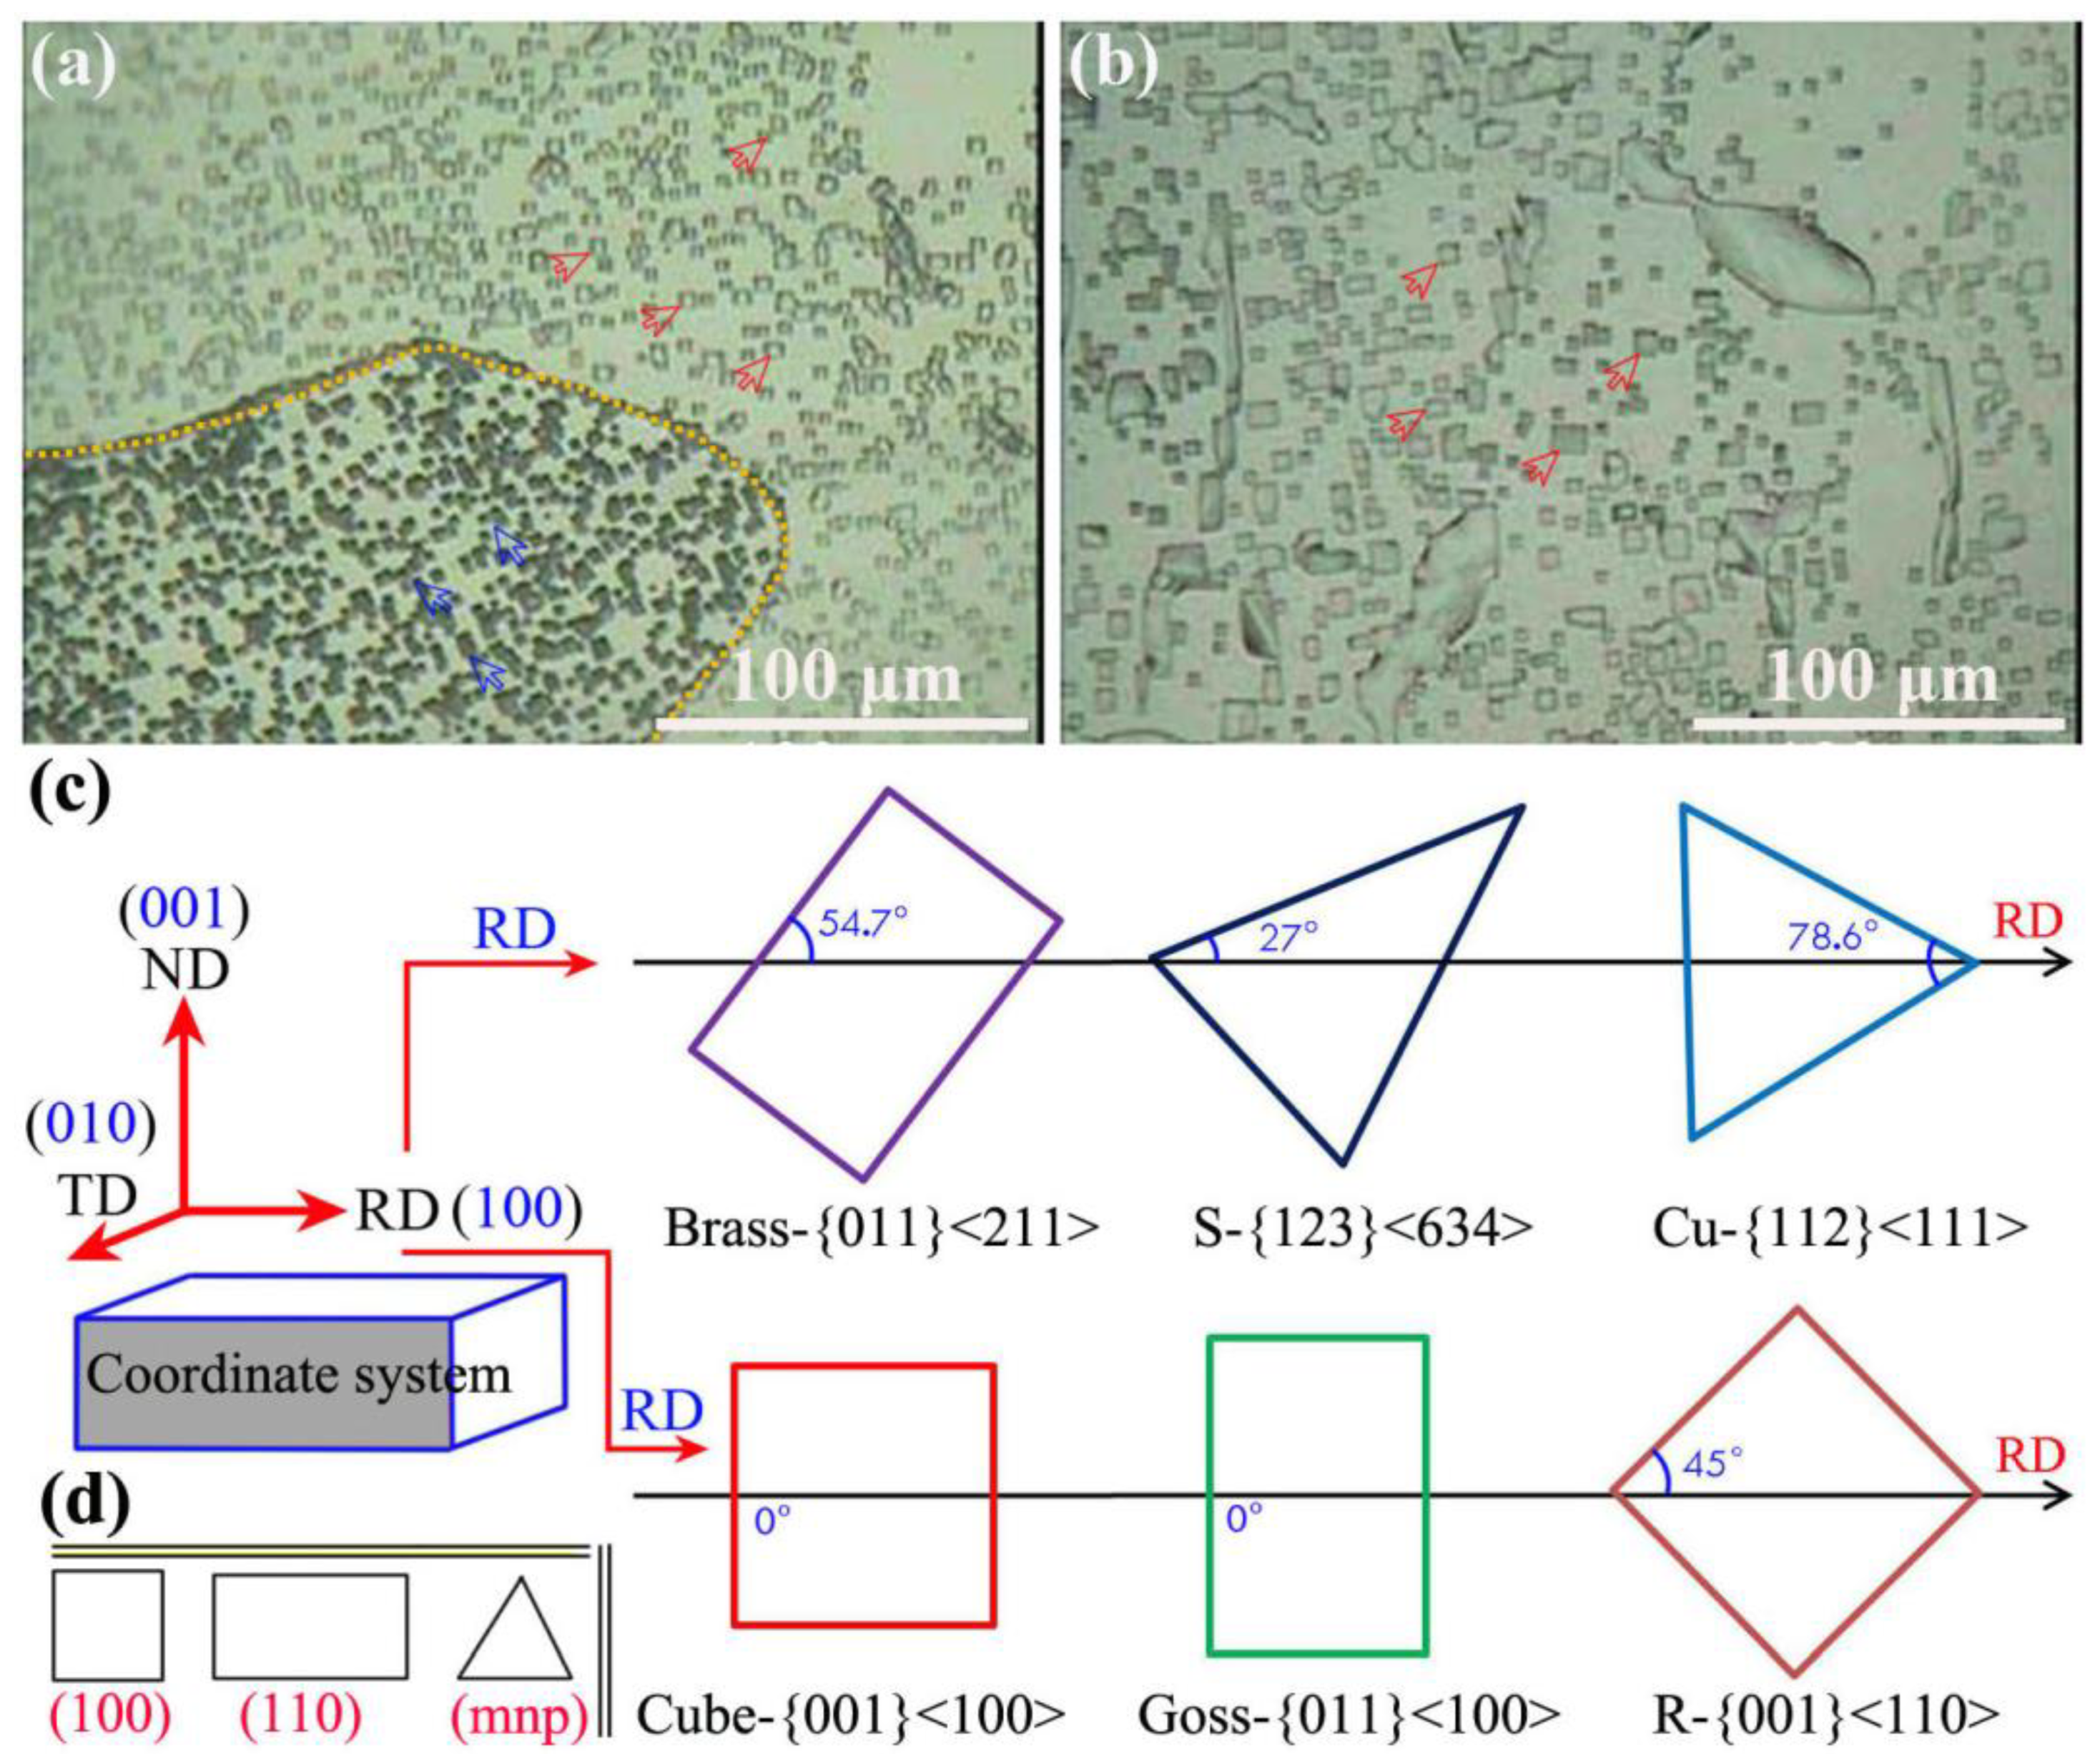
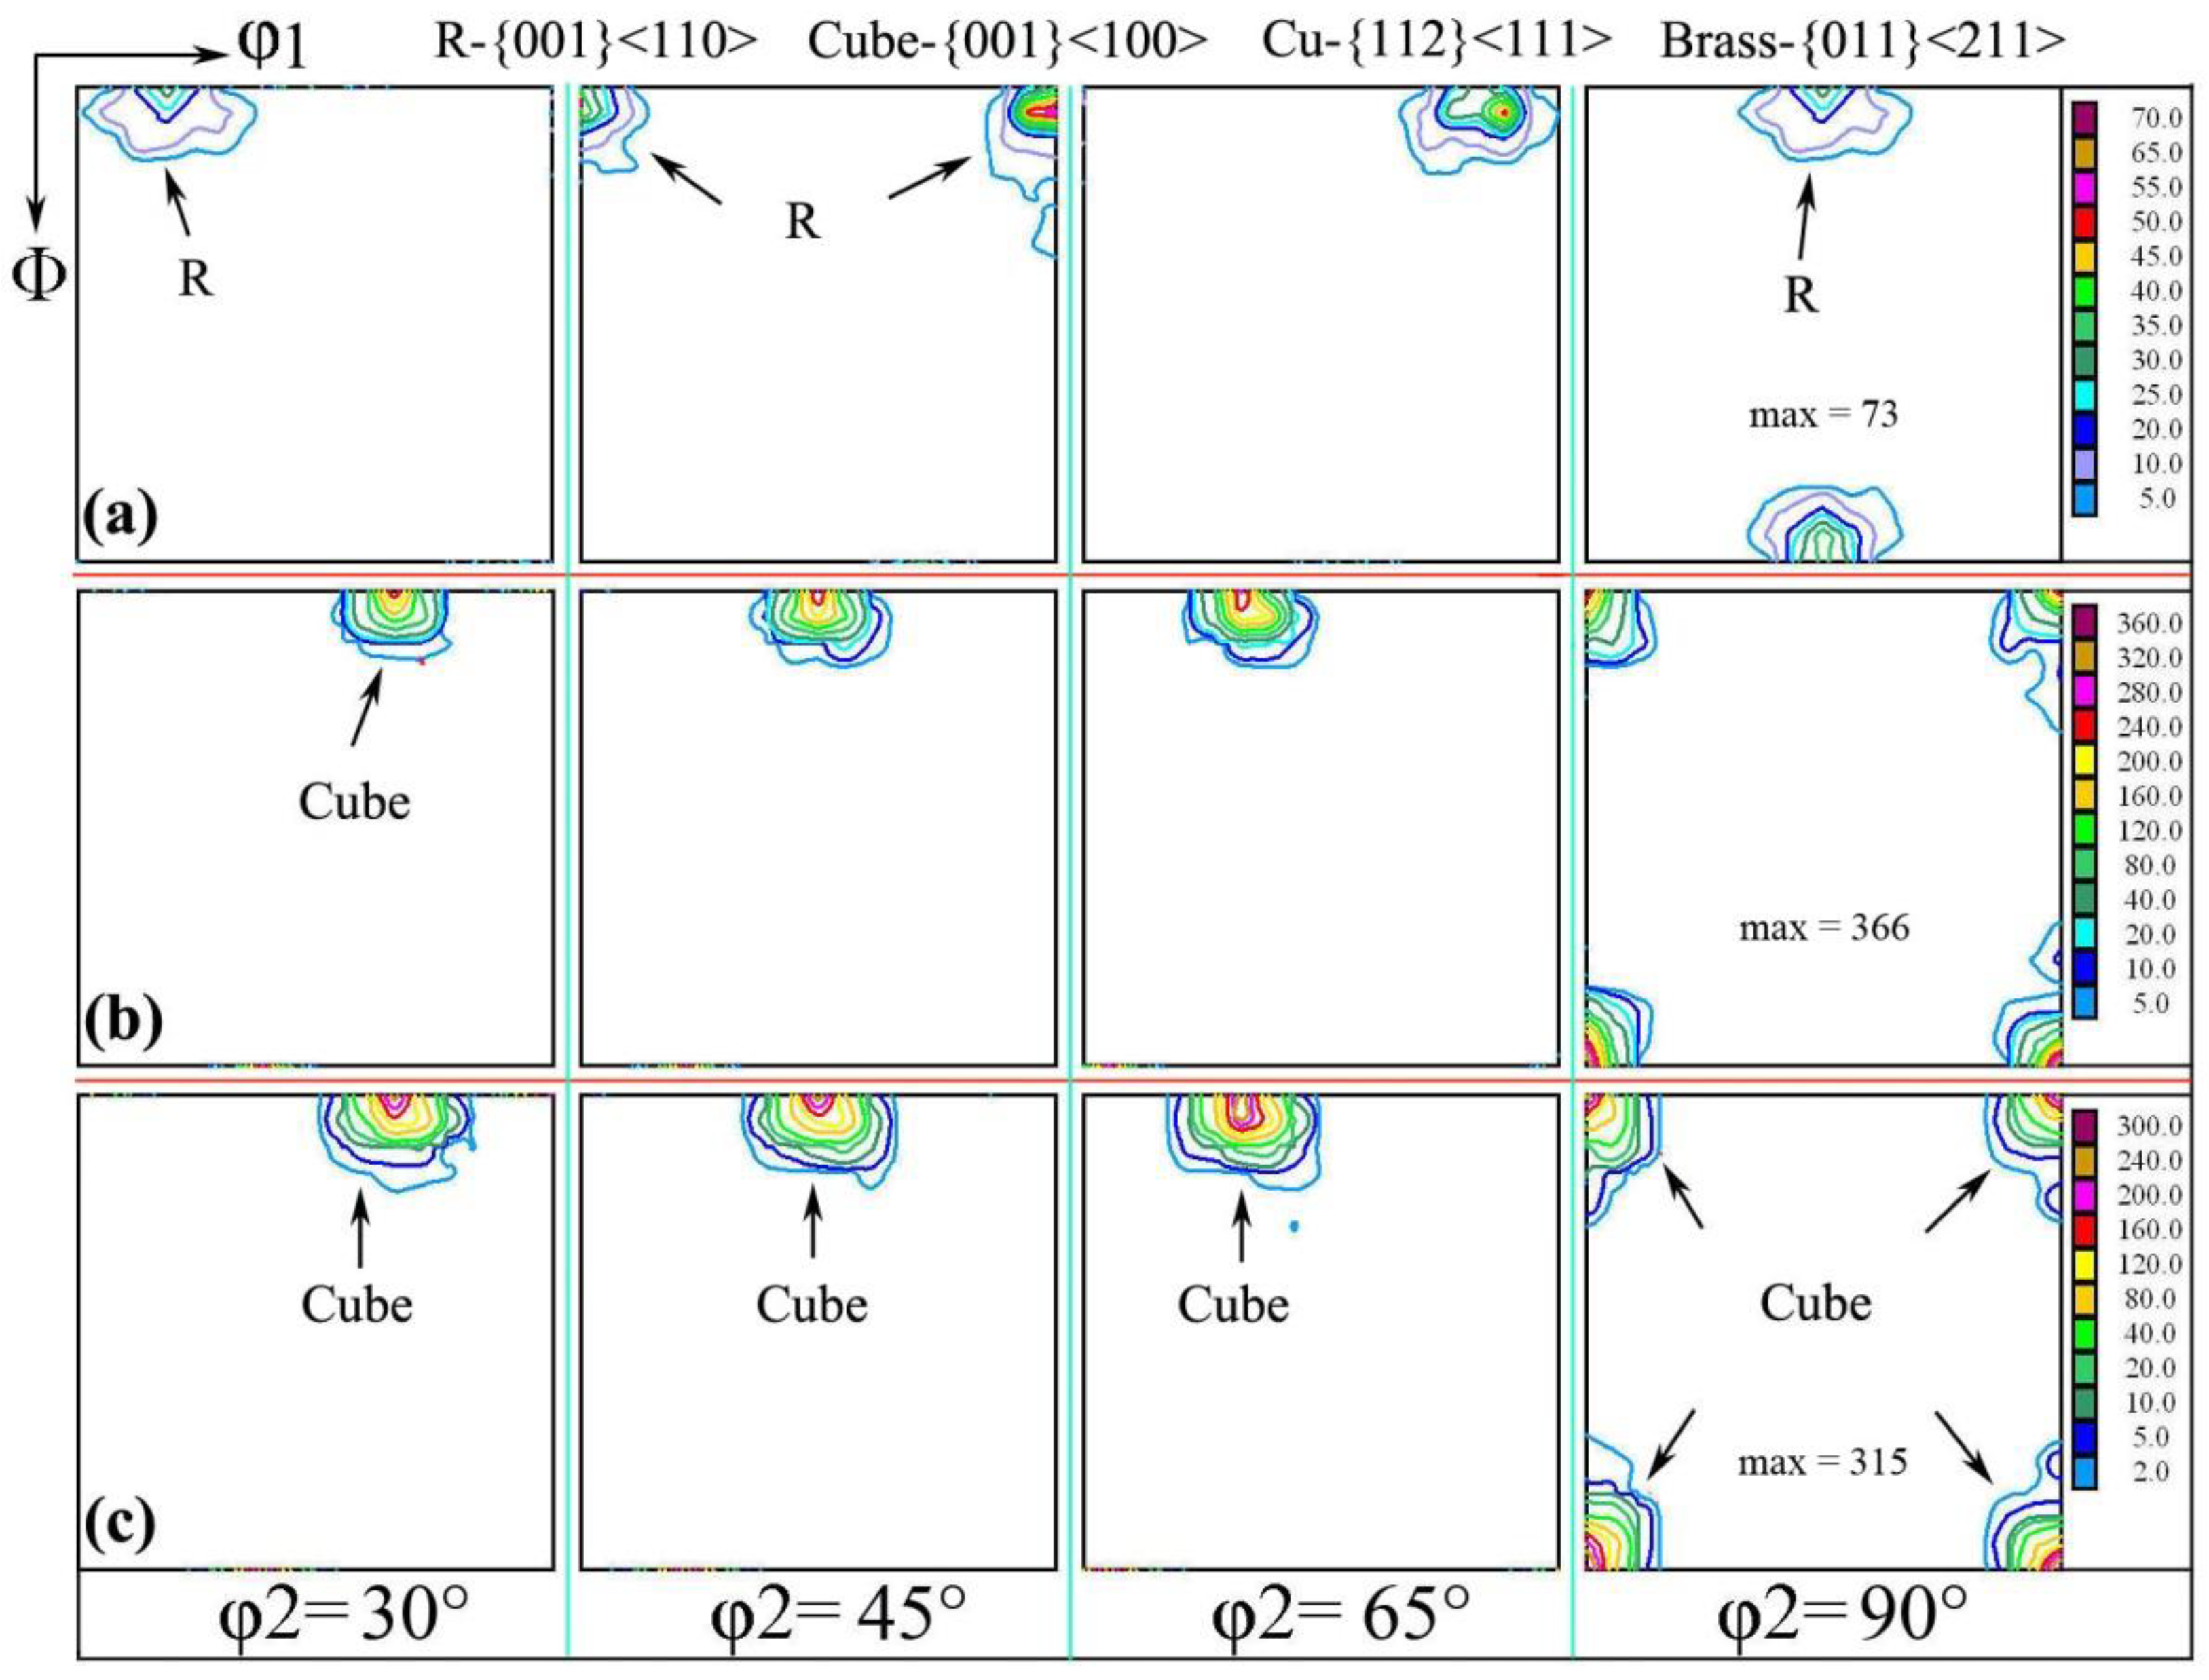
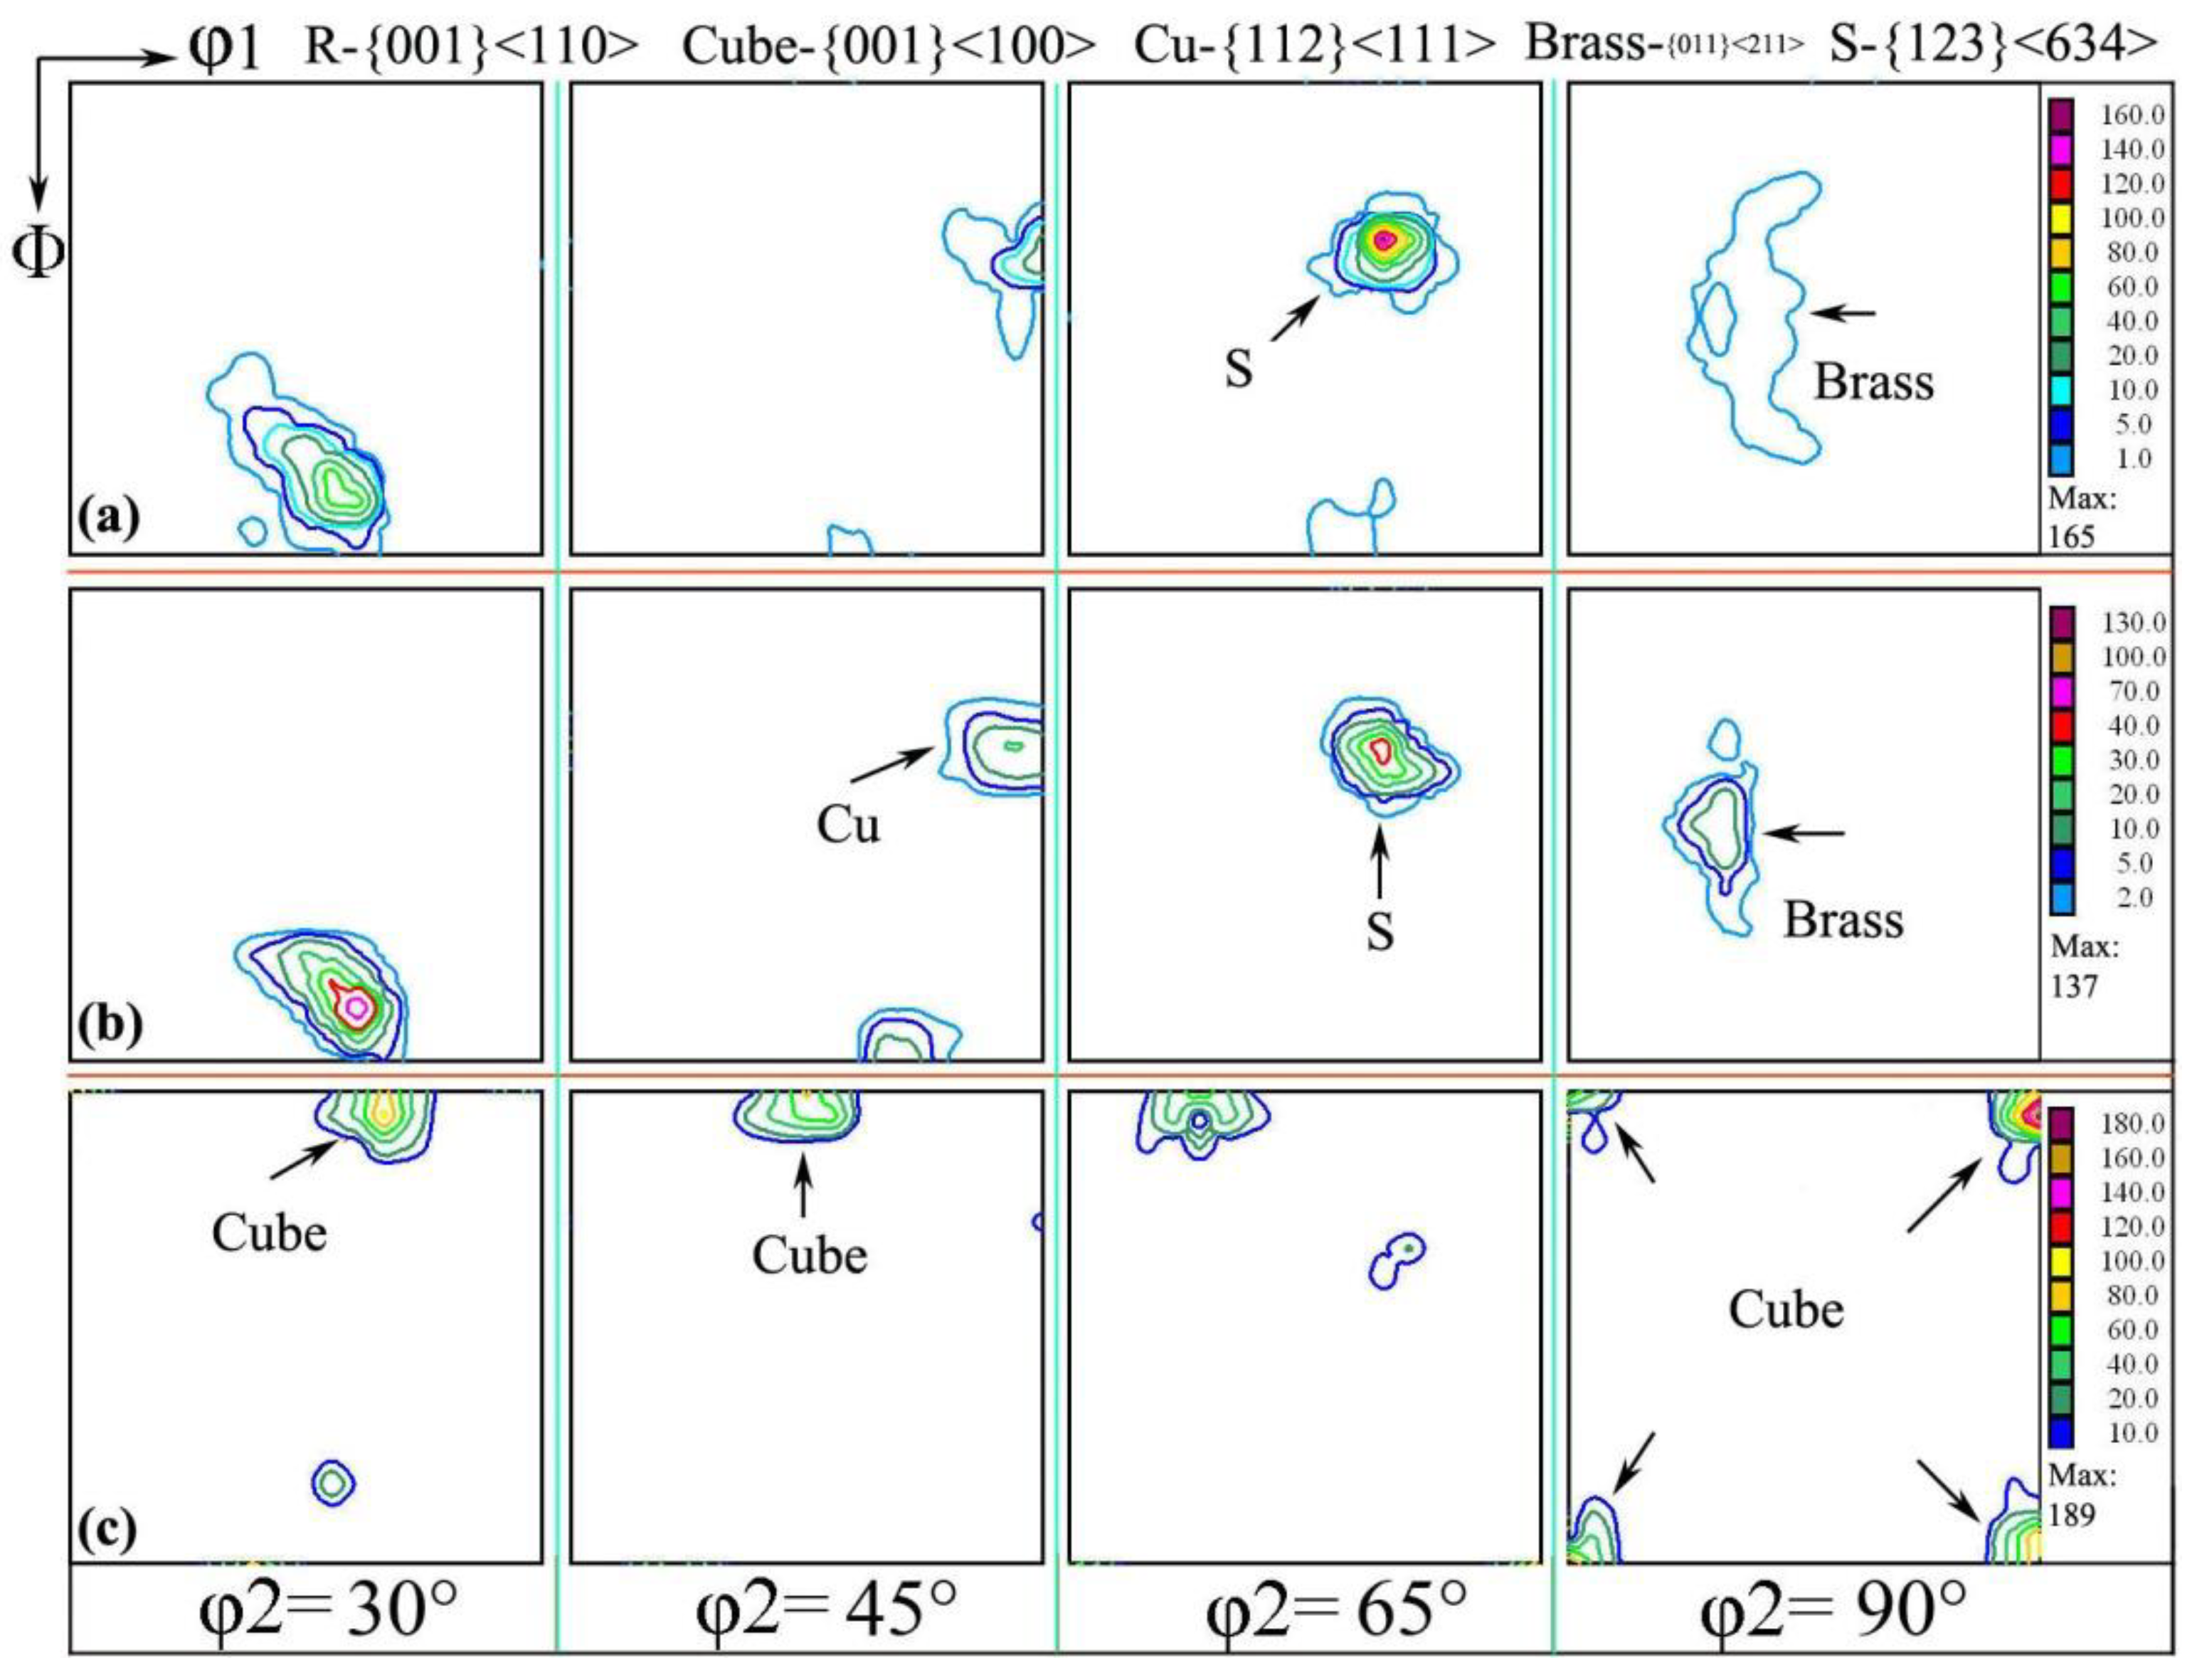
3.2. Texture Characteristics

The macroscopic texture of the RD/TD surface was measured by the method of XRD, which is called the orientation distribution function (ODF), as shown in Figure 3. The interface φ2 = 30~90° was selected for analysis in research samples, as shown in Figure 3a; there were mainly rotating cubic textures of R-{001}<110>. When the sample was cold-rolled to 0.11 mm, and the annealing was carried out at 500 °C for 1 h, the {001}<110> texture gradually was weakened and disappeared, while the {001}<100> cube texture component gradually increased (as shown in Figure 3c). This partly reflects that {001}<100> texture is formed from {001}<110> and disappeared or was even transformed to another texture annexation.
The texture transformation is actually quite complicated; texture transformation and evolution law have been analyzed in Refs. [21,22,23,24,25,26]; in some fields, the researchers concluded that the transformation from one or some texture to another texture is often accompanied by the decomposition of the initial texture or is even swallowed up, which results in the enhancement of other textures. For example, the grain orientation in cold-rolled aluminum sheet will change from a cube orientation, which was through the {110}<001> texture turning around the {110}<112> texture; the change of texture orientation is helpful to explore the mechanism of plastic deformation during cold rolling and annealing.
The texture strength of interannealing at 180 °C for 3 h was obviously higher than that of interannealing at 200 °C for 3 h; the maximum value of the former was 366, and the maximum value of the latter was 315. It can be seen that high-temperature interannealing has a certain weakening effect on the texture strength [24], which is caused by the annealing softening after the complete recrystallization in aluminum foil.
After the first cold-rolling process, the rolling texture was formed, but the preferred orientation was not obvious, which caused the texture to change after annealing at 500 °C. When the sample was cold-rolled to 0.15 mm thickness again, the Cu and Brass textures were obtained, which was due to texture inheritance and the memory effect [27,28]. After annealing at 200 °C for 3 h, the S texture component in aluminum foil was similar to the {124}<211> texture; this {124}<211> texture was subsequently strengthened, while the brass texture was gradually weakened to the point of decomposition and transformation into a cubic texture. When annealing at 500 °C for 1 h, aluminum foil was mainly {001}<100> (cubic texture); the cubic component was dominant in aluminum foil, and the maximum strength was 189, which is consistent with the micro-area texture, as shown in Figure 4b.

3.3. Microstructure and Misorientation Angle Distribution

In order to further study the change of microstructure and misorientation angle distribution after final annealing, the samples were subjected to different interannealing and a second cold-rolling process. The 0.11 mm thick aluminum foil was annealed at 500 °C for 1 h; then, the texture reconstruction of the EBSD map and the corresponding misorientation angle distribution were analyzed, as shown in Figure 5.
It can be seen from Figure 5a, in red color, that the cubic-orientation grain occupied almost the entire organizational space, and the corresponding misorientation angle was mainly a low angle, which accounts for 87.4%. Because the cubic grains with the same orientation were in contact with each other, the misorientation angle between adjacent grains must be a low-angle grain boundary (LAGB) [17]. In accordance with the calculated average misorientation angle of 9.8°, there were a few Goss and S textures besides cubic textures. In Figure 5b, the proportion of low-angle misorientation was 87.7% and the average misorientation angle was 11.5°, which is not much different from the result in Figure 5a.
The high interannealing temperature did not increase the proportion of high-angle grain boundaries (HAGB); while the cubic texture content did not increase substantially, the average grain size is ~120 μm, the cubic texture was dominant in aluminum foil, and it included a small amount of brass and S texture [12,15]. It can be found that interannealing greatly increased the content of cubic texture after annealing because interannealing helps to increase the nucleation core of cubic texture, and the content of cubic texture increased after the finished product’s annealing.
The microstructure of aluminum foil after different interannealing and finished products annealing was analyzed. Figure 6 shows the microtextured image of aluminum foil in different annealing processes. There was a significant difference in the microtexture between the samples annealed at 200 °C for 3 h (Figure 6a) and 240 °C for 3 h (Figure 6b), due to the high interannealing temperature, which promoted the content increase of Cu texture and brass texture, while the S texture decreased. The cubic texture was dominant after annealing at 500 °C for 1 h (as shown in Figure 6c,d).

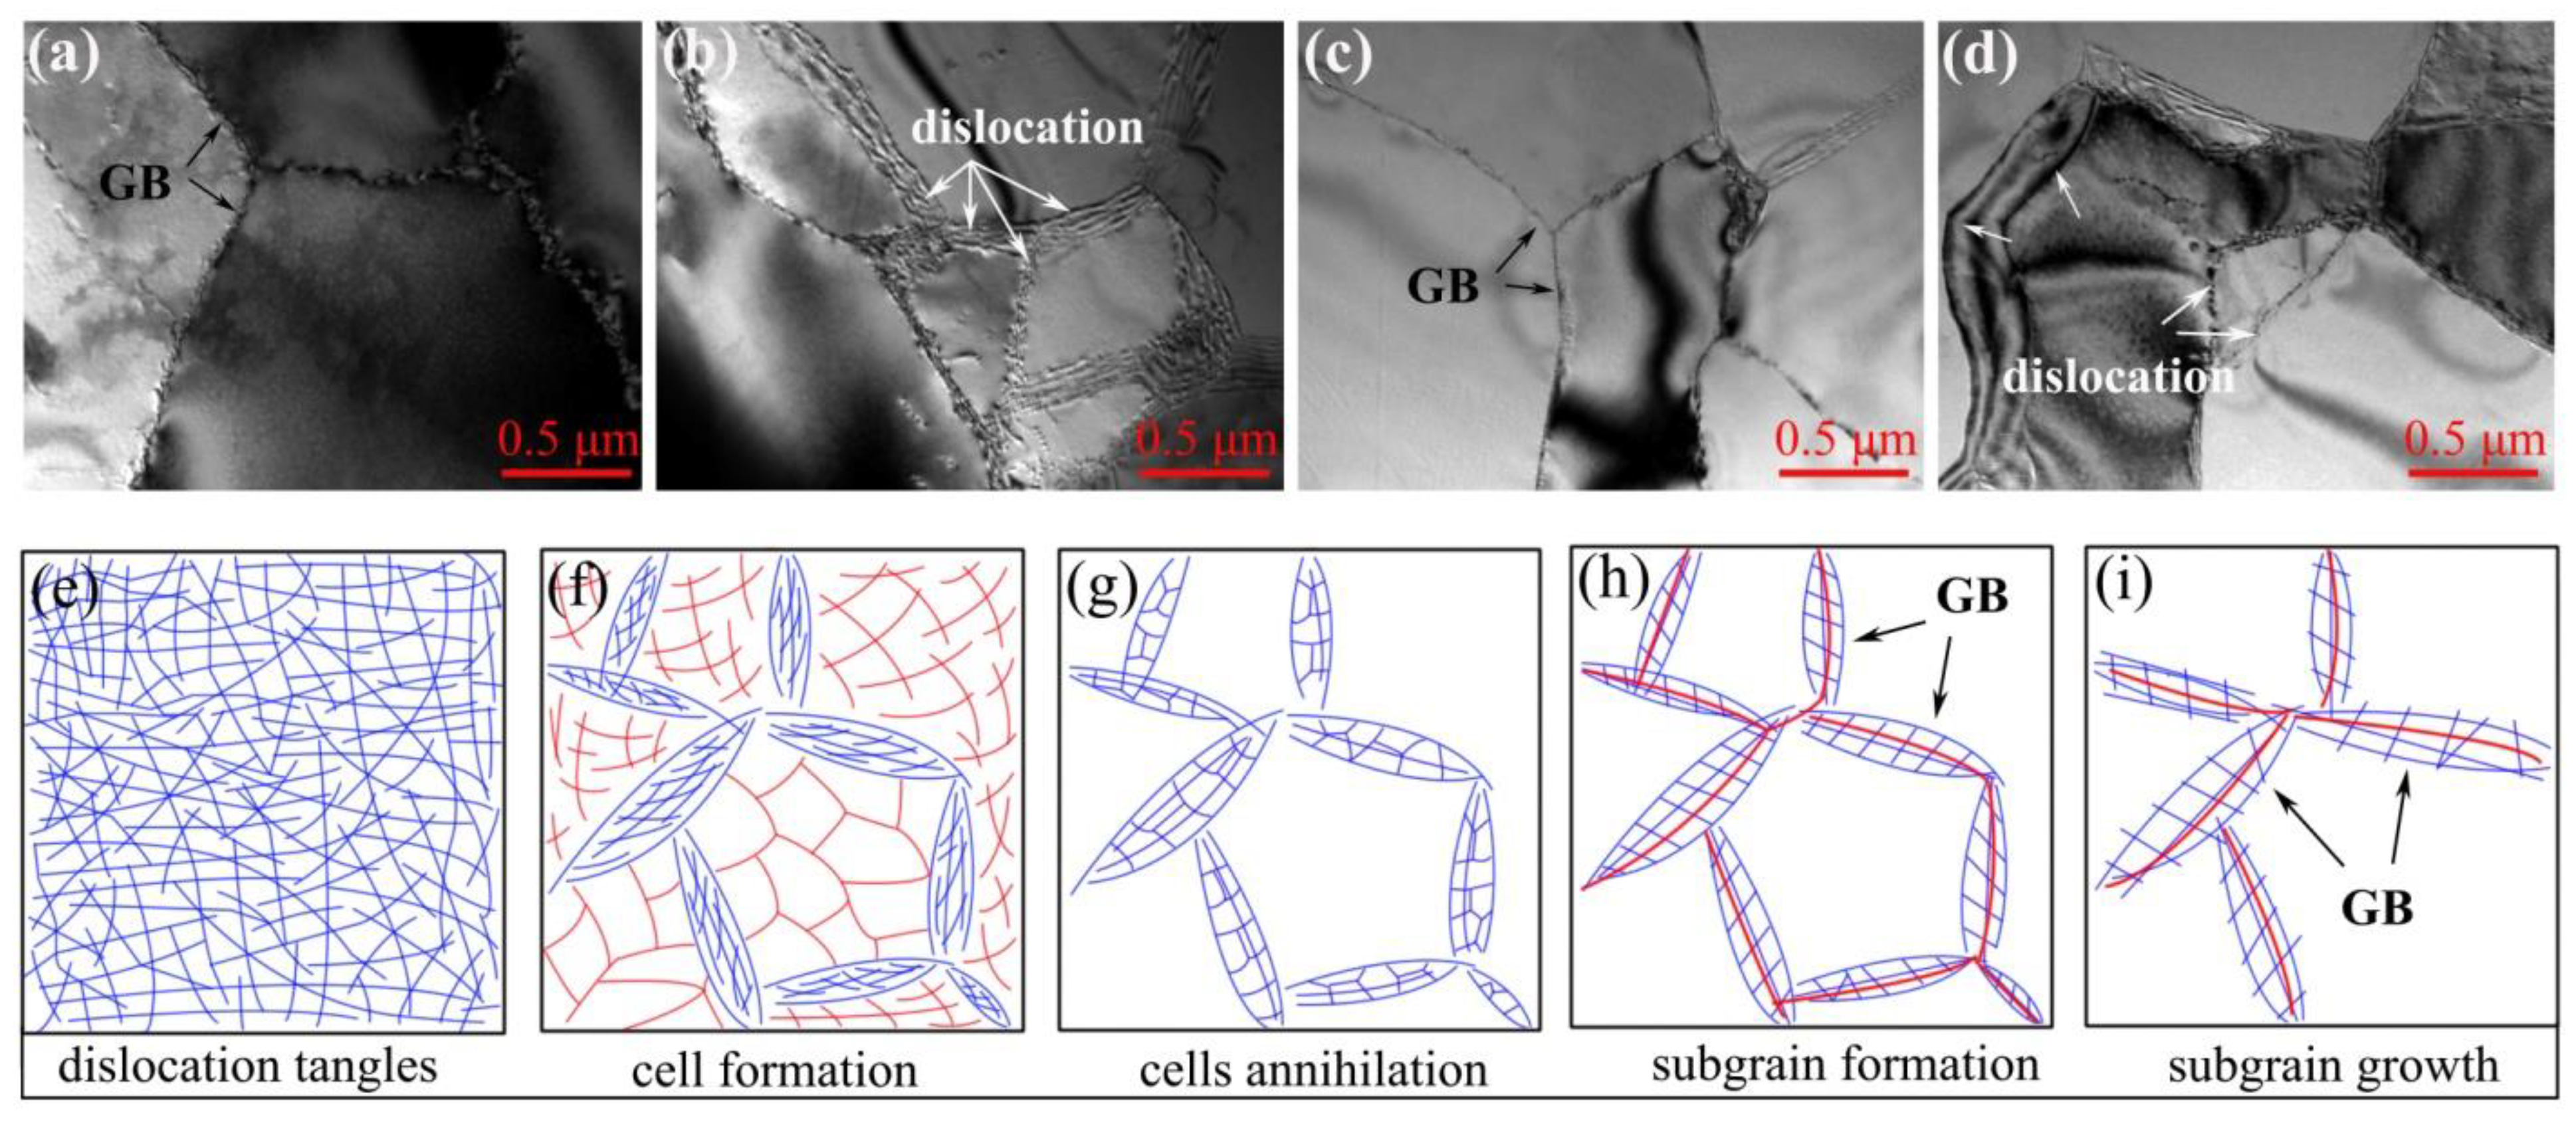
3.4. Dislocation Analysis

In the cold-rolled deformation and annealing process of metal materials, the characterization of dislocation configuration is the key to studying the release of deformation stored energy and the formation of substructures during the recovery process. The line defect of metal materials after large cold-rolled deformation was mainly dislocation plug and entanglement [21]; after annealing, the dislocation entanglement was relieved, and the dislocation density decreased, which is due to the effect of the recovery process. Dislocation rearrangement promoted the formation of cellular structures, and then the dislocations were rearranged; the intracellular dislocations were gradually annihilated as the recovery process went on; however, there was still a fault in the cell wall, which promoted the subgrain formation [24].
Figure 7a–d shows the TEM micrographs of RD/TD surfaces in different regions of aluminum foil annealed at 200 °C for 3 h. It can be seen from Figure 7 that the dislocation arrangement near the grain boundary was regular, which included a high dislocation density, clear interface, and uniform stripe distribution (position indicated by the white arrow). The microstructure analysis is consistent with Figure 6a in the previous observation, and the dislocation in the grain basically disappeared. This shows that the grain boundary at this time was mainly a low-angle grain boundary, and it is also in the stage of subgrain formation, as shown in Figure 7h.
It can be seen from Figure 7c,d that the dislocation density at the grain boundary (position indicated by the black arrow) was significantly lower than in Figure 7a,b; the intragrain dislocation was annihilated, while the grain boundary was clearer. According to the display of microstructure in Figure 6b, it can be seen that the annealing temperature increased to 240 °C and the sample recovery degree was more sufficient; therefore, the dislocation disappeared, subgrains formed, and growth was promoted. At the same time, Figure 7i indicated that the sample should be in the stage of subgrain growth.
Messerschmidt et al. [29] argued that dislocations occurring and moving in the form of crystal defects during plastic deformation, and some related activities of dislocations were analyzed. In their situ strain experiment, dislocation migration was caused by load and other pressure, which resulted in grain torsion and breakage; in essence, the microscopic deformation mechanism and recrystallization behaviors were mainly accompanied by dislocation evolution and migration. In this paper, the high-purity aluminum foil was cold-rolled to 0.15 mm thickness and annealed at 200 °C and 240 °C for 3 h; then, it released the deformation storage energy, and there was a change of dislocation structure. As the annealing process proceeded with time, the dislocation tangles were released; then, the dislocation density decreased, and the subgrains’ formation and growth were promoted by driving force from deformation storage energy. In short, the release of deformation energy storage and the change of dislocation were caused by the static recovery of aluminum foil during annealing.

3.5. Recrystallization Behaviors

The grain size, misorientation angle, and volume fraction of the recrystallization process are helpful to analyze the evolutionary history of microstructure and texture, which is actually responsible for the formation of the recrystallization texture and cold-rolling texture. As we know, the high cold rolling deformation degree can promote recrystallization [21,26] and shorten the recrystallization time.
In fact, recrystallization annealing is the key procedure in the production of aluminum foil. The temperature, annealing time, heating atmosphere, and heating speed strongly affect the microstructure of the foil, e.g., the cube texture percentage, surface quality, and grain sizes, which play an important role in improving the practical surface area after corrosion and oxygenation. For application in high-voltage capacitors, a higher percentage of cube texture and a suitable grain sizes distribution are desirable.
The quantitative data were collected and shown in Figure 8, which lists the mean values of texture volume fraction in five routes; the sample was subjected to steps 1 to 5, where S1~S5 represents the five steps corresponding to Figure 1, which suggested recrystallization behaviors during the cold rolling and annealing processes. It was found that there was a random texture in the as-received sample. Finally, the cubic texture of {001}<100> is the dominant texture.

3.6. Corrosion Pit Observation

In the annealing process, two kinds of annealing methods were designed in the experiment, slow annealing (SA) and fast annealing (FA), as mentioned in previous research work [30]. The details of SA are that the samples were heated from room temperature to the target temperature with a low heating rate (approximately 180 °C/h) and kept for 1 h; in FA, the samples were kept at the target temperature for 30 s, 1 h, 2 h, etc.
To further quantitatively characterize the changing trend of dislocation density, the low-power metallographic method was used to measure the corrosion pit density of finished aluminum foil after interannealing; thus, the variation of dislocation density can be indirectly reflected, as shown in Figure 9, which shows that the fast annealing of finished aluminum foil was interannealing at 200 °C for 3 h (Figure 9a), while the slow annealing of finished aluminum foil was interannealing at 200 °C for 3 h (Figure 9b); the common texture types (including brass, goss, copper, S, R, and cube texture) in aluminum alloys is shown in Figure 9c, and three typical etched images were (100), (110), and (mnp) in aluminum alloys (Figure 9d); therefore, dislocation densities were clearly observed and contrasted with each other.
The dislocation densities were clearly observed and contrasted with each other, which is mentioned and described in the local dislocation changes the two selected samples in the paper, and at the same time, the macroscopic corrosion pit was used to display the corrosion shape of the sample surface, such as square, rectangle, triangle, etc. Therefore, (mnp) means a triangular etched shape, combined with Figure 9, including the brass texture and Cu texture, which can refer to the orientation of various textures in cold-rolling and annealing processes.
The corrosion pits with different shapes essentially reflected the different texture types and dislocation densities. After rapid annealing, the corrosion pits existed in squares (cube texture, red arrow) and squares at an angle in a rolling direction (R texture, blue arrow). Additionally, the corrosion pits’ state density was calculated from 101.2 × 100/cm2 in Figure 9a; the distribution of corrosion pits was not uniform, which implied that the distribution of dislocations was also uneven. While the corrosion pits density was 60.5 × 100/cm2 after slow annealing, as shown in Figure 9b, the distribution of corrosion pits was relatively uniform, the dislocation density was relatively moderate, and it was dominated by square corrosion pits. Thus, the distribution of dislocation density is reflected after fast and slow annealing in aluminum foil.
In conclusion, the dislocations of aluminum foil after interannealing and slow annealing were evenly distributed in their space; the density was moderate and obvious and observed by electron microscope, which can provide a theoretical basis for the analysis and discussion in the dislocation development of aluminum foil during cold-rolling and annealing processes.

4. Conclusions

  • The cubic orientation texture can be enhanced by a low interannealing temperature after finished products’ annealing. Finally, it obtained a high volume fraction of cubic texture content.
  • In the annealing process of aluminum foil, the cubic orientation texture nucleates first by the advantage of interannealing, and then it grows into a true cubic grain quickly, while the non-cubic orientation texture was difficult to nucleate.
  • The formation of Cube-{001}<100> texture after annealing was promoted by the cold-rolled texture of Cu-{112}<111> and S-{123}<634> texture, which mainly depended on the decomposition of Cu and S textures, and their gradual transformation from being swallowed into the cubic texture.

Author Contributions

Y.W.: writing the original manuscript, carrying out the experiment, formal analysis, and obtaining the project funding. L.R. and Y.C.: assisting in revising the manuscript and editing. F.Y.: performing the XRD and EBSD characterization. Q.L. and G.H.: carrying out software employment and calculation. All authors have read and agreed to the published version of the manuscript.

Funding

This research was funded by the High-level Talent Introduction Program at the Chongqing University of Arts and Sciences (2017RCH01), the Science and Technology Research Program of Chongqing Municipal Education Commission (KJQN202001301), and the Industry–University-Research Cooperation Program (WLHX-2020-0048, WLHX-2021-0075).

Institutional Review Board Statement

Not applicable.

Informed Consent Statement

Not applicable.

Data Availability Statement

Not applicable.

Conflicts of Interest

The authors declare no conflict of interest.

References

  1. Gera, D.; Fu, B.; Suhuddin, U.F.H.R.; Plaine, A.; Alcantara, N.; Santos, J.F.D.; Klusemann, B. Microstructure, mechanical and functional properties of refill friction stir spot welds on multilayered aluminum foils for battery application. J. Mater. Sci. Technol. 2021, 13, 2272–2286. [Google Scholar] [CrossRef]
  2. Xu, S.A.; Wang, S.N.; Gu, Y.Y. Microstructure and adhesion properties of cerium conversion coating modified with silane coupling agent on the aluminum foil for lithium ion battery. Results Phys. 2019, 13, 102262. [Google Scholar] [CrossRef]
  3. Abdelrahman, A.A.; Sayed, M.A.; Menoufy, M.F.; Rabie, A.M. Fabrication of CoNiMo/γ-Al2O3 from waste aluminum foil to convert waste lube oil to hydro treated oil. Egypt. J. Pet. 2021, 30, 21–28. [Google Scholar] [CrossRef]
  4. Engler, O.; Laptyeva, G.; Aretz, H.; Nitzsche, G. Crystal plasticity simulation of the evolution of the matt surface in pack rolling of aluminium foil. Mater. Sci. Forum 2014, 794–796, 553–558. [Google Scholar] [CrossRef]
  5. Engler, O.; Huh, M.Y. Evolution of the cube texture in high purity aluminum capacitor foils by continuous recrystallization and subsequent grain growth. Mater. Sci. Eng. A 1999, 271, 371–381. [Google Scholar] [CrossRef]
  6. Lederer, M.; Gröger, V.; Khatibi, G.; Weiss, B. Size dependency of mechanical properties of high purity aluminium foils. Mater. Sci. Eng. A 2010, 527, 590–599. [Google Scholar] [CrossRef]
  7. Xiao, R.G.; Yan, K.P.; Yan, J.X.; Wang, J.Z. Electrochemical etching model in aluminum foil for capacitor. Corros. Sci. 2008, 50, 1576–1583. [Google Scholar] [CrossRef]
  8. Rezaei Ashtiani, H.R.; Parsa, M.H.; Bisadi, H. Constitutive equations for elevated temperature flow behavior of commercial purity aluminum. Mater. Sci. Eng. A 2012, 545, 61–67. [Google Scholar] [CrossRef]
  9. Huang, X.; Tsuji, N.; Hansen, N.; Minamino, Y. Microstructural evolution during accumulative roll-bonding of commercial purity aluminum. Mater. Sci. Eng. A 2003, 304, 265–271. [Google Scholar] [CrossRef]
  10. Wang, Y.H.; Yang, J.; Wang, J.Z. (Ba0.5Sr0.5)TiO3 modification on etched aluminum foil for electrolytic capacitor. Ceram. Int. 2008, 34, 1285–1287. [Google Scholar] [CrossRef]
  11. Da, H.M.; Yong, M.W. Effects of rolling technical factors on microstructures and mechanical properties of aluminum foils. Trans. Nonferrous Met. Soc. China 2003, 13, 239–244. [Google Scholar]
  12. Miszczyk, M.; Paul, H.; Driver, J.H.; Maurice, C. New orientation formation and growth during primary recrystallization in stable single crystals of three face-centred cubic metals. Acta Mater. 2015, 83, 120–136. [Google Scholar] [CrossRef]
  13. Hefferan, C.M.; Lind, J.; Li, S.F.; Lienert, U.; Rollett, A.D.; Suter, R.M. Observation of recovery and recrystallization in high-purity aluminum measured with forward modeling analysis of high-energy diffraction microscopy. Acta Mater. 2012, 60, 4311–4318. [Google Scholar] [CrossRef]
  14. Sonnweber-Ribic, P.; Gruber, P.A.; Dehm, G.; Strunk, H.P.; Arzt, E. Kinetics and driving forces of abnormal grain growth in thin Cu films. Acta Mater. 2012, 60, 2397–2406. [Google Scholar] [CrossRef]
  15. Hirsch, J.; Ives, E.; Lucke, K. Rolling and recrystallization textures in directionally solidified aluminium. Acta Metall. 1987, 35, 427–438. [Google Scholar] [CrossRef]
  16. Ren, B.; Morris, J.G. Microstructure and texture evolution of Al during hot and cold rolling. Metall. Mater. Trans. A 1995, 26, 31–40. [Google Scholar] [CrossRef]
  17. Ito, K.; Musick, R.; Lucke, K. The influence of iron content and annealing temperature on the recrystallization textures of high-purity aluminium-iron alloys. Acta Metall. 1983, 31, 2137–2149. [Google Scholar] [CrossRef]
  18. Rios, P.R.; Villa, E. Transformation kinetics for inhomogeneous nucleation. Acta Mater. 2009, 57, 1199–1208. [Google Scholar] [CrossRef]
  19. Zhao, Q.; Slagsvold, M.; Holmedal, B. Comparison of the influence of Si and Fe in 99.999% purity aluminum and in commercial-purity aluminum. Scr. Mater. 2012, 67, 217–220. [Google Scholar] [CrossRef]
  20. Song, J.B.; Mao, W.M.; Yang, H.; Feng, H.P. Effect of trace Sn on corrosion behaviors of high voltage anode aluminum foil. Trans. Nonferrous Met. Soc. China 2008, 18, 879–883. [Google Scholar] [CrossRef]
  21. Doherty, R.D.; Kashyap, K.; Panchanadeeswaran, S. Direct observation of the development of recrystallization texture in commercial purity aluminum. Acta Metal. Mater. 1993, 41, 3029–3053. [Google Scholar] [CrossRef]
  22. Lim, A.T.; Srolovitz, D.J.; Haataja, M. Low-angle grain boundary migration in the presence of extrinsic dislocations. Acta Mater. 2009, 57, 5013–5022. [Google Scholar] [CrossRef]
  23. Panchanadeeswaran, S.; Field, D.P. Texture evolution during plane strain deformation of aluminum. Acta Metal. Mater. 1994, 43, 1683–1692. [Google Scholar] [CrossRef]
  24. Weiland, H.; Hirsch, J.R. Microstructure and local texture in hot rolled aluminum. Textures Microstruct. 1991, 14–18, 647–652. [Google Scholar] [CrossRef] [Green Version]
  25. Dons, A.L.; Nes, E. Nucleation of cube texture in aluminium. Mater. Sci. Technol. 1986, 2, 8–18. [Google Scholar] [CrossRef]
  26. Bay, B.; Hansen, N. Recrystallization in commercially pure aluminum. Metall. Trans. A 1984, 15, 287–297. [Google Scholar] [CrossRef]
  27. Zhang, Y.Y.; Zhang, J.S. Recrystallization in the particles interfacial region of the cold-sprayed aluminum coating: Strain-induced boundary migration. Mater. Lett. 2011, 65, 1856–1858. [Google Scholar] [CrossRef]
  28. Shvindlerman, L.S.; Gottstein, G. Grain boundary and triple junction migration. Mater. Sci. Eng. A 2001, 302, 141–150. [Google Scholar] [CrossRef]
  29. Chen, Y.; Santos, A.; Ho, D.; Wang, Y.; Kumeria, T.; Li, J.; Wang, C.; Losic, D. On The Generation of Interferometric Colors in High Purity and Technical Grade Aluminum: An Alternative Green Process for Metal Finishing Industry. Electrochim. Acta 2015, 174, 672–681. [Google Scholar] [CrossRef]
  30. Wang, Y.L.; Ren, L.P.; Dong, J.R.; Cao, C.C. Influence of Cold Rolled Deformation Degree and Heating Rates on Crystallite Dimension and Recrystallization Fraction of Aluminum Plates. Crystals 2021, 11, 1428. [Google Scholar] [CrossRef]
Figure 1. The schematic diagram of cold rolling, heat treatment, and sample observation in aluminum plate with the routes (1) cold rolling to 0.15 mm (CR-98%); (2) interannealing at 175~240 °C for 2 h; (3) cold rolling to 0.11 mm (CR-27%); (4) interannealing at 180~240 °C for 3 h; (5) final annealing at 500 °C for 1 h followed by water cooling; (6) sample observation by OM, XRD, and EBSD.
Metals 12 00260 g001
Figure 2. Mechanics performance testing of different sample states (a) stress–strain; (b) hardness.
Metals 12 00260 g002
Figure 3. Orientation distribution function with different annealing processes of (a) cold rolling to 0.15 mm and interannealing at 200 °C for 3 h; (b) cold rolling to 0.15 mm and interannealing at 180 °C for 3 h, then final annealing at 500 °C for 1 h; (c) cold rolling to 0.15 mm and interannealing at 200 °C for 3 h, then final annealing at 500 °C for 1 h.
Metals 12 00260 g003
Figure 4. Orientation distribution function with different annealing processes of (a) cold rolling to 0.15 mm and interannealing at 200 °C for 3 h; (b) cold rolling to 0.15 mm and interannealing at 240 °C for 3 h; (c) cold rolling to 0.15 mm and interannealing at 200 °C for 3 h, then cold rolling to 0.11 m and final annealing at 500 °C for 1 h.
Metals 12 00260 g004
Figure 5. The orientation image and corresponding misorientation angle distribution of (a) interannealing at 180 °C for 3 h and final annealing at 500 °C for 1 h; (b) interannealing at 200 °C for 3 h and final annealing at 500 °C for 1 h; (c,d) misorientation angle distribution corresponding to (a,b).
Metals 12 00260 g005
Figure 6. Orientation image with different annealing processes of (a) interannealing at 200 °C for 3 h; (b) interannealing at 240 °C for 3 h; (c) interannealing at 200 °C for 3 h and final annealing at 500 °C for 1 h; (d) interannealing at 240 °C for 3 h and final annealing at 500 °C for 1 h.
Metals 12 00260 g006
Figure 7. TEM micrographs observed from RD/TD plane. (a,b) Cold rolling to 0.15 mm and interannealing at 200 °C for 3 h; (c,d) cold rolling to 0.15 mm and interannealing at 240 °C for 3 h; (ei) an idealized dislocation evolution stages.
Metals 12 00260 g007
Figure 8. Volume fraction of textures during different processing steps.
Metals 12 00260 g008
Figure 9. Corrosion pit density is measured by the low-magnitude metallographic method of (a) fast annealing of finished aluminum foil after interannealing at 200 °C for 3 h; (b) slow annealing of finished aluminum foil under interannealing at 200 °C for 3 h; (c) common texture types of aluminum alloys; (d) three typical etched images in aluminum alloys.
Metals 12 00260 g009
Table 1. Chemical composition of aluminum plates (mass content in ppm).
Chemical ElementsAlFeCuMgSiMnNiZnTi
Mass contentBal.10121672131
Publisher’s Note: MDPI stays neutral with regard to jurisdictional claims in published maps and institutional affiliations.

