Article

Effect of Pre-Strain on Crack Growth Behavior of Zr702/TA2/Q345R Composite Plate

1
Engineering Technology Training Center, Nanjing Vocational University of Industry Technology, Nanjing 210023, China
2
School of Mechanical and Power Engineering, Nanjing Tech University, Nanjing 211816, China
3
Technology Research and Development Department, Nanjing Boiler and Pressure Vessel Inspection Institute, Nanjing 210028, China
*
Author to whom correspondence should be addressed.
Metals 2022, 12(12), 2187; https://doi.org/10.3390/met12122187
Submission received: 15 November 2022 / Revised: 13 December 2022 / Accepted: 14 December 2022 / Published: 19 December 2022
(This article belongs to the Special Issue Fracture Mechanics of Metals)

Abstract

:
The influence of pre-strain on the fatigue crack growth behavior of Zr702/TA2/Q345R composite plate is studied by experiments and the finite element method. The crack perpendicular to the interface and the through-wall crack are considered at the same time. For the crack perpendicular to the interface, the monotonic plastic zone and cyclic plastic zone at the crack tip are used to study the influence of pre-strain on the plastic zone. Furthermore, the influence of pre-strain on the evolution of the plastic damage at the crack tip is analyzed in detail by studying the variation in the initial plastic energy and equivalent plastic strain. For the through-wall crack, the effect of pre-strain on the propagation behavior of cracks on both sides and the whole crack is studied systematically. The results show that the strengthening of the cracks on the Zr702 side is significantly higher than that on the Q345R side, so the inhibitory effect of pre-strain on the whole crack of the through-wall specimen is mainly due to the increase in the resistance to crack growth on the Zr702 side.

Graphical Abstract

1. Introduction

Pre-strain can significantly affect the strength, toughness and microstructure of the material, thus affecting the crack growth behavior. For different materials and different stages of crack growth, the influence of pre-strain is different [1,2,3]. For the near threshold region of crack growth, the crack growth behavior is strongly affected by the microstructure. After pre-strain, the threshold value of stress intensity factor Kth of some materials decreases, and the crack growth rate da/dN increases [4,5]. For the stable stage of crack growth, studies [6,7] have shown that the microstructure transformation and twins caused by pre-strain can affect the crack growth behavior of fatigue cracks. Tang et al. [8] found that pre-strain can promote the formation of martensite in austenitic stainless steel, which can inhibit the growth of fatigue cracks. According to Yin et al. [9], cracks are initiated very easily at the grain boundary of twins, caused by pre-strain, so the crack growth is promoted. In addition, the yield strength strengthened by pre-strain inhibits the plastic deformation of the crack tip, thus reducing the passivation and re-sharpening of the crack tip and preventing the fatigue crack growth [10]. For the rapid crack growth stage, the decrease in material toughness caused by pre-strain greatly reduces the resistance to crack growth, and then increases the da/dN [11]. At present, the influence of pre-strain on the fatigue crack growth behavior is mainly concentrated in homogeneous single materials [12,13], and the research on metal composite plate has not been reported. Moreover, there are many kinds of cracks in the composite plate, and the influence of pre-strain should be discussed separately.
Based on this, the influence of pre-strain on the crack perpendicular to the interface and the through-wall crack is studied in this paper. The effect of pre-strain on the monotonic plastic deformation and cyclic plastic evolution of the crack tip is analyzed, so as to clarify the mechanism of pre-strain on the crack perpendicular to the interface. At the same time, the influence of pre-strain on the driving force, plastic zone and crack growth characteristics in the component materials is analyzed, and the effect of pre-strain on crack growth behavior and the toughening effect of the through-wall crack are clarified.

2. Material, Fatigue Crack Growth Test and Finite Element Method

2.1. Material

The test material is Zr702/TA2/Q345R composite plate, which is made by explosive welding technology; the basic mechanical properties of the three component materials are listed in Table 1. The thickness of each layer for Zr702/TA2/Q345R composite plate is 2, 1.8 and 8.2 mm, respectively. The composite plate has been treated by a post weld heat treatment to reduce the influence of residual stress.

2.2. Specimen Design and Fatigue Crack Growth Test

In this paper, the crack perpendicular to the interface with different crack growth directions, i.e., Type-A and Type-B specimens, and Type-C specimens with through-wall a crack were considered. For Type-A and Type-B specimens, the crack originates from one side of the material and propagates to the other side. For Type-C specimens, the crack propagates in all components of the material at the same time. The specific dimensions of different types of specimens are shown in Figure 1. The material thickness of each layer for Type-A and Type-B specimens is Zr702: 2 mm, TA2: 1.8 mm and Q345R: 8.2 mm. For the Type-C specimen, Q345R is reduced to 2.2 mm in order to meet the specimen design requirements (ASTM E647–08).
Before the crack growth test, different pre-strain levels are achieved by loading the specified displacements corresponding to different strains, and the pre-strain introduces the artificial notch before to ensure the uniform pre-strain of the whole specimen. In the crack growth test, stress control is adopted in the test, the loading waveform is a triangular wave, and the frequency is 8 Hz. The specimen clamping area and loading direction are shown in Figure 1; the unclamped area in the middle is the gauge length section, with a distance of 48, which is eight times the thickness of the specimen. During the test, the direct current potential method [14] is used to measure the crack length, and the number of cycles corresponding to the crack length is recorded. The test data are processed by the seven-point polynomial method [14]. The test was carried out on an MTS809 hydraulic testing machine (Mechanical Testing & Simulation, Eden Prairie, MN, America) with ambient temperature. The test scheme is given in Table 2.

2.3. Finite Element Method (FEM)

ABAQUS 6.1 (Dassault system, Vélizy-Villacoublay, France) was used to study the influence of pre-strain on the plastic deformation and plastic strain accumulation at the crack tip. The Chaboche model [15], which combines the criteria of follow-up strengthening and isotropic strengthening, is used in this paper. According to the Huber–von Mises yield criterion, the yield surface of the Chaboche model is expressed as follows [16]:
f σ α , k = 2 3 s a · s a k = 0
In the above equation, σ is the stress tensor; α is the back stress tensor, i.e., the center of the yield surface; s is the partial stress tensor; a is the partial back stress tensor and k is the yield surface size.
To describe the plastic flow direction, the plastic strain increment is expressed as follows:
d ε p = λ f σ
where λ is the plastic multiplier. The following hardening law of the model is shown as follows:
d α = i = 1 M d α i
d α i = 2 3 C i d ε p γ i α i d p
where C i and γ i are the material constants and d p is the cumulative plastic strain.
The parameters of the Chaboche model for each component of Zr702/TA2/Q345R composite plate are shown in Table 3. The parameters of the Chaboche model and the equivalent plastic strength curve with the equivalent plastic strain are obtained through the basic tensile test and low cycle fatigue test [15]. In addition, the finite element method is the same as that in [14], and the loading and boundary conditions are set according to the test conditions. Table 3 shows that, the higher the pre-strain level, the higher the yield strength of each layer of material. By analyzing the evolution of the equivalent plastic strain at the crack tip under different pre-strain levels, the influence of pre-strain on the plastic strain during crack growth can be determined.
For this part, the two-dimensional finite element model is adopted here, and element type is the plane strain element (CPE4). Material properties are defined according to Table 1, and boundary conditions and finite elements are shown in Figure 2 (with Type-A crack as an example). As shown in Figure 2, one side of the Type-A specimen is set as a fixed constraint; the other side is a binding constraint and applies a concentrated load, and the midpoint of this side needs to limit other degrees of freedom, except the direction of concentrated force. The mesh of the crack tip is refined by linearized mesh generation, and the mesh size ranges from 0.001 to 0.01 mm. In this paper, the plastic zone is defined as the region where plastic strain is more than 10−4.

3. Results and Discussion

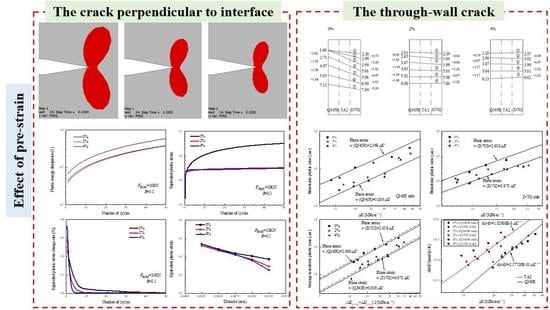
3.1. Effect of Pre-Strain on the Crack Growth Behavior of the Crack Perpendicular to the Interface

3.1.1. The da/dN and Monotonic Plastic Zone

Figure 3 shows the da/dN results of the Type-A and Type-B specimens under different pre-strain levels. It can be seen that the da/dN decreases with pre-strain level. For the Type-A specimens, the degree of influence from the pre-strain near the interface is lower than that at the non-interface. With the increase in the pre-strain level, the strength of the component materials improves. However, due to the influence of the explosive welding process, the materials near the interface have an obvious plastic deformation and strengthening, so the degree of strengthening from the pre-strain is less than that of the homogeneous component materials far away from the interface. Therefore, the resistance to crack propagation of the materials near the interface has not increased significantly after the pre-strain. In Figure 3b, pre-strain also shows an inhibitory effect on the crack propagation of Type-B cracks. However, the Type-B crack is not significantly affected by the interface, and the rate variation of Type-B cracks at the interface is far lower than that of Type-A cracks. Combining with the da/dN curve of the component materials in [14], it can be seen that the main reason is that the property mismatch of Type-B cracks leads to the higher stress intensity factor amplitude ΔK of the crack tip, so the difference in the crack growth characteristics in the component materials is reduced. The driving force of the Type-B crack is greater, and the propagation rate is faster, so the influence of the microstructure at the interface is obviously lower than that of the Type-A crack.
Figure 4 shows the variation in the monotonic plastic zone w results from the simulation in different crack propagation directions. It can be seen that the w of the crack tip decreases significantly with pre-strain level. Due to the increase in the pre-strain level, the equivalent yield strength of the material is improved (as shown in Table 3), which leads to the decrease in the w of the crack tip under the same load level, and the static damage caused by the static tensile load is restrained. Therefore, the growth rate of the fatigue crack decreases.

3.1.2. Cyclic Plastic Deformation of Crack Tip

In order to explore the reasons for the change in the crack growth rate under different pre-strains, the characteristics of the plastic deformation of the crack tip are studied by Finite Element Method (FEM) in this paper. At present, the consensus view is that the damage of the materials under cyclic loading consists of two parts, namely, static damage and cyclic damage. Among them, the cyclic damage is mainly studied by the cyclic plastic zone and the evolution of the equivalent plastic strain. The cyclic plastic zone of the crack tip obtained by Chaboche model is shown in Figure 5.
Figure 5 shows the cyclic plastic zone size of the Type-A crack at different pre-strain levels after the first loading cycle. Obviously, with the increase in pre-strain level, the cyclic plastic zone decreases. It is shown that the plastic zone of each cycle is restrained by pre-strain, which leads to the decrease in the degree of damage. In order to further clarify the effect of pre-strain on the accumulation and evolution of plastic deformation, the equivalent plastic strain (PEEQ) under a certain number of cycles at 5 μm from the crack tip was obtained using FEM.
It is shown that the cyclic plastic energy of the residual section of the specimen affects the growth rate of the fatigue crack to some extent. Figure 6a shows the effect of pre-strain on the plastic strain energy when the crack length is 3.5 mm. Figure 6a shows that, with the increase in cyclic loading cycles, the plastic strain energy at different pre-strain levels continues to rise, but the initial value and rising trend are different. With the increase in the pre-strain level, the initial plastic strain energy decreases. It is shown that the initial plastic strain energy decreases and the accumulation of plastic strain energy decreases during the whole loading process, thus reducing the da/dN. This is one of the reasons why da/dN in Figure 3 decreases with the increase in pre-strain.
Figure 6b–d show the effect of pre-strain on PEEQ. Figure 6b shows that, with the increase in the pre-strain level, the PEEQ under 50 cycles at 5 μm from the crack tip decreases, and when pre-strain changes from 0% to 2%, the decrease in the PEEQ is significantly higher than that of the pre-strain changes from 2% to 4%. Although the PEEQ at 4% pre-strain was higher than that at 2% pre-strain before the first eight cycles, the PEEQ at 2% pre-strain was gradually higher during the subsequent loading cycles.
Figure 6c further shows the variation in the PEEQ change rate with the pre-strain level. It can be seen that, with the increase in the number of cycles, the change rate of the PEEQ at all pre-strain levels decreases, and with the increase in the pre-strain level, the accumulation rate of the PEEQ in the first cycle also increases. However, with further cyclic loading, the PEEQ decreased faster at a higher pre-strain level, and the change rate of the PEEQ at 2% and 4% pre-strain was very low after 10 loading cycles; that is to say, the accumulation rate of the PEEQ was very slow, while the specimen without pre-strain still maintained a certain growth rate.
Pre-strain can significantly improve the strength, but it causes a decrease in the toughness of the material, which leads to a decrease in the residual plastic deformation ability and is also the reason why the cumulative rate of PEEQ decreases greatly with pre-strain level. Figure 6d shows the effect of pre-strain on the PEEQ distribution near the crack tip after the first cyclic loading. Figure 6d shows that, the closer the distance from crack tip is, the higher the load level and plastic deformation of the material is, and the smaller the PEEQ difference caused by pre-strain is. With the increase in the distance from the crack tip, the PEEQ difference caused by pre-strain is more obvious. The results show that, when the loading level of the material is low, the pre-strain strengthening has a more significant inhibition on the PEEQ.

3.2. Effect of Pre-Strain on the Crack Growth Behavior of the Through-Wall Crack

3.2.1. The Growth Rate of Two-Sided Cracks

The effect of pre-strain on the fatigue crack growth behavior of the through-wall crack is shown in Figure 7. It can be seen that, at the 0% pre-strain level, the da/dN on the Q345R side is significantly higher than that on the Zr702 side when the crack length is the same, while at the 2% and 4% pre-strain levels, the da/dN on both sides is closer until coincidence.
The front position of the crack calibrated through test observations is shown in Figure 8. It can be seen that, at 0% pre-strain, the crack on the Zr702 side preferentially propagates, and then the crack on the Q345R side begins to propagate; the variation in the front position of the crack shows that its propagation rate is significantly higher than that of the Zr702 side. The crack growth at 2% and 4% pre-strain levels is consistent with the experimental results, i.e., the da/dN on both sides is similar, and the crack front is basically perpendicular to the crack growth direction.
In order to determine the influence of pre-strain on the da/dN on both sides of the through-wall crack, the crack growth results under different pre-strain in the materials on each side are compared, as shown in Figure 9. The results show that the da/dN at the same crack length decreases with the increase in the pre-strain level. The results show that, when the pre-strain is 0%, the da/dN is significantly lower than that of the 2% and 4% pre-strain levels. Obviously, under the same crack length, the effect of pre-strain on the two sides of the material is different, so comparing the effect of the pre-strain level on each side of the crack needs to be analyzed in combination with the change in ΔK. The front position of the crack under different pre-strain levels is obtained through the test, and then the finite element analysis is carried out to obtain the ΔK at each side under each crack’s front position, as shown in Figure 10. After correlating the crack length and da/dN with ΔK, Figure 11 shows the effect of pre-strain on the da/dN-ΔK of both sides.
The relationship between ΔK and crack length in Figure 10 shows that ΔK on the Q345R side at the 0% pre-strain level is significantly higher than that of the other two groups, while the ΔK on the Zr702 side is significantly lower than that of the other two groups. It can be seen from the front position of the cracks under different pre-strain levels (Figure 8) that the crack length of the Q345R side at the 0% pre-strain level is always less than that of the Zr702 side compared with that at the 2% and 4% pre-strain levels, and the difference in crack length lies in all crack fronts. From the results of the finite element analysis of the through-wall crack [16], it can be seen that the Q345R side with a higher elastic modulus has a higher ΔK at the same crack length. When the crack length on one side is ahead of that on the other side, the stress at the crack tip on this side is released, resulting in the decrease in ΔK at the crack tip, while on the other side, because the crack length is small, the stress concentration at the crack tip is increased, resulting in the increase in ΔK. Therefore, the great difference in crack growth length between the two sides leads to the significant difference in ΔK and the other two groups at the 0% pre-strain level. At the 2% and 4% pre-strain levels, the difference between the crack lengths on both sides is not obvious, which makes the ΔK results of each side crack close to each other.
It can be seen from Figure 11 that the influence of pre-strain on the crack growth rate of the Q345R side is not significant. In the low ΔK stage, the crack growth rate decreases with the increase in the pre-strain level, while in the larger ΔK stage, the growth rate of the 0% pre-strain level is the lowest. In Figure 11b, with the gradual increase in the pre-strain level, the da/dN-ΔK curve decreases significantly. The pre-strain treatment strengthens the Zr702 side and the resistance to fatigue crack growth increases significantly.
Figure 12 shows the change in ΔK and da/dN of the overall crack with the pre-strain level. Figure 12a shows that the overall ΔK of the 0% pre-strain level is the lowest under the same overall crack length. This is because the resistance to crack growth of the Zr702 side under 0% pre-strain is lower than that of the other two groups, so the crack preferentially propagates on this side and always leads the crack length of the Q345R side. The stress at the crack tip is released and the ΔK is lower than that of the other two groups. Although the ΔK of the Q345R side at the 0% pre-strain level is slightly higher than that of the other two groups, the ΔK of the overall crack is still lower than the 2% and 4% pre-strain. The da/dN–ΔK curves of the overall crack under different pre-strain levels in Figure 12b show that the increase in pre-strain has a restraining effect on the overall crack growth behavior, significantly improving the overall material’s resistance to crack growth and reducing the da/dN. It can be seen that, although the influence of pre-strain on the crack growth behavior of the Q345R side is limited, the overall crack growth behavior is restrained by pre-strain because the resistance of Zr702 to crack growth is significantly increased [17].

3.2.2. Plastic Deformation of Crack Tip

The influence of pre-strain on the monotonic plastic zone of both sides and the overall crack is shown in Figure 13. It can be seen that the results of the monotonic plastic zone under 0% pre-strain are close to the Dugdale model [16] results of single homogeneous materials under plane stress conditions, and that, with the increase in the pre-strain level, the size of the plastic zone is close to the Dugdale model results under plane strain conditions. The calculation results of the whole plastic zone still conform to the variation in the single plastic zone. It can be seen that the pre-strain significantly improves the yield strength of the component materials, thus inhibiting the plastic deformation of the crack tip, resulting in the decrease in the plastic zone under the same loading parameters, and the size of the plastic zone changes from the plane stress results to the plane strain results.
The Dugdale model under plane stress conditions is as follows:
w = π 8 K 2 σ y 2
where w is the monotonic plastic zone and σy is the yield strength of a single material.
The results show that the strengthening effect of pre-strain on the Zr702 side is more significant than that of the Q345R side, so the strengthening of Zr702 is the reason that the overall crack growth rate decreases. The results show that the pre-strain has a significant effect on the plastic deformation of both sides, but the da/dN of the Q345R side is not reduced. It can be seen that the strengthening of the plastic zone by the pre-strain does not significantly enhance the resistance to crack growth. In addition, at the same time, the size of the plastic zone on the Q345R side is much larger than that on the Zr702 side. The overall plastic zone is defined as the mean value of the plastic zone on both sides, and its variation is consistent with the variation in the plastic zone on both sides. Therefore, the reduction in the overall plastic zone is caused by the plastic strengthening of the materials on both sides.

3.2.3. Crack Growth Characteristics on Both Sides

It is confirmed that there is an interaction effect between the cracks in the materials on both sides of the through-wall crack due to the influence of the performance mismatch of the component materials, and the toughening effect is better than that of the whole crack growth [17]. The interface affects the crack growth on both sides, thus reducing the difference between the da/dN on both sides. Here, Q345R with a high resistance to crack growth is the toughening phase, which can reduce the overall da/dN.
In order to determine the influence of pre-strain on the interaction effect between cracks on both sides, the comparison results of the da/dN-ΔK curves between cracks on both sides and the corresponding single-component materials under different pre-strain levels are summarized in Figure 14. In Figure 14, the effect of pre-strain is not significant for the Q345R side, which is always near the da/dN-ΔK curve of a single homogeneous material, while the da/dN–ΔK point on the Zr702 side decreases with the increase in the pre-strain level, even lower than the da/dN–ΔK curve of a single homogeneous material at 4% pre-strain. It can be seen from Figure 11 that, with the increase in the pre-strain level, the resistance to crack growth on the Q345R side does not change much, while the Zr702 side is significantly strengthened. The difference in the crack growth characteristics on both sides decreases. It can be seen that, with the increase in the pre-strain level, due to the significant strengthening of the Zr702 side, the difference in the crack growth characteristics between the two sides is reduced, and the interaction effect between the two sides and the toughening effect from the toughening phase of the Q345R is weakened, which also causes the crack front in Figure 8 to straighten.
Although the material strengthening caused by pre-strain can restrain the monotonic plastic zone of all components [18], for the linear elastic fracture dominated by ΔK, the effect of the decrease in the plastic deformation caused by pre-strain on the crack growth behavior of the Q345R side is not significant, and the influence of pre-strain on the crack growth behavior needs to be analyzed from the microstructure. In fact, the pre-strain increases the slip band and twins of Zr702 and TA2, which significantly improves the resistance to crack growth. However, no slip band and twins can be observed in Q345R after pre-strain. It can be seen that, at the same pre-strain level, the microstructure changes of Zr702 and TA2 are more likely to occur, which are not conducive to crack growth, and the strengthening of crack growth resistance from pre-strain is better than Q345R.

4. Conclusions

In this paper, the effect of pre-strain on the fatigue crack growth behavior of the crack perpendicular to the interface and the through-wall crack is analyzed. The main conclusions are as follows:
  • The yield strength of the component materials increases with the pre-strain level. This results in the decrease in the monotonic plastic zone and the degree of monotonic damage for the crack perpendicular to the interface.
  • The pre-strain leads to the loss of plastic deformation ability in advance, and the equivalent plastic strain at the crack tip decreases, so the cyclic damage decreases.
  • The effect of pre-strain on the strengthening of Q345R is not as strong as that of Zr702 and TA2, so the crack growth on the Zr702 side of the through-wall crack is more restrained.
  • The pre-strain increases the resistance to crack growth of Zr702 and TA2, makes the overall crack growth characteristics close to the cracks in Q345R, and leads to the decrease in the interaction effect between the cracks on both sides and the weakening of the toughening effect of Q345R.
This paper provides a new solution to the problem of crack propagation in equipment made of composite materials. The propagation characteristics of cracks perpendicular to the interface and through-wall crack are universal, which can be further used to predict the remaining life of composite equipment.

Author Contributions

B.Z. (Binbin Zhou) and C.Z. (Changyu Zhou) conceptualized the study; L.C. and C.Z. (Chao Zhou) manufactured the specimens; B.Z. (Binbin Zhou) carried out the tests; C.Z. (Changyu Zhou) and C.Y. evaluated the tests; Y.Z. wrote the original draft; B.Z. (Binbin Zhou), C.Z. (Changyu Zhou), L.C. and C.Y. reviewed and edited the paper; B.Z. (Bojun Zhang) and C.Y. supervised the study. All authors have read and agreed to the published version of the manuscript.

Funding

This research was funded by the National Natural Science Foundation of China grant number (51975271, 51675260, 51475223, 51905260), the Natural Science Foundation of the Jiangsu Higher Education Institutions of China grant number 22KJB410003, the Starting Research Fund of Nanjing Vocational University of Industry Technology grant number YK20-14-05 And the APC was funded by the Starting Research Fund of Nanjing Vocational University of Industry Technology.

Institutional Review Board Statement

Not applicable.

Informed Consent Statement

Not applicable.

Data Availability Statement

The data presented in this study are available on request from the corresponding author.

Conflicts of Interest

The authors declare no conflict of interest.

References

  1. White, B.C.; White, R.E.; Jordon, J.B.; Allison, P.G.; Rushing, T.; Garcia, L. The effect of tensile pre-straining on fatigue crack initiation mechanisms and mechanical behavior of AA7050 friction stir welds. Mater. Sci. Eng. 2018, 736, 228–238. [Google Scholar] [CrossRef]
  2. Stashkov, A.N.; Nichipuruk, A.P.; Ogneva, M.S. The effect of plastic strain and the orthogonal bias field on the processes of magnetization of low-carbon steel. Russ. J. Nondestruct. Test. 2012, 48, 686–692. [Google Scholar] [CrossRef]
  3. Al-Rubaie, K.; Barroso, E.; Godefroid, L. Fatigue crack growth analysis of pre-strained 7475–T7351 aluminum alloy. Int. J. Fatigue 2006, 28, 934–942. [Google Scholar] [CrossRef] [Green Version]
  4. Mehmanparast, A.; Davies, C.M.; Dean, D.W.; Nikbin, K. Effects of plastic pre-straining level on the creep deformation, crack initiation and growth behaviour of 316H stainless steel. Int. J. Press. Vessel. Pip. 2016, 141, 1–10. [Google Scholar] [CrossRef] [Green Version]
  5. Wang, D.; Ma, Z.Y. Effect of pre-strain on microstructure and stress corrosion cracking of over-aged 7050 aluminum alloy. J. Alloys Compd. 2009, 469, 445–450. [Google Scholar] [CrossRef]
  6. Auzoux, Q.; Allais, L.; Caes, C.; Monnet, I.; Gourgues, A.; Pineau, A. Effect of pre-strain on creep of three AISI 316 austenitic stainless steels in relation to reheat cracking of weld-affected zones. J. Nucl. Mater. 2010, 400, 127–137. [Google Scholar] [CrossRef]
  7. Mishima, T.; Kang, M.; Aono, Y.; Noguchi, H. Method for the evaluation of mode I fatigue crack growth rate of prestrained materials. Int. J. Fatigue 2007, 29, 1737–1743. [Google Scholar] [CrossRef]
  8. Tang, L.; Qian, C.; Wang, Z.; Li, H. Experimental study of the strain-strengthening effect on the mixed mode notch-crack fatigue propagation in austenitic stainless steel 06Cr19Ni10. Eng. Fract. Mech. 2015, 134, 54–60. [Google Scholar] [CrossRef]
  9. Yin, S.M.; Yang, F.; Yang, X.M.; Wu, S.D.; Li, S.X.; Li, G.Y. The role of twinning-detwinning on fatigue fracture morphology of Mg-3%Al-1%Zn alloy. Mater. Sci. Eng. A 2008, 494, 397–400. [Google Scholar] [CrossRef]
  10. Le, M.Q.; Batra, R.C. Crack propagation in pre-strained single layer graphene sheets. Comput. Mater. Sci. 2014, 84, 238–243. [Google Scholar] [CrossRef]
  11. Mehmanparast, A.; Davies, C.M.; Dean, D.W.; Nikbin, K. Material pre-conditioning effects on the creep behaviour of 316H stainless steel. Int. J. Press. Vessel. Pip. 2013, 108–109, 88–93. [Google Scholar] [CrossRef]
  12. Mehmanparast, A.; Davies, C.M.; Nikbin, K. Creep-fatigue crack growth testing and analysis of pre-strained 316H stainless steel. Procedia Struct. Integr. 2016, 2, 785–792. [Google Scholar] [CrossRef] [Green Version]
  13. Mehmanparast, A.; Davies, C.M.; Dean, D.W.; Nikbin, K. The influence of pre-compression on the creep deformation and failure behaviour of Type 316H stainless steel. Eng. Fract. Mech. 2013, 110, 52–67. [Google Scholar] [CrossRef]
  14. Zhou, B.B.; Zhou, C.Y.; Yu, X.C.; Chang, L.; Li, J.; Miao, X.; Ye, C.; Zhang, B. Investigation on the fatigue crack behavior of Zr702/TA2/Q345R composite plate with a crack normal to interface. Fatigue Fract. Eng. Mater. Struct. 2019, 43, 20–35. [Google Scholar] [CrossRef]
  15. Li, J.; Zhang, P.; Lu, L.; Lv, F.; Miao, X.-T.; Chang, L.; Zhou, B.-B.; He, X.-H.; Zhou, C.-Y. Effect of pre-strain on fatigue crack growth behavior for commercial pure titanium at ambient temperature. Int. J. Fatigue 2018, 117, 27–38. [Google Scholar] [CrossRef]
  16. Basan, R.; Franulovic, M.; Prebil, I.; Kunc, R. Study on Ramberg-Osgood and Chaboche models for 42CrMo4 steel and some approximations. J. Constr. Steel Res. 2017, 136, 65–74. [Google Scholar] [CrossRef]
  17. Zhou, B.B.; Zhou, C.Y.; Chang, L.; Yu, X.C.; Ye, C.; Zhang, B.J. Investigation on fatigue crack growth behavior of Zr702/TA2/Q345R explosive welding composite plate with a through-wall crack. Compos. Struct. 2020, 236, 111845. [Google Scholar] [CrossRef]
  18. Chen, C.; Lv, B.; Wang, F.; Zhang, F. Low-cycle fatigue behavior of pre-hardening Hadfield steel. Mater. Sci. Eng. A 2017, 695, 144–153. [Google Scholar] [CrossRef]
Figure 1. Diagram of Type-A, Type-B and Type-C specimens.
Metals 12 02187 g001
Figure 2. Finite element model of Type-A specimen.
Metals 12 02187 g002
Figure 3. Effect of pre-strain on da/dN: (a) Type-A crack, (b) Type-B crack.
Metals 12 02187 g003
Figure 4. Effect of pre-strain on w for the crack normal to the interface: (a) Type-A crack, (b) Type-B crack.
Metals 12 02187 g004
Figure 5. Effect of pre-strain on the cyclic plastic zone at the crack tip after the first cycle: (a) 0%; (b) 2%; (c) 4%.
Metals 12 02187 g005
Figure 6. Effect of pre-strain on crack growth behavior (Type-A crack, crack length of 3.5 mm): (a) variation of plastic strain energy; (b) PEEQ at 5μm of crack tip under 50 cycles; (c) variation of PEEQ change rate; (d) variation of PEEQ distribution near crack tip after the first cycle.
Metals 12 02187 g006
Figure 7. Test results of the through-wall crack with different pre-strain levels: (a) 0%, (b) 2%, (c) 4%.
Metals 12 02187 g007
Figure 8. Front position of the through-wall crack with different pre-strain levels: (a) 0%, (b) 2%, (c) 4%. Here, larger number indicates the crack length, and smaller number with a plus sign indicates the crack length increment. The number in the circle represents the measured number of crack fronts.
Metals 12 02187 g008
Figure 9. Test results of cracks on both sides with different pre-strain levels: (a) Q345R side, (b) Zr702 side.
Metals 12 02187 g009
Figure 10. Effect of pre-strain on ΔK on both sides: (a) Q345R side, (b) Zr702 side.
Metals 12 02187 g010
Figure 11. Effect of pre-strain on da/dN on both sides: (a) Q345R side, (b) Zr702 side.
Metals 12 02187 g011
Figure 12. Effect of pre-strain on overall performance of the through-wall crack: (a) a-da/dN, (b) ΔK-da/dN.
Metals 12 02187 g012
Figure 13. Effect of pre-strain on plastic zone for both sides and whole crack: (a) Q345R side, (b) Zr702 side, (c) whole crack.
Metals 12 02187 g013aMetals 12 02187 g013b
Figure 14. Effect of pre-strain on crack growth characteristics for cracks on both sides.
Metals 12 02187 g014
Table 1. Comparison of mechanical properties of Zr702, TA2 and Q345R.
MaterialElastic Modulus
(GPa)
Poisson RatioYield Strength
(MPa)
Tensile Strength
(MPa)
Zr70290.30.33314499
TA2900.34330383
Q345R2030.3352522
Table 2. Fatigue crack growth test scheme after pre-strain.
Specimen TypeLoad RatioLoad Amplitude
ΔF/N
Pre-Strain Level/%
Type-A0.190000
2
4
Type-B0.143560
2
4
Type-C0.190000
2
4
Table 3. Chaboche model parameters of component materials with different pre-strain levels.
Pre-Strain Level (%)Materialσ0 (MPa)C1γ1C2γ2
0%Zr7023141759199175818
TA2330206726176524
Q345R35217522020717
2%Zr7023405941359413
TA2411110469168514
Q345R3953492203382
4%Zr702354512339535
TA244114783437817
Q345R45263816165212
Publisher’s Note: MDPI stays neutral with regard to jurisdictional claims in published maps and institutional affiliations.

