Article

In Situ Ageing with the Platform Preheating of AlSi10Mg Alloy Manufactured by Laser Powder-Bed Fusion Process

1
Laboratoire Génie de Production, Université de Toulouse, ENIT/INPT, 47 Avenue d’Azereix, 65016 Tarbes, France
2
Collins Aerospace, Advanced Structures, Ratier-Figeac, BP N°2, Avenue Ratier, 46101 Figeac, France
3
Spinodal Conseil, 1301 Avenue de Toulouse, 31600 Seysses, France
*
Author to whom correspondence should be addressed.
Metals 2022, 12(12), 2148; https://doi.org/10.3390/met12122148
Submission received: 24 November 2022 / Revised: 12 December 2022 / Accepted: 13 December 2022 / Published: 14 December 2022
(This article belongs to the Section Additive Manufacturing)

Abstract

:
AlSi10Mg alloy is mainly produced by laser fusion on a powder bed. It offers a good compromise between easy processing and good mechanical properties. These properties depend on the manufacturing parameters, including the preheating temperature, as this alloy hardens by precipitation. This study explored the effect of preheating to 170 °C on the mechanical properties and microstructure of this alloy as a function of the manufacturing time. The mechanical properties were characterized by tensile, hardness and impact strength tests as a function of the sample height. An anisotropic behavior was confirmed: the horizontal orientation showed higher deformation and fracture energies. In addition, a gradient of properties appeared as a function of the distance from the platform; the closer the sample was to the platform, the higher its fracture energy and the lower its hardness. The hardness values followed the same evolution as a function of the distance to the platform as that of the hardness curve after ageing post-treatment. It was therefore shown that the preheating of the platform generated in situ ageing with respect to the manufacturing height: a hardness peak was obtained at a certain distance from the plateau (40 mm—10 h of remaining manufacturing time) and over-aging near the plateau was induced by long exposure times at 170 °C.

1. Introduction

Laser powder-bed fusion (L-PBF) is one of the most popular additive manufacturing (AM) processes and has widely been studied, in particular thanks to its capacity to produce near-net-shaped products with complex structures generated by topologic optimization from CAD models. This process has been employed for a large variety of alloys such as stainless steel, titanium, nickel, and aluminum alloys. In the case of Al alloys, not all grades can be easily processed by L-PBF, especially because of the hot cracking of high-performance wrought alloys (AA7075 and AA6061 for example). Moreover, the elaboration of Al alloys is quite challenging due to their high reflectivity, the formation of oxide layers on the powders and printed layers, and residual stresses due to rapid solidification. Thus, Al–Si-based alloys have largely been investigated by this manufacturing process [1,2,3,4,5].
AlSi10Mg is widely used for aeronautic and automotive applications in its cast-processed form thanks to its narrow solidification range, which reduces cracking susceptibility and provides good weldability, a high strength-to-weight ratio, and good fatigue and corrosion resistance [1,5]. The addition of Si provides good castability and the addition of Mg allows precipitation strengthening through the formation of metastable Mg2Si precipitates during ageing (150–200 °C) after solution heat treatment (540 °C) followed by water quenching. The precipitation sequence is given by: α-Al → Mg/Si atom clusters → GP zones → β’’ → β’ → β(Mg2Si). The α-Al solid solution is a supersaturated solid solution usually obtained after a fast quench. GP stands for Guinier–Preston zones, β’’ corresponds to the metastable needle-like-shaped precipitates, which provide the hardest state, and β’ represents metastable rod-like (or lath-like) precipitates. The precipitate, β, is the equilibrium and stable phase. The formation of β’’ and β’ precipitates occurs by nucleation and growth and is controlled by diffusion [6].
These reasons have made it so that this alloy is the most investigated aluminum alloy processed by L-PBF. Several studies have studied the process parameters, microstructure, mechanical properties, and heat treatments [7,8,9,10].
The study of the process parameters has mainly focused on density optimization and the understanding of texture formation through parameter variations [7,11]. Regarding the as-built microstructure, it has been shown that it is composed of an Al cellular phase surrounded by a Si-rich eutectic phase [12]. The microstructure is much finer than those achieved by conventional processes [9,12]. This metastable microstructure arises from the rapid heating and cooling occurring during the fusion–solidification process. The resulting mechanical properties are mainly characterized by tensile and fatigue properties: they depend on building orientations and process parameters [13]. The microstructure and mechanical properties can be optimized for the function of the targeted application. Solution heat treatments are employed with the idea of finding known properties, while direct artificial ageing is used to exploit the hardening potential of the rapidly cooled alloy and maintain the fine cell structure or reduce thermal stresses [10,14,15].
Platform preheating is an important process parameter that can affect the properties of the printed material. It was originally used to reduce thermal stresses or to help the prevention of hot cracking [14,16]. However, it was highlighted that preheating has an important role in the microstructural and hardening potential of the alloy. For example, preheating at 200 °C results in a reduced yield strength and Si precipitation inside the Al cells [9,17]. Aversa and co-authors found that different preheating temperatures could generate this precipitation. This precipitation was induced by in situ ageing for temperatures higher than 140 °C [18]. For a 160 °C preheating, Casati et al. noted a loss of hardening potential in comparison with an un-preheated platform [19]. Nevertheless, they did not notice any hardness variation with respect to the building height as opposed to Bosio et al. and Mauduit et al. [14,20]. The various authors do not agree on the consequences of the influence of the plate temperature on the final properties of the parts. This lack of consensus in obtaining identical properties for AlSiMg alloy parts obtained by the AM process could have several origins: the variability in the lasering parameters depending on the parts on the platens and the failure to consider the time-temperature interdependence in the case of heated platens.
In this work, we explored the effect of a 170 °C platform preheating temperature on mechanical properties and microstructure with respect to the manufacturing height. The tensile properties were estimated in different directions, and the impact toughness was characterized by different building and notch orientations at different distances from the platform. First, the dispersion of the mechanical properties of the samples made in different areas of the platform was checked. Then, the effect of the building temperature as a function of the building height was highlighted by in situ ageing: a precipitation gradient was revealed between the bottom and the top of the product. Finally, a link between the in situ ageing and mechanical properties was realized in terms of the hardening mechanisms depending on the distance to the platform.

2. Materials and Methods

2.1. Material and Manufacturing Conditions

The L-PBF AlSi10Mg was processed by a Renishaw AM400 machine composed of a 400W Yb: YAG pulsed laser with a 70 µm spot size. The building platform was an aluminum plate with an effective surface area of 230 × 230 mm2. The building parameters are reported in Table 1, which shows a volumetric energy density of 60 J/mm3. The platform was preheated to 170 °C. This temperature was reached thanks to a resistive heater placed under the manufacturing platform. The production only started once the set point was reached and stabilized. The temperature was monitored and controlled by a thermocouple placed under the platform, which was maintained constant throughout the manufacturing process. The platform heating was stopped after the last layer was printed, allowing the whole product to cool down.
The building plate was divided into five equivalent areas in terms of surface. They were designed as a function of the wiper displacement and gas flow directions, as presented in Figure 1. In each area, the print surface was considered to be homogeneous.
Various tests were chosen to evaluate the potential different behaviors according to the building areas on the platform. Each zone was composed of the same number of raw samples: 2 parallelepipeds for the metallurgical studies and density measurements, 9 rods for the tensile test specimens, and 15 parallelepipeds for the Charpy tests specimens. The dimensions of the raw specimens produced were 16 × 16 × 60.1 mm3, 10.2 mm in diameter and 49.6 mm in length, and 10.2 × 5.2 × 55.2 mm3, respectively. Metallurgical bars were printed vertically (building direction), and tensile and Charpy bars were produced following various building orientations (Z, X) as represented in Figure 1. Three Charpy raw specimens built in the X building orientation were superposed. The production time of the test pieces was about 70 h.

2.2. Mechanical Characterization

Uniaxial tensile tests were performed following the ASTM E8 standard to characterize the static tensile behavior of the material in various building orientations. Round tensile specimens were machined from bulk bars according to ISO EN 6892-1 (4 mm in diameter and 22 mm in gauge length). Tensile tests were carried out at room temperature using an INSTRON 5892 electromechanical testing machine (100 kN load cell, Instron, Norwood, MA, USA) with a crosshead speed of 0.3 mm.min−1 (strain rate was 2.5 × 10⁻⁴ s−1). A mechanical extensometer was used for the low levels of strain (less than 1%) while a video extensometer allowed the recording for the high strains. The tests were repeated three times for each sample orientation and positioning to ensure the repeatability of the trials.
The Charpy test specimens were machined following the reduced ASTM E23 standard (sample dimensions: 5 × 10 × 55 mm3). Notches (45° angle, 0.25 mm radius, and 2 mm deep V-notch) were broached using a CNB30-027A2 machine (RJW Ltd Blacks Charpy, Swanley, UK) equipped with a type-C Charpy notch broach according to the different directions (Figure 1). The machine used for the tests was an instrumented Zwick/Roell HIT50P device (Zwick/Roell, Paris, France) with a 50 J pendulum. The fracture energy value was analyzed for all specimens. Three samples were tested for each specimen type (building and notch orientations) at 25 °C.
The Vickers hardness was measured using Zwick/Roell ZHU 2.5 equipment (Zwick/Roell, Paris, France) with a 500 g load (HV0.5). All tests were carried out following the EN ISO 6507-1 standard. Hardness profiles and their related standard deviations were obtained by 20 hardness indentations at the same distance from the platform.
Nano-indentation tests were also performed on an XP-MTS testing machine (MTS, Paris, France), using the continuous stiffness measurement module. All tests were carried out to a depth of 2 µm, and the loading–unloading curve was recorded. The analyses focused on the study of hardness and Young’s modulus calculated continuously for a depth ranging from 500 to 1500 nm.

2.3. Microstructural and Thermal Characterizations

Relative density estimations were carried out thanks to the Archimedes method on one metallographic part of each building area against a theoretical density of 2.67 g.cm−3. A Metler Toledo balance was used with distilled water, to which a few drops of wetting agent were added. The density was calculated by the following formula:
ρ s a m p l e = m a i r m a i r m w a t e r   ( ρ w a t e r ρ a i r ) + ρ a i r
where mair is the mass of the sample in the air, mwater is the mass of the sample fully submerged in water, and ρ water and ρ air are water and air densities, respectively. Three measurements were made to determine the masses in air and water. The density was calculated with an error of ± 0.002 g.cm−3.
The preparation of the metallographic samples consisted of the selection of cross-sections (XY or XZ), mechanical polishing with SiC grit papers, and a final polishing with colloidal alumina (3 µm) and colloidal silica (0.25 µm). Finally, the samples were etched using a Keller reagent for 5 to 15 s. The prepared surfaces were observed using an Olympus PMG3 (OM; Olympus France SAS, Rungis, France), a ZEISS EVO HD15LS (SEM; ZEISS, Paris, France), and a JEOL JSM-7000F (FEG-SEM; JEOL, Paris, France) to characterize the cellular network.
Different heat treatments were also carried out in a Nabertherm furnace (Nabertherm, Lilienthal, Germany): a T5 heat treatment at 170 °C with air cooling and a T6 treatment (8 h solution heat treatment at 540 °C followed by a 6 h ageing at 170 °C and air cooling). The T6 treatment was defined following the industrial recommendations for cast products.
The thermal behavior was investigated by differential thermal analysis (DTA) to detect thermal peaks related to phase transformations/precipitation phenomena. Tests were performed on the as-built specimens at different fabrication heights for zones 2 and 4, the solution heat-treated (SHT) samples, and the T6 samples. For each zone, the 60 mm metallographic parallelepiped was XY cross-sectioned every 10 mm. A DTA specimen was extracted from each cross-section bloc and prepared to fulfill the size and mass (around 50 mg) requirements. Tests were realized under Argon flow on a SETARAM Instrument device (SETARAM Instrument SAS, Caluire, France) according to the thermal cycle computed in the Calisto SETSYS software (Version 1.12, SETARAM Instrument SAS, Caluire, France) (5 °C/min heating rate until 400 °C, 5 min holding time, and 5 °C/min cooling rate). The number and position of exothermal peaks were considered on the recorded and normalized signal.

3. Results

3.1. Density

The density measurements were realized for the metallographic samples of each production area (Table 2). The relative densities were high, meaning that printed parts were almost dense. Considering the position of the parts on the platform, the relative density was constant, except for zone 2 where it was lower. This lower density could have come from a higher porosity rate in this zone since it was in the middle and could undergo a higher heat accumulation leading to an increase in pore size by the diffusion of trapped hydrogen, or from a different roughness modifying the wetting.

3.2. Mechanical Properties
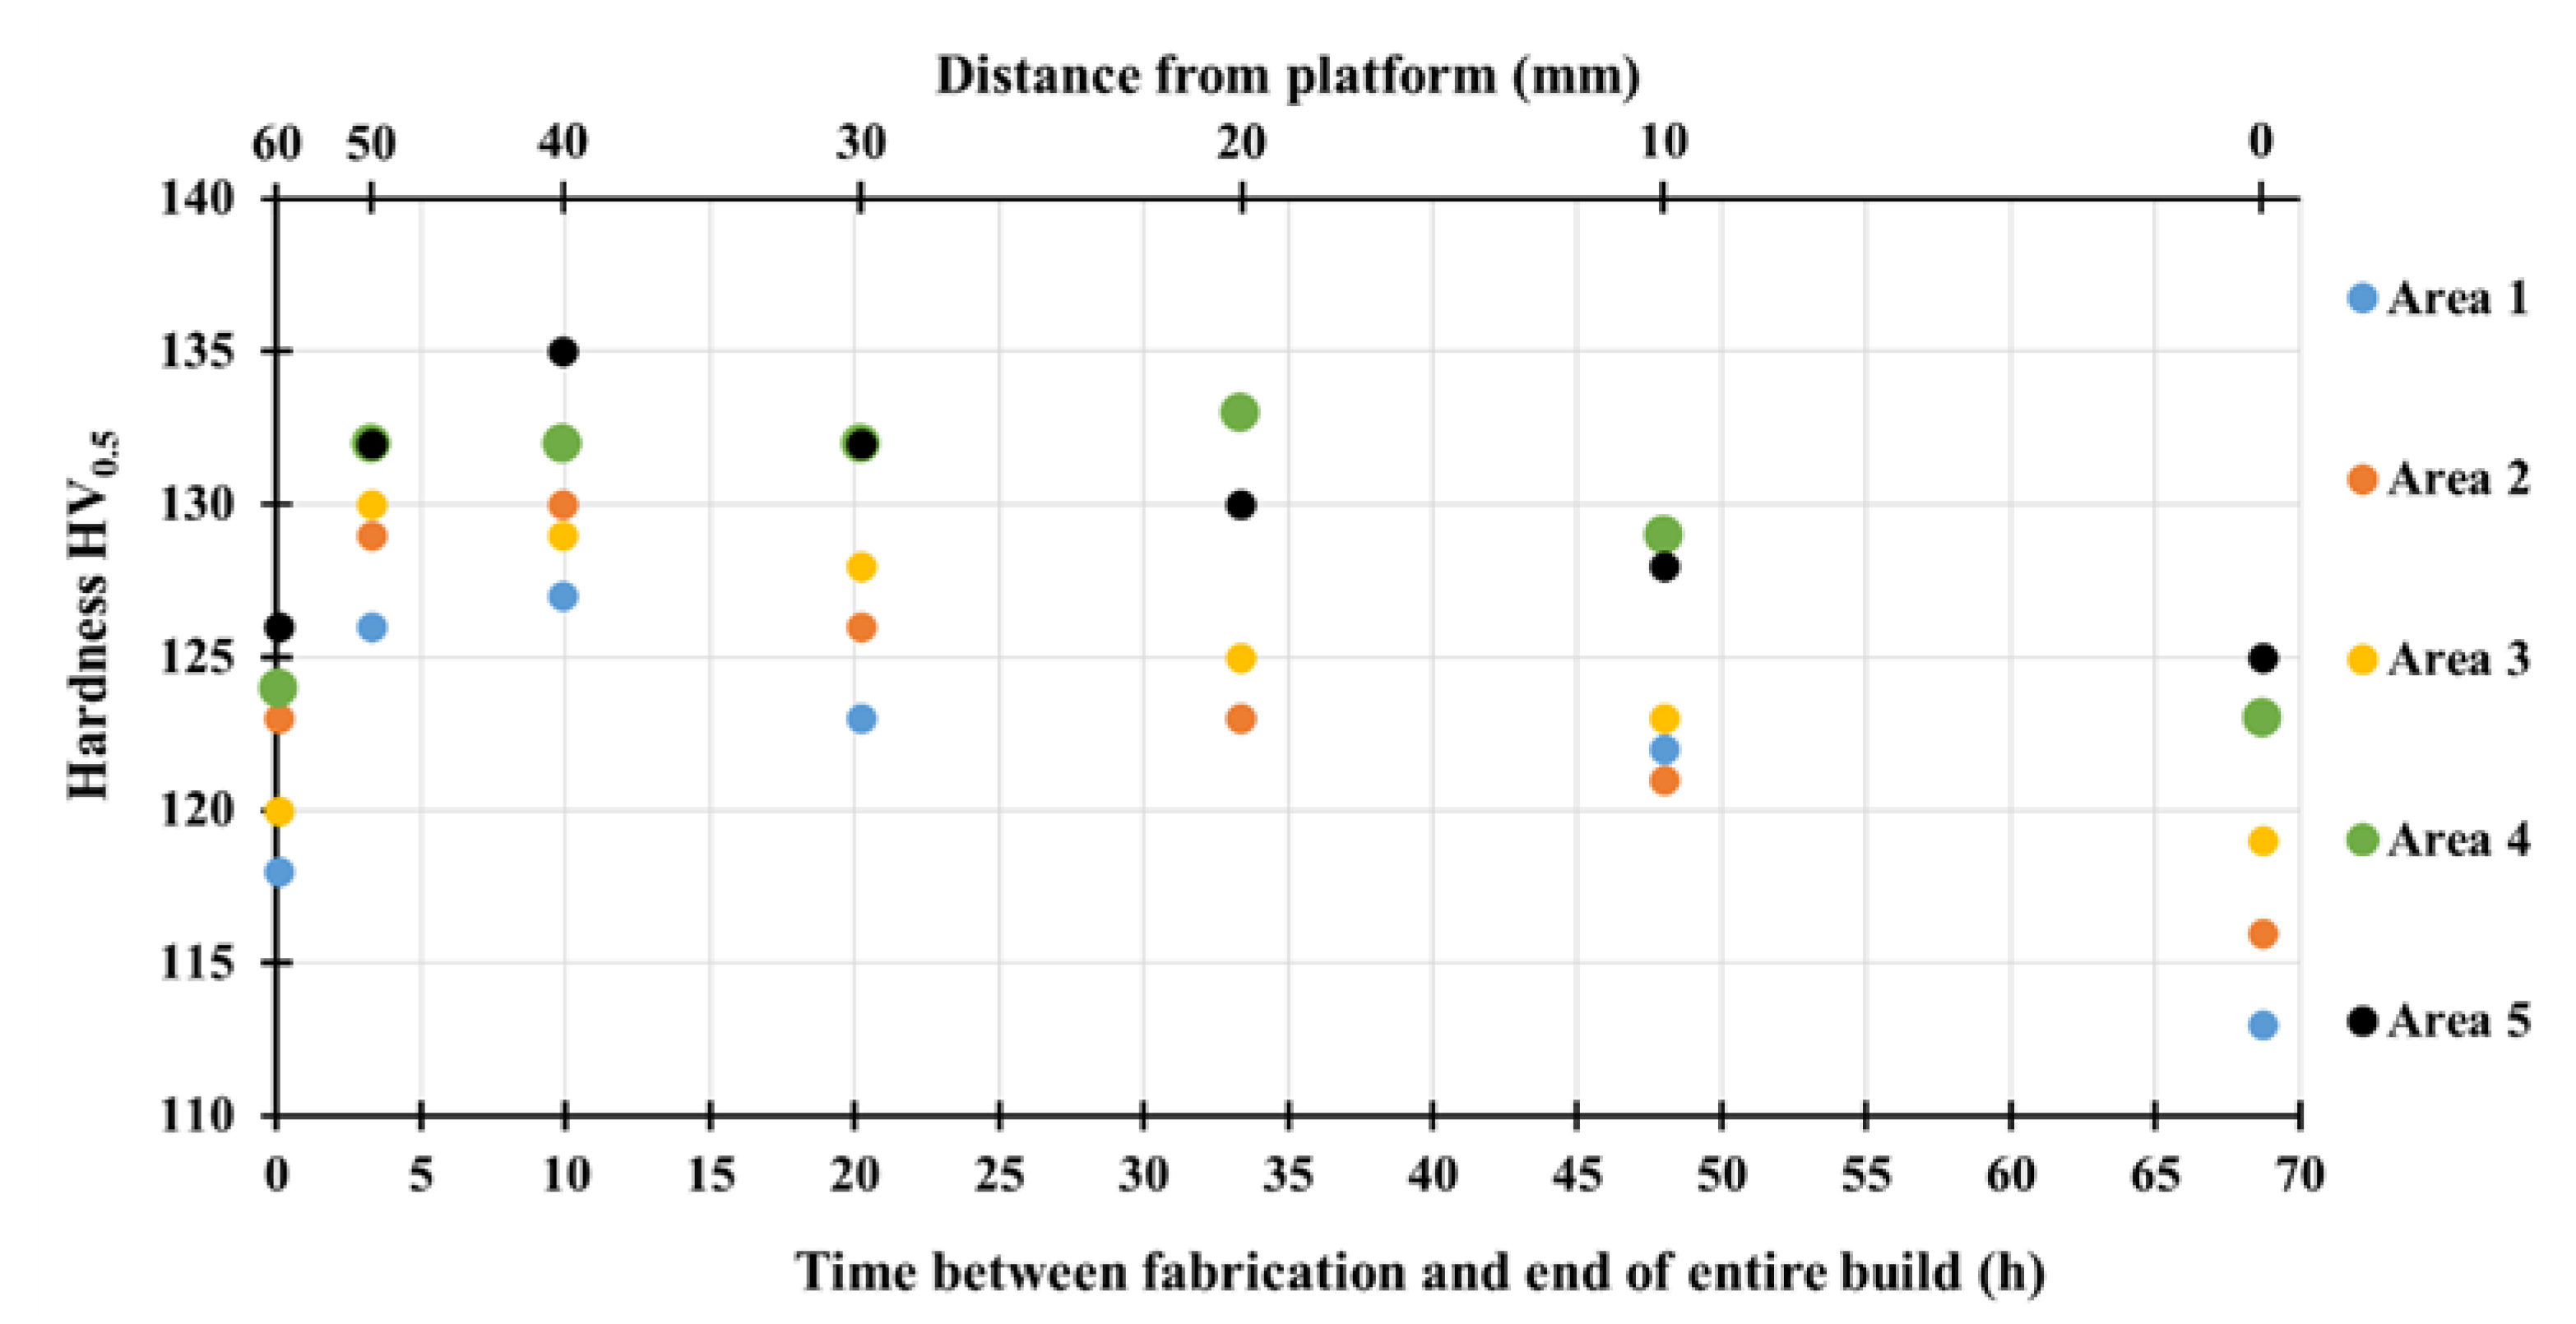
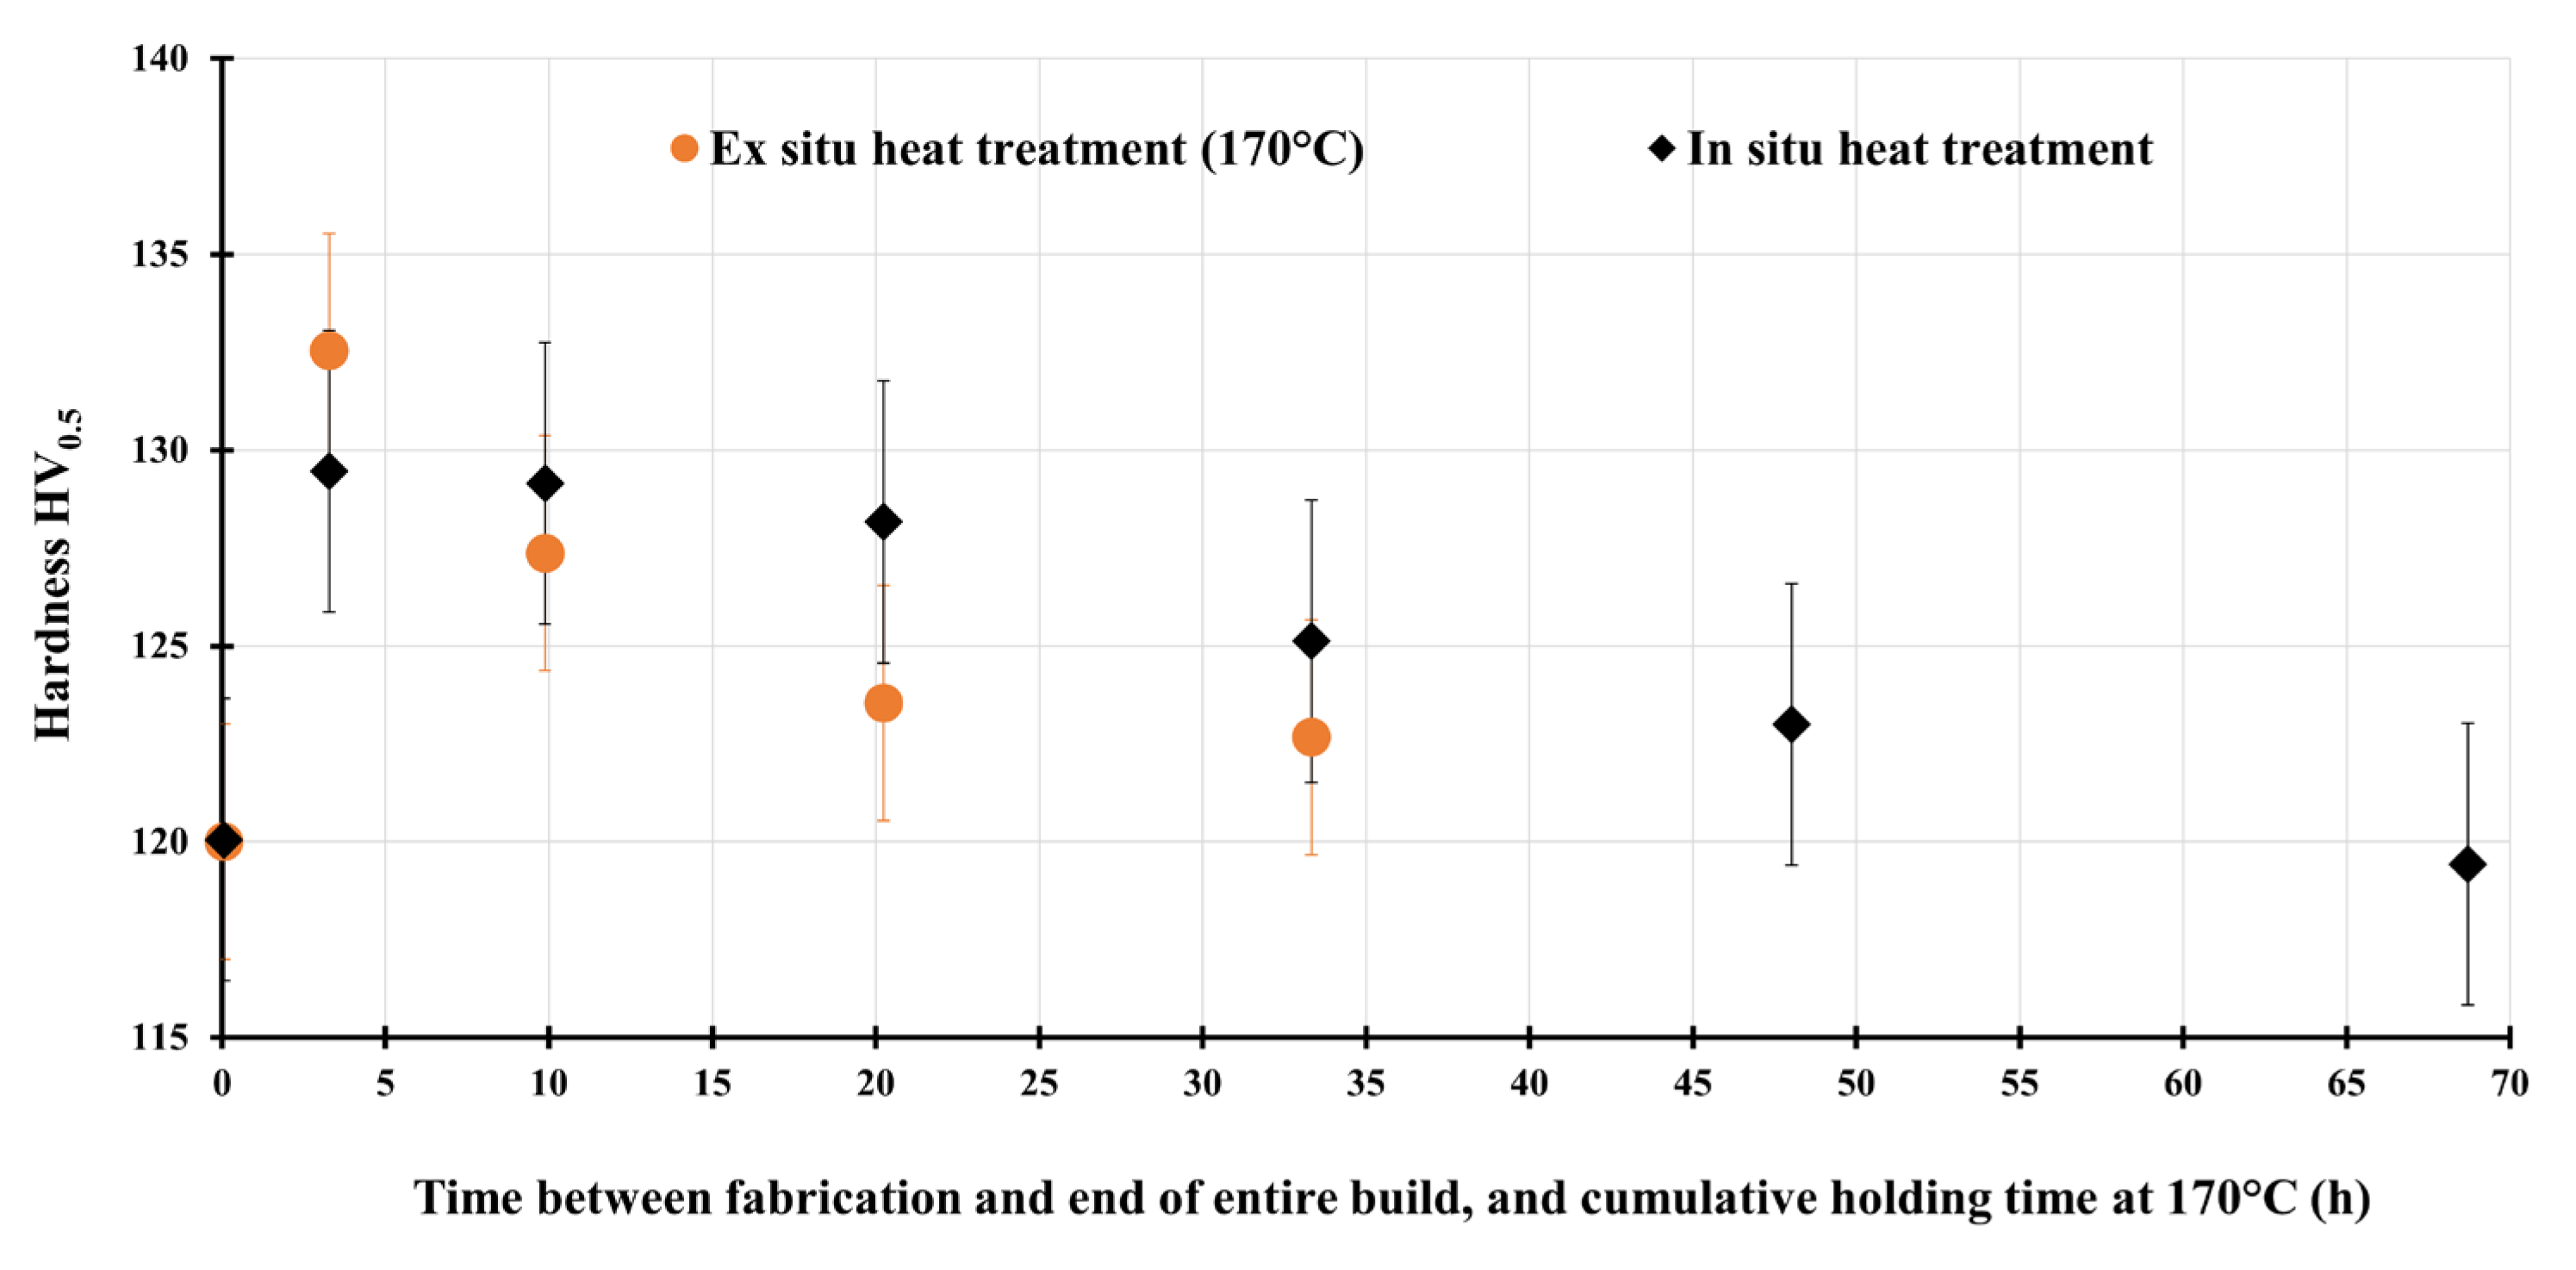
3.2.1. Hardness

The average hardness for each orientation considered and for each production area is illustrated in Figure 2. For the XZ cross-sections, the hardness tests were realized with respect to the building height (300 measurements). For the XY cross-sections, the measurements were carried out on the cross-sectioned surfaces every 10 mm over a distance from 0 to 60 mm from the building platform. At least 30 measurement points were made for each surface.
For each building area, the average hardness of the XY cross-section was higher than that of the XZ cross-section. Moreover, a difference seemed to appear between the “central band” (areas 1 to 3) and the border bands (areas 4 and 5). It would seem that on a small scale, a gradient of properties existed between the center and the border of the building plate relative to the direction of gas flow.
Some authors have noticed that α-Al grains present directional growth in accordance with the heat flow direction. Columnar grain structures form along the building direction inside the melt pools. At the melt pool centerline, elongated grains grow, whereas at the melt pool borders, smaller equiaxial grains nucleate and grow competitively [11,13,21,22]. Elongated grains, formed through epitaxial growth, present specific crystallographic orientations: in the <100> direction parallel to the thermal gradient direction and in the <001> orientation parallel to the scanning direction according to Thijs et al. and Liu et al. [11,13,22]. Considering these morphological and crystallographic considerations, it appeared that during the hardness test, different types of grains were solicited depending on the surface considered. Moreover, the image analysis revealed that the melt pools exhibited a width of 90 µm for the XY cross-sections, and a width and a height of 146 and 45 µm, respectively, for the XZ cross-sections. In addition, with a load of 500 g, the hardness imprint diagonals measured 82 µm on average. This suggested that when the hardness tests were performed on the XY cross-sections, the indent solicited a more textured structure than it did on the XZ cross-sections. Thus, the XY cross-section hardness was higher than that of the XZ cross-section.
Nano-indentation measurements were carried out at different building heights in the XY cross-sections for the sample in area 1. The results are presented in Table 3. There was no evolution of Young’s modulus, which was consistent with crystallographic considerations. However, there was a gradient of hardness. This means that a gradient of small-scale properties existed within the height of the product, with differences between the bottom and the top of the build.

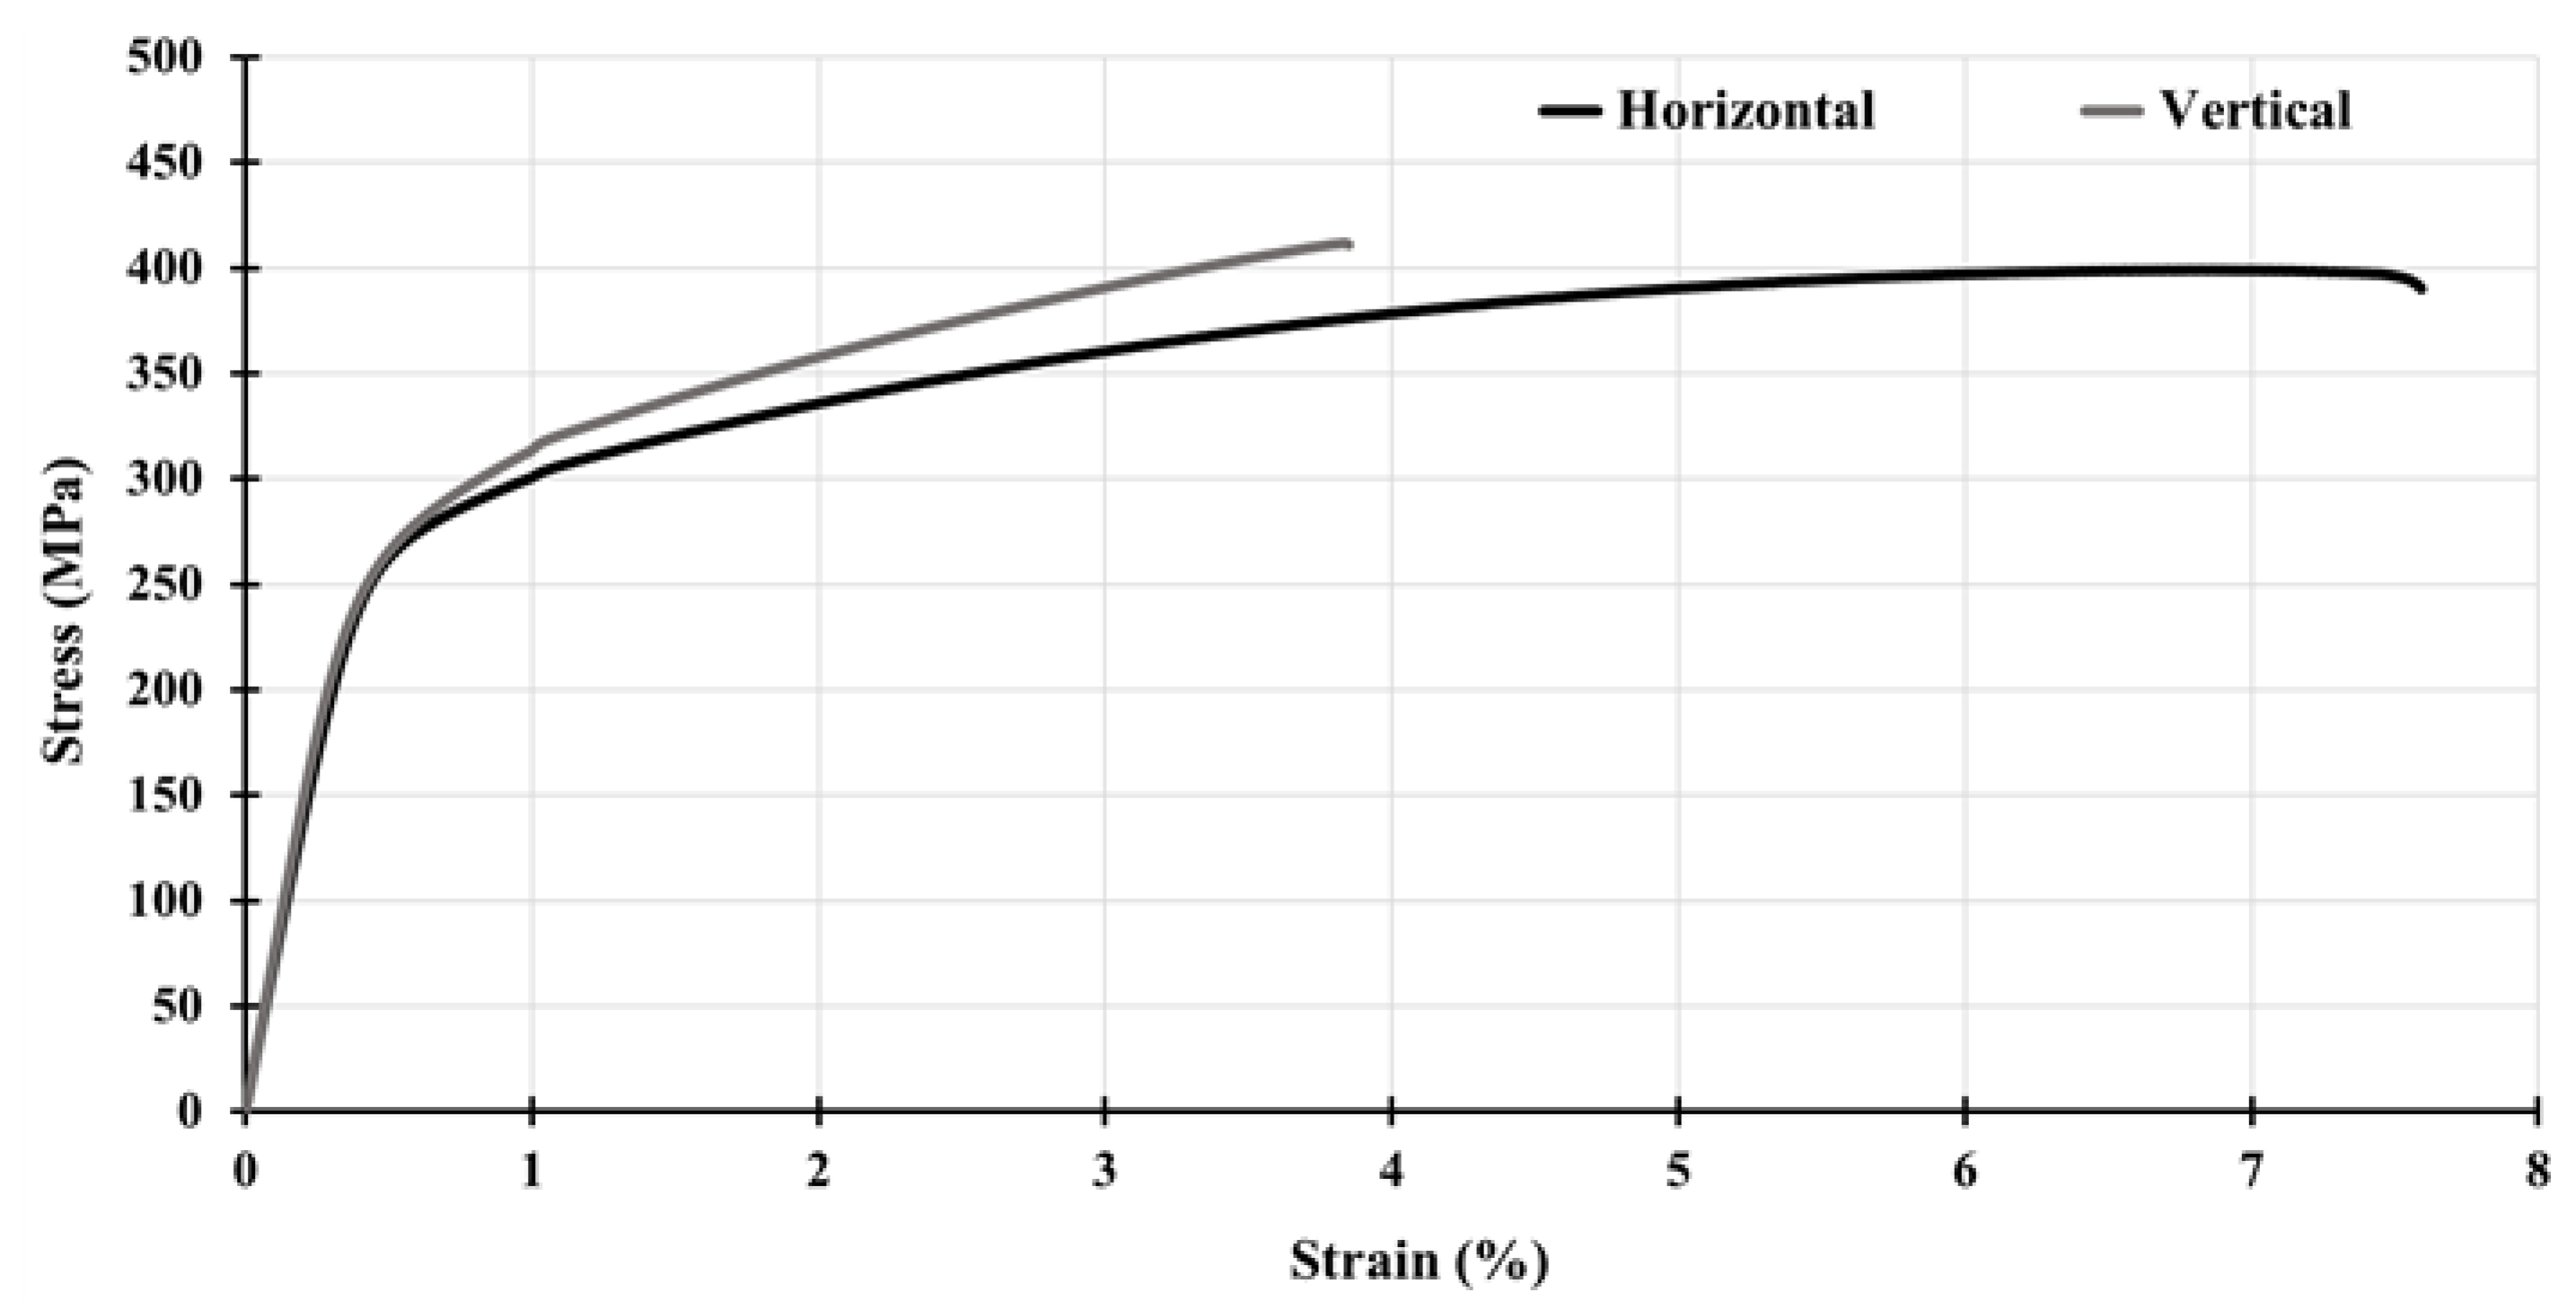
3.2.2. Tensile Properties

The tensile properties obtained are exhibited in Table 4 and are also shown by the stress–strain curves in Figure 3. During the tensile tests, the samples did not present any necking, and the associated curves do not display any stress reduction before fracture. The horizontally oriented samples presented the highest ductility but the lowest ultimate tensile strength (UTS). The vertically oriented specimens presented the highest UTS but the lowest elongation at fracture. The tensile behavior seemed, therefore, to be anisotropic. However, Young’s modulus was independent of the orientation considered. Thus, the elastic behavior was isotropic, whereas the plastic behavior was anisotropic.
The tensile properties obtained by considering the area where the specimens were fabricated are shown in Figure 4. For the horizontally oriented specimens, which were all printed directly on the platform, the yield strength (YS) and UTS seemed to be higher for areas 4 and 5, whereas the fracture elongation seemed higher for areas 2 and 3. In the opposite orientation (vertical), the yield strength was constant as a function of the production area, but the UTS was higher for areas 1 to 3. Areas 2 and 3 presented the highest fracture elongation for the latter orientation. It seemed that a slight inhomogeneity of the tensile properties appeared according to the building areas.
SEM fractographies of the tensile specimens were performed to characterize the fracture behavior (Figure 5). The low magnification fractographic observations confirmed the absence of necking in the specimens. At higher magnifications, the fracture surfaces present small dimples, which is typical of ductile fractures. At this scale, the differences between the two orientations were only visible in terms of the orientation of the cells, i.e., elongated and equiaxed in the horizontally and vertically oriented samples, respectively.

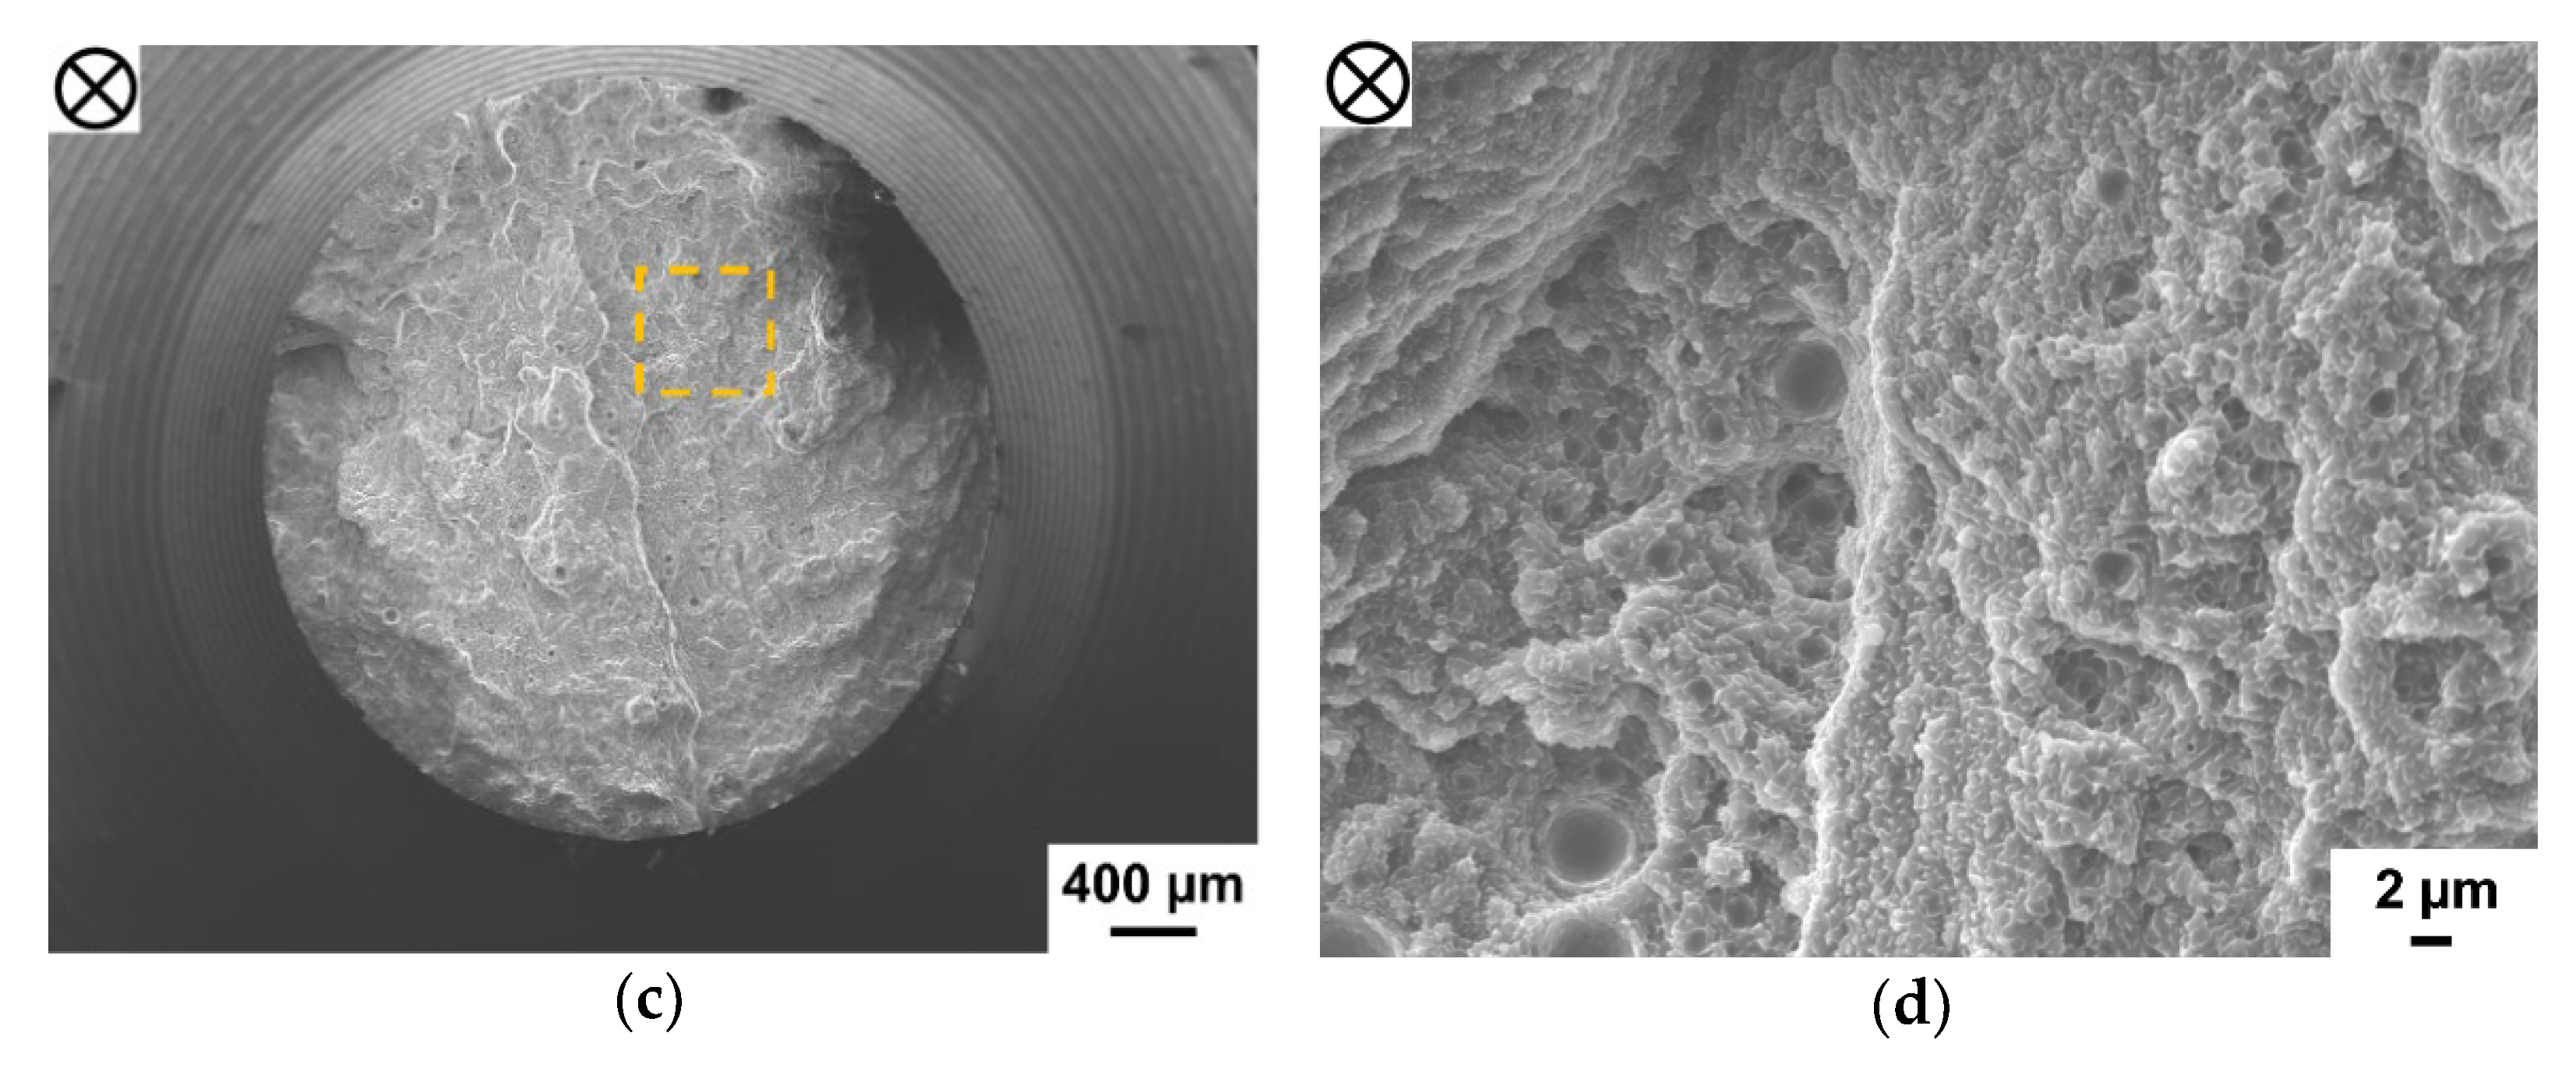
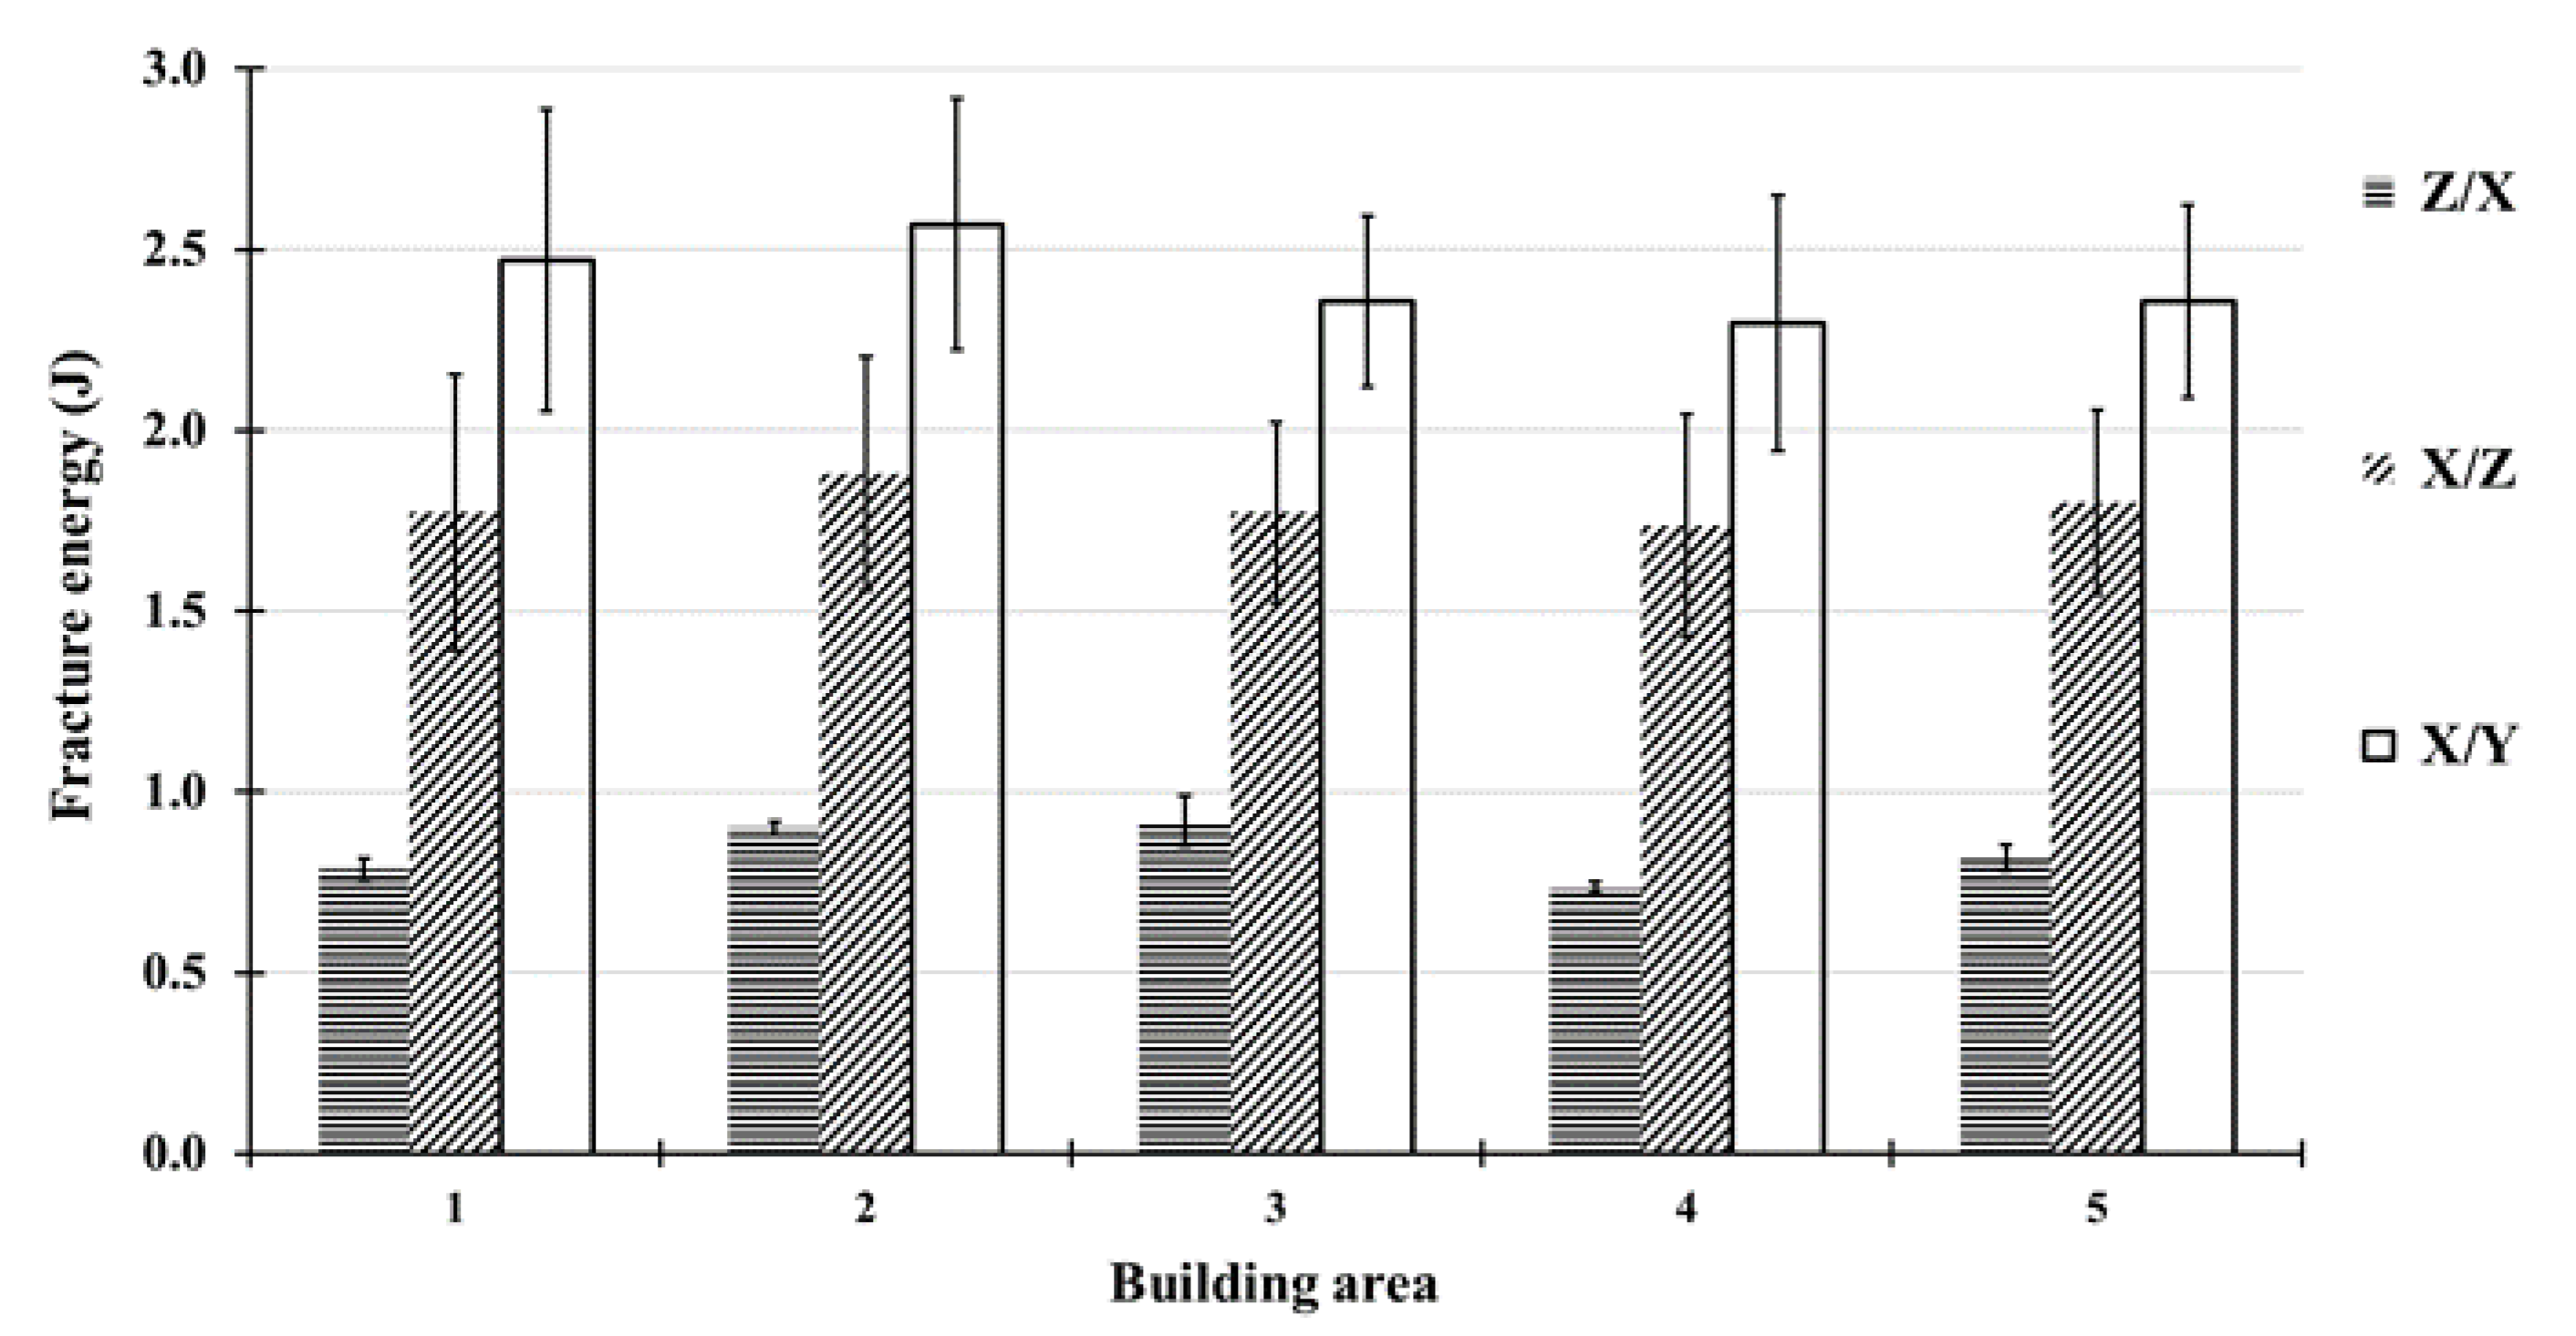
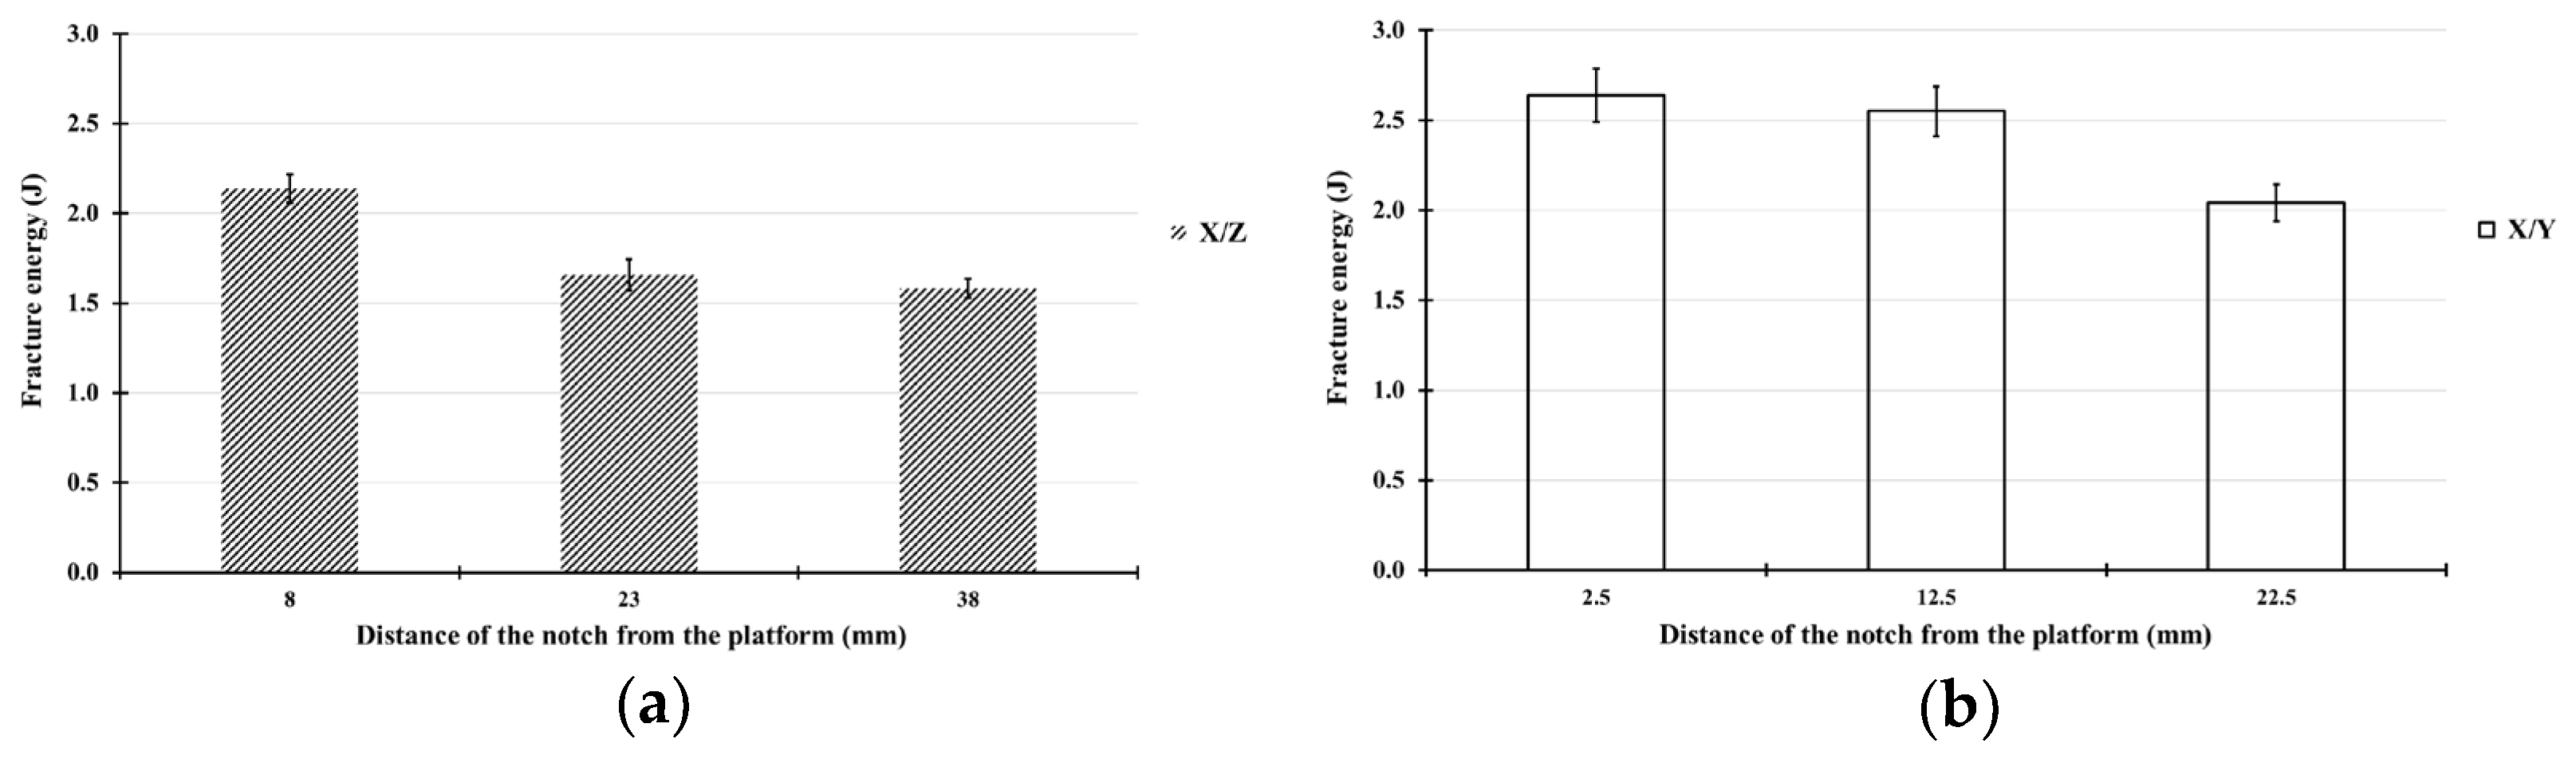
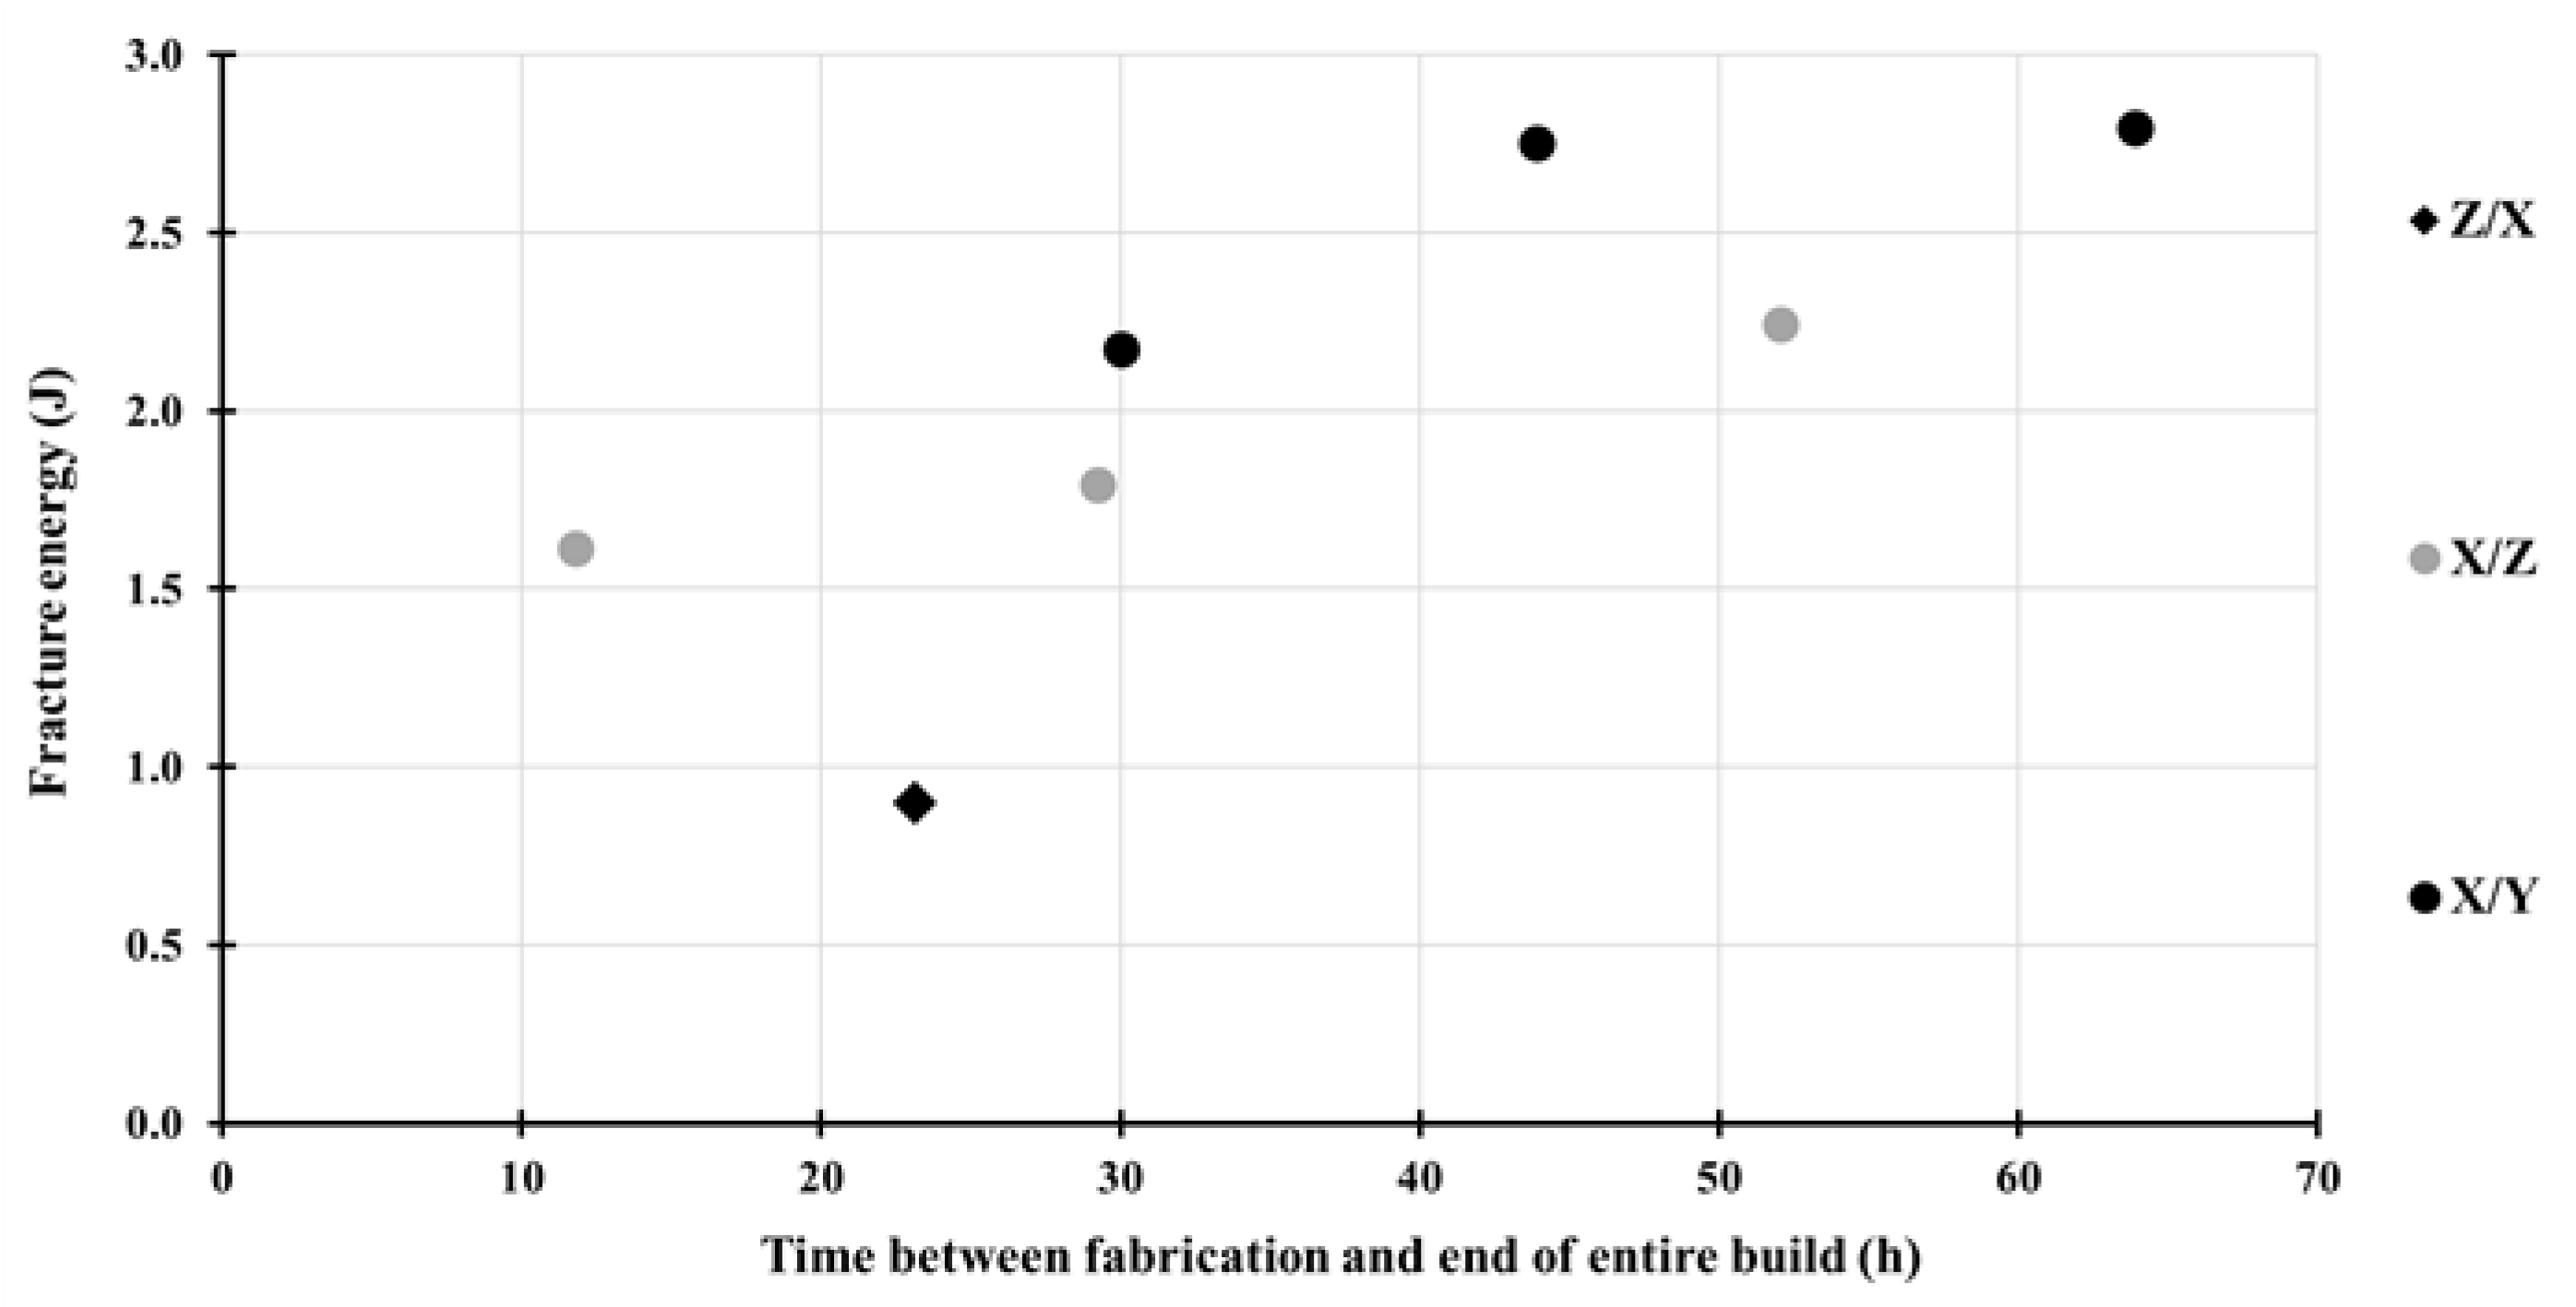
3.2.3. Impact Toughness

Charpy tests were conducted in the different building and notch orientations presented in Figure 6. It is worth mentioning that for the X/Z and X/Y configurations, the three specimens tested were superposed in terms of the building height.
When considering, first of all, the manufacturing orientation, it was noticed that fracture energies depended on it (Figure 6). The horizontally oriented (X/Z and X/Y) and vertically oriented (Z/X) specimens exhibited the highest and lowest fracture energies, respectively. When the fracture energy was higher, the material was more resistant to crack initiation and propagation. By linking with the tensile properties, it was shown that the horizontally oriented samples presented the highest fracture elongation. A parallel can be made here between the two properties: a material that is resistant to crack initiation and propagation must be able to deform further before fracture. The material’s behavior nevertheless appeared anisotropic for this test. Then, by looking at the influence of the notch orientation, only X/Z and X/Y were considered. For the two configurations with the building orientation X (horizontal), the fracture energies were different as a function of the notch orientation; the highest was obtained for the Y-oriented notch. This was attributed to the different fracture paths within the microstructure in the case of the CT tests [23]. The cracks tended toward the melt pool borders in the X/Z samples, whereas they had to go through the melt pools in the X/Y specimens. The X/Z and X/Y fracture energies had the highest standard deviation in comparison with all the specimens considered. Finally, no dependence of the fracture energy on the building area appeared.
Since the X/Z- and X/Y-oriented specimens were superposed and there was little difference in the fracture energy between the production areas, the evolution of the energies could be seen as a function of the notch height. The results are presented in Figure 7. Each fracture energy is the average of the five samples distributed over the building area. The results showed a reduction in the standard deviation, meaning that at a fixed notch height, the properties were almost homogeneous in a cross-section. Moreover, for each orientation, the results exhibited a reduction in the fracture energy with an increase in the notch distance from the platform. For the X/Z specimens, the decrease was higher, it being between 8 and 23 mm as opposed to between 23 and 38 mm. For the X/Y specimens, the decrease was higher between the last two samples. Therefore, a fracture energy gradient existed in the manufacturing height: the closer the sample to the platform, the higher its fracture energy.

4. Discussion

4.1. Effect of Sample Positioning on Fabrication Plateform

Looking at the hardness values as a function of the position on the platform, the mean values seemed to be quite different between the center (areas 1 to 3) and borders (areas 4 and 5) of the building plate, especially for the XZ cross-sections. A slight difference also appeared in the tensile properties, where the horizontal specimens exhibited higher YS and UTS values in areas 4 and 5. Nevertheless, when the fracture strain and vertical properties (YS, UTS, and fracture strain) were considered, the trends tended to reverse. There seemed to be a slight disparity in the properties according to the production area, without a general rule. Some authors have reported higher differences and attributed them to density/porosity differences between the production areas. These porosity fluctuations were linked to heterogeneities in the spatter distribution [24,25]. However, in this study, no variation in the density was reported, except for area 2, which had a lower relative density but did not present a drop in elongation, as noted by [24]. Moreover, the fracture energies as a function of the building and notch orientations did not evolve as a function of the production area. Finally, a heterogeneity in certain properties existed within the product and should be considered. Since the platform was preheated, it is possible that some of the differences came from this building parameter.

4.2. Effect of Sample Positioning on Height

The nano-indentation measurements revealed a gradient in the micro-hardness with respect to the fabrication height (Table 3). In addition, a gradient in the fracture energy for the X/Z and X/Y specimens also appeared as a function of the distance from the platform (Figure 7). Since the building height was recorded as a function of time, it was thus possible to calculate the time between the building of a layer and the end of the fabrication (“remaining building time” or “holding time”). The hardness mean values for each XY cross-section are represented as a function of this “remaining time” in Figure 8. The hardness HV0.5 profile plotted seemed to evolve. For more clarity, the standard deviations are not represented for each point but were equal to 5 HV0.5 on average. Firstly, there was an increase in the hardness during the last 10 h of production for every area. Then, a hardness plateau was present, which was followed by a decrease when the time increased above 30 h. These curves were reminiscent of the aging curves of aluminum alloys as a function of time at a given temperature. A difference between the production areas was visible for the same building height, with the hardness of area 1 being lower than the hardness of area 5. The differences could be attributed to differences in temperature, especially at the bottom of the product. The representation of the ageing curve was also true to some extent but was less marked for the hardness measurements in the XZ plane (not presented here). This trend was seen by Maamoun and co-authors with a preheating temperature of 200 °C along the building direction; for 10 mm samples, the hardness increased from 100 to 120 HV while moving away from the platform [26]. The same results were found by [14] with a platform preheating of 150 °C and two different manufacturing times (13 and 50 h). On the other hand, some authors did not find any variation with preheating temperatures of 150 °C, 160 °C, and 200 °C [19,27,28]. Furthermore, their studies showed a decrease in hardness between the building bottom and top. Nevertheless, the manufacturing times were lower for the studies in [27,28] and were identical for the study in [29] but at lower temperatures. Thus, the preheating temperature and the number of samples on the platform play a role in the hardness evolution as a function of the distance to the manufacturing platform. This conclusion is shared by [14].
The same representation as a function of time could be carried out for the impact toughness. The height of the notch was considered as the reference height for considering the rupture energy. Thus, the evolution of the fracture energy as a function of the time between the fabrication of the notch-height layer and the end of the building is plotted for every orientation in Figure 9 for area 2. It is worth noting that for the X/Y and X/Z samples, the three samples were superposed for fabrication. The graph shows an increase in fracture energies when the specimens were close to the platform. On the other hand, by focusing on the points around the 30 h mark of manufacturing, the effects of anisotropy of the building and notch orientations are highlighted.
The hardness and fracture energy evolutions may be linked to a thermal gradient over the fabrication height. The platform was preheated and maintained constant at 170 °C during the production process; in situ ageing was assumed to occur during the fabrication.
This information has already been reported by Aversa and co-authors with different building platform temperatures (100, 140, 170, and 190 °C) [18]. They concluded that preheating at 100 °C resulted in under-ageing, whereas preheating at 190 °C implied over-ageing. Casati et al. found that a hot platform (160 °C) induced over-aging effects without any improvement in mechanical properties after direct heat treatment [19].
The evolution of the microstructure revealed in Figure 10 was further evidence of this in situ ageing. Some authors reported that when no preheating was applied, the cellular microstructure was described as cellular with a Si-rich eutectic phase. On the other hand, when preheating was set up at a temperature above 160 °C, the microstructure was coarser: the coarser and HAZ melt pool zones were larger, the Si-rich network was coarser in terms of the equivalent diameter. and the Si-rich particles inside the Al-cells were larger than those without preheating [19,30]. In the present case, there was no modification of the melt pool structure (Figure 10a,b) nor of the cellular structure (no enlargement of the cells was visible) (Figure 10c,d), but Si precipitation inside the cells was noticed at the bottom of the product (Figure 10e,f). Thus, it seemed that the microstructure gradient with respect to the fabrication height approached the preheated and non-preheated characteristics from bottom to top.
Finally, a question was raised: could the in situ ageing temperature be 170 °C? First, to answer this question, a sample taken from the last 10 mm of the building process underwent different thermal treatments at 170 °C. The processing times were selected in such a way as to reproduce the in situ treatment of the product by ex situ direct ageing. The ex situ curve is shown in Figure 11. This ageing curve exhibited a higher peak hardness and a steeper decay after the peak than for the in situ curves. The artificial ageing treatments performed at different temperatures revealed that a lower ageing temperature resulted in a lower and later peak with respect to the ageing time [31,32,33,34]. Then, Hitzler et al. carried out temperature measurements: when the platform was preheated to 200 °C, the temperature was equal to 130 °C at 10 mm from the building platform [28]. This showed that this in situ ageing could not occur at 170 °C. Therefore, the in situ ageing treatment may be a non-isothermal ageing with respect to the manufacturing height.
It has been reported that when a 150 °C preheating is chosen, the bottom and top hardness do not have the same mechanical response to a 170 °C ageing; whatever the direct ageing temperature (175, 200, or 225 °C), the hardness values from the bottom only decrease with time while hardness at the top can achieve a maximum with an ageing temperature of 175 °C [28,29]. There is then a difference in the hardening potential between the top and bottom of a fabrication. To determine the potential difference within the building height, DTA tests were carried out on 10 mm sections distributed over the height. The DTA curves for area 2 are plotted in Figure 12. These curves were similar when another area was considered. DTA analyses were performed to highlight the precipitation sequence of the alloy. The exothermic and endothermic peaks were due to the manifestation of precipitation and dissolution transformations, respectively. This technique is a tool to visualize the presence or absence of a transformation without quantifying it. In the literature, it has been reported that exothermic peaks related to the formation of GP, β’’, β’, and β occur around 100, 250, 300, and 500 °C [6,35,36,37,38,39].
The DTA curves of the solution heat-treated and water-quenched samples exhibited three exothermic peaks at 80, 227, and 272 °C. It is reasonable to attribute the first two peaks to the formation of atom clusters and the formation of the strengthening phase, β’’ [6]. In the T6-treated sample curve, the β’’ peak did not appear anymore since this treatment aimed to generate β’’ precipitation. The third peak of the solution heat-treated sample record was associated with β’ precipitation. This phase did not form during the T6 treatment and was therefore observable on the T6 DTA curve. A slight difference was seen in the position of the β’ peak temperature between the SHT and T6 treatments. It is supposed that the thermal history of a sample before DTA analysis (water quenched or peak-aged) may modify the precipitation sequence by favoring the precipitation of β’ if the precipitation sequence is already initiated [40].
The DTA analysis carried out in this study showed a precipitation sequence as a function of the distance from building platform. They did not exhibit any endo/exothermic transformation peak during cooling, and cooling was therefore not represented. This absence of a peak during cooling means that the realized transformations during heating were irreversible [41]. The DTA curves as a function of the building height presented, in general terms, the same behavior but did not represent the same precipitation sequence. Indeed, the curves for the last 20 mm showed three exothermic peaks of precipitation against two for the lower heights. The last 20 mm curves presented a shape that could be attributed to the SHT heat treatment, whereas the other heights exhibit DTA curves close to the T6 curve. With these results, it can be considered that the platform preheating at 170 °C led to a precipitation sequence gradient with respect to the fabrication height.
The as-built samples peaks were shifted to higher temperatures (Table 5) in comparison with the SHT and T6 treatments but were in accordance with the as-built specimens presented in [40,42], especially for the peak around 240 °C. It was nevertheless possible to assign the 240 °C peak to β’’ precipitation. The shift in the β’’ formation was attributed to the very-fine microstructure of the as-built material, which could have influenced the diffusion process [40]. As reported by several authors, the solidification rates achieved during the L-PBF process were very high and higher than the SHT water-quenching rate. Silicon was contained above the solubility limit in the Al matrix. This supersaturated solid solution was the precipitation basis for activation by heat treatments. Furthermore, it has been shown that the supersaturation state of a solid solution varies with the distance to the platform; the solubility of Si in the Al matrix increases along the building height, and Mg2Si precipitates have been found at the bottom of the build in an un-treated state [26,43,44]. This means that a 170 °C-preheating allowed the formation of a supersaturated solid solution at the top with a hardening potential and an over-aged solid solution at the bottom with no β’’ hardening potential. During the fabrication, precipitation already took place at the bottom. This was in good agreement with [18,19], who looked for hardening potential in un- and preheated platforms.
The last peak recorded at around 310 °C could be attributed to β’ [6,45]. More recently, this peak was analyzed by [42] on the basis of activation energy by DSC. The energy calculated for this peak is of the order of magnitude of the diffusion energy of silicon in aluminum. They thus attributed this peak to Si precipitation (the rupture of the Si network and spheroidization). Then, this peak was attributed to the superposition of two phenomena: the precipitation of β’ and the precipitation/spheroidization of Si [46,47]. As for the β’’ precipitation peak, it could be assumed that this β’ precipitation could be shifted to the highest temperatures. Moreover, since the supersaturated solid solution is in favor of Si precipitation due to the higher driving force and that cell boundaries act as nucleation sites, Si precipitation could occur at lower temperatures [48]. Thus, the Si precipitation peak could be superimposed with β’ precipitation, and even more with the higher preheating temperature used in this study compared to other studies [40,42,47]. Finally, the last peak, recorded around 310 °C, could be associated with β’ and Si precipitation. This conclusion was confirmed by the two different heat treatments, with a heating of 5 °C/min until either 230 °C or 320 °C followed by water quenching. These two temperatures were chosen to look at the microstructures at the precipitation peaks. The microstructures revealed (Figure 13) a non-modification of the cellular structure with a heating up to 230 °C, whereas at 320 °C, the cellular network was in the process of spheroidization.
The hardness and hardening potential (precipitation sequence) evolutions with respect to the building height could be connected; a gradient of reinforcement existed between the top and bottom of the product under this study’s conditions. For the 170 °C preheated fabrication, the cellular structure changed from an over-aged cellular structure with no hardening potential at the bottom to a cellular structure with a supersaturated solid solution and hardening potential. Thus, the hardening mechanisms evolved from the bottom to the top as follows: a reduced cellular structure associated with overaged precipitation, a cellular structure with hardening precipitation (hardness peak), and a finer cellular structure associated with solid solution strengthening.

5. Conclusions

In this study, the influence of platform preheating at 170 °C on the mechanical and microstructural properties of an AlSi10Mg alloy processed by L-PBF was investigated. The mechanical properties were evaluated in terms of the hardness, tensile behavior, and fracture energies through Charpy impact tests.
  • The mechanical tests showed the anisotropic behavior of the printed material: the XY-cross-section hardness was higher than the XZ hardness, and the horizontal orientation presented the highest ductility and fracture energies and a reduced UTS in comparison with the vertical specimens.
  • The microstructural characterizations exhibited the presence of two phases, i.e., Al and Si, regardless of the building height considered. Nevertheless, the cellular network evolved as a function of the building height: Si precipitation inside the Al cells appeared at the bottom of the product while this was not seen at the top. Moreover, the hardness in the XY and XZ-cross-sections also varied as a function of the distance from building platform. The evolution of the hardness was represented by an in situ artificial ageing (T5 heat treatment) curve from top to bottom characterized by an increase in the harness, a plateau, and a decrease. The temperature of this in situ heat treatment was estimated under a preheating temperature of 170 °C.
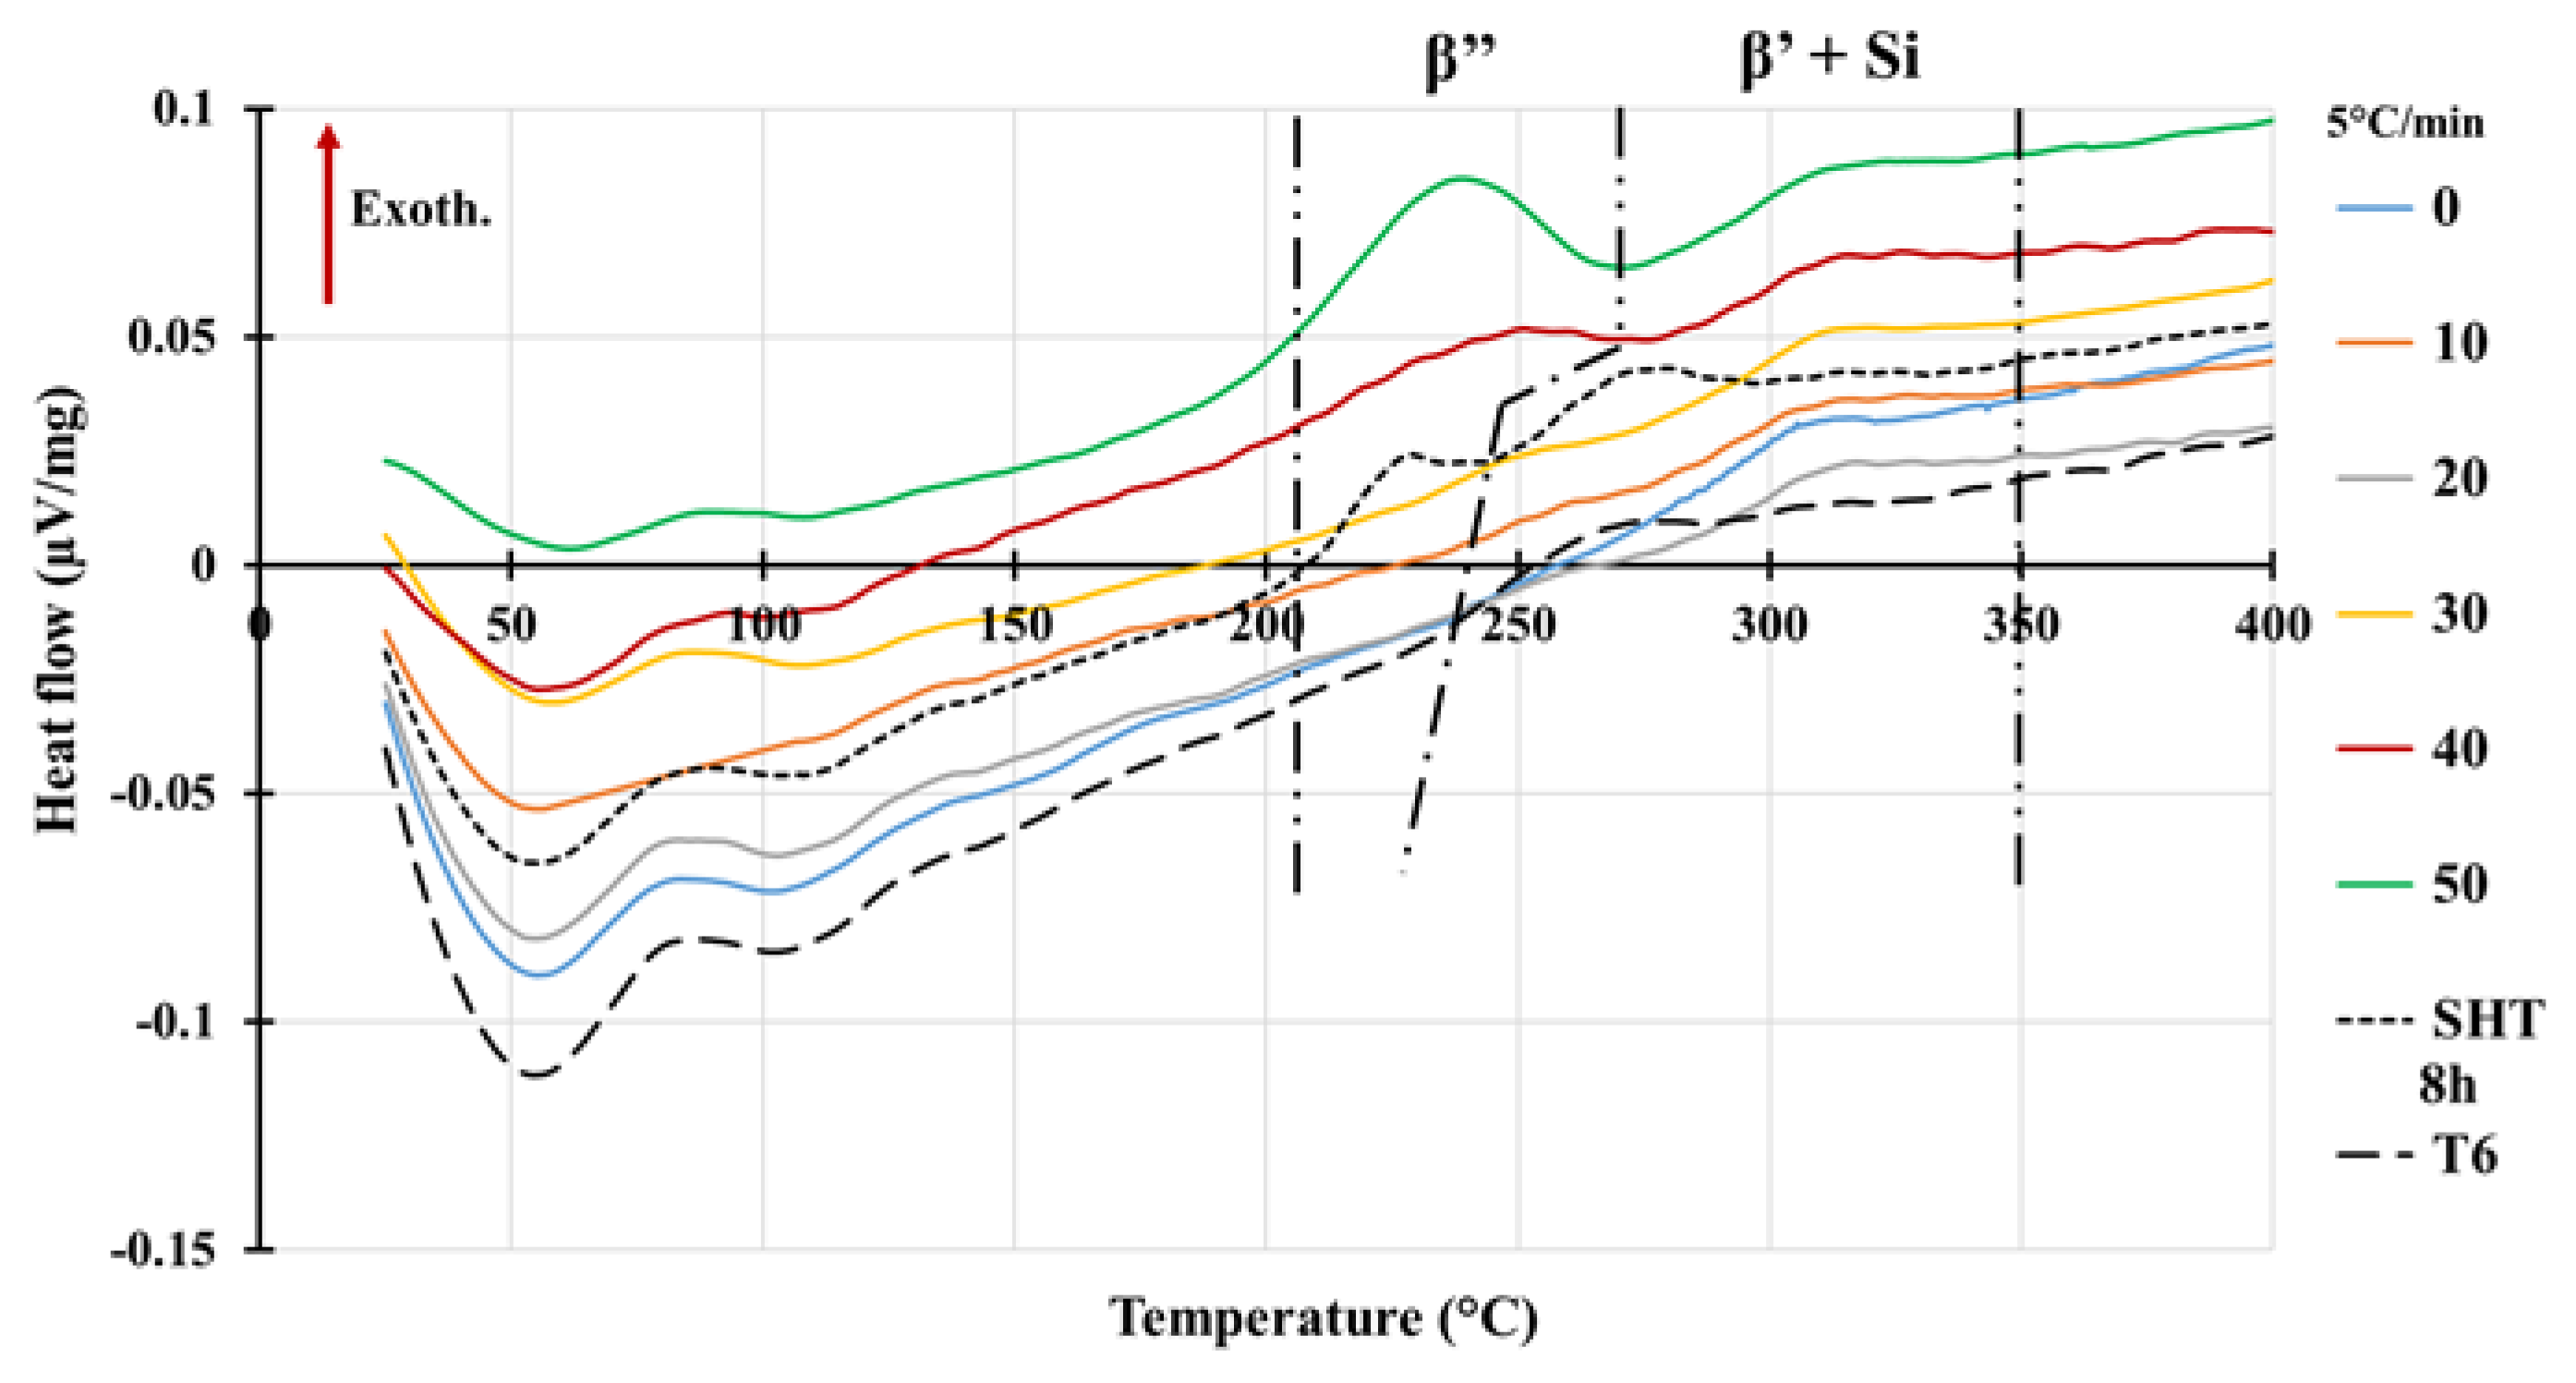
  • A differential thermal analysis was performed under SHT and T6 conditions and on the samples spread over the building height. These tests exhibited differences in the precipitation sequence as a function of the distance from the building platform. At the bottom, only β’ and Si precipitations were possible, whereas at the top, the hardening potential was complete. Finally, at the bottom, the hardening mechanisms providing the estimated hardness arose from an L-PBF over-aged microstructure associated with Si and β’’/β’/β’ precipitation, while at the top, they were generated by the cellular network combined with a supersaturated solid solution.

Author Contributions

Conceptualization, N.C., O.D. and J.A.; methodology, N.C., O.D. and J.A.; validation, N.C., O.D., J.-M.C., O.B. and J.A.; formal analysis, N.C.; investigation, N.C.; writing—original draft preparation, N.C.; writing—review and editing, N.C., O.D., J.-M.C., O.B. and J.A..; supervision, O.D., O.B. and J.A.; project administration, O.B. and J.A.; funding acquisition, J.A. All authors have read and agreed to the published version of the manuscript.

Funding

This research was funded by ANRT (Association Nationale de la Recherche et de la Technologie), grant number CIFRE N°2019/0751.

Institutional Review Board Statement

Not applicable.

Informed Consent Statement

Not applicable.

Data Availability Statement

Not applicable.

Acknowledgments

The authors would like to thank Morgane Mokhtari, Nathalie Aubazac, and Jade Pécune (ENIT/LGP) for their technical support and Antoine Vezirian from CEF3D platform (ENIT) for the sample production.

Conflicts of Interest

The authors declare no conflict of interest. The funders had no role in the design of the study; in the collection, analyses, or interpretation of data; in the writing of the manuscript; or in the decision to publish the results.

References

  1. Aboulkhair, N.T.; Simonelli, M.; Parry, L.; Ashcroft, I.; Tuck, C.; Hague, R. 3D printing of Aluminium alloys: Additive Manufacturing of Aluminium alloys using selective laser melting. Prog. Mater Sci. 2019, 106, 100578. [Google Scholar] [CrossRef]
  2. Kotadia, H.R.; Gibbons, G.; Das, A.; Howes, P.D. A review of Laser Powder Bed Fusion Additive Manufacturing of aluminium alloys: Microstructure and properties. Addit. Manuf. 2021, 46, 102155. [Google Scholar] [CrossRef]
  3. Olakanmi, E.O.; Cochrane, R.F.; Dalgarno, K.W. A review on selective laser sintering/melting (SLS/SLM) of aluminium alloy powders: Processing, microstructure, and properties. Prog. Mater Sci. 2015, 74, 401–477. [Google Scholar] [CrossRef]
  4. Galy, C.; Le Guen, E.; Lacoste, E.; Arvieu, C. Main defects in aluminum alloy parts produced by SLM: From causes to consequences. Addit. Manuf. 2018, 22, 165–175. [Google Scholar] [CrossRef]
  5. Zhang, J.; Song, B.; Wei, Q.; Bourell, D.; Shi, T. A review of selective laser melting of aluminum alloys: Processing, microstructure, property and developing trends. JMST 2019, 35, 270–284. [Google Scholar] [CrossRef]
  6. Daoudi, M.I.; Triki, A.; Redjaimia, A. DSC study of the kinetic parameters of the metastable phases formation during non-isothermal annealing of an Al–Si–Mg alloy. J. Therm. Anal. Calorim. 2010, 104, 627–633. [Google Scholar] [CrossRef]
  7. Aboulkhair, N.T.; Everitt, N.M.; Ashcroft, I.; Tuck, C. Reducing porosity in AlSi10Mg parts processed by selective laser melting. Addit. Manuf. 2014, 1–4, 77–86. [Google Scholar] [CrossRef]
  8. Rao, J.H.; Zhang, Y.; Fang, X.; Chen, Y.; Wu, X.; Davies, C.H.J. The origins for tensile properties of selective laser melted aluminium alloy A357. Addit. Manuf. 2017, 17, 113–122. [Google Scholar] [CrossRef]
  9. Santos Macías, J.G.; Douillard, T.; Zhao, L.; Maire, E.; Pyka, G.; Simar, A. Influence on microstructure, strength and ductility of build platform temperature during laser powder bed fusion of AlSi10Mg. Acta Mater. 2020, 201, 231–243. [Google Scholar] [CrossRef]
  10. Fiocchi, J.; Tuissi, A.; Biffi, C.A. Heat treatment of aluminium alloys produced by laser powder bed fusion: A review. Mater. Des. 2021, 204, 109651. [Google Scholar] [CrossRef]
  11. Thijs, L.; Kempen, K.; Kruth, J.P.; Van Humbeeck, J. Fine-structured aluminium products with controllable texture by selective laser melting of pre-alloyed AlSi10Mg powder. Acta Mater. 2013, 61, 1809–1819. [Google Scholar] [CrossRef] [Green Version]
  12. Delahaye, J.; Tchuindjang, J.T.; Lecomte-Beckers, J.; Rigo, O.; Habraken, A.M.; Mertens, A. Influence of Si precipitates on fracture mechanisms of AlSi10Mg parts processed by Selective Laser Melting. Acta Mater. 2019, 175, 160–170. [Google Scholar] [CrossRef]
  13. Zhao, L.; Song, L.; Santos Macías, J.G.; Zhu, Y.; Huang, M.; Simar, A.; Li, Z. Review on the correlation between microstructure and mechanical performance for laser powder bed fusion AlSi10Mg. Addit. Manuf. 2022, 56, 102914. [Google Scholar] [CrossRef]
  14. Bosio, F.; Shen, H.; Liu, Y.; Lombardi, M.; Rometsch, P.; Wu, X.; Zhu, Y.; Huang, A. Production Strategy for Manufacturing Large-Scale AlSi10Mg Components by Laser Powder Bed Fusion. JOM 2021, 73, 770–780. [Google Scholar] [CrossRef]
  15. Yang, K.V.; Rometsch, P.; Davies, C.H.J.; Huang, A.; Wu, X. Effect of heat treatment on the microstructure and anisotropy in mechanical properties of A357 alloy produced by selective laser melting. Mater. Des. 2018, 154, 275–290. [Google Scholar] [CrossRef]
  16. Mertens, R.; Dadbakhsh, S.; Humbeeck, J.V.; Kruth, J.P. Application of base plate preheating during selective laser melting. Procedia CIRP 2018, 74, 5–11. [Google Scholar] [CrossRef]
  17. Rao, H.; Giet, S.; Yang, K.; Wu, X.; Davies, C.H.J. The influence of processing parameters on aluminium alloy A357 manufactured by Selective Laser Melting. Mater. Des. 2016, 109, 334–346. [Google Scholar] [CrossRef]
  18. Aversa, A.; Lorusso, M.; Trevisan, F.; Ambrosio, E.; Calignano, F.; Manfredi, D.; Biamino, S.; Fino, P.; Lombardi, M.; Pavese, M. Effect of Process and Post-Process Conditions on the Mechanical Properties of an A357 Alloy Produced via Laser Powder Bed Fusion. Metals 2017, 7, 68. [Google Scholar] [CrossRef]
  19. Casati, R.; Hamidi Nasab, M.; Coduri, M.; Tirelli, V.; Vedani, M. Effects of Platform Pre-Heating and Thermal-Treatment Strategies on Properties of AlSi10Mg Alloy Processed by Selective Laser Melting. Metals 2018, 8, 954. [Google Scholar] [CrossRef] [Green Version]
  20. Mauduit, A.; Gransac, H.; Auguste, P.; Pillot, S.; Diószegi, A. Study of AlSi7Mg0. 6 Alloy by Selective Laser Melting: Mechanical Properties, Microstructure, Heat Treatment. JCME 2019, 3, 1–13. [Google Scholar]
  21. Takata, N.; Kodaira, H.; Sekizawa, K.; Suzuki, A.; Kobashi, M. Change in microstructure of selectively laser melted AlSi10Mg alloy with heat treatments. Mater. Sci. Eng. A 2017, 704, 218–228. [Google Scholar] [CrossRef]
  22. Liu, X.; Zhao, C.; Zhou, X.; Shen, Z.; Liu, W. Microstructure of selective laser melted AlSi10Mg alloy. Mater. Des. 2019, 168, 107677. [Google Scholar] [CrossRef]
  23. Oliveira de Menezes, J.T.; Castrodeza, E.M.; Patriarca, L.; Casati, R. Effect of heat treatments and loading orientation on the tensile properties and fracture toughness of AlSi7Mg alloy produced by Laser Powder Bed Fusion. Int. J. Fract. 2022, 235, 145–157. [Google Scholar] [CrossRef]
  24. Mussatto, A.; Groarke, R.; Vijayaraghavan, R.K.; Hughes, C.; Obeidi, M.A.; Doğu, M.N.; Alp Yalçin, M.; McNally, P.J.; Delaure, Y.; Brabazon, D. Assessing dependency of part properties on the printing location in laser-powder bed fusion metal additive manufacturing. Mater. Today Commun. 2022, 30, 103209. [Google Scholar] [CrossRef]
  25. Esmaeilizadeh, R.; Ali, U.; Keshavarzkermani, A.; Mahmoodkhani, Y.; Marzbanrad, E.; Toyserkani, E. On the effect of spatter particles distribution on the quality of Hastelloy X parts made by laser powder-bed fusion additive manufacturing. J. Manuf. Process. 2019, 37, 11–20. [Google Scholar] [CrossRef]
  26. Maamoun, A.H.; Elbestawi, M.; Dosbaeva, G.K.; Veldhuis, S.C. Thermal post-processing of AlSi10Mg parts produced by Selective Laser Melting using recycled powder. Addit. Manuf. 2018, 21, 234–247. [Google Scholar] [CrossRef]
  27. Cerri, E.; Ghio, E.; Bolelli, G. Effect of the Distance from Build Platform and Post-Heat Treatment of AlSi10Mg Alloy Manufactured by Single- and Multi-Laser Selective Laser Melting. J. Mater. Eng. Perform. 2021, 30, 4981–4992. [Google Scholar] [CrossRef]
  28. Hitzler, L.; Janousch, C.; Schanz, J.; Merkel, M.; Heine, B.; Mack, F.; Hall, W.; Öchsner, A. Direction and location dependency of selective laser melted AlSi10Mg specimens. J. Mater. Process. Technol. 2017, 243, 48–61. [Google Scholar] [CrossRef]
  29. Cerri, E.; Ghio, E. Aging Profiles of AlSi7Mg0.6 and AlSi10Mg0.3 Alloys Manufactured via Laser-Powder Bed Fusion: Direct Aging versus T6. Materials 2022, 15, 6126. [Google Scholar] [CrossRef]
  30. Song, L.; Zhao, L.; Ding, L.; Zhu, Y.; Huang, M.; Simar, A.; Li, Z. Microstructure and loading direction dependent hardening and damage behavior of laser powder bed fusion AlSi10Mg. Mater. Sci. Eng. A 2022, 832, 142484. [Google Scholar] [CrossRef]
  31. Bosio, F.; Fino, P.; Manfredi, D.; Lombardi, M. Strengthening strategies for an Al alloy processed by in-situ alloying during laser powder bed fusion. Mater. Des. 2021, 212, 110247. [Google Scholar] [CrossRef]
  32. Rometsch, P.A.; Schaffer, G.B. An age hardening model for Al-7Si-Mg casting alloys. Mater. Sci. Eng. A 2002, A325, 424–434. [Google Scholar] [CrossRef]
  33. Li, R.X.; Li, R.D.; Zhao, Y.H.; He, L.Z.; Li, C.X.; Guan, H.R.; Hu, Z.Q. Age-hardening behavior of cast Al–Si base alloy. Mater. Lett. 2004, 58, 2096–2101. [Google Scholar] [CrossRef]
  34. Myhr, O.R.; Grong, Ø.; Andersen, S.J. Modelling of the age hardening behaviour of Al–Mg–Si alloys. Acta Mater. 2001, 49, 65–75. [Google Scholar] [CrossRef]
  35. Edwards, G.A.; Stiller, K.; Dunlop, G.L.; Couper, M.J. The precipitation sequence in Al-Mg-Si alloys. Acta Mater. 1998, 46, 3893–3904. [Google Scholar] [CrossRef]
  36. Andersen, S.J.; Zandbergen, H.W.; Jansen, J.; Traeholt, C.; Tundal, U.; Reiso, O. The crystal structure of the β″phase in Al–Mg–Si alloys. Acta Mater. 1998, 46, 3283–3298. [Google Scholar] [CrossRef]
  37. Matsuda, K.; Naoi, T.; Kaname, F.; Uetani, Y.; Sato, T.; Kamio, A.; Ikeno, S. Crystal structure of the Bsec phase in an Al-1wt% Mg2Si—0,4wt%Si alloy. Mater. Sci. Eng. A 1999, A262, 232–237. [Google Scholar] [CrossRef]
  38. Doan, L.C.; Ohmori, Y.; Nakai, K. Precipitation and dissolution reactions in a 6061 aluminum alloy. Mater. Trans. 2000, 41, 300–305. [Google Scholar] [CrossRef] [Green Version]
  39. Wang, X.; Esmaeili, S.; Lloyd, D.J. The sequence of precipitation in the Al-Mg-Si-Cu alloy AA6111. Metall. Mater. Trans. A 2006, 37, 2691–2699. [Google Scholar] [CrossRef]
  40. Padovano, E.; Badini, C.; Pantarelli, A.; Gili, F.; D’Aiuto, F. A comparative study of the effects of thermal treatments on AlSi10Mg produced by laser powder bed fusion. J. Alloys Compd. 2020, 831, 154822. [Google Scholar] [CrossRef]
  41. Albu, M.; Krisper, R.; Lammer, J.; Kothleitner, G.; Fiocchi, J.; Bassani, P. Microstructure evolution during in-situ heating of AlSi10Mg alloy powders and additive manufactured parts. Addit. Manuf. 2020, 36, 101605. [Google Scholar] [CrossRef]
  42. Fiocchi, J.; Tuissi, A.; Bassani, P.; Biffi, C.A. Low temperature annealing dedicated to AlSi10Mg selective laser melting products. J. Alloys Compd. 2017, 695, 3402–3409. [Google Scholar] [CrossRef]
  43. Ma, P.; Prashanth, K.; Scudino, S.; Jia, Y.; Wang, H.; Zou, C.; Wei, Z.; Eckert, J. Influence of Annealing on Mechanical Properties of Al-20Si Processed by Selective Laser Melting. Metals 2014, 4, 28–36. [Google Scholar] [CrossRef] [Green Version]
  44. Fite, J.; Prameela, S.E.; Slotwinski, J.; Weihs, T. Evolution of the microstructure and mechanical properties of additively manufactured AlSi10Mg during room temperature holds and low temperature aging. Addit. Manuf. 2020, 36, 101429. [Google Scholar] [CrossRef]
  45. Liu, M.; Wu, Z.; Yang, R.; Wei, J.; Yu, Y.; Skaret, P.C.; Rover, H.J. DSC analyses of static and dynamic precipitation of an Al–Mg–Si–Cu aluminum alloy. Prog. Nat. Sci. Mater. Int. 2015, 25, 153–158. [Google Scholar] [CrossRef] [Green Version]
  46. Girelli, L.; Tocci, M.; Gelfi, M.; Pola, A. Study of heat treatment parameters for additively manufactured AlSi10Mg in comparison with corresponding cast alloy. Mater. Sci. Eng. A 2019, 739, 317–328. [Google Scholar] [CrossRef]
  47. Fiocchi, J.; Biffi, C.A.; Colombo, C.; Vergani, L.M.; Tuissi, A. Ad Hoc Heat Treatments for Selective Laser Melted Alsi10mg Alloy Aimed at Stress-Relieving and Enhancing Mechanical Performances. JOM 2020, 72, 1118–1127. [Google Scholar] [CrossRef]
  48. Casati, R.; Vedani, M. Aging Response of an A357 Al Alloy Processed by Selective Laser Melting. Adv. Eng. Mater. 2018, 21, 1800406. [Google Scholar] [CrossRef]
Figure 1. (a) Manufacturing of the study parts. (b) Configuration of the fabrication (gas flow and wiper displacement directions) and representation of the different zones considered on the surface of the building plate. (c) Depiction of building and notch orientations for Charpy tests specimens.
Metals 12 02148 g001
Figure 2. Average hardness in function-tested orientations according to the different production areas on the platen.
Metals 12 02148 g002
Figure 3. Stress–strain curves of AlSi10Mg alloy tested in different building orientations (samples produced in area 4).
Metals 12 02148 g003
Figure 4. (a) Evolution of yield strength, ultimate tensile stress, and (b) fracture strain as a function of building area. For each building area and orientation, plotted values resulted from three specimens tested.
Metals 12 02148 g004
Figure 5. Fracture surfaces of (a,b) horizontally (X) and (c,d) vertically (Z) oriented samples (a,c: SEM, x50, 15 kV, 35 mm, 80 pA, SE; (b,d): SEM, x5000, 15 kV, 15.5 and 11.5 mm, 80 pA, SE). Building direction is presented by a black arrow or by a cross inscribed in a circle. Highest magnifications (c,d) were shot from framed areas.
Metals 12 02148 g005aMetals 12 02148 g005b
Figure 6. Fracture energy as a function of building and notch orientations according to the different production areas.
Metals 12 02148 g006
Figure 7. Average fracture energies as a function of notch height for (a) X/Z and (b) X/Y specimen types without taking into account the manufacturing areas.
Metals 12 02148 g007
Figure 8. Evolution of hardness HV0.5 as a function of the time between the fabrication of the cross-section considered and the end of the building process for each building area considered.
Metals 12 02148 g008
Figure 9. Evolution of toughness impact as a function of remaining time for different building and notch orientations (Area 2).
Metals 12 02148 g009
Figure 10. Microstructures obtained at (a,c,e) 0 (bottom) and (b,d,f) 60 (top) mm from the building platform (XZ cross-section for samples produced in area 1).(a,b: MO, x100; c,d: SEM, x5000, 15 kV, 10.5 mm, 80 pA, SE; e,f: SEM, x30000, 15 kV, 10.5 mm, 80 pA, SE). Highest magnifications (e,f) were shot from framed areas of (c,d).
Metals 12 02148 g010
Figure 11. Hardness evolution of ex situ heat treatment at 170 °C of top sample and hardness profile of fabricated samples with respect to building height (sample from area 3).
Metals 12 02148 g011
Figure 12. Differential thermal analysis (DTA) measurements at different building heights (Area 2) and representation of solution heat-treated (SHT) and T6 curves.
Metals 12 02148 g012
Figure 13. Microstructures of samples heated at 5 °C/min until (a) 230 °C and (b) 320 °C followed by water quenching (XY cross-section; SEM, x10000, 15 kV, 11 mm, 80 pA, SE).
Metals 12 02148 g013
Table 1. Building parameters.
Building ParameterValue
Layer thickness30 µm
Power275 W
Exposure time40 µs
Distance between points80 µm
Hatch distance80 µm
Table 2. Evolution of density and relative density as a function of production areas.
AreaDensity (g/cm3)Relative Density (%)
12.646 ± 0.00299.1 ± 0.1
22.626 ± 0.00298.3 ± 0.1
32.646 ± 0.00299.1 ± 0.1
42.648 ± 0.00299.2 ± 0.1
52.646 ± 0.00299.1 ± 0.1
Table 3. Evolution of hardness and Young’s modulus as a function of the distance from the building platform (Area 1).
Distance from the Platform (mm)Hardness
(GPa)
Young’s Modulus
(GPa)
01.49 ± 0.0784 ± 2
401.68 ± 0.1188 ± 2
601.79 ± 0.1786 ± 2
Table 4. Tensile properties for each building orientation. Mean values and standard deviations were obtained from all samples tested in each orientation without taking into consideration the production area.
OrientationYS (MPa) UTS (MPa)A (%)E (GPa)
Horizontal270 ± 10390 ± 97 ± 174 ± 2
Vertical270 ± 5420 ± 84 ± 172 ± 2
Table 5. Precipitation peak temperatures as a function of building height and heat treatment (area 2).
Distance from Platform (mm)/
Heat Treatment
Tβ’’
(°C)
Tβ’+Si
(°C)
0-305
10-306
20-312
30-311
40241313
50236311
SHT-8h227272
T6-265
Publisher’s Note: MDPI stays neutral with regard to jurisdictional claims in published maps and institutional affiliations.

