
Effect of Normalising Process on the Corrosion Behaviour of U75V Rail Flash Butt Welded Joints in a Marine Environment


Abstract
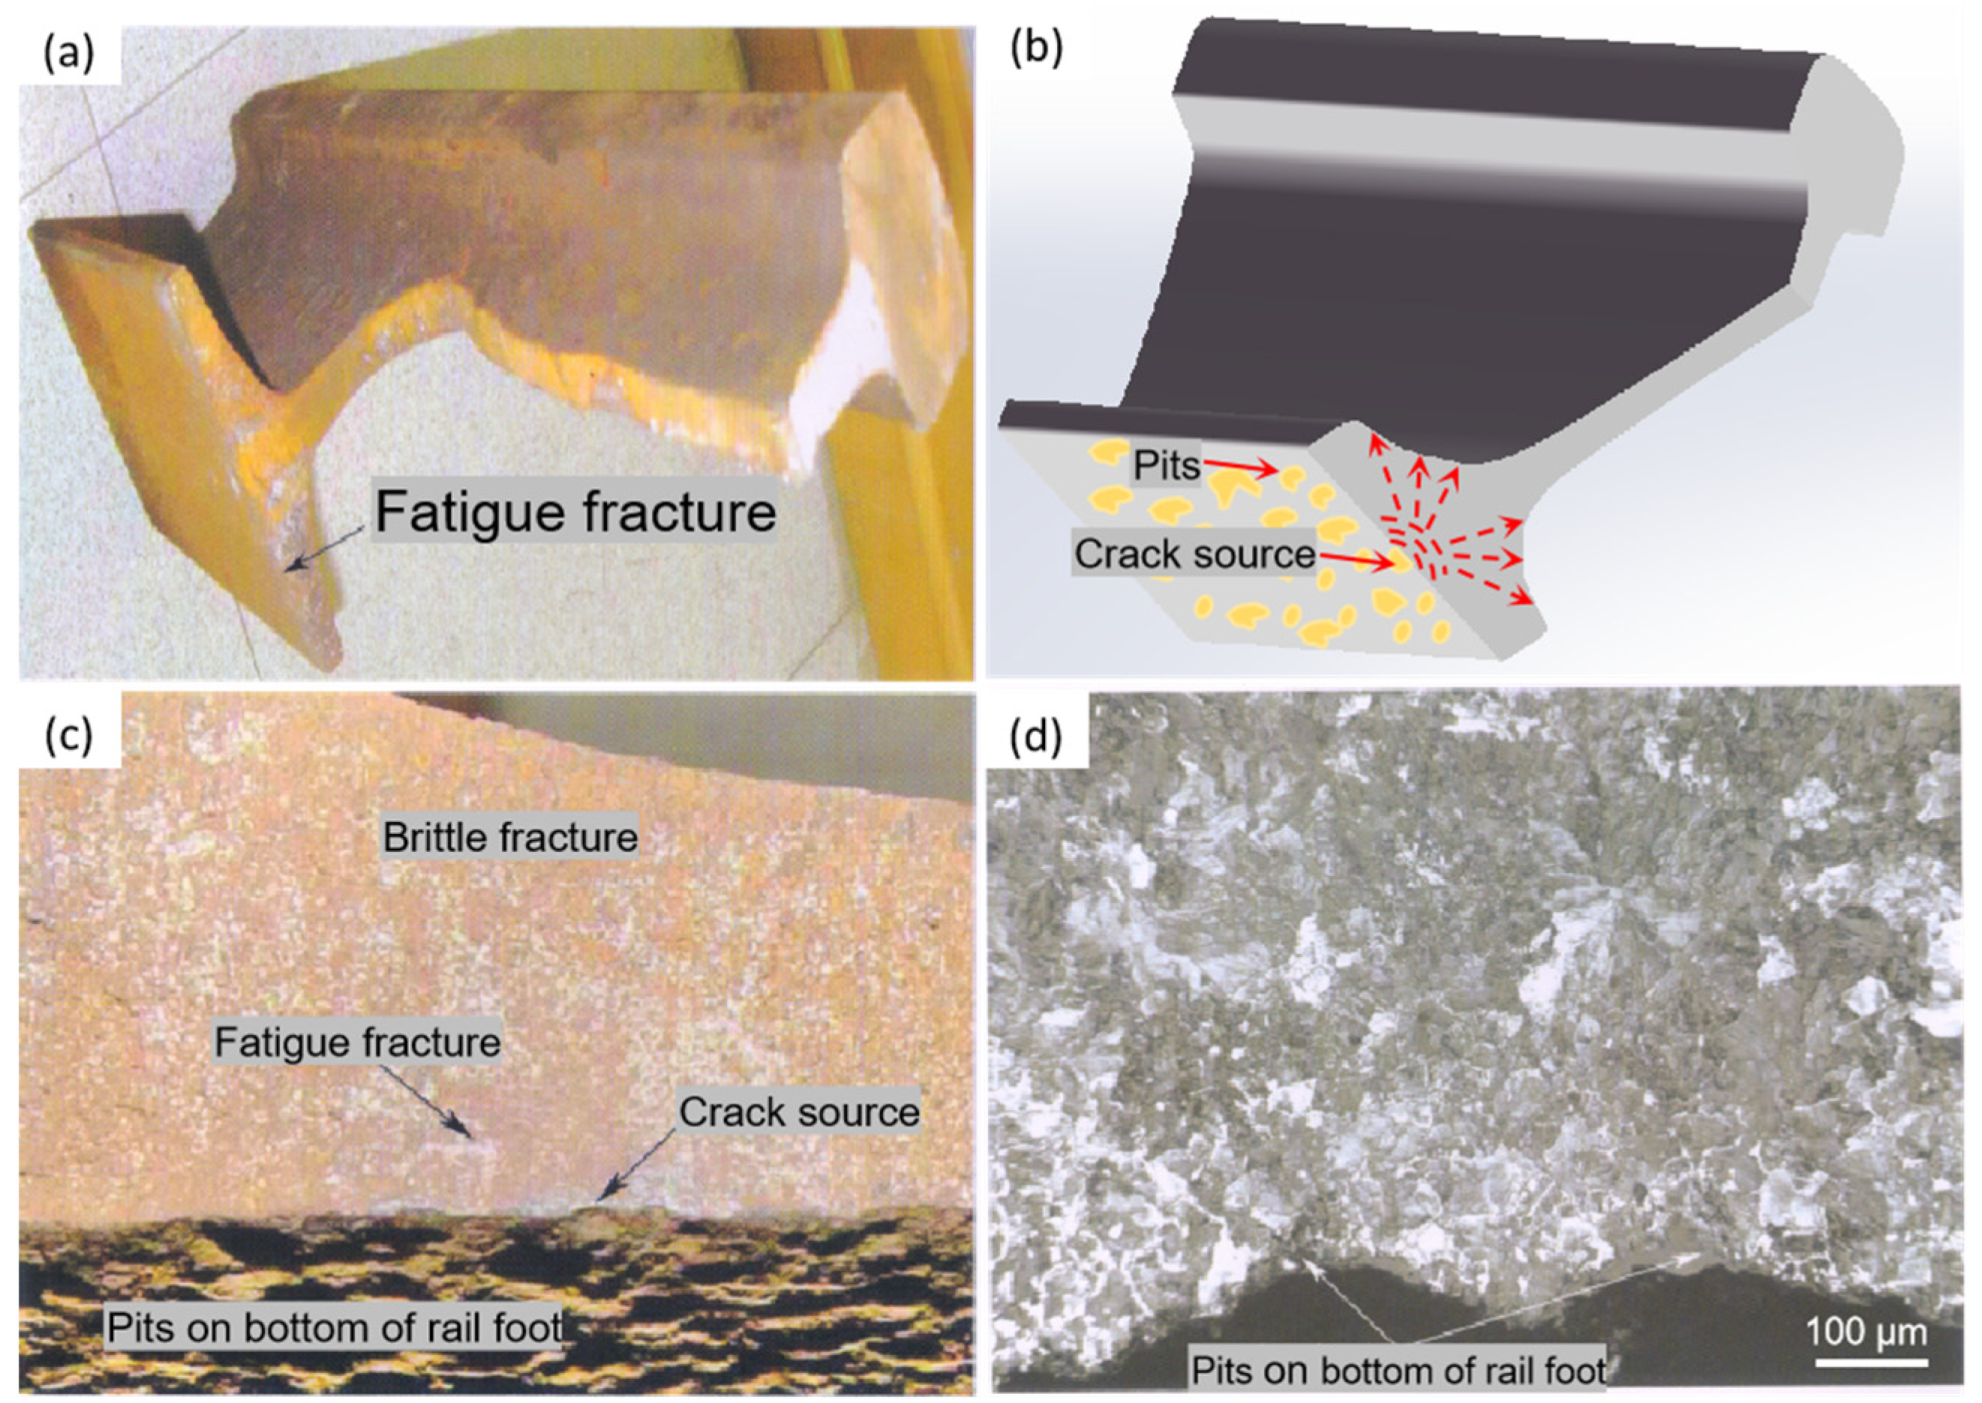
1. Introduction
2. Materials and Method
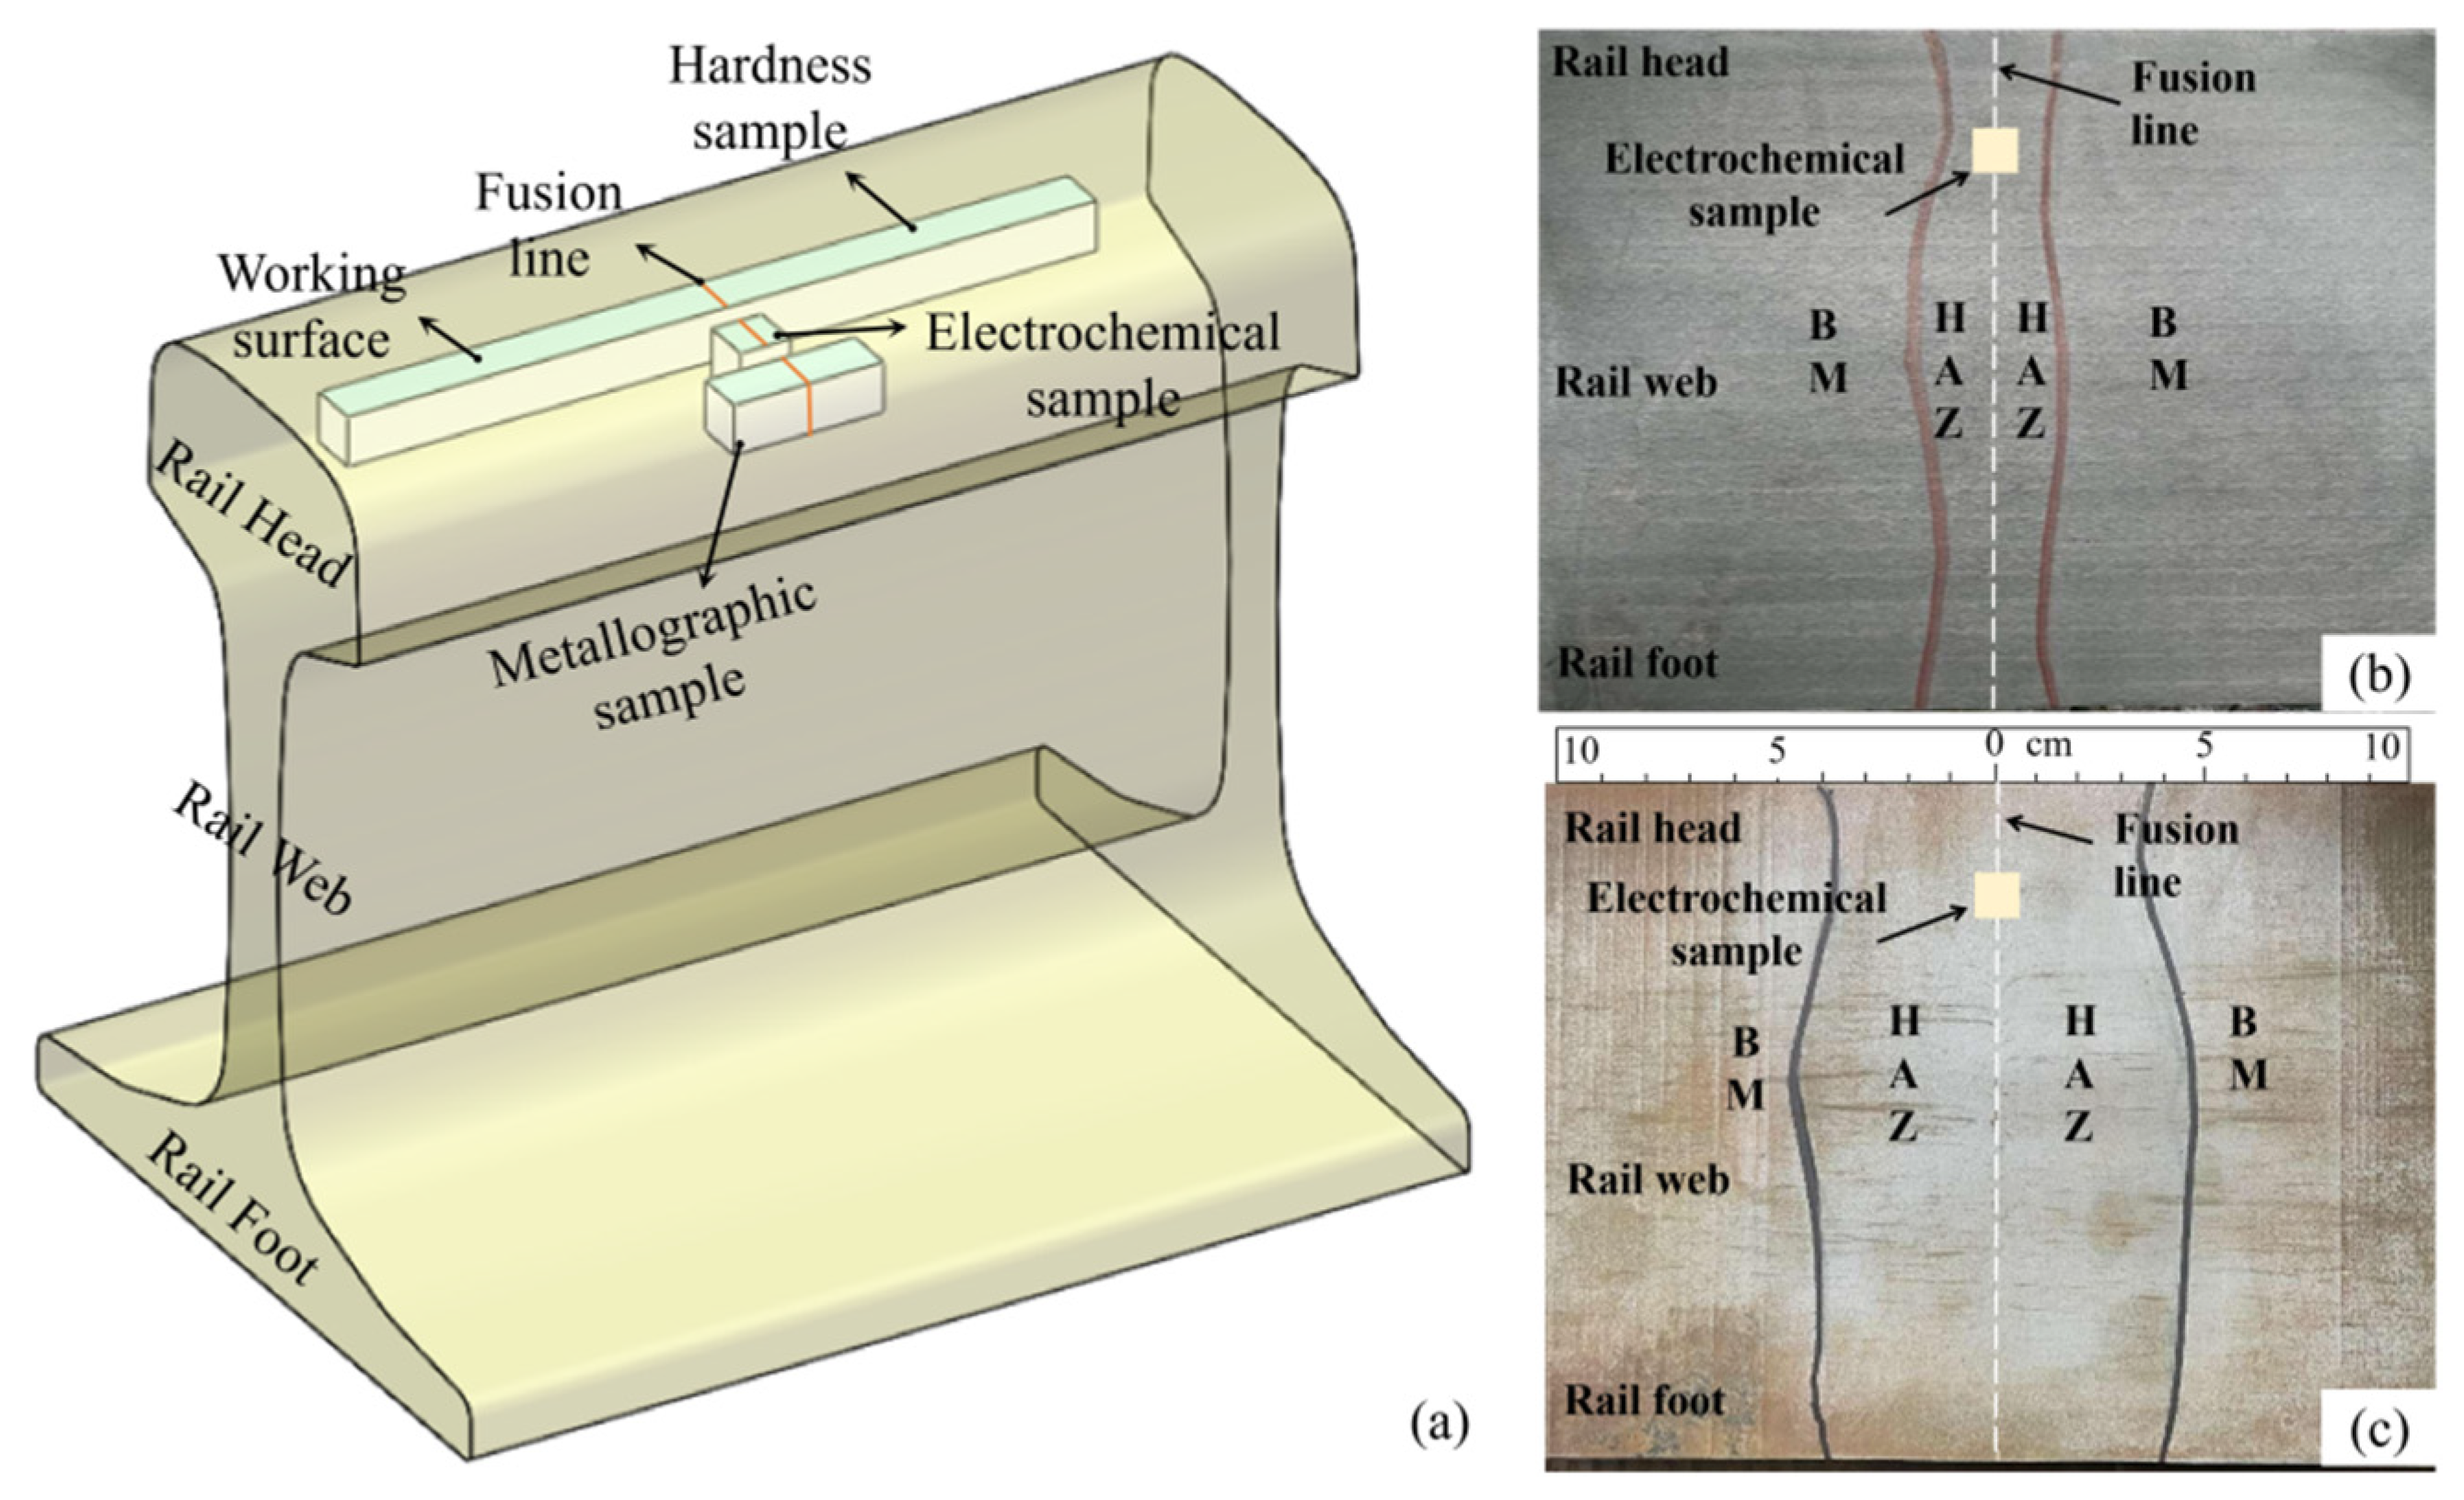
2.1. Preparation of U75V Welded Joints
2.2. Electrochemical Tests
2.3. Metallographic Tests
3. Results and Discussion
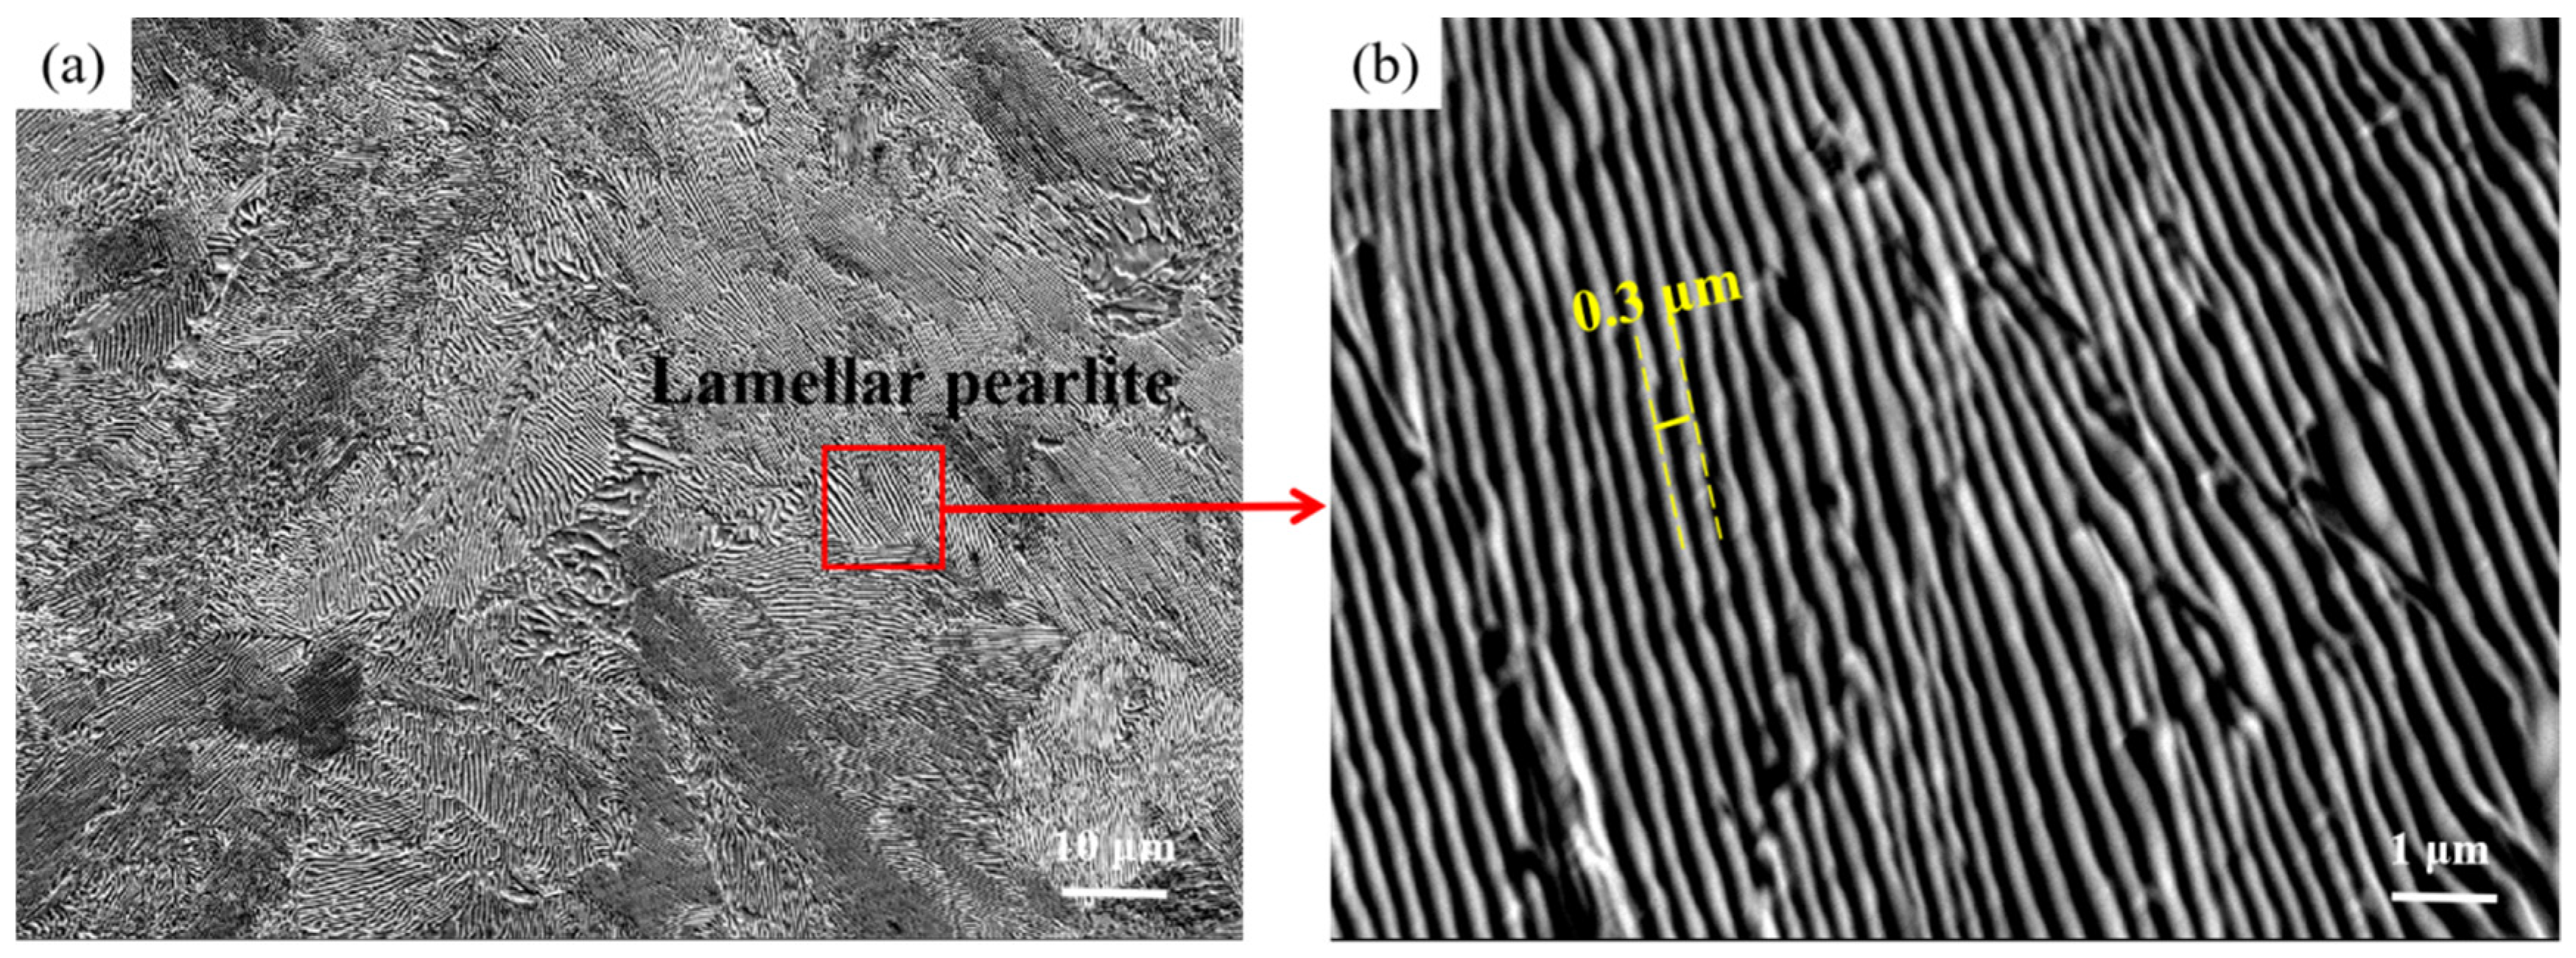
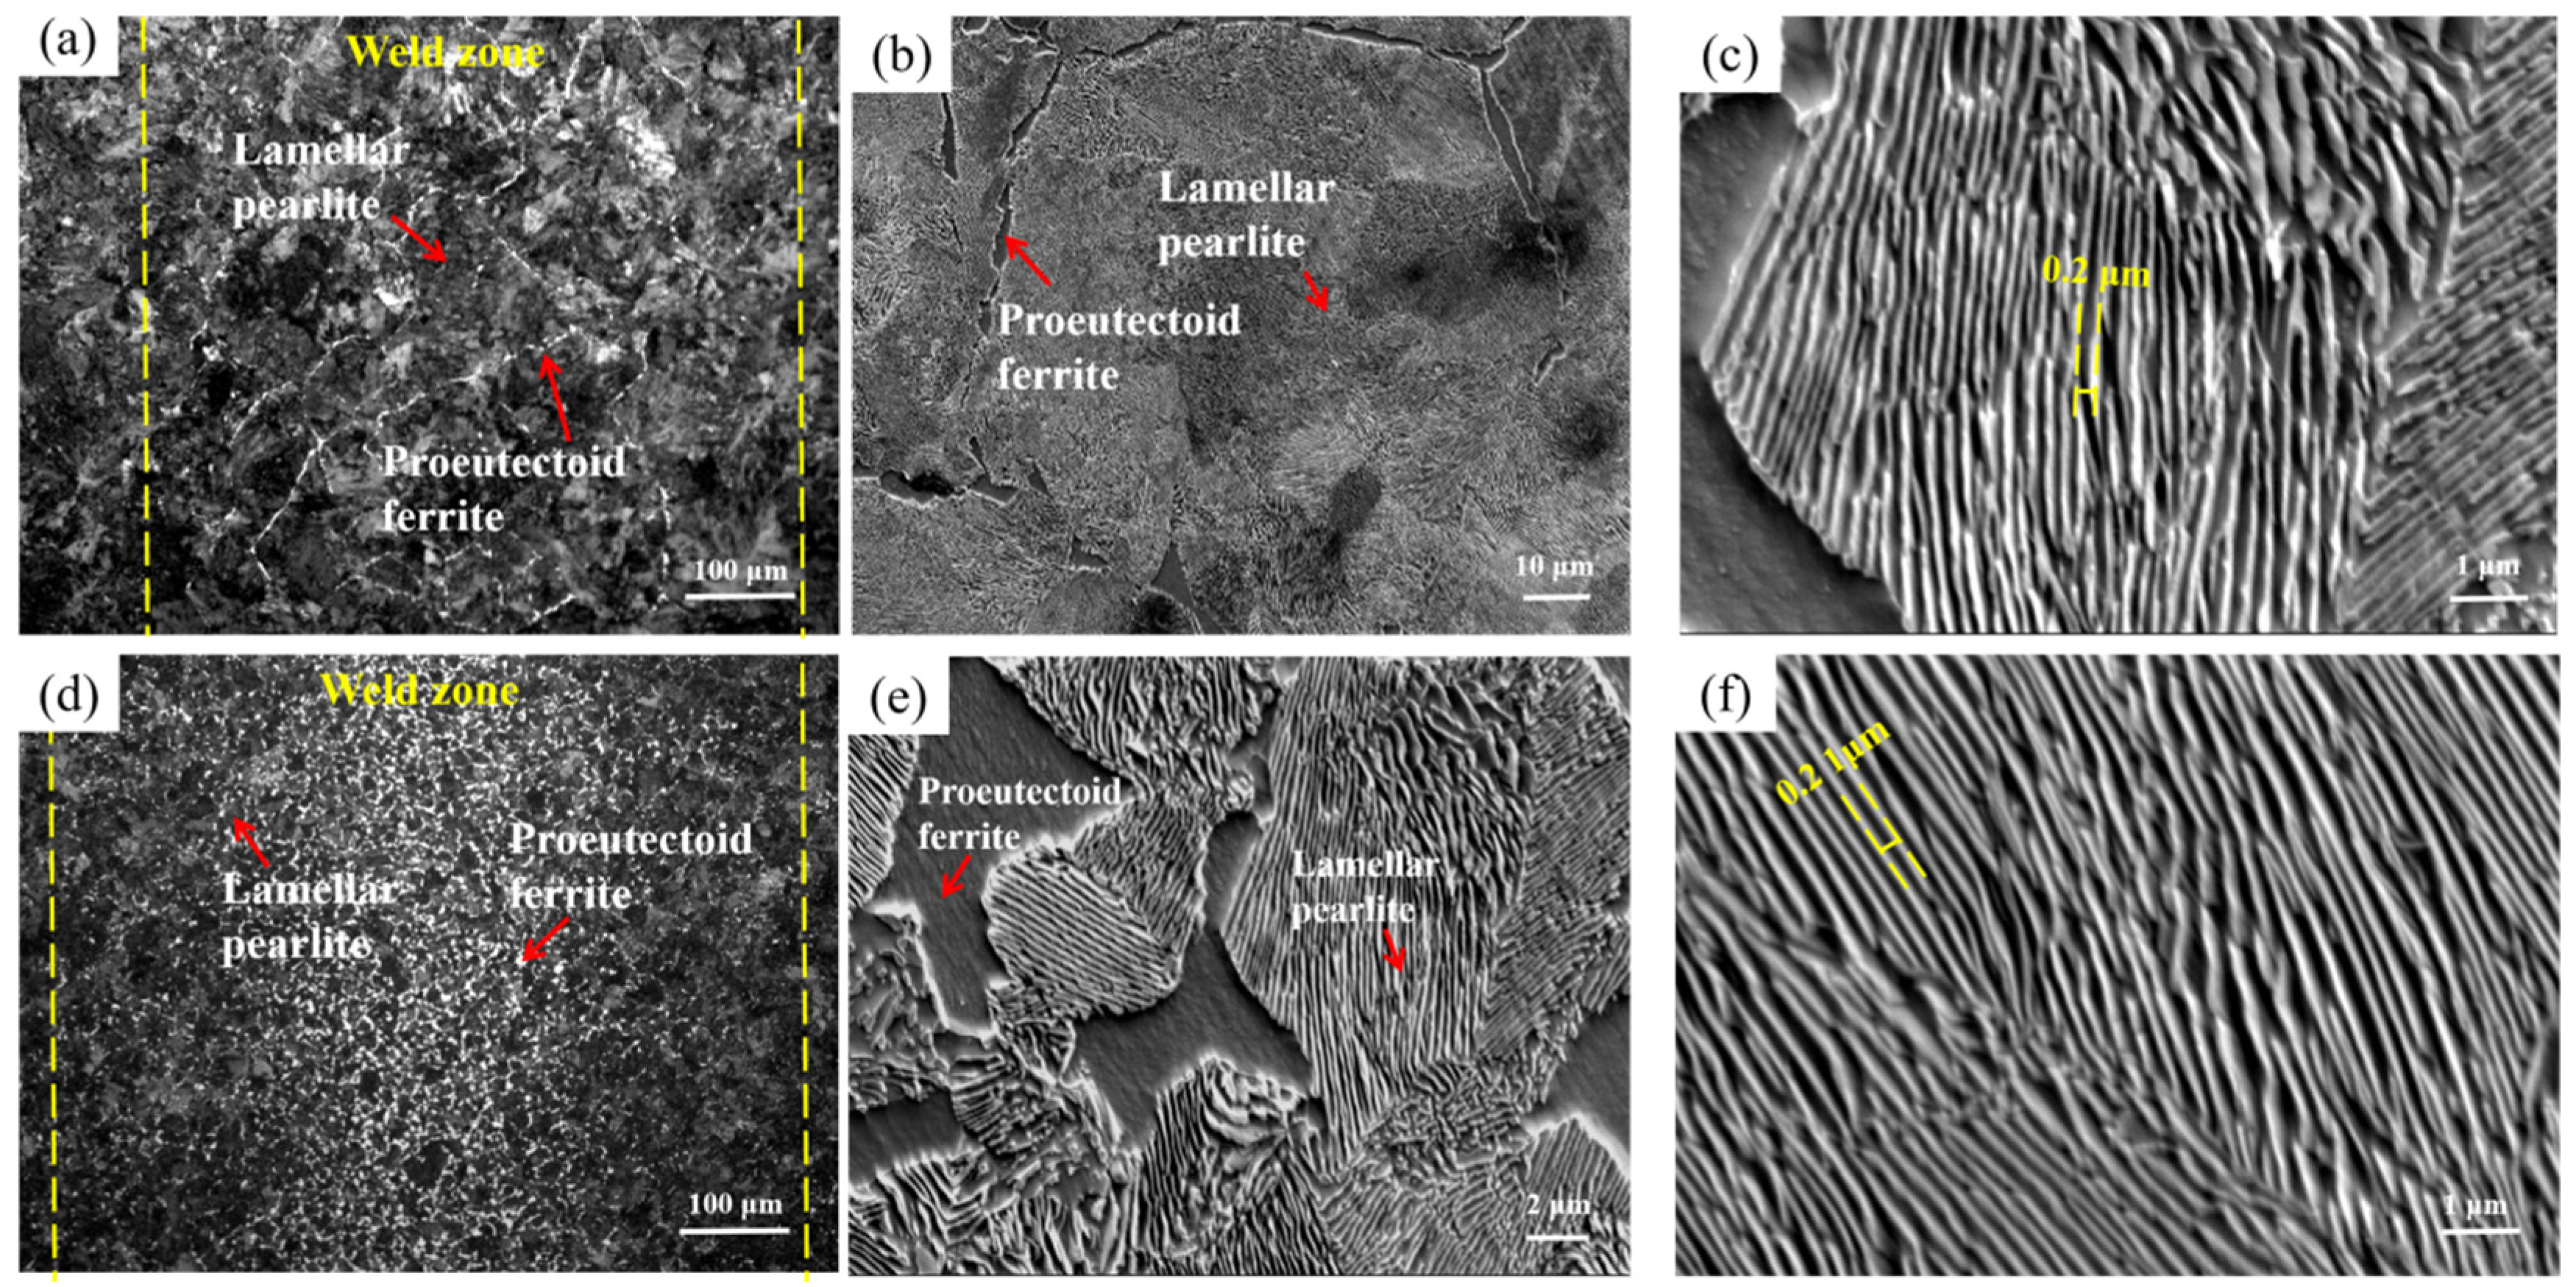
3.1. The Microstructure Analysis
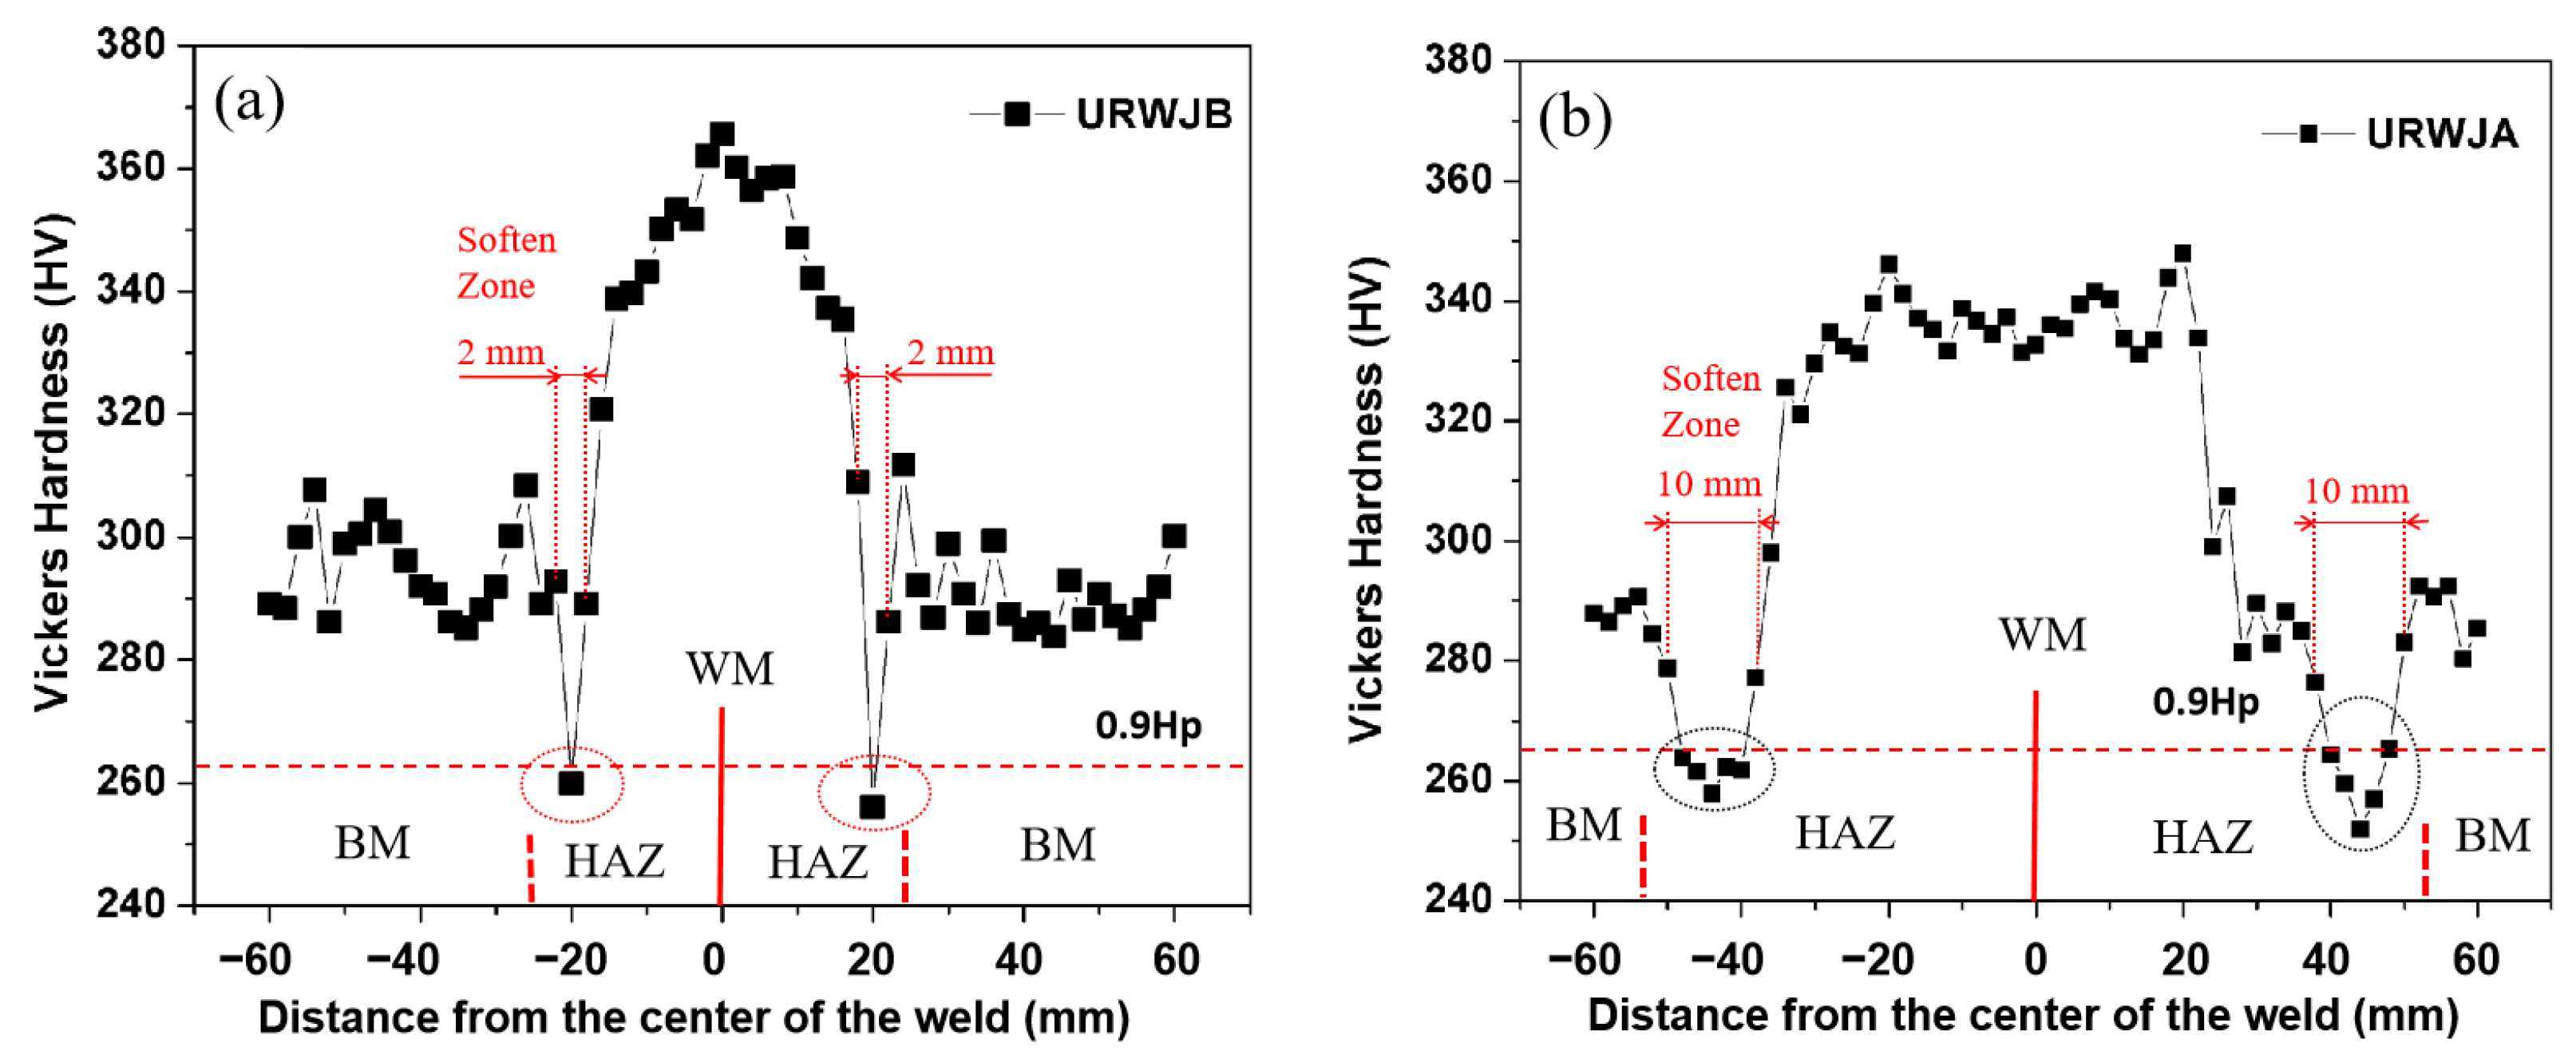
3.2. The Hardness Analysis
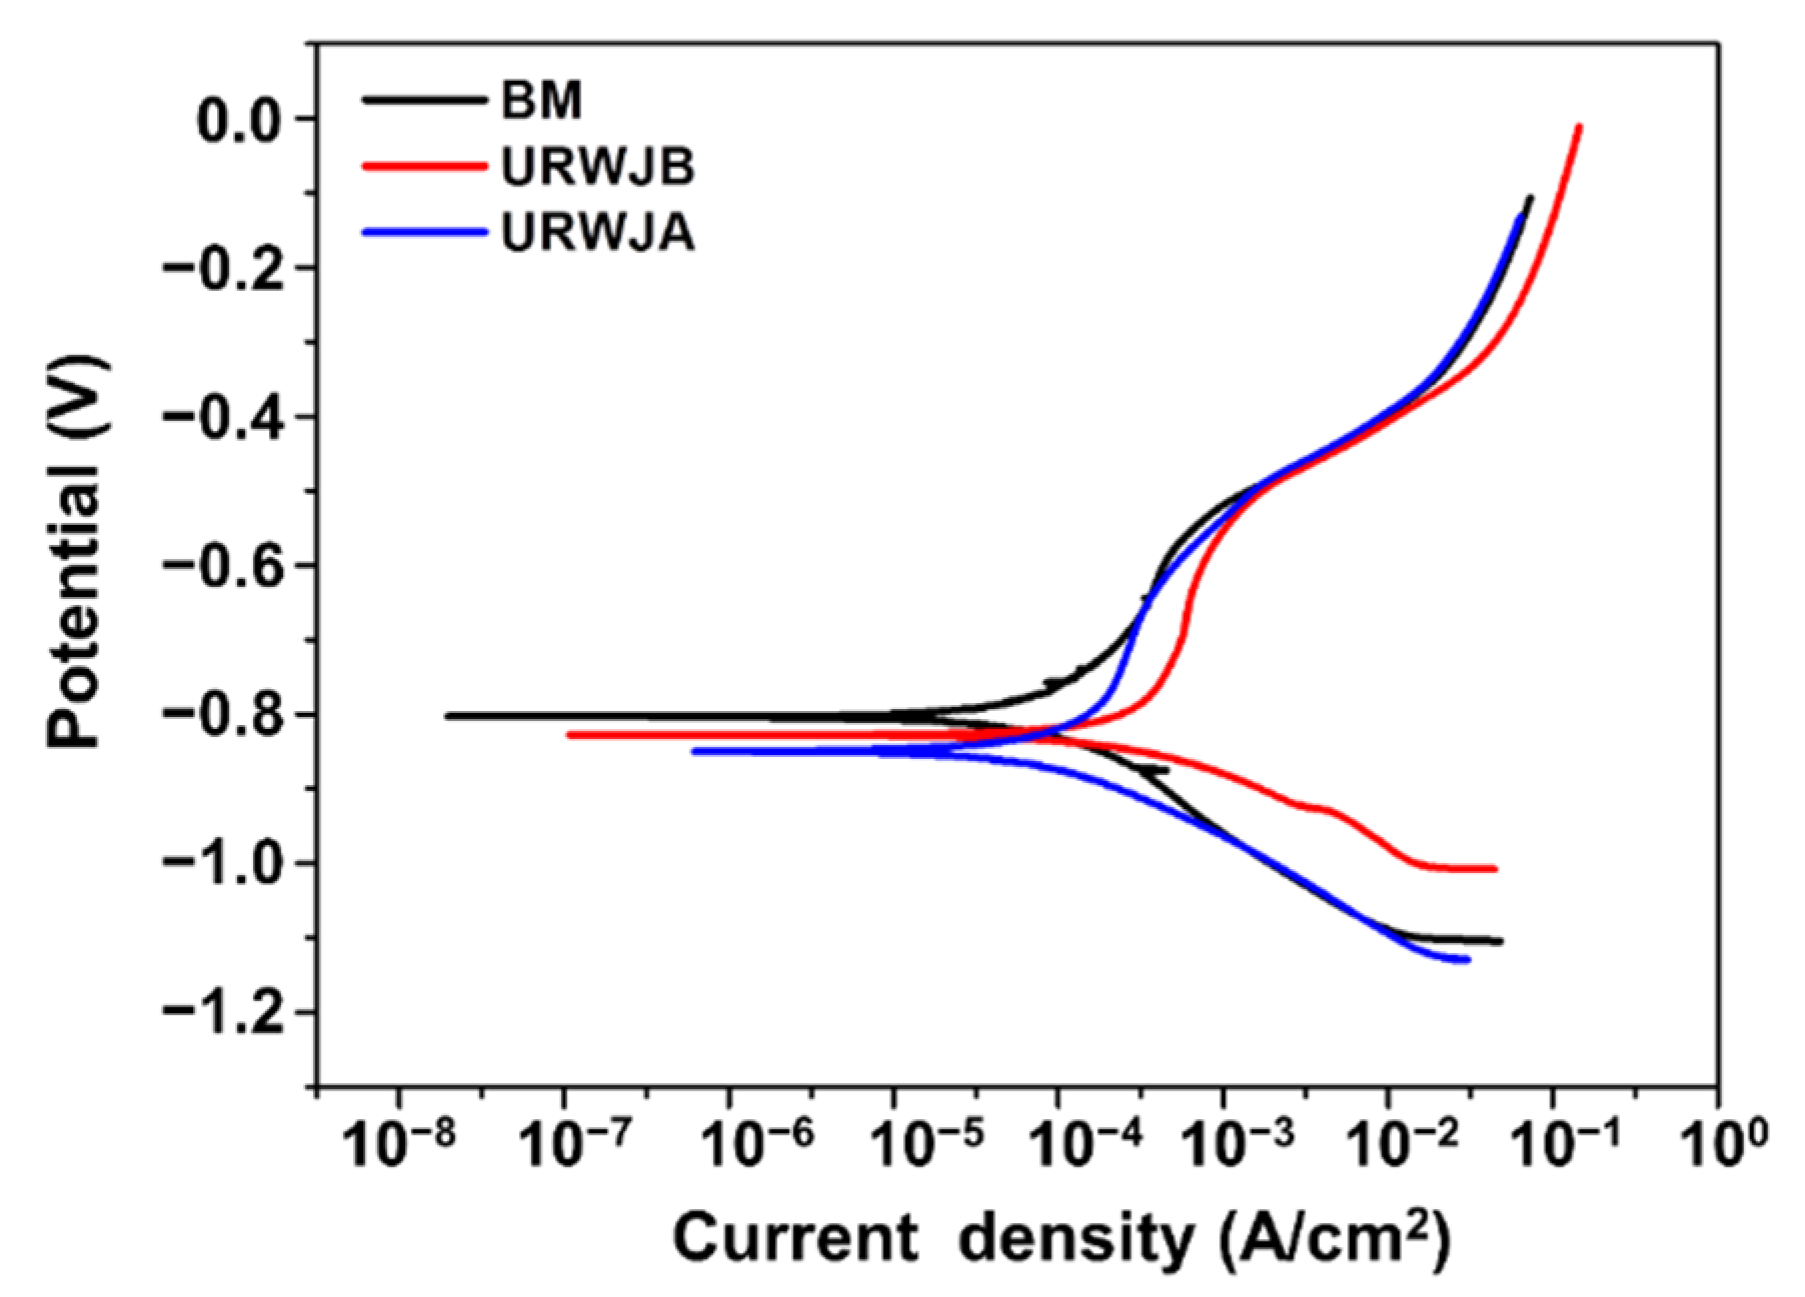
3.3. Polarisation Curve
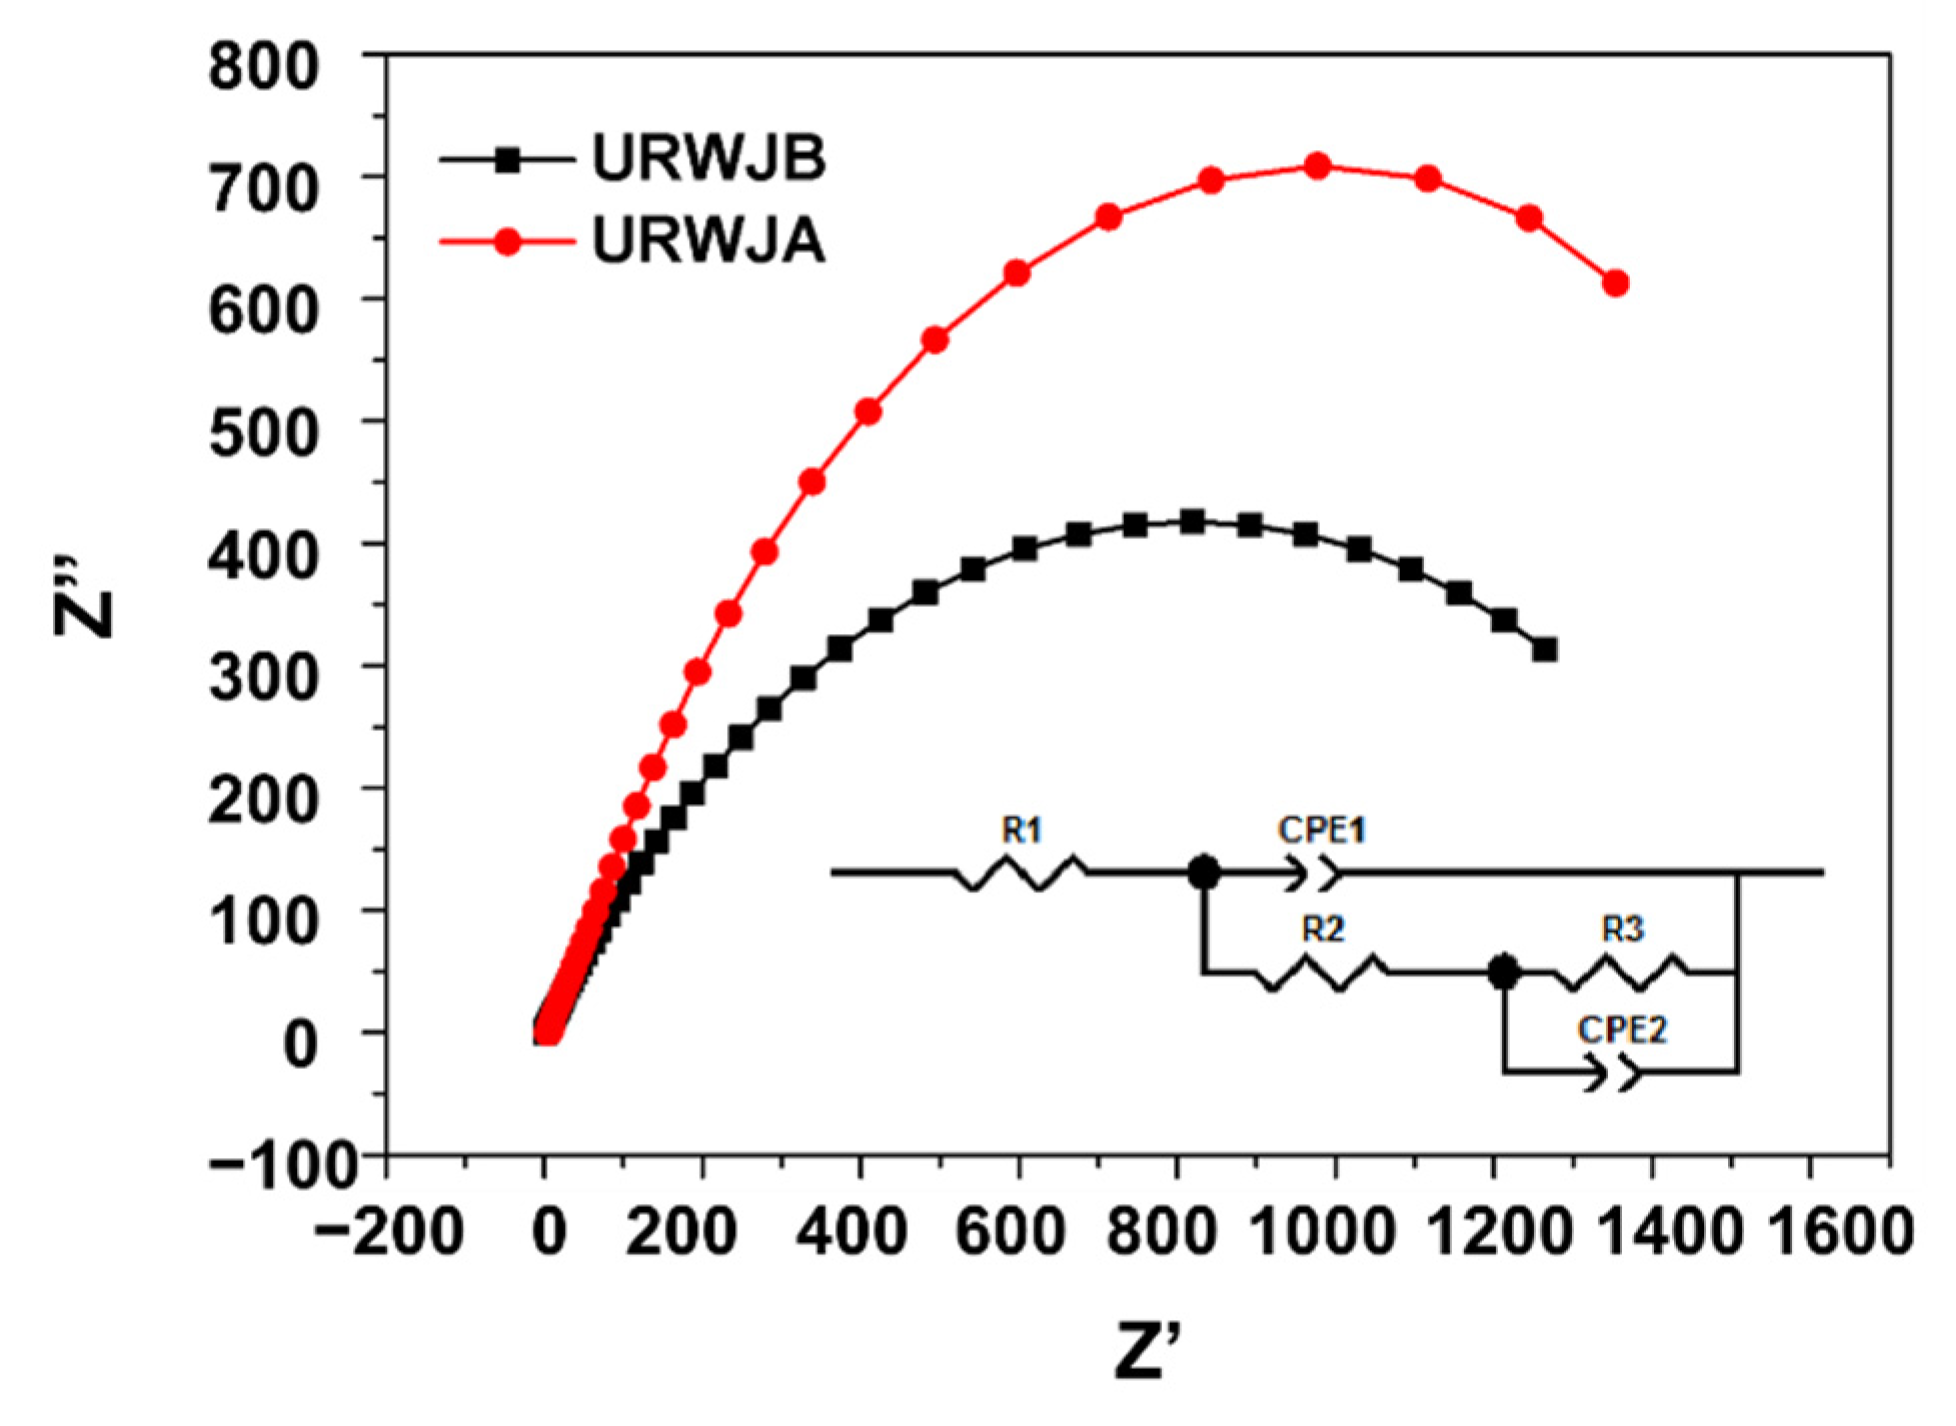
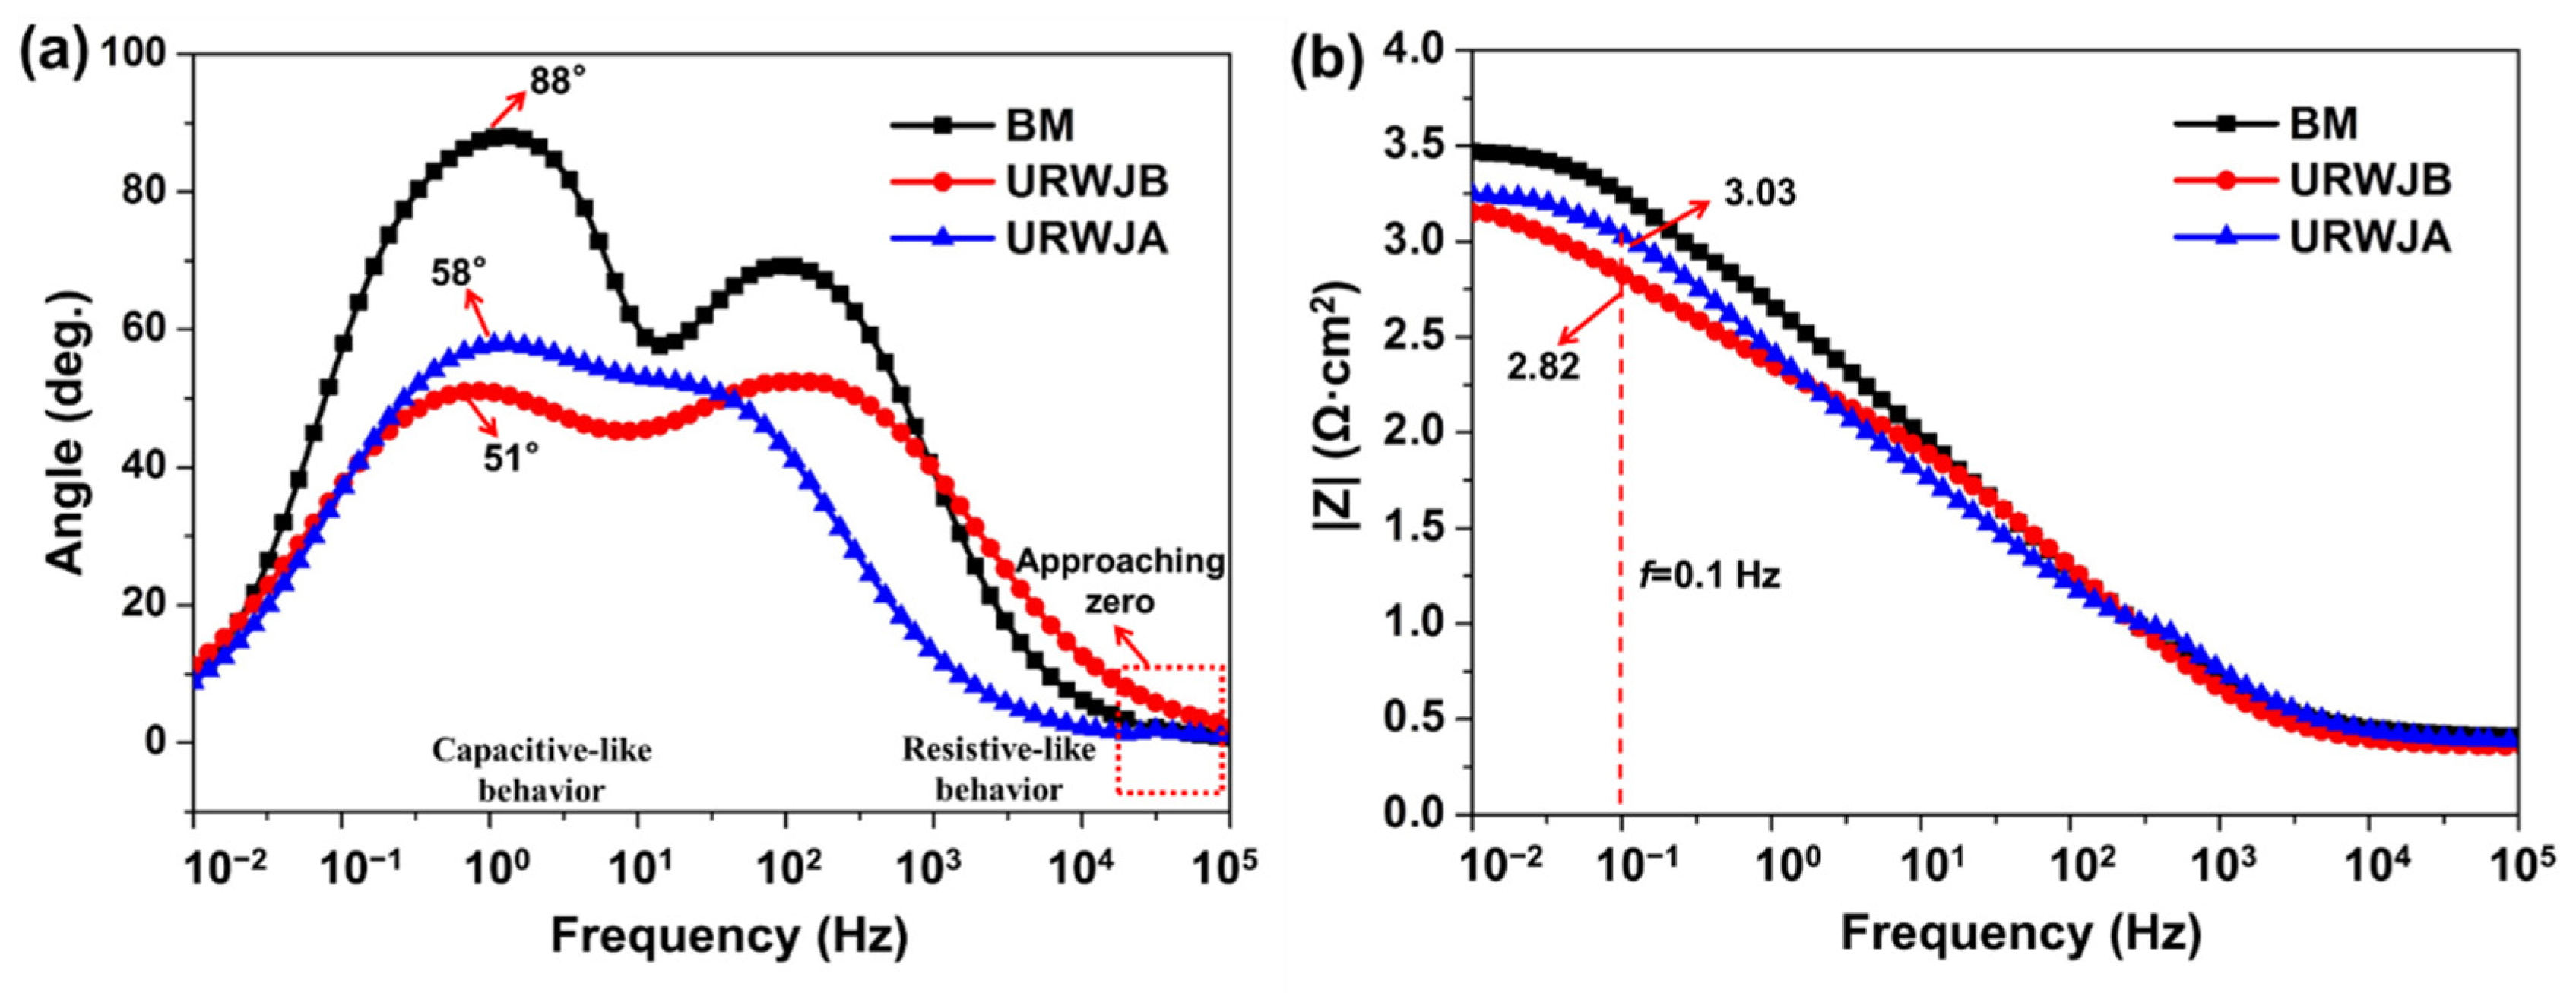
3.4. EIS Analysis
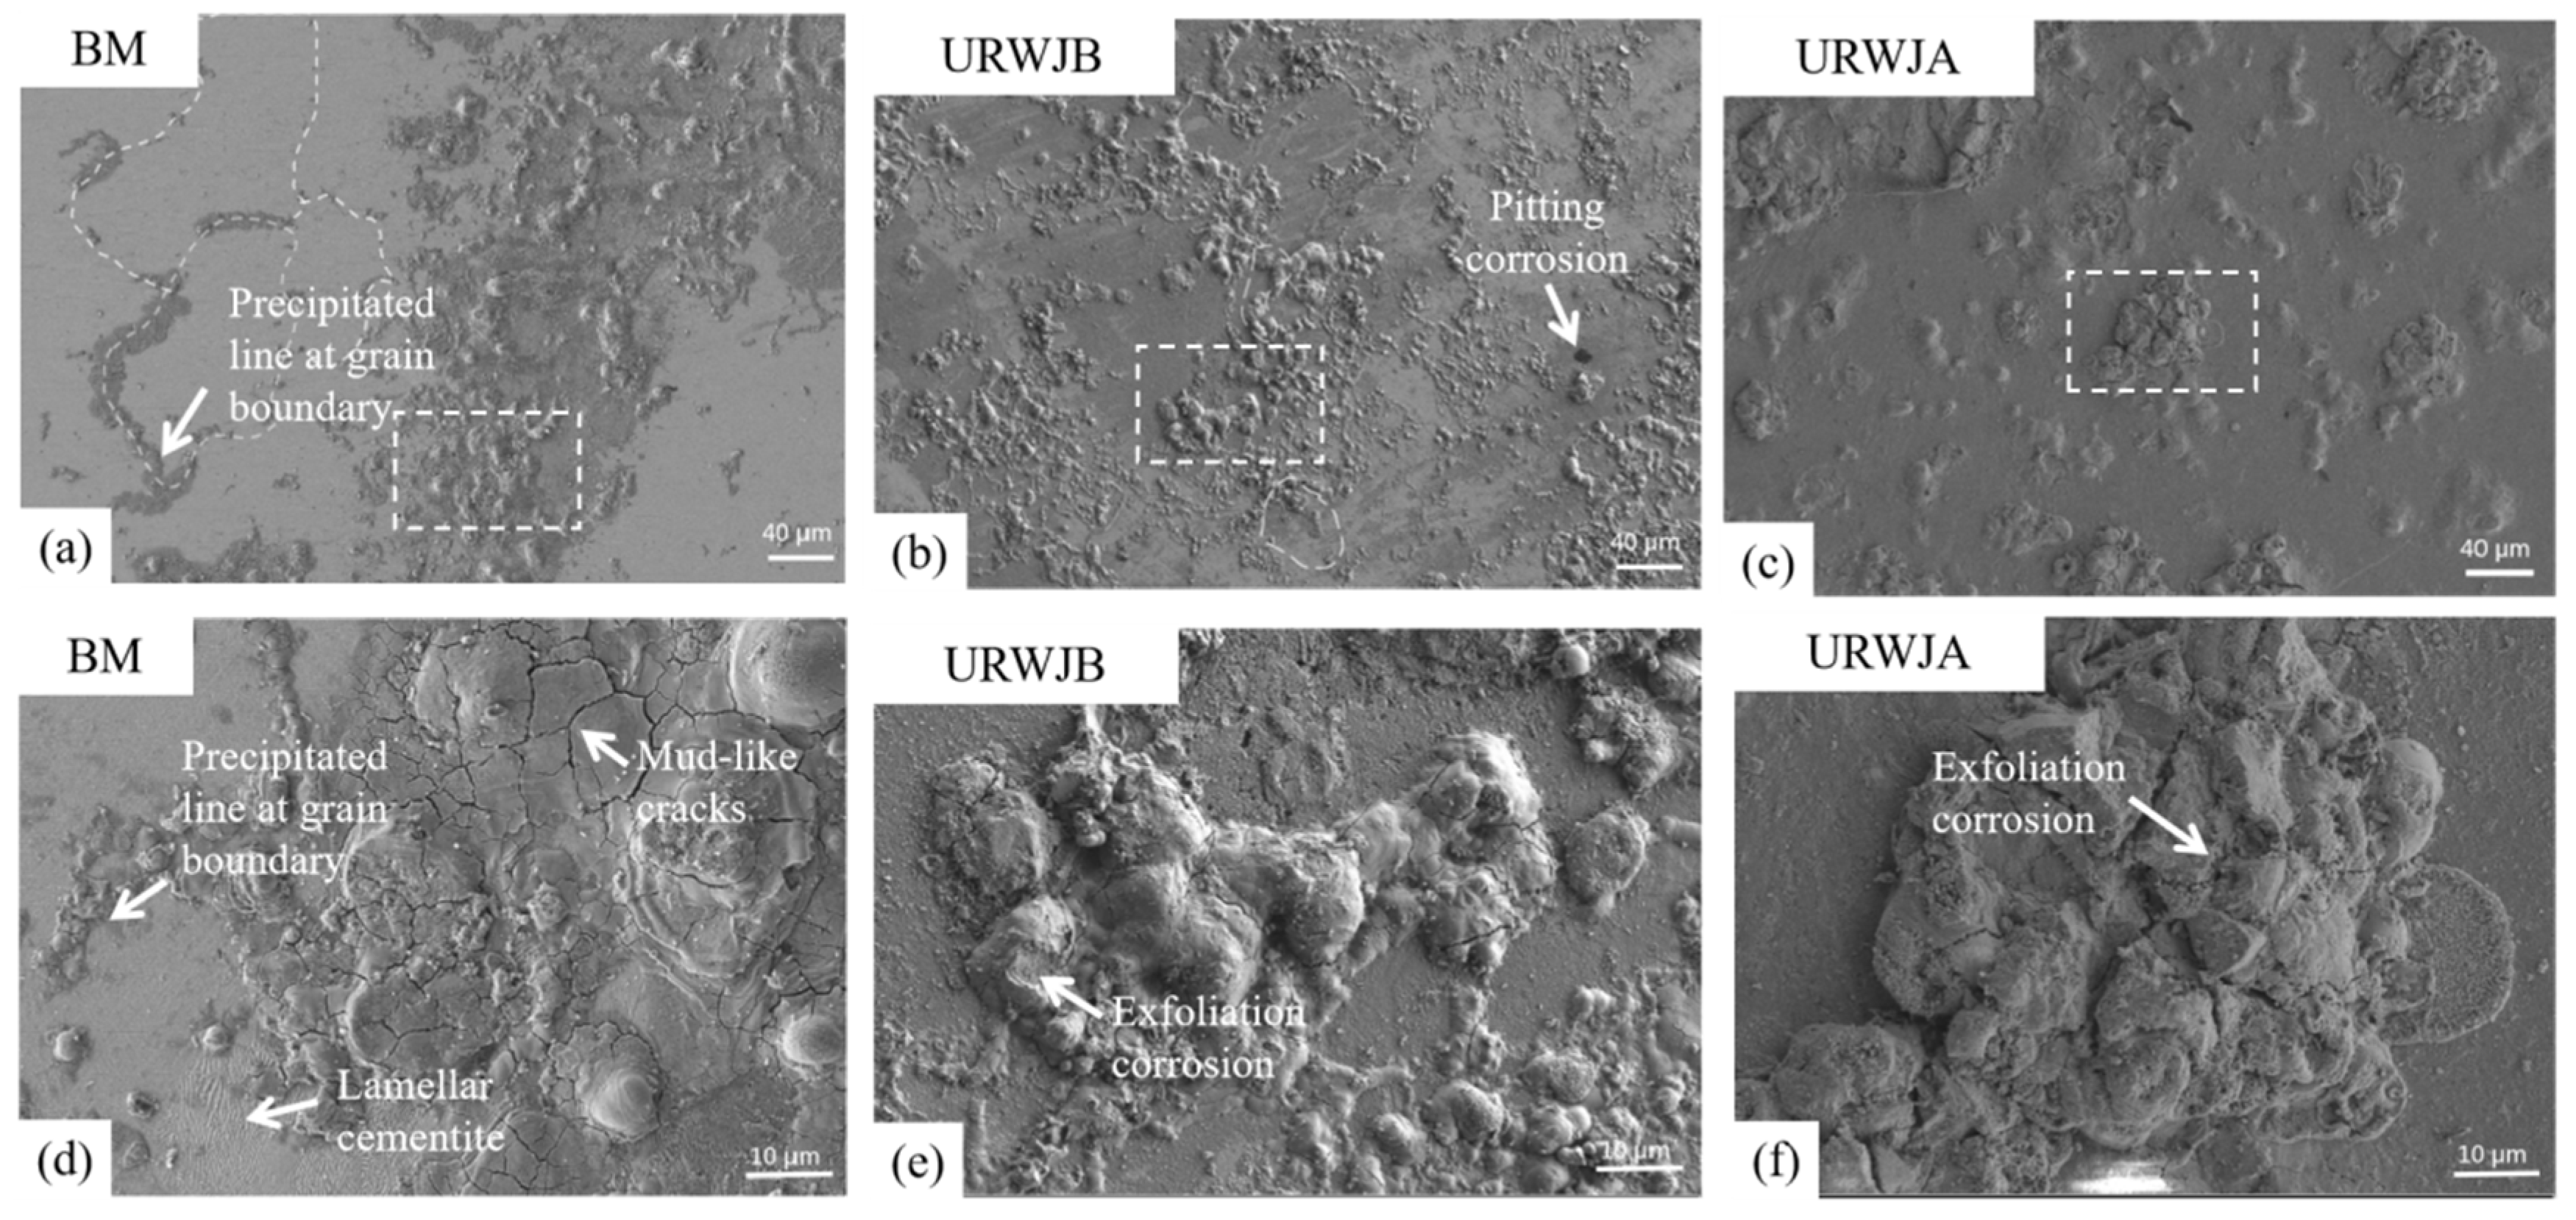
3.5. Morphology Analysis
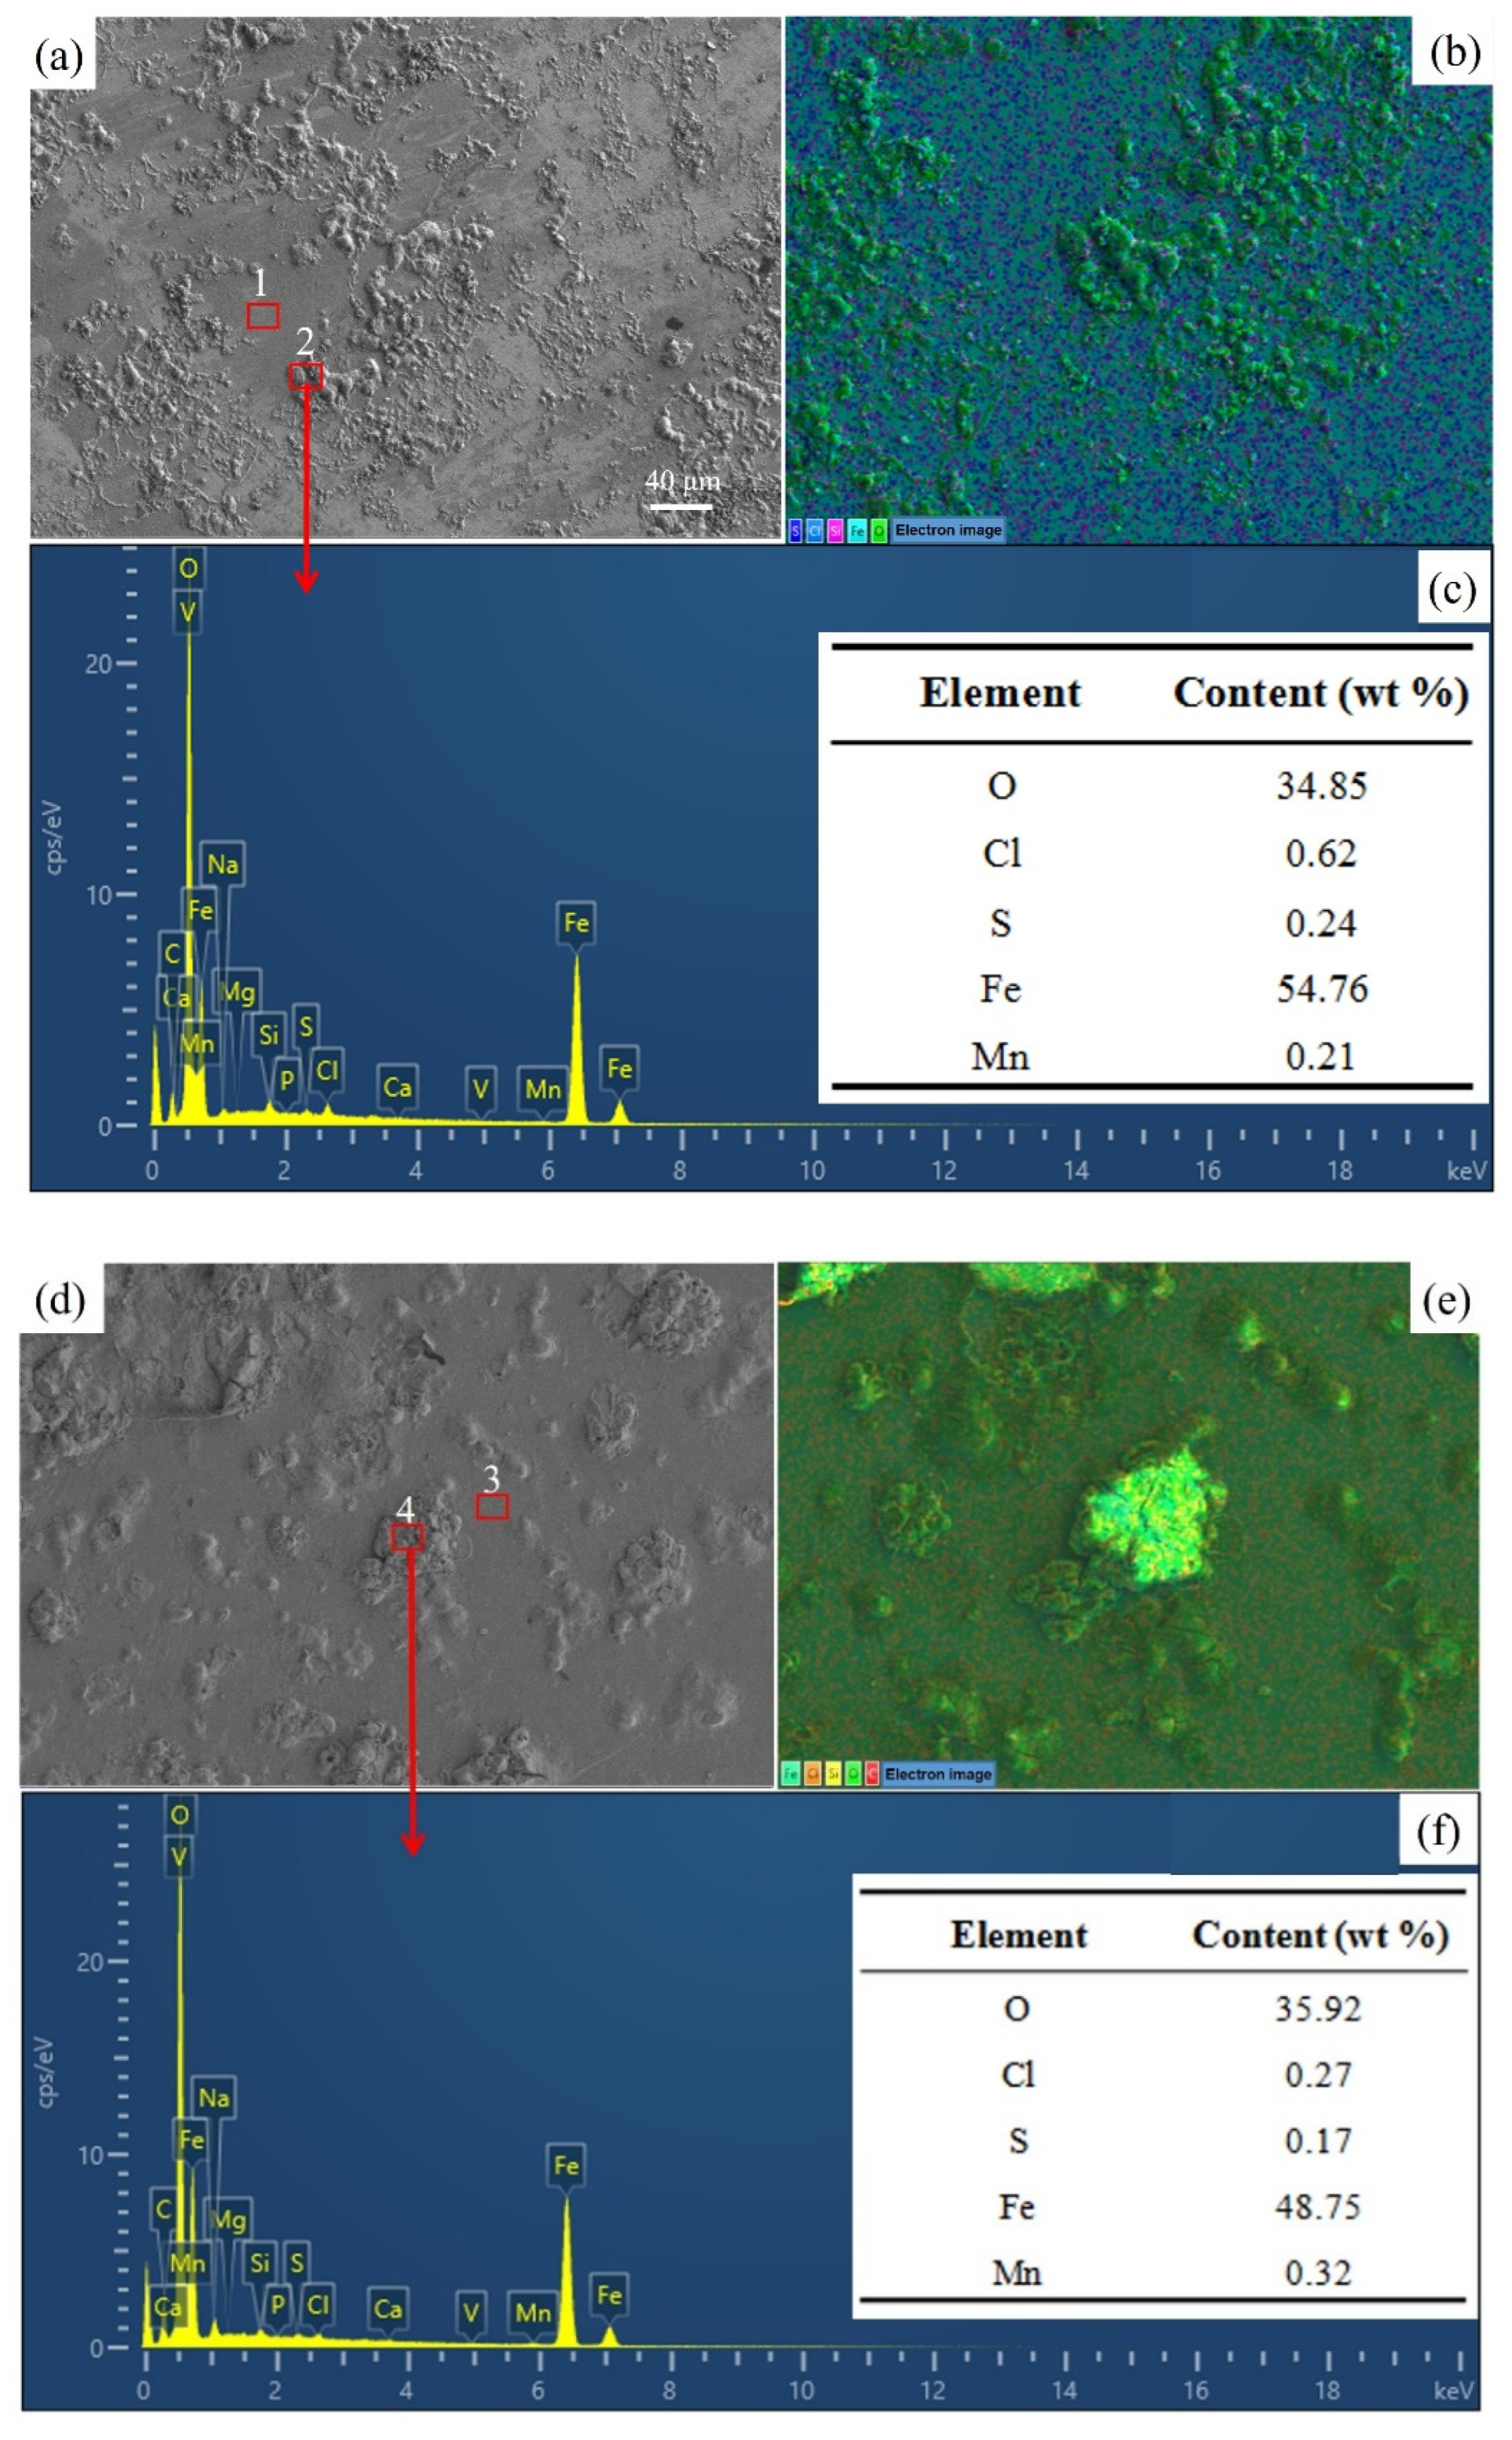
3.6. Component Analysis
4. Conclusions
- (1)
- After the normalising process, the URWJs had smaller and more homogeneous grains, and the average grain diameter changed from 90 μm to 16 μm;
- (2)
- Although the maximum hardness value of the URWJB is larger than that of the URWJA, the URWJB has a more uniform hardness value distribution;
- (3)
- Compared with BM, URWJs exhibited higher self-corrosion currents, more negative self-corrosion potentials, and lower impedance values, indicating better corrosion resistance;
- (4)
- According to the polarisation curve, the URWJA exhibited a smaller self-corrosion current and easier passivation, indicating a lower corrosion rate and better corrosion resistance;
- (5)
- According to the EIS results, the diameter of the capacitive loops, the maximum phase angle, and the |Z| values increased, indicating better corrosion resistance after normalisation in the marine environment;
- (6)
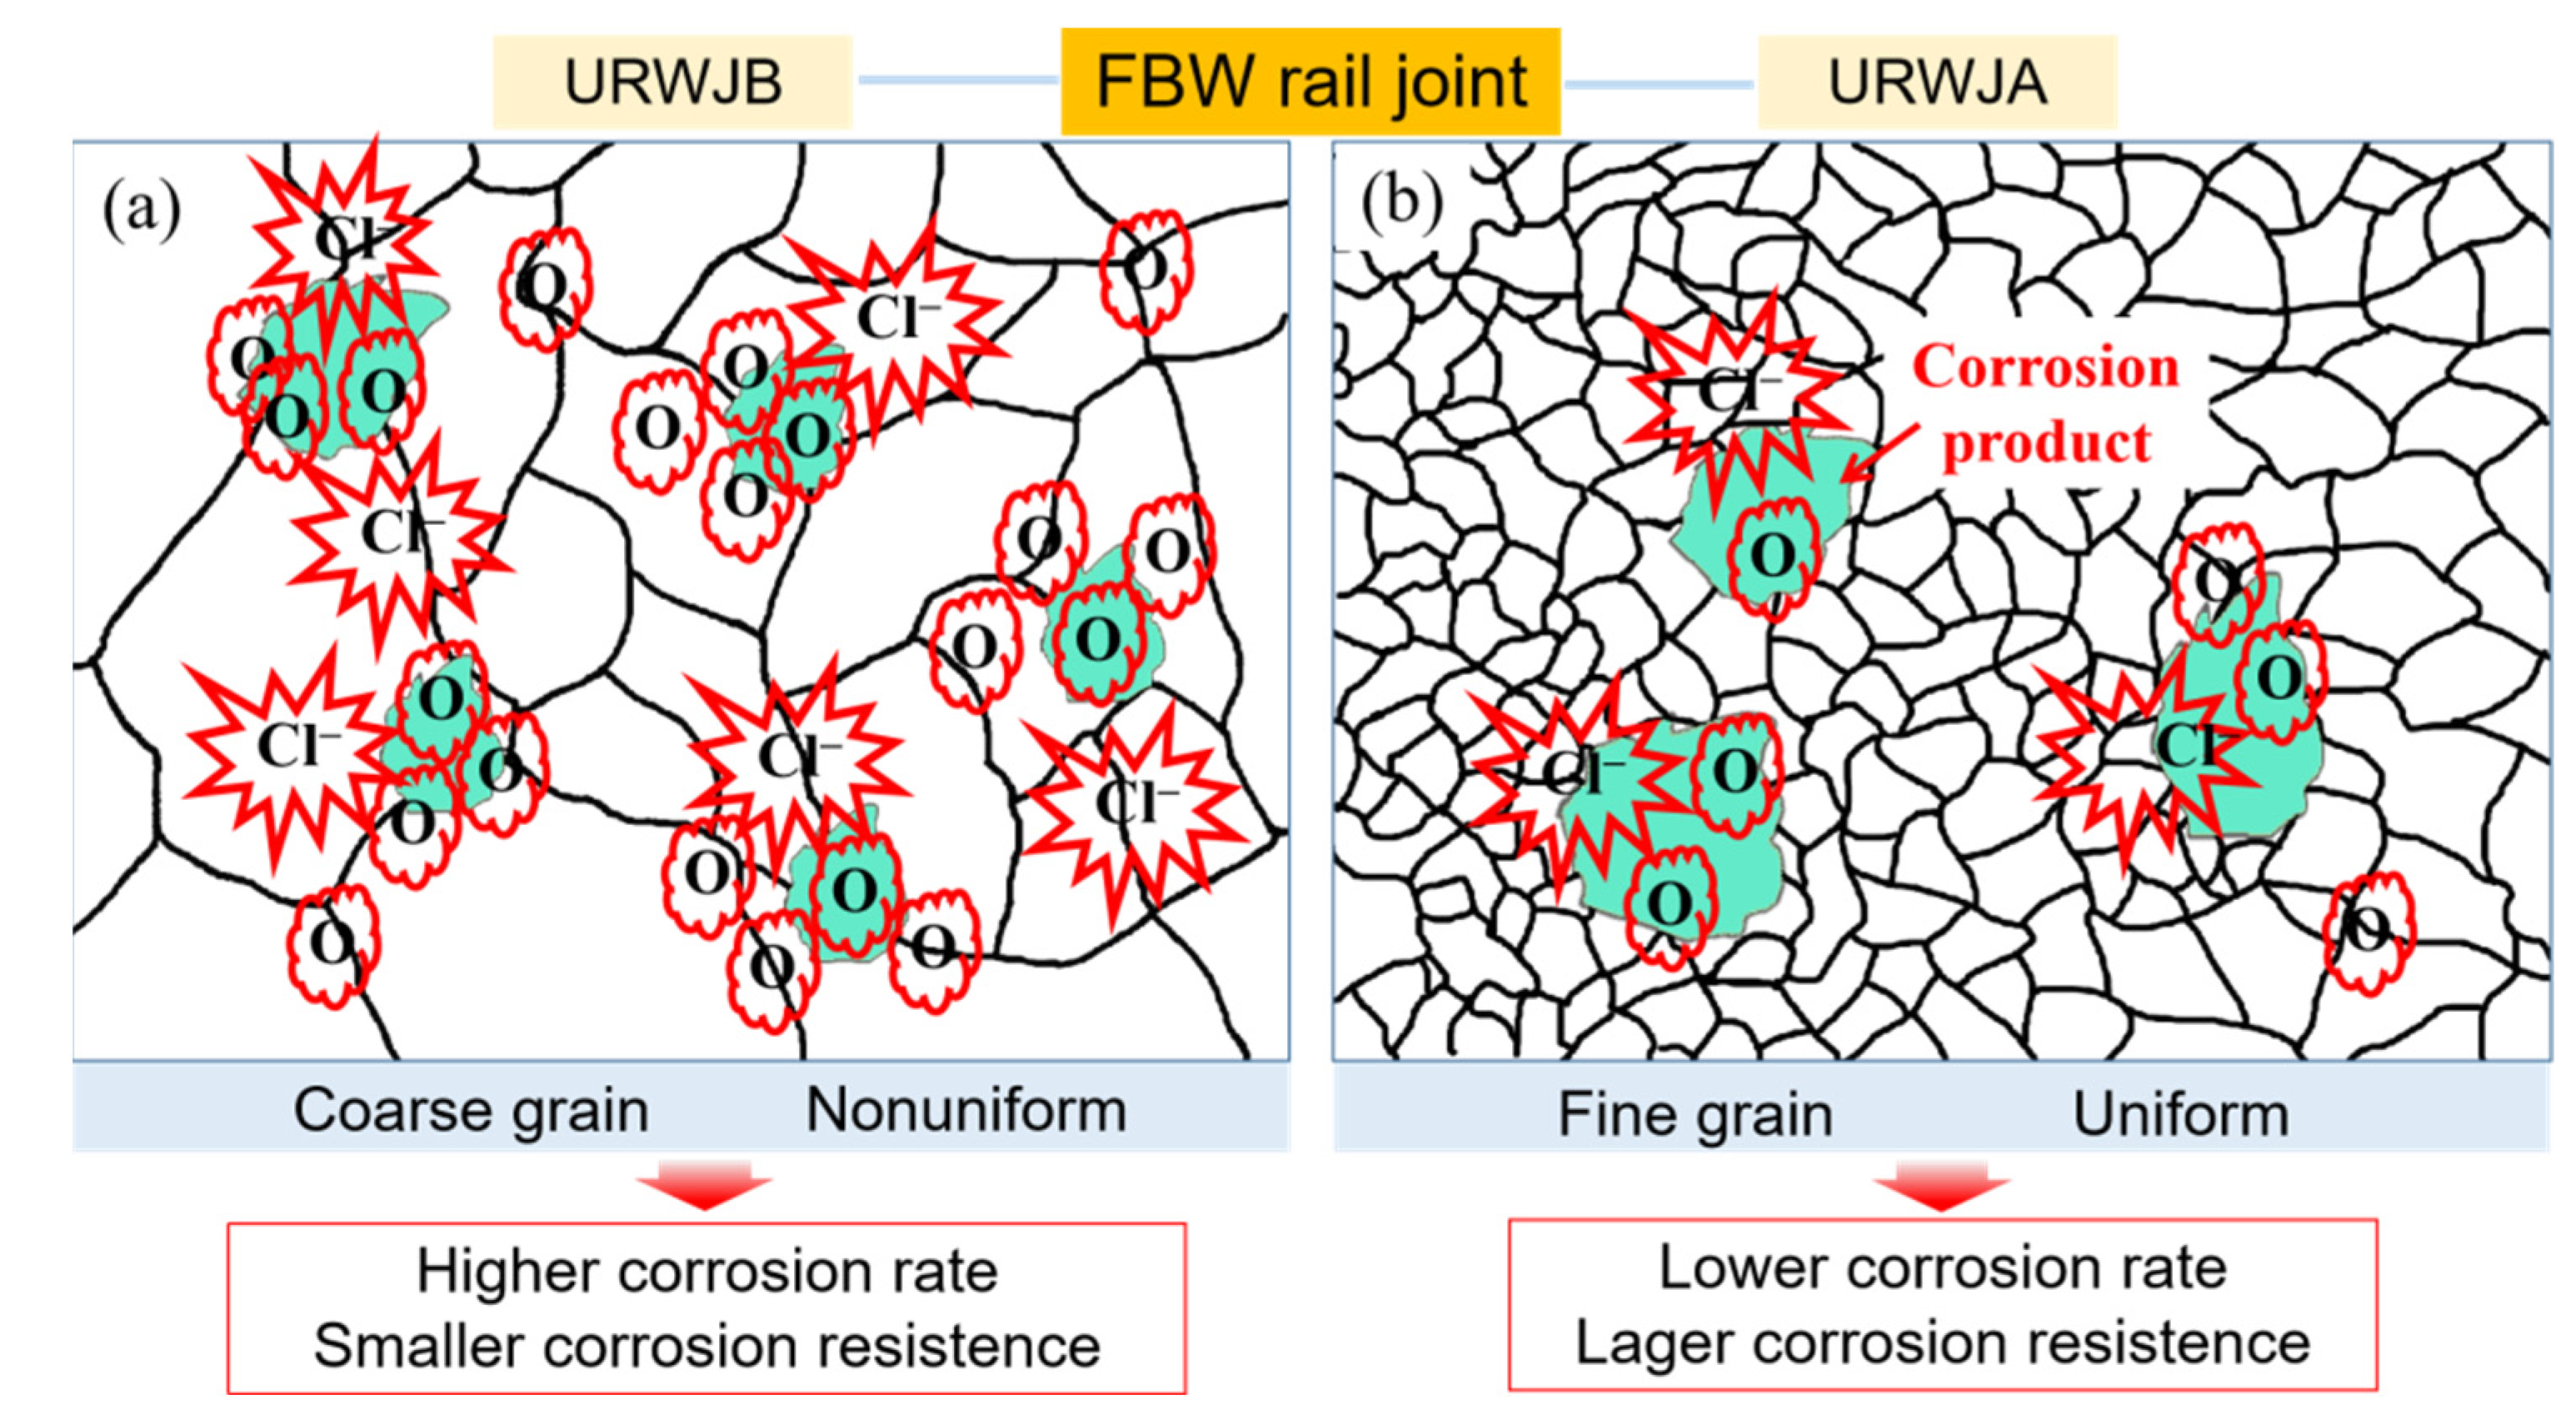
- The finer grains of the normalised joints showed fewer corrosion products, denser passivation films, and less Cl− erosive effects on the cracks and grain boundaries, thus reducing the corrosion rate of the joints.
Author Contributions
Funding
Data Availability Statement
Acknowledgments
Conflicts of Interest
Abbreviations
| FBW | Flash butt welding |
| URWJs U75V | Welded joints |
| URWJB U75V | Welded joints before the normalisation process |
| URWJA U75V | Welded joints after the normalisation process |
| BM | Base metal |
| HAZ | Heat-affected zone |
| WM | Weld metal |
| EIS | Electrochemical impedance spectroscopy |
References
- Jiang, Q.; Guojing, X.U.; Jingpo, Y.U.; Shu, F.; Zhao, H.; Materials, S.O. Study on Microstructure and Mechanical Properties of Flash Butt Welded Joint of NS700 Acid-resistant Steel. Hot Work. Technol. 2017, 46, 220–226. [Google Scholar]
- Porcaro, R.R.; Faria, G.L.; Godefroid, L.B.; Apolonio, G.R.; Cândido, L.; Pinto, E.S. Microstructure and mechanical properties of a flash butt welded pearlitic rail. J. Mater. Process. Technol. 2019, 270, 20–27. [Google Scholar] [CrossRef]
- Sarikavak, Y.; Turkbas, O.S.; Cogun, C. Influence of welding on microstructure and strength of rail steel. Constr. Build. Mater. 2020, 243, 118220. [Google Scholar] [CrossRef]
- Ding, H.; Dai, J.; Dai, T.; Sun, Y.; Lu, T.; Li, M.; Jia, X.; Huang, D. Effect of preheating/post-isothermal treatment temperature on microstructures and properties of cladding on U75V rail prepared by plasma cladding method. Surf. Coat. Technol. 2020, 399, 126122. [Google Scholar] [CrossRef]
- Zhang, B.; Wang, H.; He, B.; Ma, C.; Li, A.; Liu, D. Microstructure and mechanical properties of directed energy deposited U75V/15–5PH structurally graded material. J. Alloy. Compd. 2022, 898, 163001. [Google Scholar] [CrossRef]
- Zhou, L.; Wang, W.J.; Hu, Y.; Marconi, S.; Rindi, A. Study on the wear and damage behaviors of hypereutectoid rail steel in low temperature environment. Wear 2020, 456–457, 203365. [Google Scholar] [CrossRef]
- Bagheri, B.; Abbasi, M.; Abdollahzadeh, A. Microstructure and mechanical characteristics of AA6061-T6 joints produced by friction stir welding, friction stir vibration welding and tungsten inert gas welding: A comparative study. Int. J. Miner. Metall. Mater. 2021, 28, 450–461. [Google Scholar] [CrossRef]
- Jian, H.; Wang, Y.; Yang, X.; Xiao, K. Microstructure and fatigue crack growth behavior in welding joint of Al-Mg alloy. Eng. Fail. Anal. 2021, 120, 105034. [Google Scholar] [CrossRef]
- Liu, F.C.; Hovanski, Y.; Miles, M.P.; Sorensen, C.D.; Nelson, T.W.; Department of Mechanical Engineering Brigham. A review of friction stir welding of steels: Tool, material flow, microstructure, and properties. J. Mater. Sci. Technol. 2018, 1, 43–61. [Google Scholar] [CrossRef]
- Yang, M.; Lu, J.; Chen, J.; Li, Y.; Yang, H. Effect of welding speed on microstructure and corrosion resistance of Al–Li alloy weld joint. Mater. Corros. 2019, 71, 300–308. [Google Scholar] [CrossRef]
- Wang, J.; Zhang, B.; Xu, W.; Zhang, J.; Yang, L.; Peng, Z.; Hou, B. Microstructure refinement on crevice corrosion of high-speed rail steel U75V visualized by in-situ monitoring system. Front. Mater. 2022, 8, 820721. [Google Scholar] [CrossRef]
- Xu, W.; Deng, Y.; Zhang, B.; Zhang, J.; Peng, Z.; Hou, B.; Duan, J. Crevice corrosion of U75V high-speed rail steel with varying crevice gap size by in-situ monitoring. J. Mater. Res. Technol. 2022, 16, 1856–1874. [Google Scholar] [CrossRef]
- Zhao, X.; Fan, Y.; Liu, Y.; Wang, H.; Dong, P. Evaluation of fatigue fracture mechanism in a flash butt welding joint of a U75V type steel for railroad applications. Eng. Fail. Anal. 2015, 55, 26–38. [Google Scholar] [CrossRef]
- Zou, D.; Yang, Q.; Lu, G. Rail Failure Analysis and Damage Maps; China Railway: Beijing, China, 2019; pp. 96–97. ISBN 978-7-113-11473-2. [Google Scholar]
- Shamsudeen, S.; John, E.R.D. Effect of Welding on Pitting and Intergranular Corrosion Behavior of Marine Grade Aluminum Alloy. Mater. Perform. Charact. 2019, 8, 20180118. [Google Scholar] [CrossRef]
- Sulaiman, S.A.; Abdullah, B.; Alias, S.K.; Ahmad, N.N.; Aziz, M.N.A. Investigation of Corrosion Rate for Different Type of Welding Joints using Shielded Metal Arc Welding (SMAW). IOP Conf. Ser. Mater. Sci. Eng. 2020, 834, 012055. [Google Scholar] [CrossRef]
- Ding, J.; Zhang, Z.M.; Wang, J.Z.; Wang, J.Q.; Han, E.H. Corrosion behavior of different parts of the weld of 316L/52M/A508 dissimilar metal welded joint in simulated pressurized water reactor primary water. Mater. Corros. 2016, 66, 1435–1444. [Google Scholar] [CrossRef]
- Dudzik, K.; Jurczak, W. Influence of Friction Stir Welding on Corrosion Properties of Aw-7020M Alloy in Sea Water. Adv. Mater. Sci. 2015, 15, 7–13. [Google Scholar] [CrossRef]
- Zeng, C.Y.; Zhang, Y.P.; Hu, J.L.; Hou, B.; Wang, H.Y.; Dong, C.; Zhou, Y. The role of microstructure on corrosion fatigue behavior of thick-plate Ti–6Al–4V joint via vacuum electron beam welding. Vacuum 2020, 182, 109714. [Google Scholar] [CrossRef]
- Mahmoud Zaghloul, M.Y.; Yousry Zaghloul, M.M.; Yousry Zaghloul, M.M. Physical analysis and statistical investigation of tensile and fatigue behaviors of glass fiber-reinforced polyester via novel fibers arrangement. J. Compos. Mater. 2022. [Google Scholar] [CrossRef]
- Sinhmar, S.; Dwivedi, D.K. A study on corrosion behavior of friction stir welded and tungsten inert gas welded AA2014 aluminium alloy. Corros. Sci. 2018, 133, 25–35. [Google Scholar] [CrossRef]
- Xu, Y.; Hou, X.; Shi, Y.; Zhang, W.; Gu, Y.; Feng, C.; Volodymyr, K. Correlation between the microstructure and corrosion behavior of copper/316 L stainless-steel dissimilar-metal welded joints. Corros. Sci. 2021, 191, 109729. [Google Scholar] [CrossRef]
- Liu, L.; Xu, R. Investigation of corrosion behavior of Mg-steel laser-TIG hybrid lap joints. Corros. Sci. 2012, 54, 212–218. [Google Scholar] [CrossRef]
- Ziemian, C.W.; Sharma, M.M.; Whaley, D.E. Effects of flashing and upset sequences on microstructure, hardness, and tensile properties of welded structural steel joints. Mater. Des. 2012, 33, 175–184. [Google Scholar] [CrossRef]
- Bauri, L.F.; Alves, L.H.D.; Pereira, H.B.; Tschiptschin, A.P.; Goldenstein, H. The role of welding parameters on the control of the microstructure and mechanical properties of rails welded using FBW. J. Mater. Res. Technol. 2020, 9, 8058–8073. [Google Scholar] [CrossRef]
- TB/T 1632-2014; Railway Applications-Track-Flash Butt Welding of Rails. China Railway: Beijing, China, 2014.
- TB/T 2344-2020; Rails—Part 1: 43 kg/m~75 kg/m Rails. China Railway: Beijing, China, 2020.
- Bijanrostami, K.; Barenji, R.V. Underwater dissimilar friction stir welding of aluminum alloys: Elucidating the grain size and hardness of the joints. Proc. Inst. Mech. Eng. Part L J. Mater. Des. Appl. 2019, 233, 763–775. [Google Scholar] [CrossRef]
- Liang, W.X.; Xian, Y.Z.; Yue, X.F.; Wei, J.S.; Peng, W.; Cheng, J.; Xiong, X.; Song, Y.; Yu, L.S. Microstructure and Mechanical Properties of Friction Stir-Welded Dissimilar Joints of ZK60 and Mg-4.6Al-1.2Sn-0.7Zn Alloys. Materials 2021, 15, 23–38. [Google Scholar]
- Wang, Z.; Zhou, Z.Q.; Zhang, L.; Hu, J.Y.; Zhang, Z.R.; Lu, M.X. Effect of pH on the Electrochemical behavior and Passive Film Composition of 316L Stainless Steel. Acta Metall. Sin. (Engl. Lett.) 2019, 32, 585–598. [Google Scholar] [CrossRef]
- Rovere, C.A.D.; Alano, J.H.; Silva, R.; Nascente, P.; Otubo, J.; Kuri, S.E. Characterization of passive films on shape memory stainless steels. Corros. Sci. 2012, 57, 154–161. [Google Scholar] [CrossRef]
- Fajardo, S.; Bastidas, D.M.; Criado, M.; Bastidas, J.M. Electrochemical study on the corrosion behavior of a new low-nickel stainless steel in carbonated alkaline solution in the presence of chlorides. Electrochim. Acta 2014, 129, 160–170. [Google Scholar] [CrossRef]
- Qiang, Y.; Zhang, S.; Guo, L.; Zheng, X.; Xiang, B.; Chen, S. Experimental and theoretical studies of four allyl imidazolium-based ionic liquids as green inhibitors for copper corrosion in sulfuric acid. Corros. Sci. 2017, 119, 68–78. [Google Scholar] [CrossRef]
- Cui, Z.; Wang, L.; Ni, H.; Hao, W.; Man, C.; Chen, S.; Wang, X.; Liu, Z.; Li, X. Influence of temperature on the electrochemical and passivation behavior of 2507 super duplex stainless steel in simulated desulfurized flue gas condensates. Corros. Sci. 2017, 118, 31–48. [Google Scholar] [CrossRef]
- Chen, Z.; Wei, Z.; Chen, Y.; Nong, Y.; Yi, C. Molecular insight into iron corrosion induced by chloride and sulphate. Comput. Mater. Sci. 2022, 209, 111429. [Google Scholar] [CrossRef]
- Zahs, A.; Spiegel, M.; Grabke, H.J. Chloridation and oxidation of iron, chromium, nickel and their alloys in chloridizing and oxidizing atmospheres at 400–700 °C. Corros. Sci. 2000, 42, 1093–1122. [Google Scholar] [CrossRef]


| C | Si | Mn | S | P | V | Fe |
|---|---|---|---|---|---|---|
| 0.71~0.8 | 0.50~0.80 | 0.75~1.05 | <0.025 | <0.02 | 0.04~0.12 | Balance |
| Yield Strength Rp0.2 (MPa) | Tensile Strength Rm (MPa) | Elongation A (%) | Hardness of Rail Head (HB) |
|---|---|---|---|
| >510 | >980 | >10 | 280–320 |
| Salt | Concentration |
|---|---|
| NaCl | 105.00 |
| MgCl2 | 12.7 |
| MgSO4·7H2O | 7.7 |
| CaSO4·2H2O | 12.15 |
| CaCO3 | 0.5 |
| Samples | Self-Corrosion Potential (mV) | Self-Corrosion Current (A/cm2) | Corrosion Rate (mm/A) |
|---|---|---|---|
| BM | −0.803 | 1.12 × 10⁻⁴ | 1.309 |
| URWJB | −0.828 | 4.84 × 10⁻⁴ | 5.647 |
| URWJA | −0.850 | 1.83 × 10⁻⁴ | 2.162 |
| Sample | R1 (Ω) | Y0-Q1 (Ω−1 cm−2 Sn) | n-Q1 | R2 (Ω cm2) | Y0-Q2 (Ω−1 cm−2 Sn) | n-Q2 | R3 (Ω cm2) | X2 Chi-Squared | R1 + R2 + R3 (Ω cm2) |
|---|---|---|---|---|---|---|---|---|---|
| BM | 3.421 | 4.2662 × 10⁻⁶ | 0.8408 | 4682 | 3.042 × 10⁻⁵ | 0.4114 | 16,118 | 5.753 × 10⁻⁴ | 20,308 |
| URWJB | 5.373 | 2.873 × 10⁻⁴ | 0.7644 | 34.51 | 1.717 × 10⁻⁴ | 0.7219 | 1712 | 2.563 × 10⁻⁴ | 1751 |
| URWJA | 4.79 | 6.73 × 10⁻⁴ | 0.7339 | 202.1 | 2.435 × 10⁻⁴ | 0.8589 | 1774 | 8.984 × 10⁻⁴ | 1980 |
| Location No. | Sample | O | Cl | S | Fe | Mn |
|---|---|---|---|---|---|---|
| 1 | The product-free microzone of URWJB | 5.06 | 0.19 | 0.04 | 86.37 | 1.10 |
| 2 | Corrosion product of URWJB | 34.85 | 0.62 | 0.24 | 54.76 | 0.21 |
| 3 | The product-free microzone of URWJA | 5.54 | 0.04 | 0.07 | 86.48 | 1.00 |
| 4 | Corrosion product of URWJA | 35.92 | 0.27 | 0.17 | 48.75 | 0.32 |
Publisher’s Note: MDPI stays neutral with regard to jurisdictional claims in published maps and institutional affiliations. |
© 2022 by the authors. Licensee MDPI, Basel, Switzerland. This article is an open access article distributed under the terms and conditions of the Creative Commons Attribution (CC BY) license (https://creativecommons.org/licenses/by/4.0/).
Share and Cite
Zhang, X.; Liao, T.; Lv, Q.; Gou, G. Effect of Normalising Process on the Corrosion Behaviour of U75V Rail Flash Butt Welded Joints in a Marine Environment. Metals 2022, 12, 2146. https://doi.org/10.3390/met12122146
Zhang X, Liao T, Lv Q, Gou G. Effect of Normalising Process on the Corrosion Behaviour of U75V Rail Flash Butt Welded Joints in a Marine Environment. Metals. 2022; 12(12):2146. https://doi.org/10.3390/met12122146
Chicago/Turabian StyleZhang, Xi, Tingting Liao, Qibing Lv, and Guoqing Gou. 2022. "Effect of Normalising Process on the Corrosion Behaviour of U75V Rail Flash Butt Welded Joints in a Marine Environment" Metals 12, no. 12: 2146. https://doi.org/10.3390/met12122146
APA StyleZhang, X., Liao, T., Lv, Q., & Gou, G. (2022). Effect of Normalising Process on the Corrosion Behaviour of U75V Rail Flash Butt Welded Joints in a Marine Environment. Metals, 12(12), 2146. https://doi.org/10.3390/met12122146