Article

Application of Four Different Models for Predicting the High-Temperature Flow Behavior of 1420 Al–Li Alloy

1
School of Materials Science and Engineering, Jiangsu University, Zhenjiang 212013, China
2
AVIC Manufacturing Technology Institute, Beijing 100024, China
*
Authors to whom correspondence should be addressed.
Yuyan Yang and Xiaohui Dong contributed equally to this work and should be considered co-first authors.
Metals 2022, 12(12), 2029; https://doi.org/10.3390/met12122029
Submission received: 2 November 2022 / Revised: 22 November 2022 / Accepted: 23 November 2022 / Published: 26 November 2022
(This article belongs to the Section Additive Manufacturing)

Abstract

:
In this paper, the high-temperature rheological behavior of 1420 aluminum–lithium alloy under experimental conditions (temperatures of 350–475 °C and strain rates of 0.01–10 s−1) was systematically investigated using a Gleeble-3500 thermal simulation tester (temperature 350~475 °C, strain rate of 0.01~10 s−1). Based on the flow stress curves of this alloy, four different types of high-temperature constitutive models of the alloy were constructed: the Arrhenius (AR) model, the Modified Johnson–Cook (MJC) model, the Modified Zerilli–Armstrong (MZA) model, and the VOCE model. The prediction accuracy of the four constitutive models was compared, and the response of the accuracy of the four constitutive models to the deformation parameters (temperature, deformation rate, and strain) was analyzed. The results showed that the VOCE, AR, and MZA models had high overall prediction accuracy with average absolute relative error (AARE) of 1.8933%, 3.9912%, and 7.8422%, respectively. The VOCE model could achieve the prediction of large strain deformation resistance under small strain with small batch experimental conditions for the corresponding conditions. The AR model had optimal prediction accuracy for the high-rate deformation process. The MJC model had the optimal prediction accuracy for the low-temperature low-rate deformation process. The MZA model had better prediction accuracy for the low-rate high-temperature deformation process. The 1420 aluminum–lithium alloy process parameters selection area constitutive model matching diagram was constructed.

1. Introduction

Aluminum–lithium alloys are widely used in modern aerospace applications due to the addition of the lightest metal element, Li. Compared with traditional aerospace aluminum alloys, Al–Li alloys can reduce the structural weight by 10–15% and increase the stiffness by more than 15%. with good heat resistance and corrosion resistance, while meeting the service requirements [1,2]. Al–Li alloys are considered strategic materials for the 21st century [3,4]. The 1420 Al–Li alloy is a typical second-generation Al–Li alloy, which is commonly used in the preparation of thin-shell structures, such as in rocket fuel tanks, and is extremely sensitive to the temperature and rate of the thermal deformation process. The study of high-temperature rheological properties of materials and the establishment of the intrinsic structural model of materials is the basis for the study of thermal processing processes and the formulation of process parameters [5]. Therefore, the establishment of high-precision intrinsic structural models is of great engineering and academic significance for the development of the hot-forming process of aerospace aluminum–lithium alloys.
As a basis for studying the thermal deformation behavior of metal materials and deformation processes, the constitutive model describes the relationship between deformation stresses and key deformation parameters (temperature, rate, etc.) during the deformation of metal materials in thermal deformation by mathematical methods, to guide practical process formulation. For decades, many researchers have been working to develop effective constitutive models for metal heat deformation. Currently, the more applied constitutive models are divided into three main categories: image-only constitutive models, based on experimental experience, constitutive models, based on the actual physical signs of the material, and constitutive models, based on artificial neural networks [6]. Ashtiani et al. [7] studied the thermal deformation of AA1070 aluminum alloy by proposing a new intrinsic constitutive model, which can obtain the key parameters by reducing the number of tests, while improving the material properties. Shi et al. [8] investigated the effect of deformation temperature and strain rate on the activation energy of AA7150 aluminum alloy by constructing a hyperbolic sinusoidal intrinsic structure, and then guided the development of deformation process parameters. Meanwhile, a suitable intrinsic structural model is important for the numerical simulation and analytical study of the thermoforming process of metallic materials. Liu et al. [9] investigated the roll-forging technology of Hastelloy C-276 alloy, and the reliability of the numerical simulation results depended largely on the accuracy of the intrinsic constitutive equations describing the flow stresses. Zhao et al. [10] investigated the flow stress model of 7A04 aluminum alloy, which is considered the most important sub-model in the finite element simulation model of the hot forming process. Therefore, the establishment of accurate intrinsic constitutive equations is essential to optimize the parameters of the material thermoforming process to obtain higher mechanical properties. However, the current academic research on the present constitutive equations mainly focuses on matching materials with a single model, i.e., determining a certain best-fit intrinsic constitutive model by comparing the accuracy of different models. By comparing four constitutive models of TG6 alloy, Yu et al. [11] found that the MJC and AR models can be considered the best choice to describe and predict the flow stress behavior of TG6 titanium alloy relatively accurately by calculating the average absolute relative error (AARE) and correlation coefficient R2 of the four models. However, such models ignore the effect of deformation conditions on the accuracy of the models. It is well known that Al–Li alloy is a deformation parameter-sensitive material. The deviation of deformation parameters leads to strong changes in the microstructure and properties of the material, and different processes possess different processing conditions (temperature, rate, deformation), so there is an urgent need to propose different intrinsic model construction methods for different process parameter ranges and process R&D needs.
In this study, the high-temperature rheological curves of the extruded 1420 Al–Li alloy were obtained by hot compression tests with an advanced Gleeble-3500 thermal simulation tester. Based on the collected data, four commonly used constitutive models were constructed: the Arrhenius (AR) model, the Modified Johnson–Cook (MJC) model, the VOCE model, and the Modified Zerilli–Armstrong (MZA) model based on physical significance. The predictive capability of the four constitutive models and their accuracy at different temperatures, rates, and strain variables were analyzed and compared to classify the conditions of applicability of the different constitutive models. It is expected to provide a theoretical basis for the selection of the constitutive model for the subsequent study of the rheological behavior of 1420 Al–Li alloy under different conditions, and to lay the foundation for the application of the constitutive model in finite element numerical simulations.

2. Experiments and Methods

The material used in this experiment was an aerospace 1420 Al–Li alloy which was prepared by using spray deposition continuous extrusion. The experimentally obtained chemical composition is shown in Table 1. The experimental 1420 Al–Li alloy was machined into a cylindrical specimen of φ10 mm × 20 mm by wire electrical discharge machining (Taizhou Xianglong CNC Machine Tool Co., Ltd., Taizhou, China), and the cylindrical specimen was ultrasonically cleaned and polished before being subjected to a single-pass high-temperature compression test using a Gleeble-3500 thermal simulation tester (Dynamic Systems Inc., Texas, USA). To reduce the friction between the two ends of the specimen and the indenter during the compression process, and to prevent the “bulging” effect, two graphite sheets were pasted on the two ends of the specimen before compression. The specimens were heated to the heat deformation temperature (350 ℃, 375 ℃, 400 ℃, 425 ℃, 450 ℃, 475 ℃) according to the heat deformation process parameters shown in Figure 1 and then held for 30 s. After the specimens were uniformly heated, compression tests were conducted at different strain rates (0.01 s−1, 0.1 s−1, 1 s−1, 5 s−1, 10 s−1). The specimens were removed immediately after deformation and quenched and cooled to room temperature. The temperature, true stress, true strain, and strain rates from the thermal simulation tester were imaged to obtain flow stress curves and to conduct subsequent studies.

3. Results

3.1. True Stress–Strain Curve of the Material

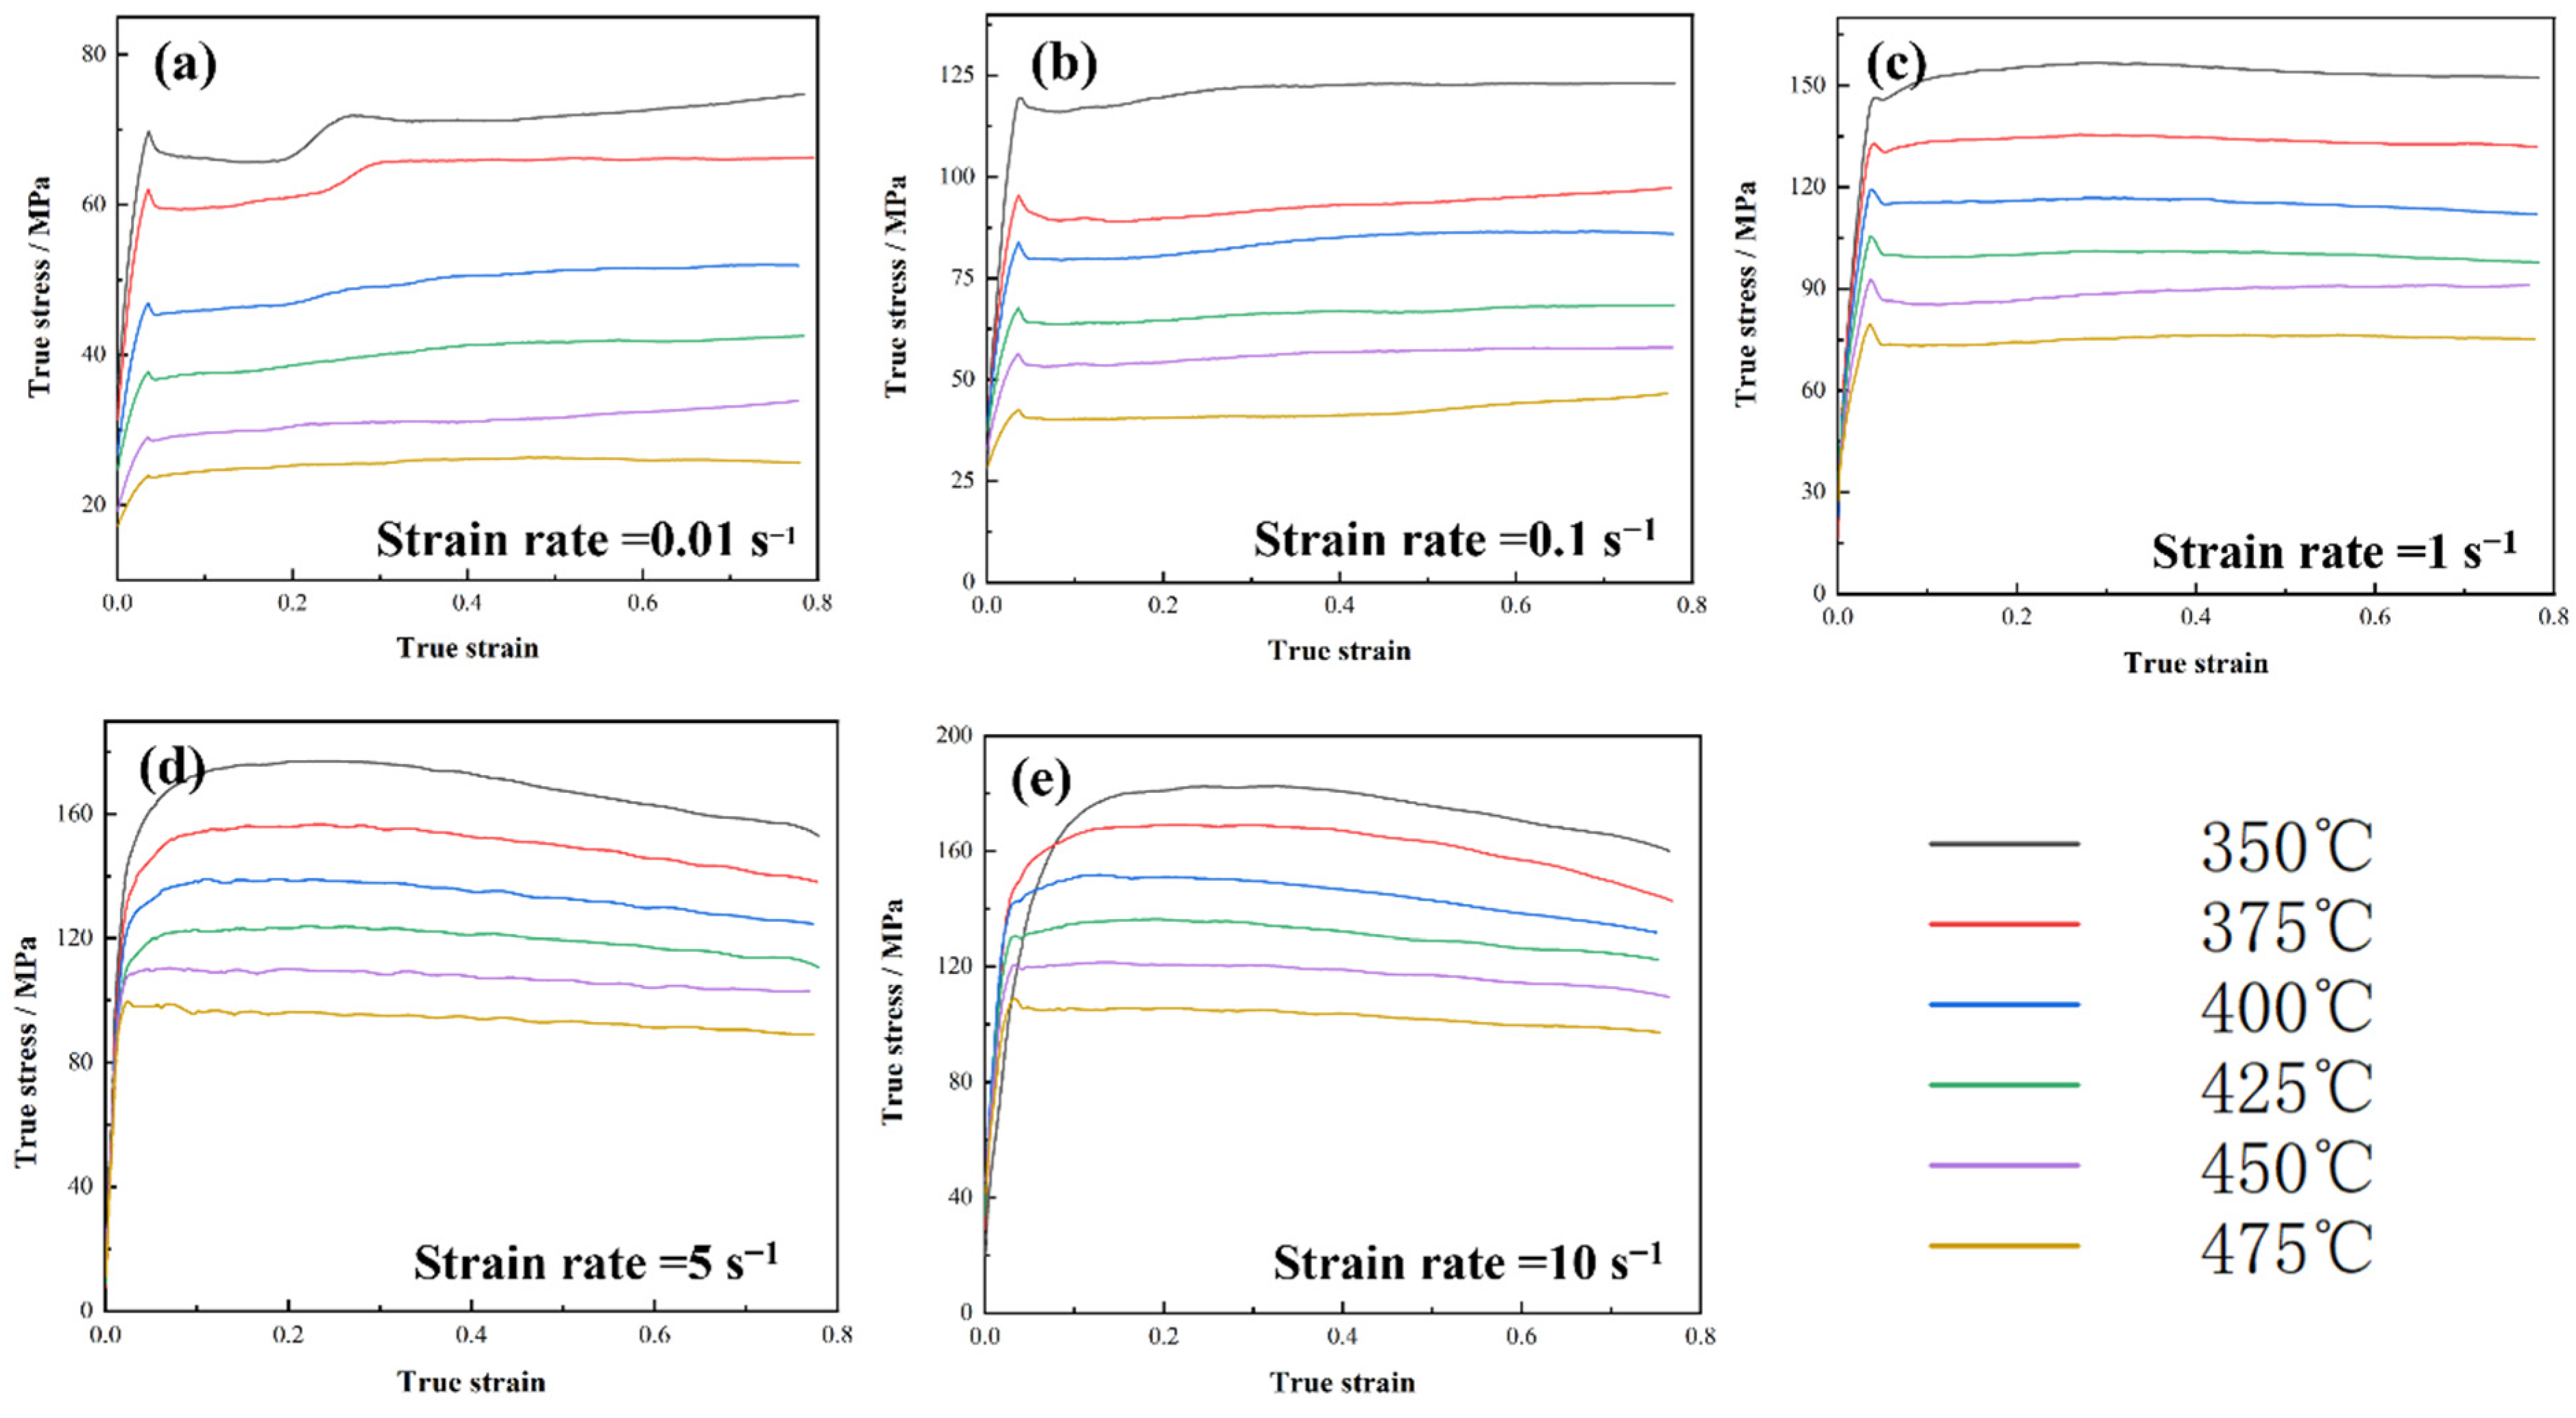
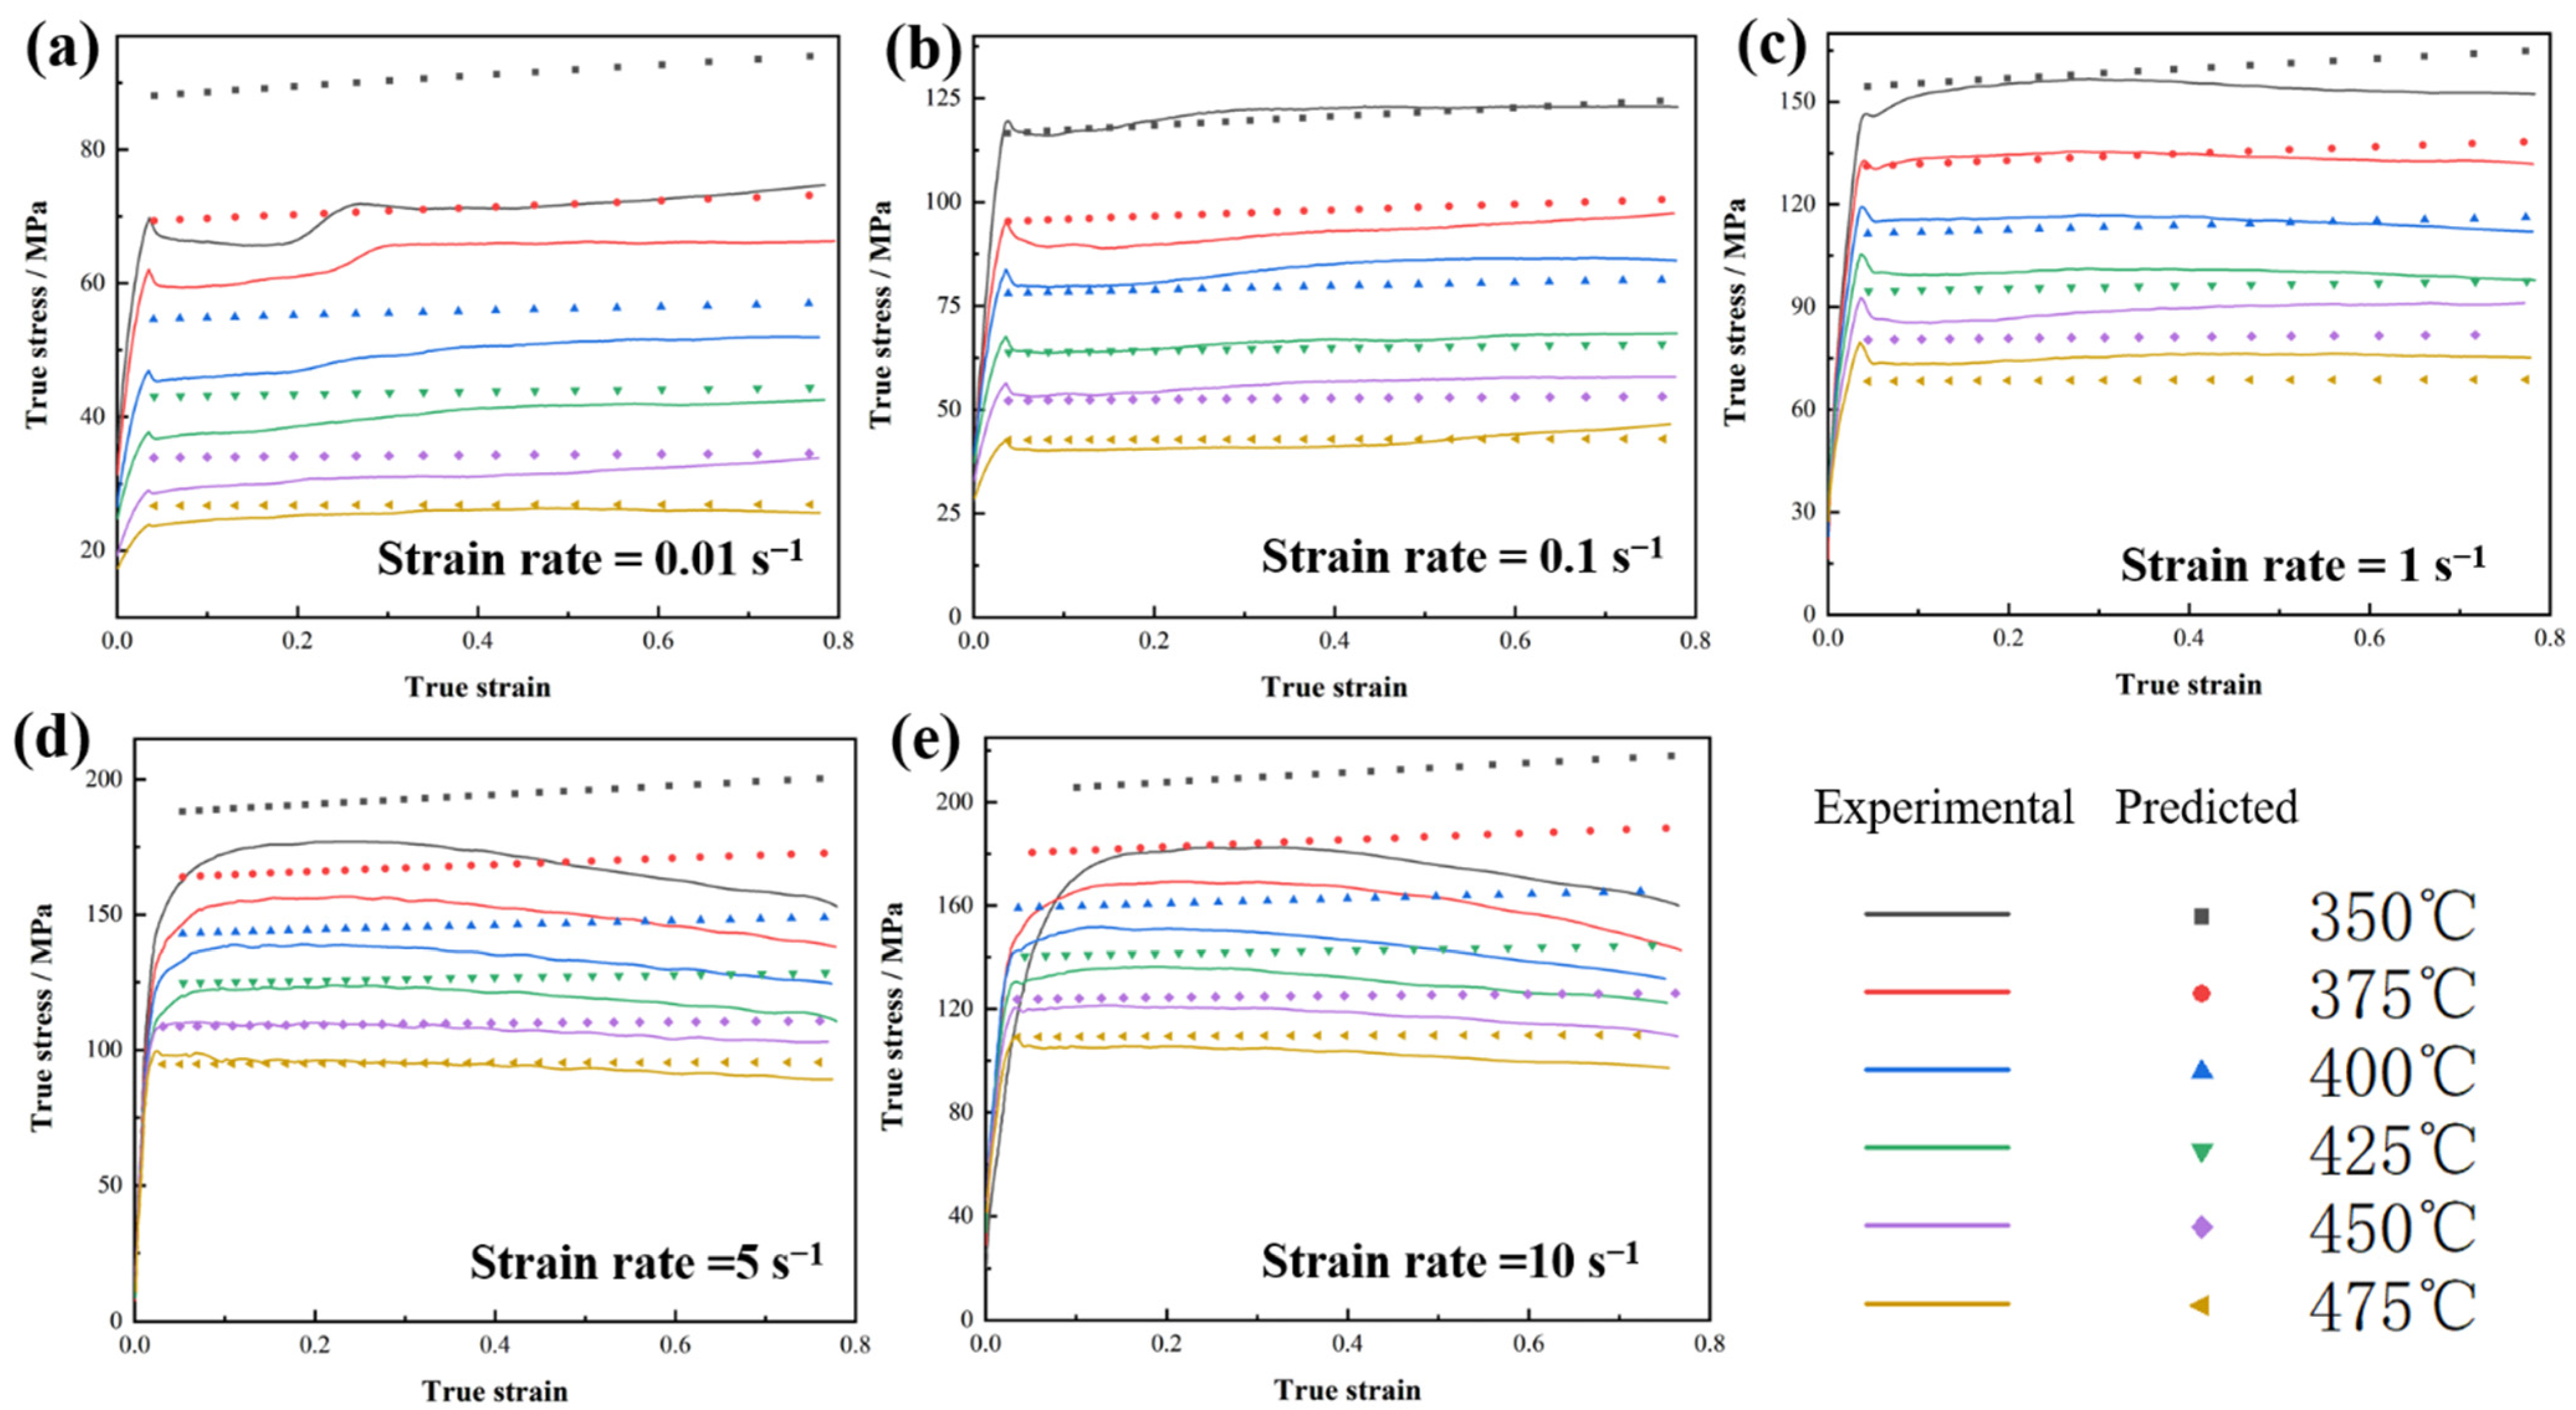
Figure 2 shows the flow stress curves of 1420 Al–Li alloy under different deformation conditions (deformation temperature of T = 350 °C~475 °C, deformation rate of ε ˙ = 0.01 s−1~10 s−1). The temperature range and rate range selected for the experiments in this paper included all common processing conditions for the high-temperature plastic deformation process of 1420 Al–Li alloy. It can be seen from Figure 2 that 1420 Al–Li alloy was very sensitive to deformation parameters. The flow stress showed a negative correlation with temperature and a positive correlation with strain rate, and the change of deformation conditions strongly affected the type of rheological curves (work-hardening, dynamic recrystallization, and dynamic reversion). Usually, when processing process parameters are formulated, different curve types represent the softening tendency of the tissue obtained by the material at that temperature [12], and its rheological stress represents the size of its deformation resistance and the ease of deformation, and the process parameters are judged based on these two points. At the initial stage of deformation, the specimen showed an obvious strain hardening phenomenon, due to the rapid increase of dislocation density inside the material, the flow curves grew linearly, and the growth rates were the strain hardening rates of the material. With the increase of true strain, the internal storage energy of the material increased, and softening occurred gradually, so that the slope of the flow curve decreased until it reached the peak stress when the softening effect exceeded the strain hardening effect, and the softening effect caused by dynamic recovery and recrystallization began to dominate. When the strain hardening and softening effects reached dynamic equilibrium, the flow curve showed a flat stress plateau. It is worth noting that 1420 Al–Li alloy showed a more obvious decreasing trend after the peak stress at low temperature and high rate (350 ℃-5 s−1, 375 ℃-5 s−1, 350 ℃-10 s−1, 375 ℃-10 s−1), which is a typical softening type curve. The internal substructure of the grain cannot change continuously at low temperature, due to the lack of stored energy, so it is difficult to reach the dynamic equilibrium. However, the large-angle grain boundaries can migrate at a larger rate at a lower temperature, and the material rapidly proliferates a large number of dislocations at a high rate, prompting the migration of large-angle grain boundaries and, thus, resulting in discontinuous dynamic recrystallization. Compared with dynamic reversion and continuous dynamic recrystallization, the stress reduction caused by discontinuous dynamic recrystallization is more obvious, which is consistent with the results of Zhang et al. [13]. Under low-rate conditions, 1420 Al–Li alloy showed a process-hardening type curve, where internal dislocation proliferation dominated, the internal storage energy of the material was low, and the softening effect was mainly dominated by dynamic reversion.

3.2. Arrhenius (AR) Model

The classical Arrhenius (AR) constitutive model was first proposed by Sellars et al. [14]. The AR model is widely used to predict the flow behavior of metals because it can accurately reflect the relationship between material strain rate, deformation temperature, and true stress [15,16]. The expressions are as follows:
ε ˙ = A σ n 1 exp Q R T   α σ < 0.8 A e x p β σ exp Q R T   α σ > 1.2 A s i n h α σ n exp Q R T   f o r   a l l   σ
In Equation (1), α = β/n1. ε ˙ is the strain rate, T is the deformation temperature (K), σ is the true stress (MPa) and n is the apparent stress index. The size of the n value is closely related to the plastic deformation control mechanism [17], and can be used to determine the material plastic deformation mechanism. The apparent stress index value has a certain correspondence with its pair of plastic deformation control mechanism (for aluminum alloy, 3 < n < 5 is the dislocation slip mechanism, 5 < n < 7 is the dislocation climb mechanism). Q is the deformation activation energy (kJ·mol−1). R refers to the molar gas constant, which is about 8.314 J·(mol·K)−1. α, β, n, n1, and A are material constants.
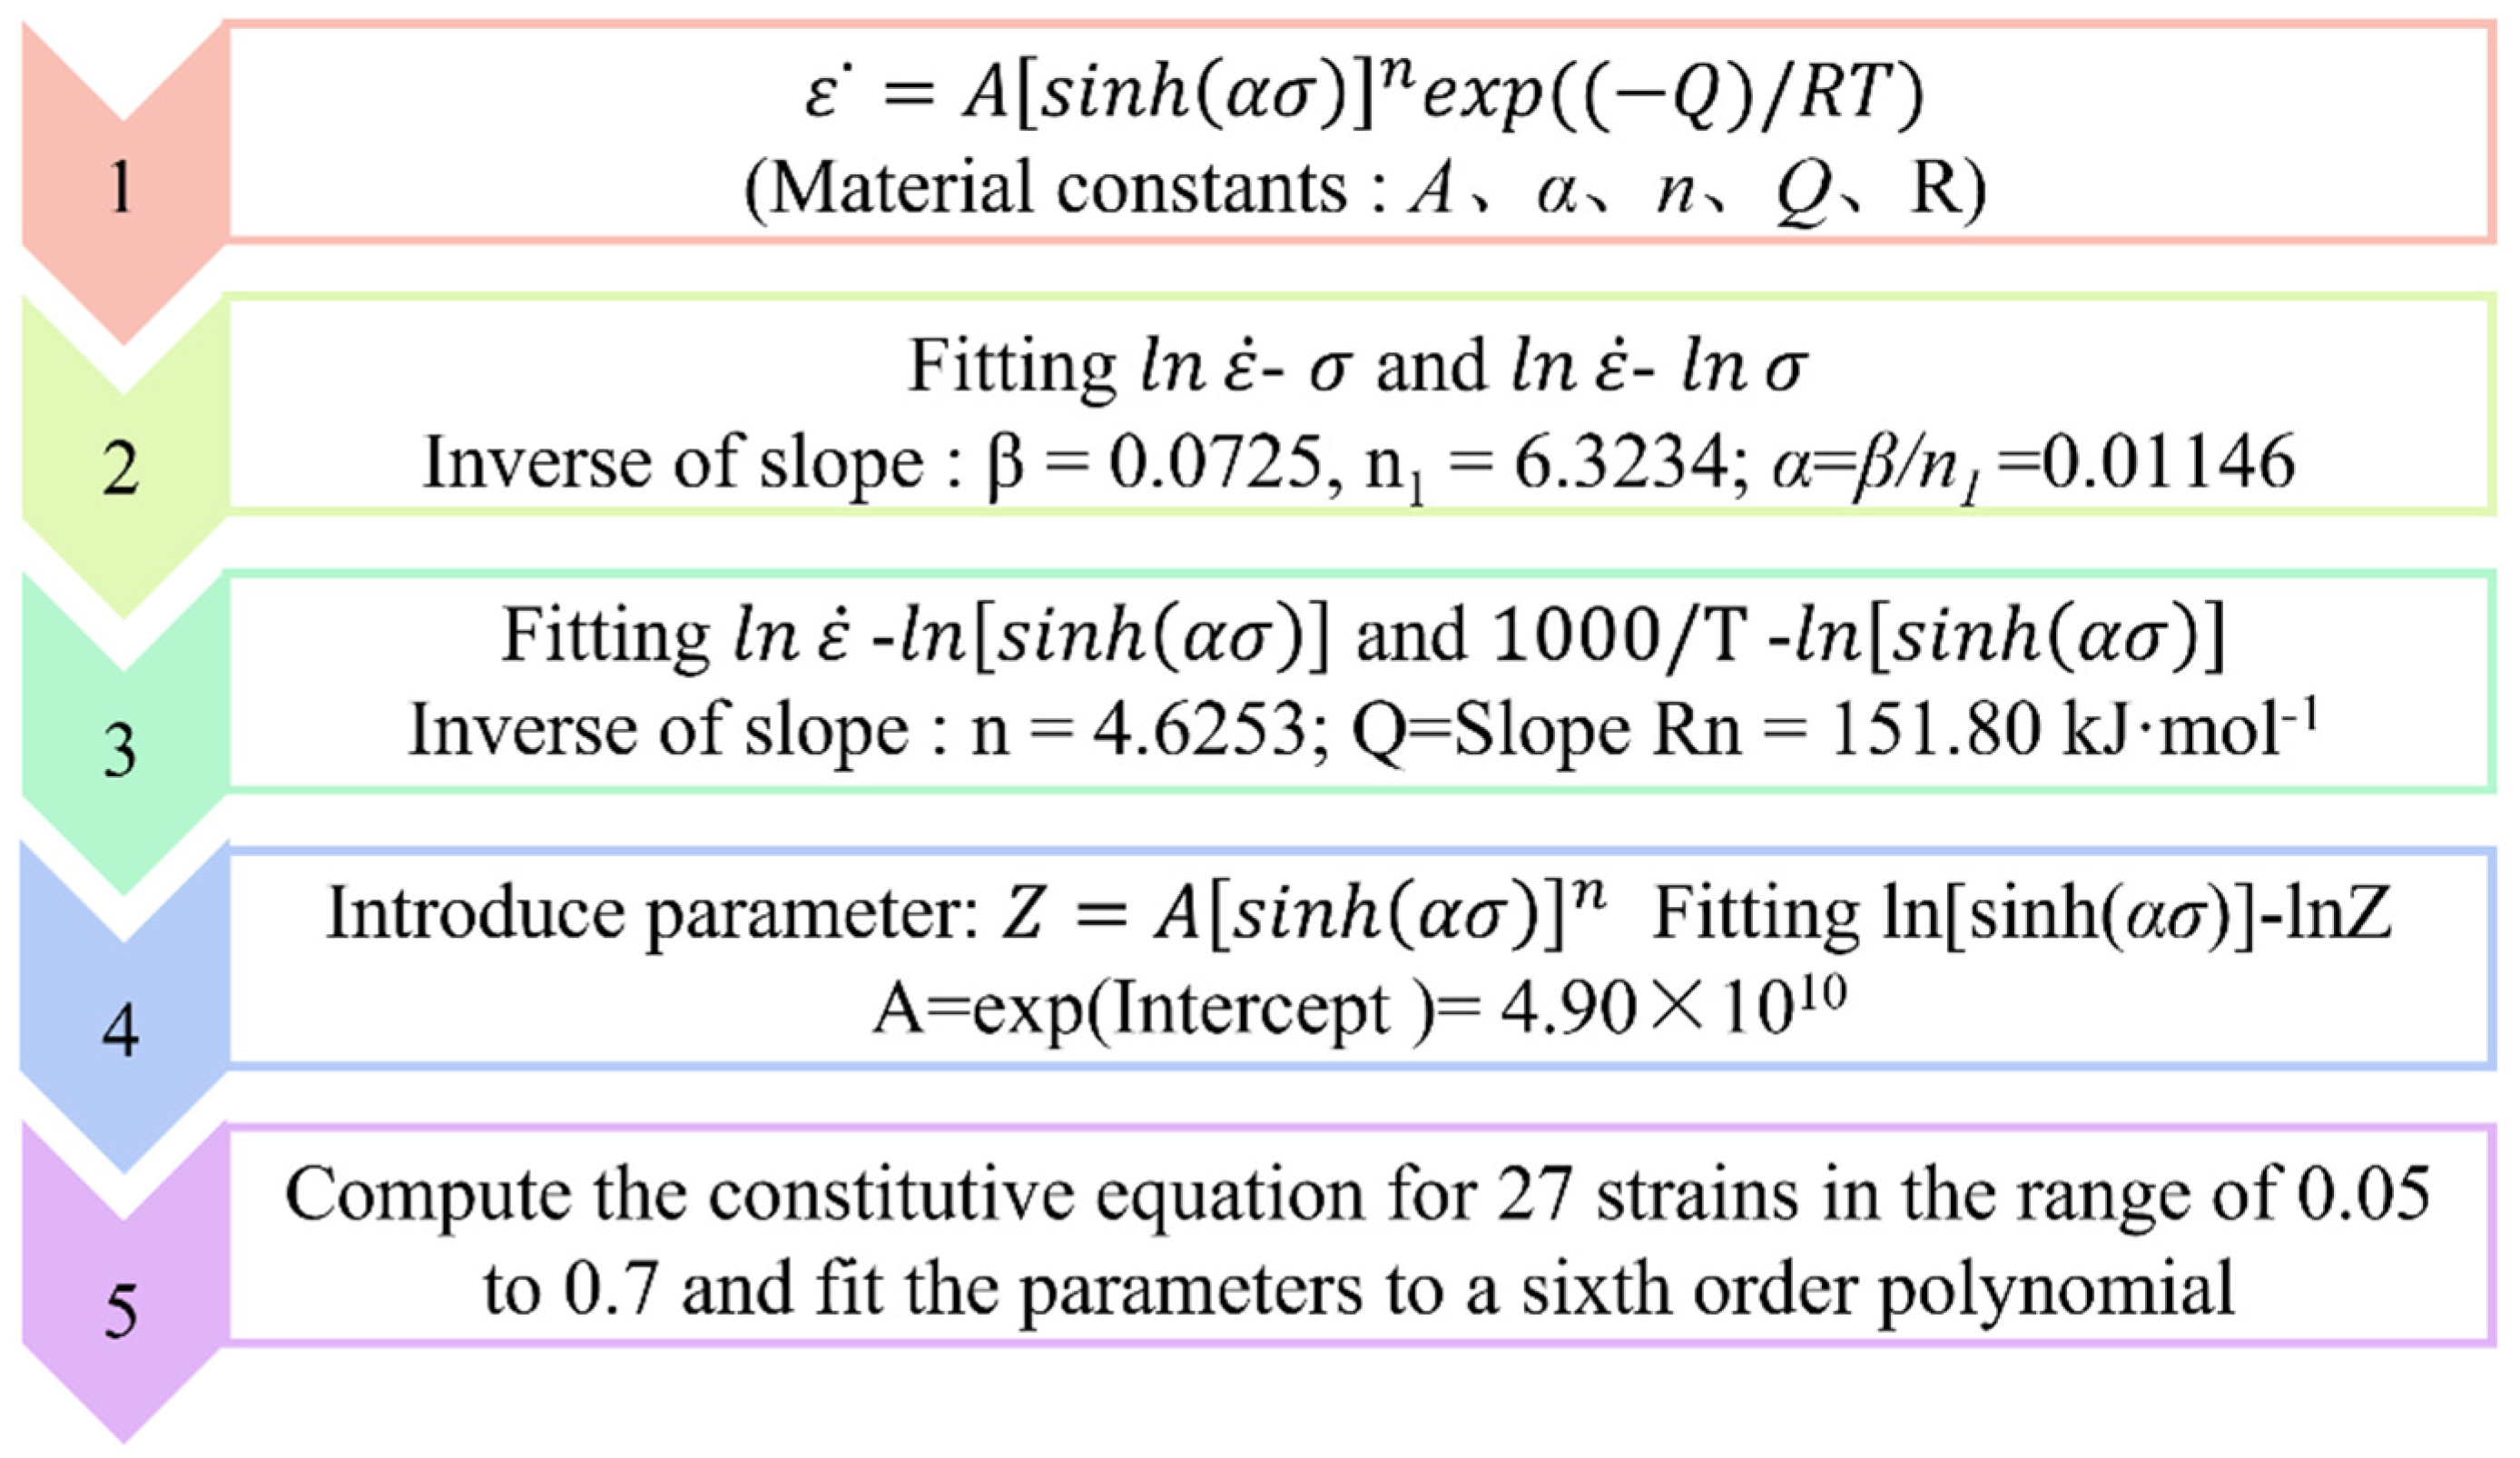
This model is used to construct a peak stress constitutive model for 1420 Al–Li alloy using the computational procedure shown in Figure 3, where Equation (1) is first deformed to obtain:
ln ε ˙ = ln A 1 + n 1 l n σ Q R T
ln ε ˙ = ln A 2 + β σ Q R T
ln ε ˙ = ln A + n l n sinh α σ Q R T
l n sinh α σ = 1 n ln ε ˙ + 1 n Q R T 1 n ln A
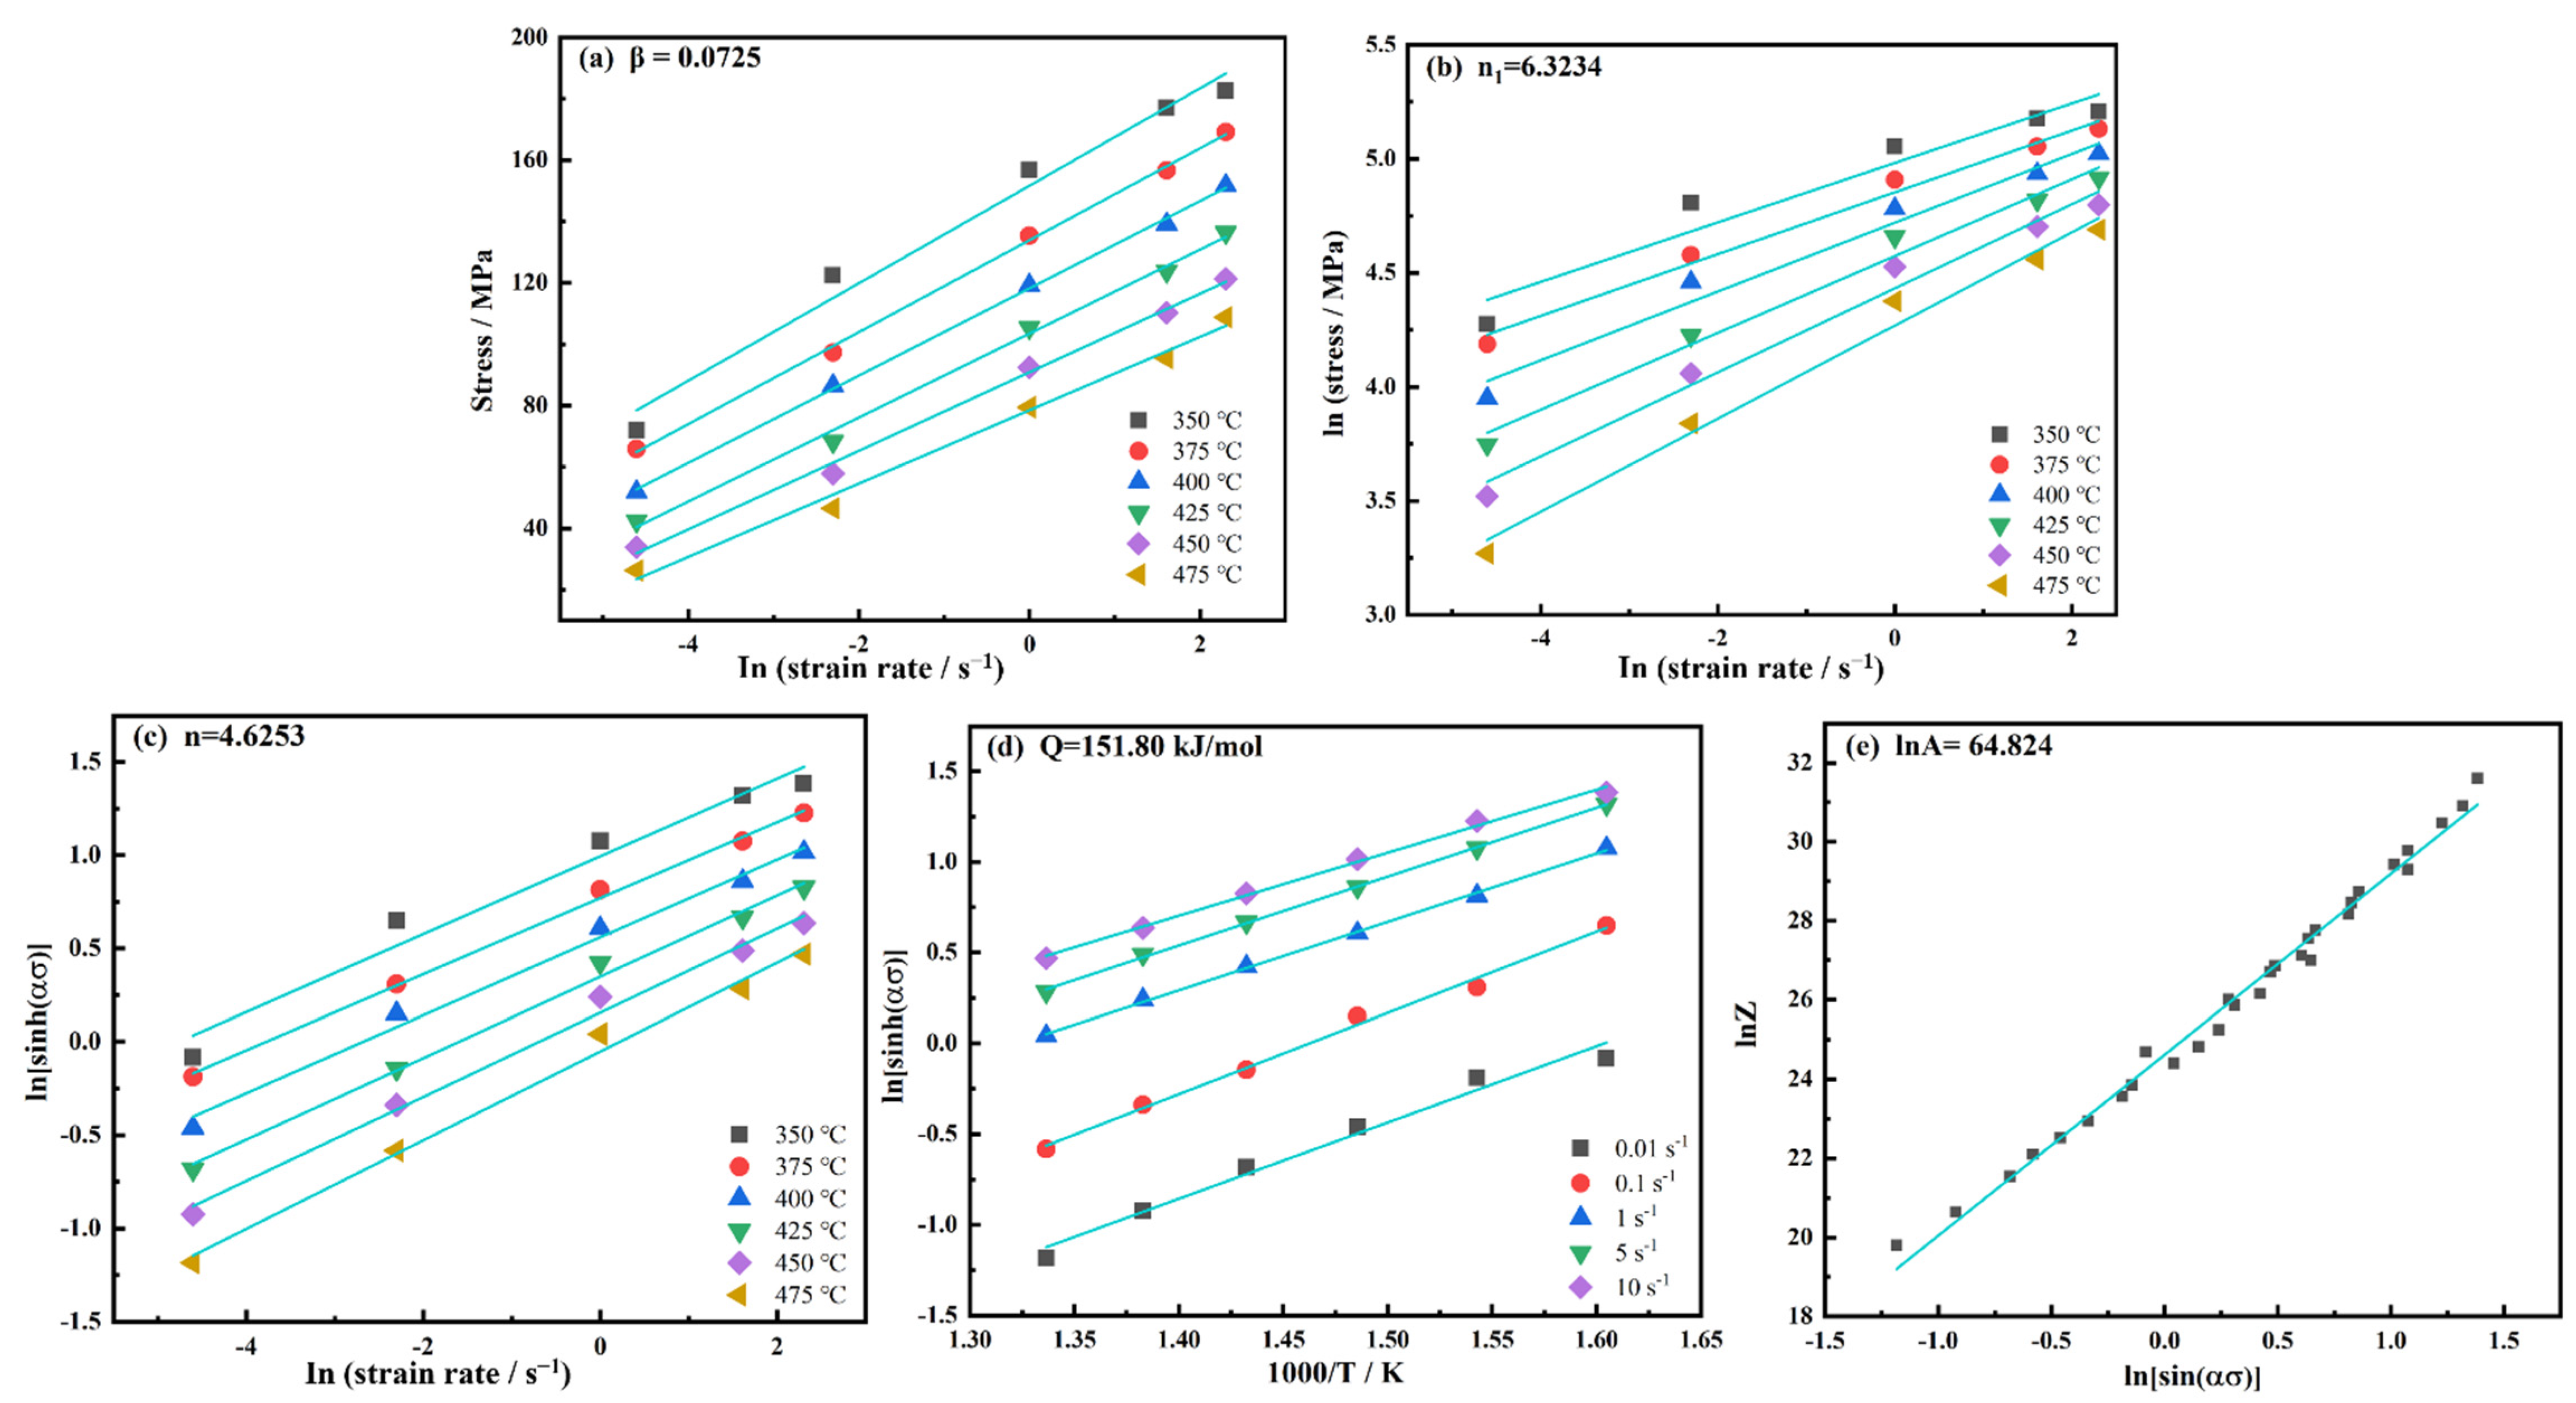
The data in Table 2 were brought into Equations (2)–(5), as shown in Figure 4a–d, for a linear fit, which was calculated by slope and intercepts and averaged to obtain β = 0.0725; n1 = 6.3234; α = 0.01146; n = 4.6253; Q = 151.80 kJ·mol−1. To calculate the effect of temperature T and strain rate ε ˙ on the deformation behavior of the material, the Zener–Hollomon index (Z-index) is introduced:
Z = ε ˙ exp Q R T = A sinh α σ n
The logarithmic operation of Equation (6) yields Equation (7), and the least-squares method is used in ln Z ln sinh α σ . The linear fit is shown in Figure 4e, and the intercept of the line is taken as the natural exponent to obtain A = 4.90 × 10¹⁰.
l n Z = l n A + n l n sinh α σ
The final peak stress constitutive equation for this material is obtained as:
ε ˙ = 4.90 × 10 10 s i n h 0.01146 · σ 4.625 exp 1.518 × 10 5 R T
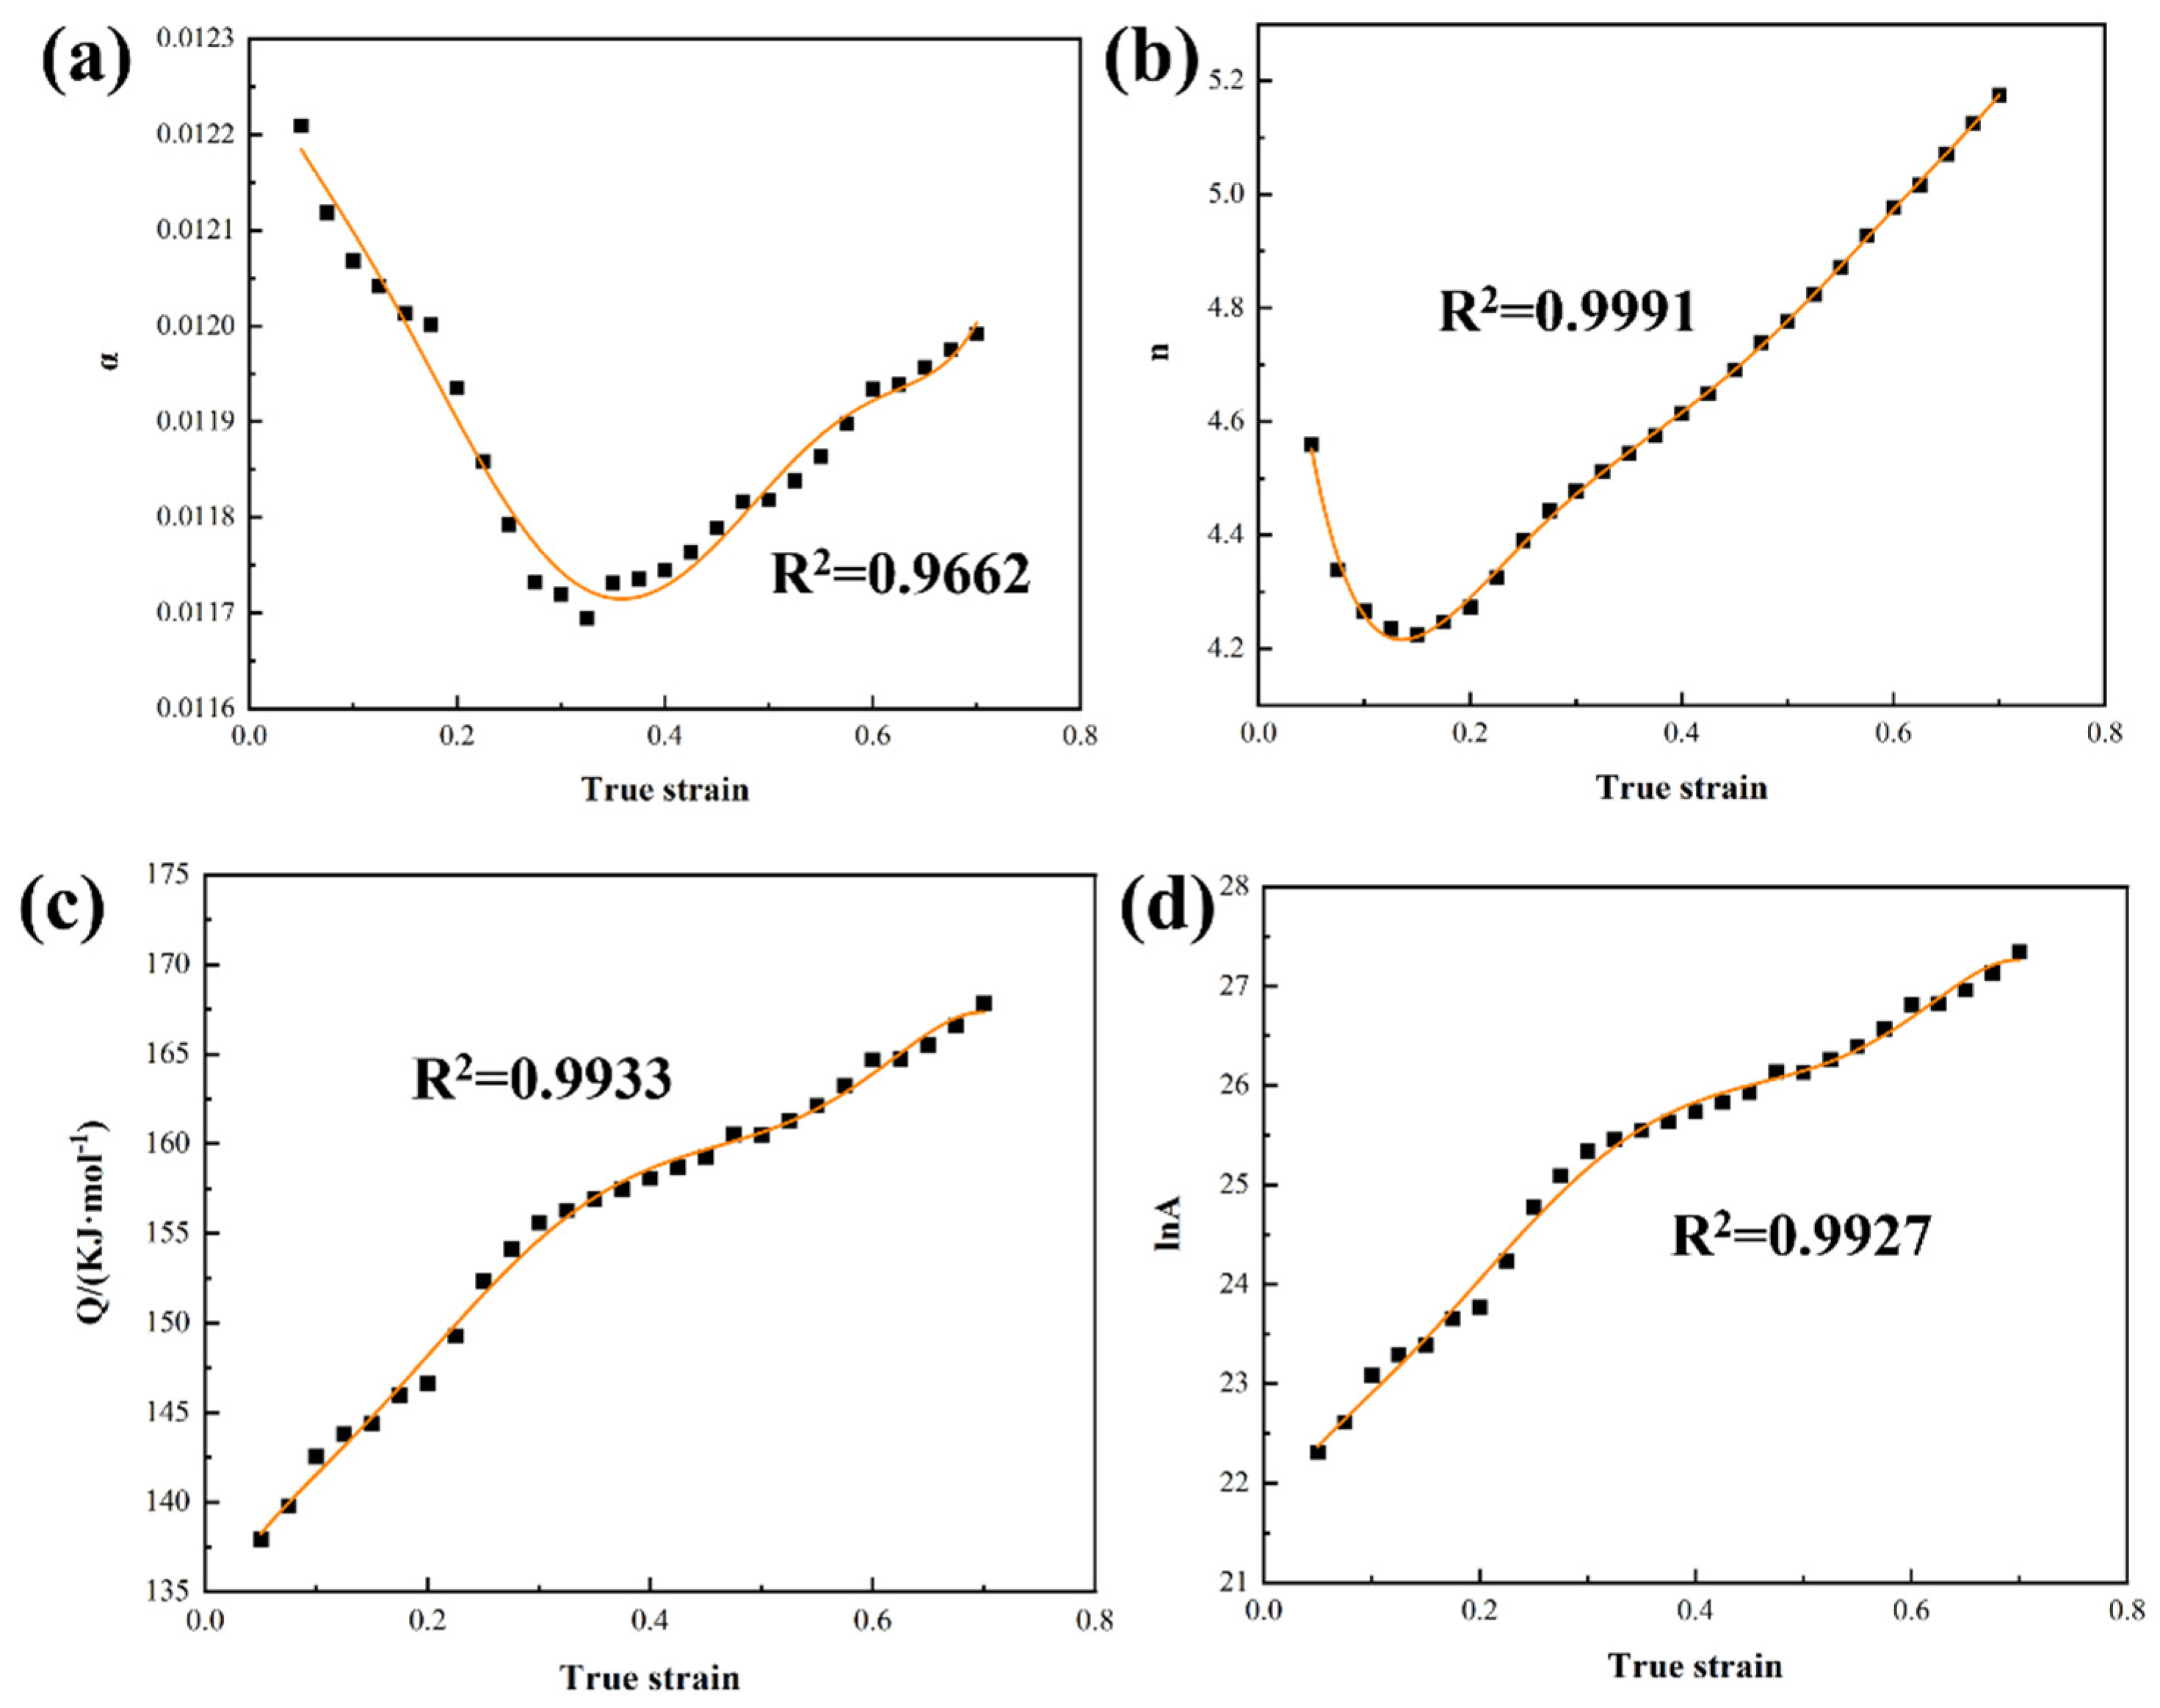
The peak stress point reflects the equilibrium point between work hardening and dynamic softening of the material, which is more representative than other strains (ε), but this constitutive equation does not consider the significant influence of strain factors on the flow behavior of the material. Therefore, this paper coupled the strain variables into the original constitutive equation, based on the above study, as shown in Figure 3, to better reflect the flow behavior of the material. As shown in Table 3, 27 strain points were selected on average, from 0.05 to 0.7, and six polynomial fits were performed for each covariate, as shown in Figure 5. The average correlation coefficient was greater than 0.98, indicating that the six polynomials had better fitting accuracy for the relationship between each covariate and the strain. The predicted flow stresses of the 1420 Al–Li alloy, under different deformation conditions, could be obtained by bringing the deformation parameters of the material into the AR model with the above-coupled strain variables. Figure 6 shows the comparison between the experimental values and the predicted values. It can be observed that the predictions of the AR model showed good accuracy as a whole, especially at 5 s−1. However, the error was larger at low temperatures and low rates (350 °C-0.01 s−1; 350 °C-0.1 s−1), which was due to the abnormal valleys in the flow curves caused by the instability of the material during thermal compression.

3.3. Modified Johnson–Cook (MJC) Model

The Johnson–Cook model was proposed by Johnson G R and Cook W H. [18] This model considers that plastic strain, temperature, and strain rate affect the flow stress independently of each other, and, thus, has a large error in predicting the flow behavior of materials. To address this drawback Lin Y C et al. [19] proposed the Modified Johnson–Cook (MJC) model by combining the coupling effect of the three on the stress. Its expression is shown as follows:
σ = A + B 1 ε + B 2 ε 2 1 + C 0 l n ε * ˙ exp λ 1 + λ 2 l n ε * ˙ T *
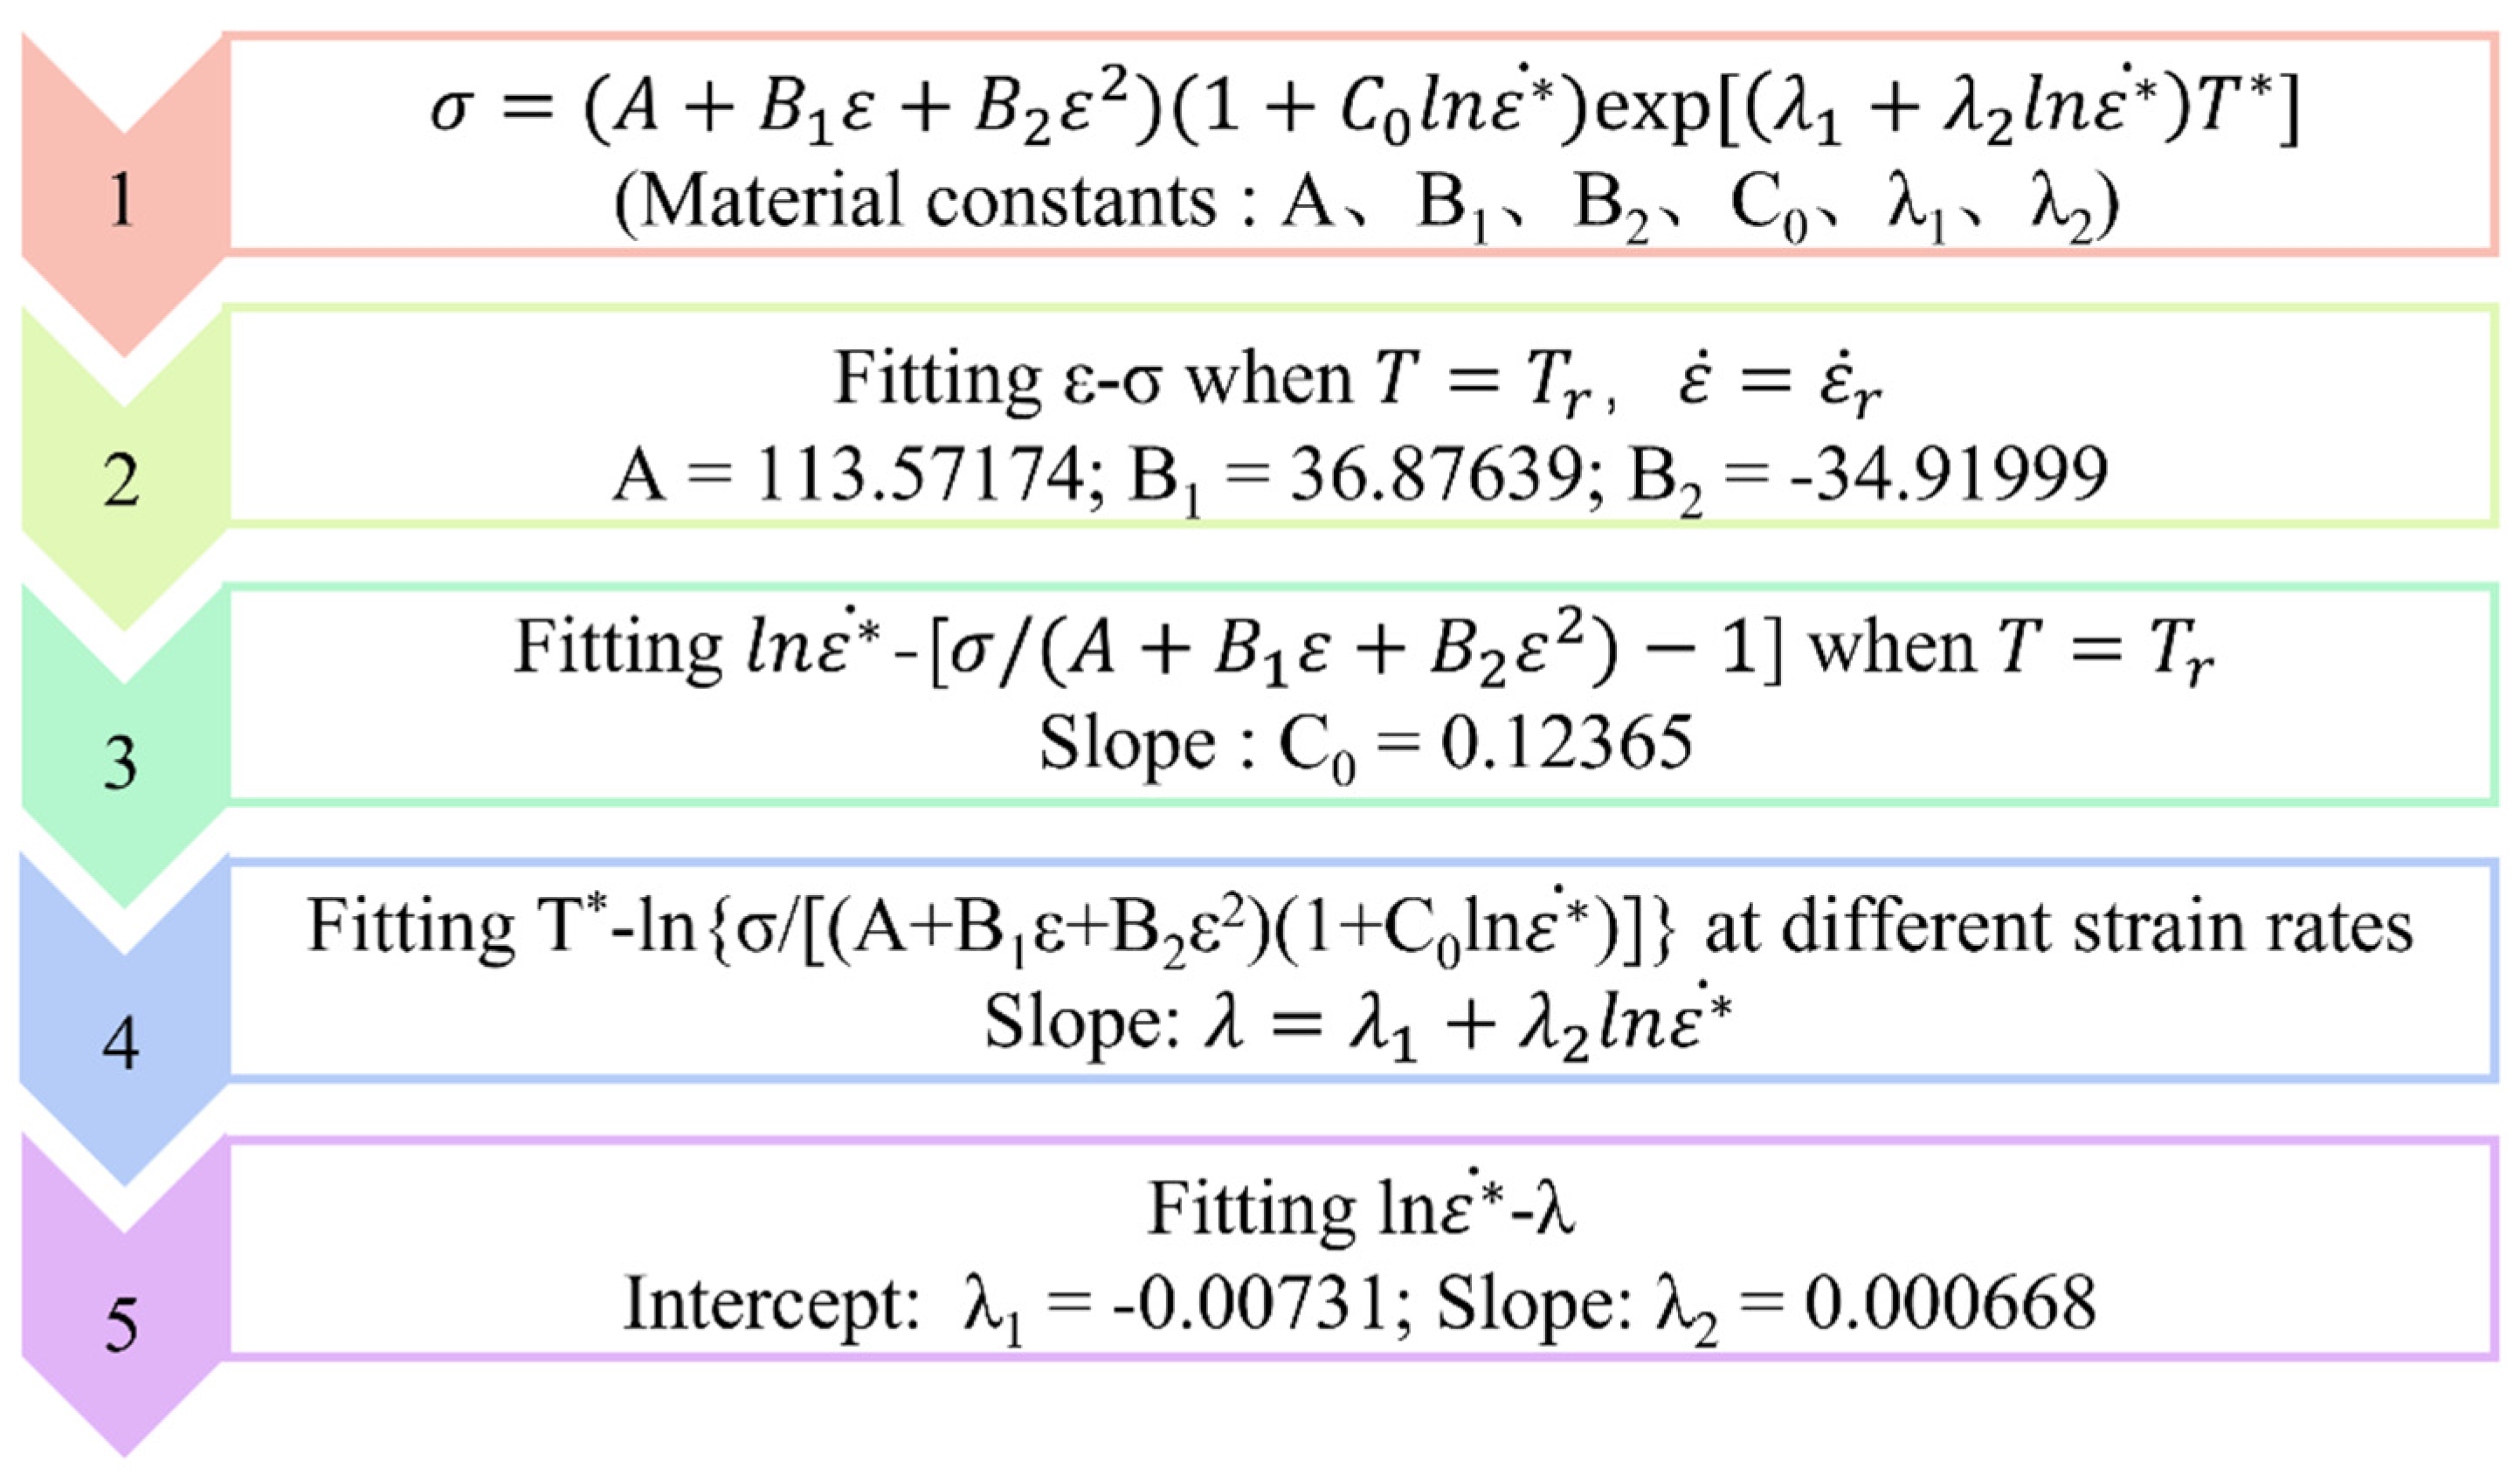
where σ is the true stress; ε is the true strain. ε * ˙ = ε ˙ / ε ˙ r ,   ε ˙ is the strain rate, and ε ˙ r is the reference strain rate. T * = T T r , T is the experimental temperature, Tr is the reference temperature; A, B1, B2, C0, λ1, λ2 are the material constants. The solution process of the parameters in the MJC model is shown in Figure 7.
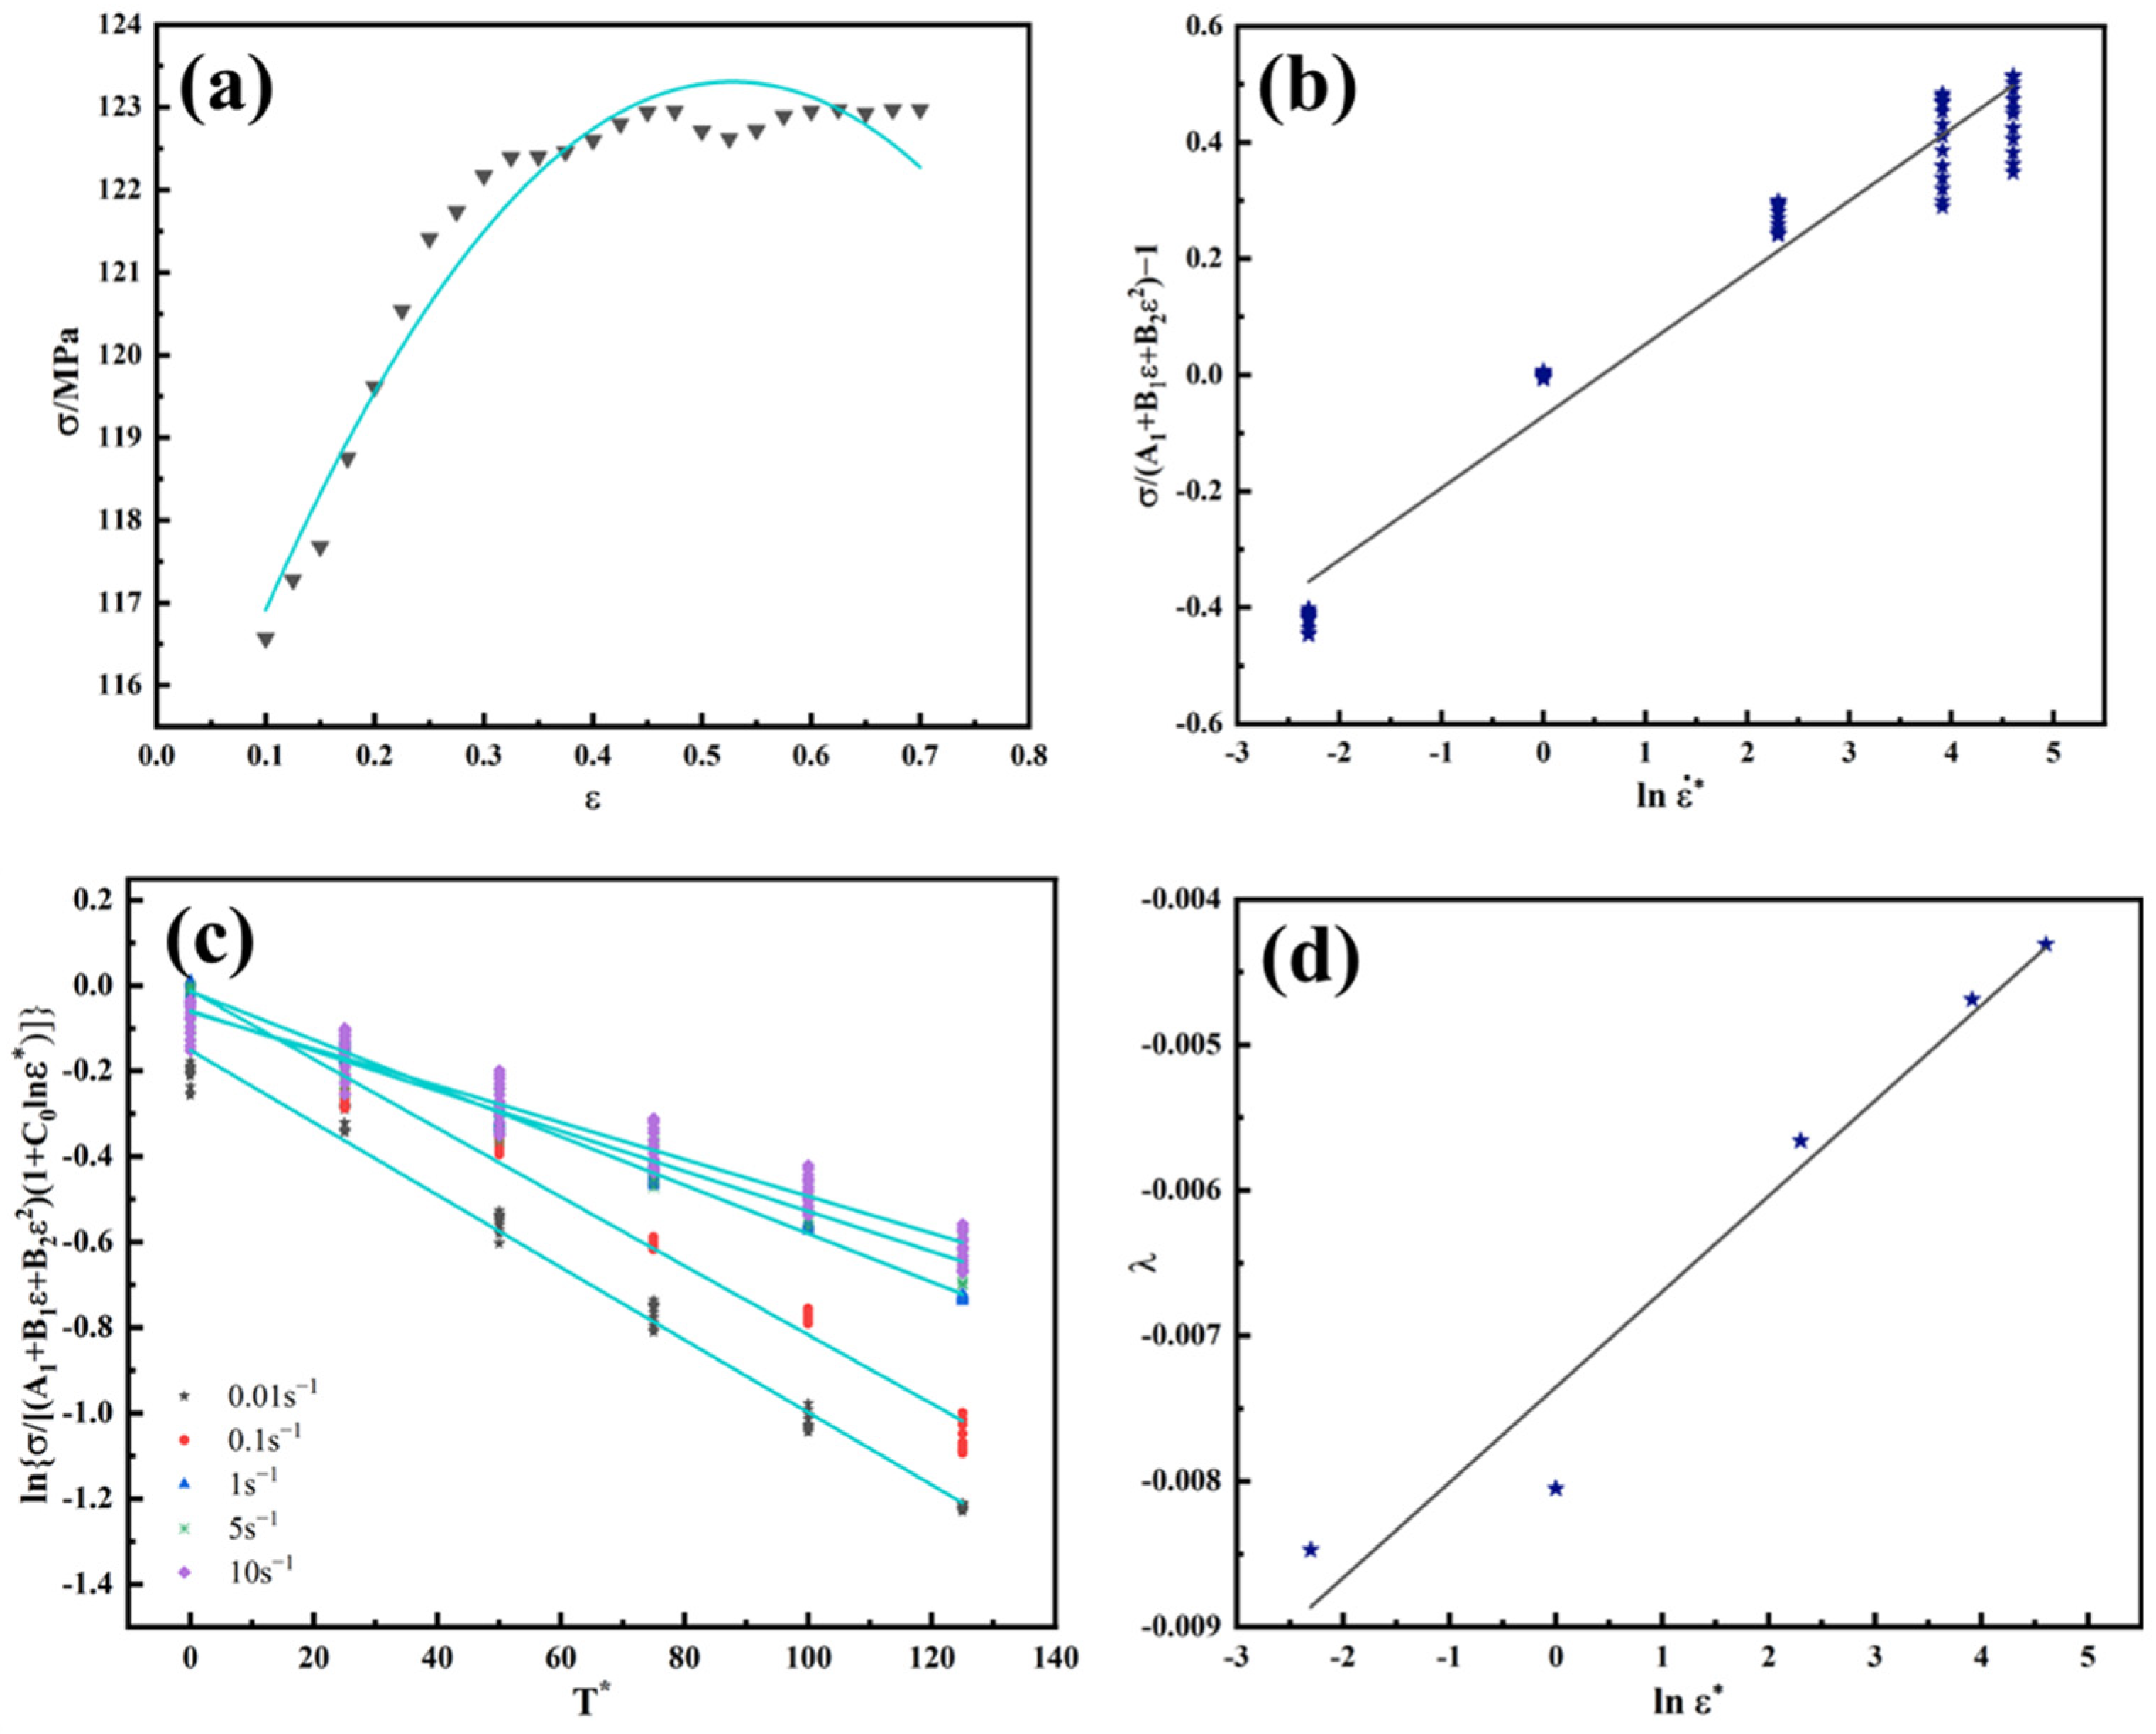
Ye et al. [20] pointed out that the reference strain rate of MJC is generally chosen from 0.1~0.001 s−1, and in this paper, 0.1 s−1 was chosen as the reference rate i.e., ε ˙   = 0.1 s−1 and 350 °C as the reference temperature i.e., Tr = 623.15 K. Equation (8) was obtained when T = T r , and ε ˙ = ε ˙ r . Fitting the ε-σ curve with a quadratic polynomial, as shown in Figure 8a, yielded A = 113.57174, B1 = 36.87639, and B2 = −34.91999.
σ = A + B 1 ε + B 2 ε 2
When T = T r   exp λ 1 + λ 2 l n ε * ˙ T * = 1 , the deformation of Equation (9) yielded Equation (11). Taking a point every 0.05 in the flow data of strain 0.1~0.7, a linear fit of l n ε * ˙ σ / A + B 1 ε + B 2 ε 2 1 was performed, as shown in Figure 8b, and C0 = 0.12365 could be obtained, based on the slope of the fitted line.
σ A + B 1 ε + B 2 ε 2 1 = C 0 l n ε * ˙
The relationship curve of T* and ln{σ/[(A + B1 ε + B2 ε2)(1 + C0 ln ε * ˙ )]} was fitted at different rates, as shown in Figure 8c, and then the slope λ of each line was fitted linearly with ln ε * ˙ , and the intercept of the straight line shown in Figure 8d was λ1 = −0.00731 and the slope was λ2 = 0.000668. Therefore, the MJC constitutive equation of the experimental material was obtained:
σ = 113.57174 + 36.87639 ε 34.91999 ε 2 1 + 0.12365 l n ε * ˙ exp 0.00721 + 0.00668 l n ε * ˙ T *
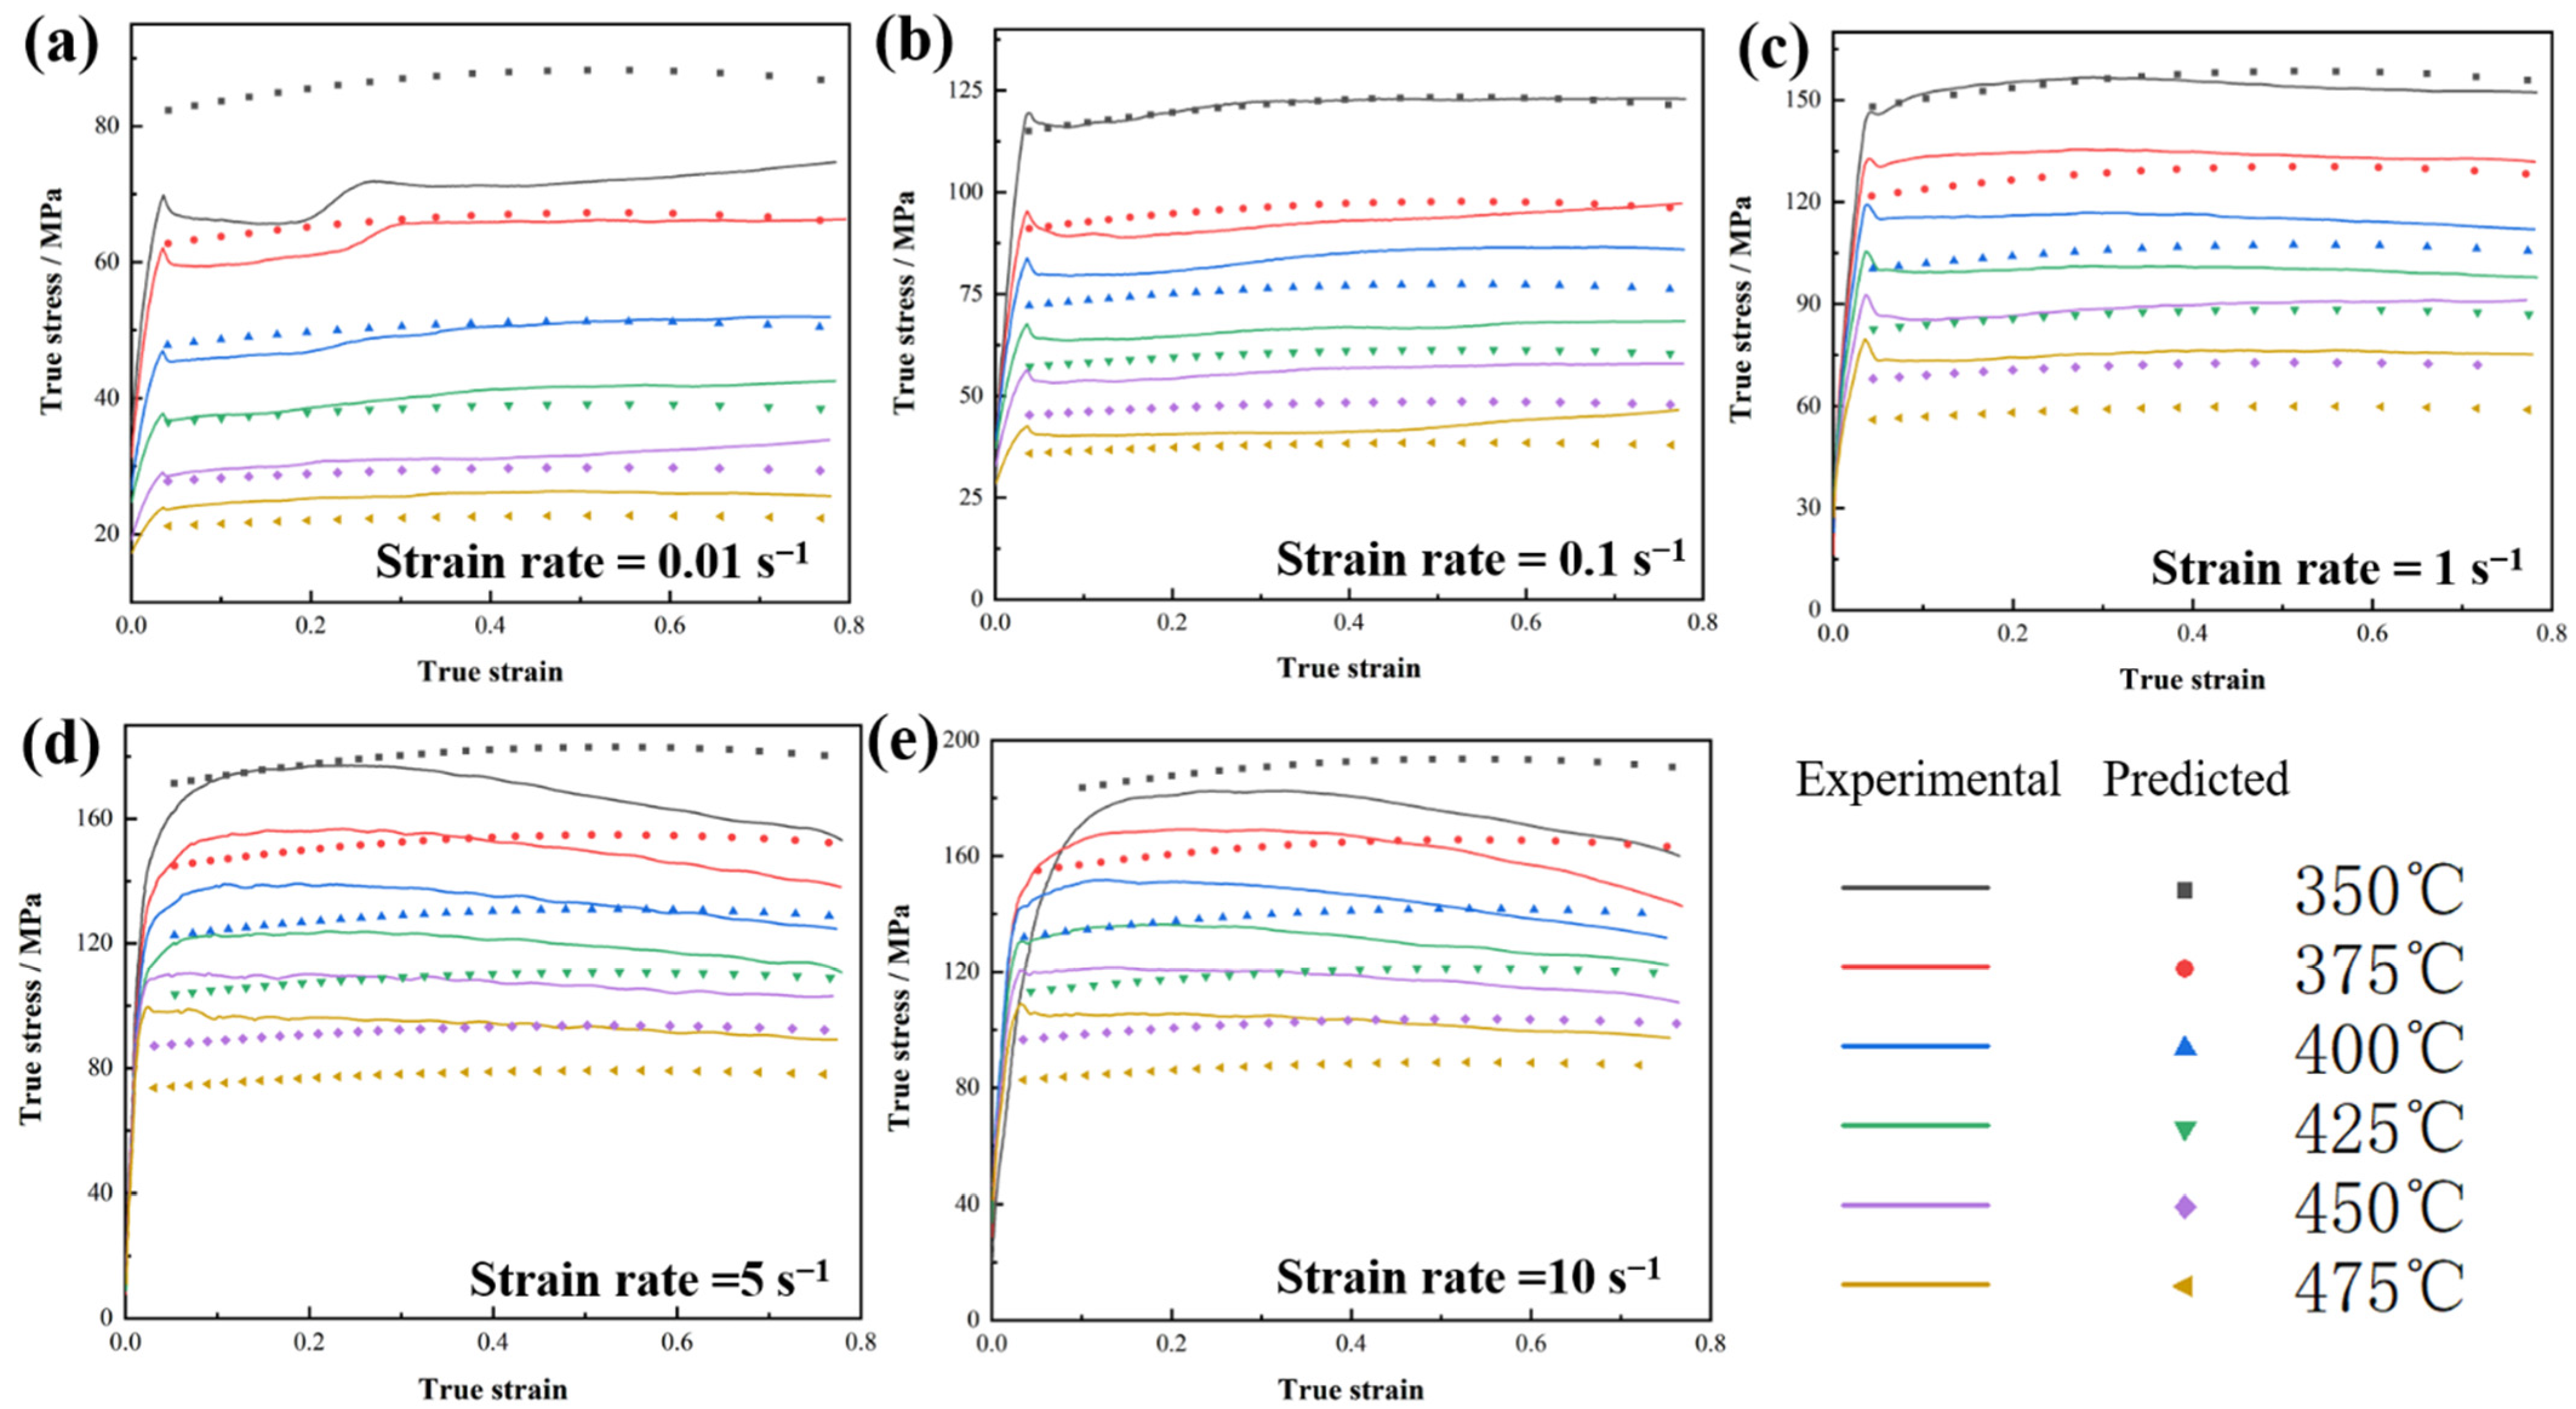
The experimental values shown in Figure 9 were compared with the predicted values of the MJC constitutive equation by bringing the different deformation parameters of the material into Equation (12), and it could be seen that the MJC constitutive model gave approximately accurate predictions, but could not reflect the rheological behavior of 1420 Al–Li alloy very precisely.

3.4. Modified Zerilli–Armstrong (MZA) Model

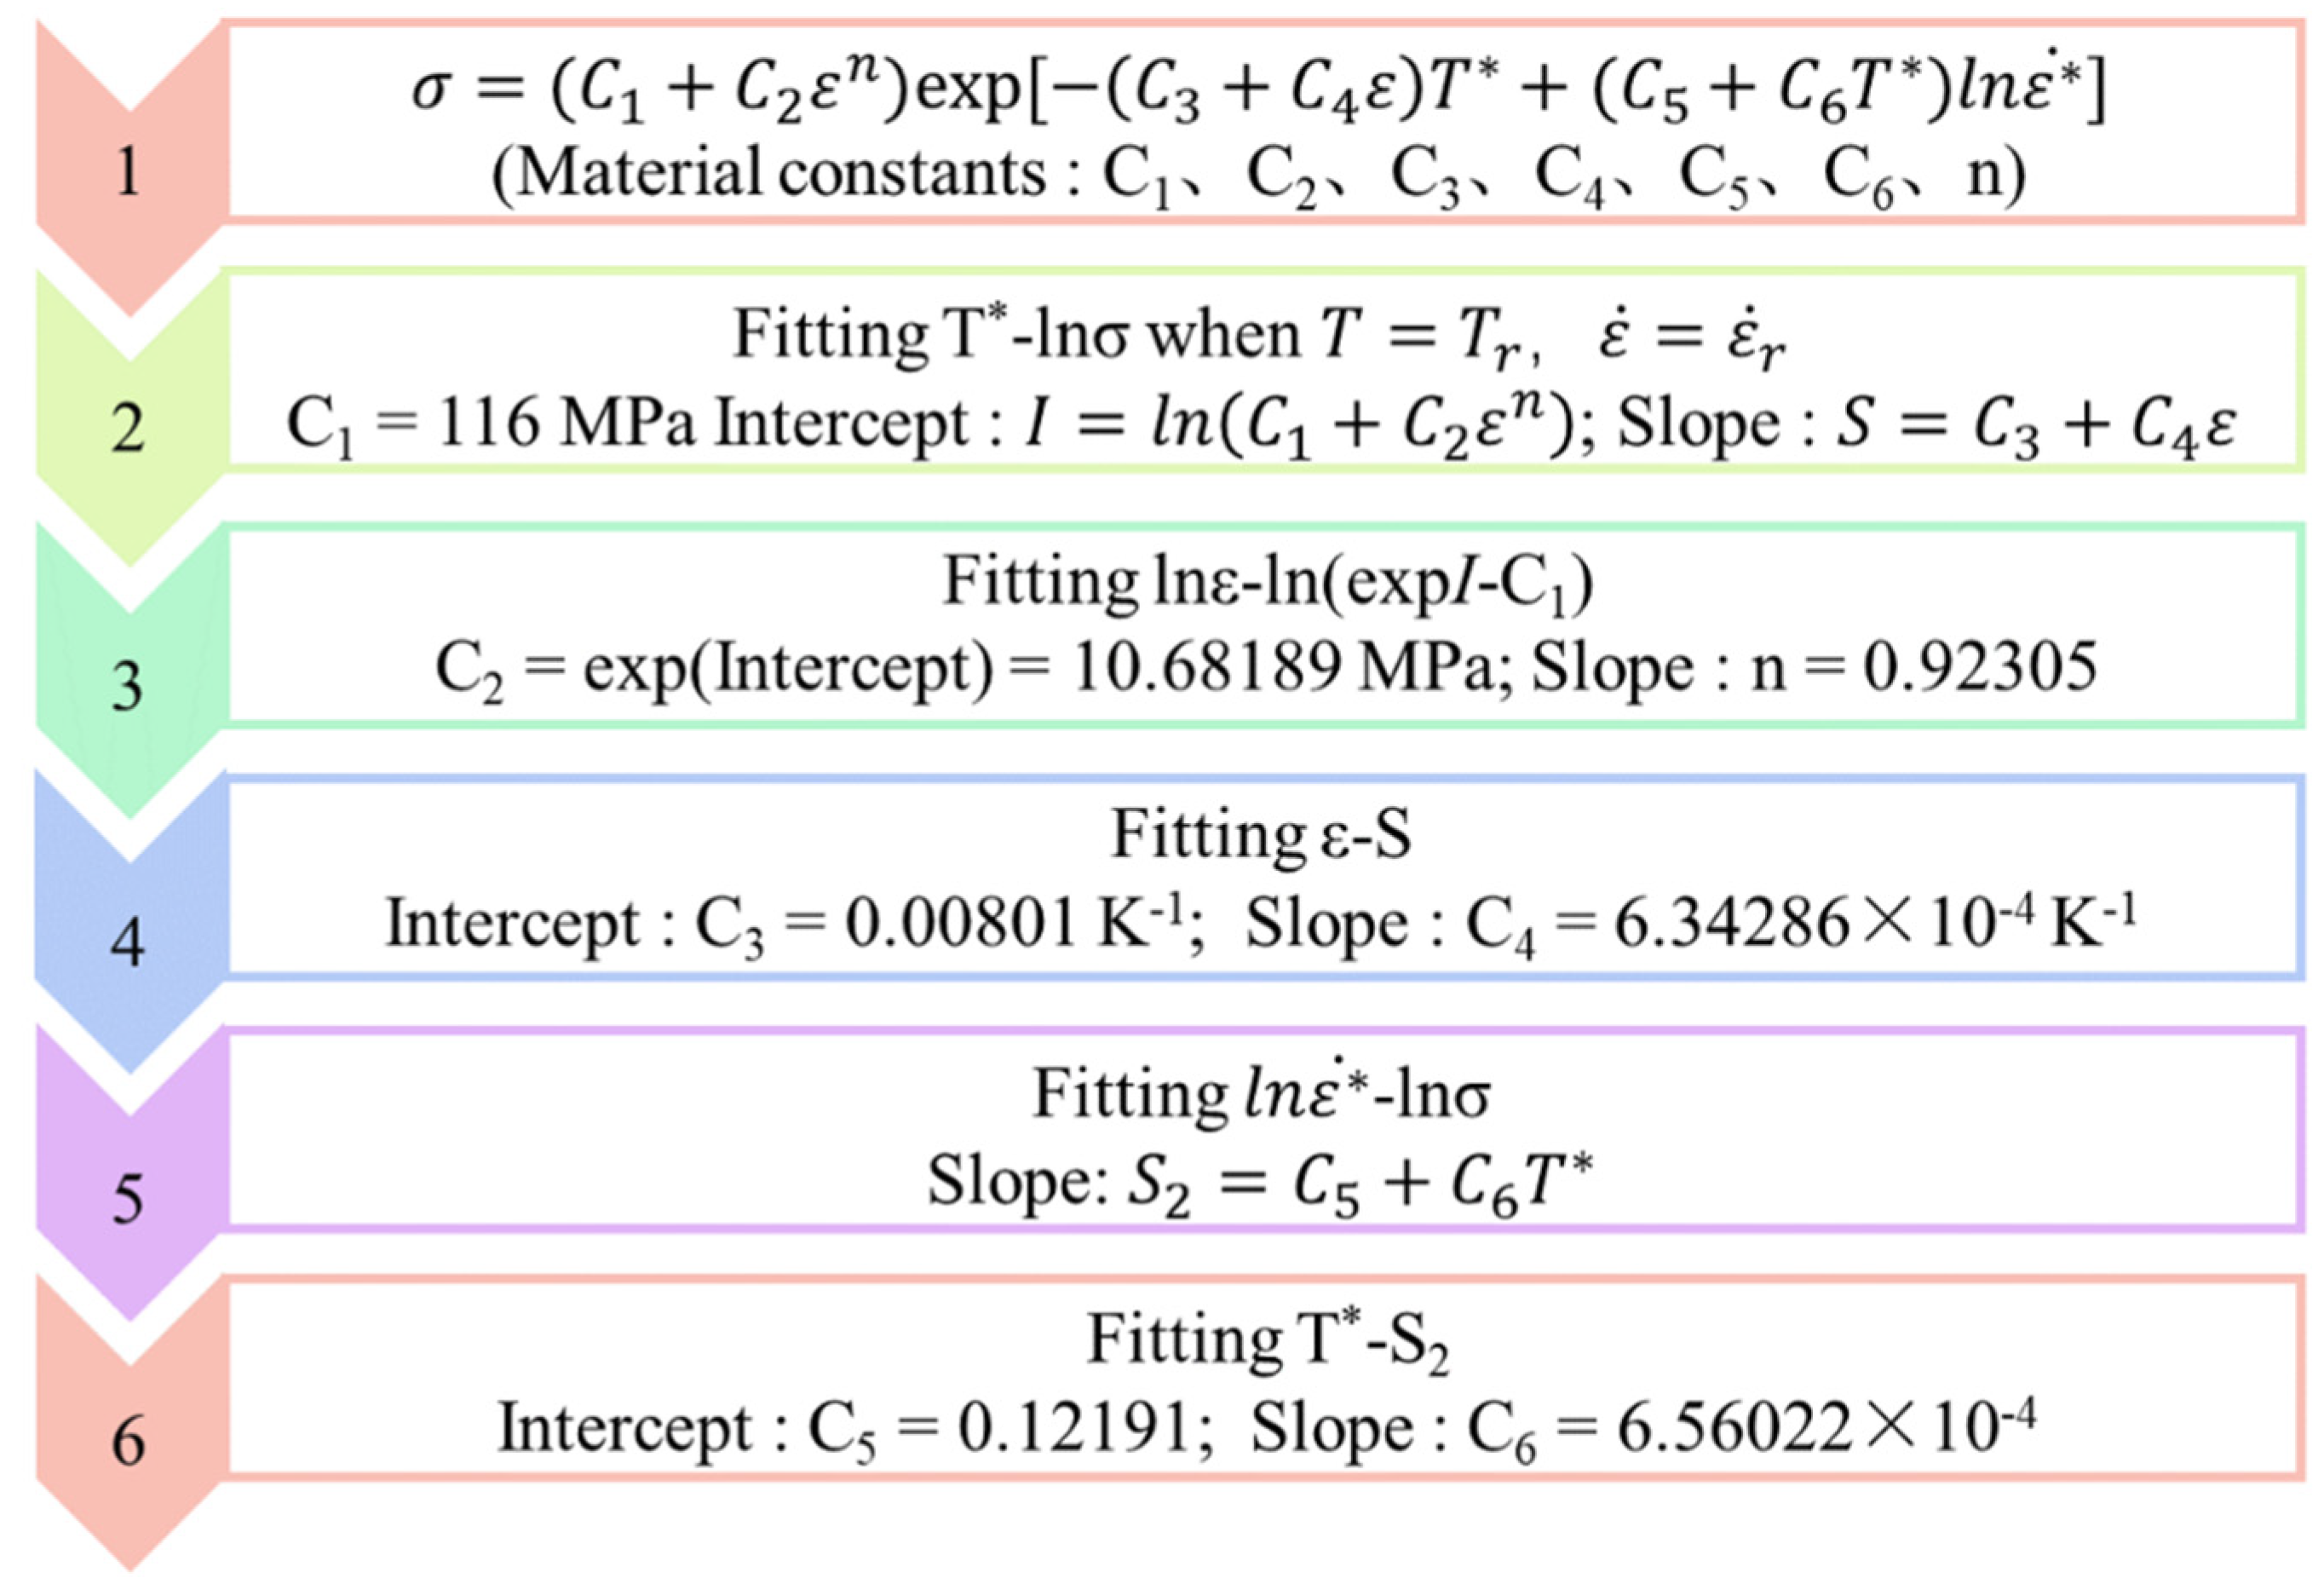
The Zerilli–Armstrong model, based on physical significance, considers the effect of the material dislocation mechanism [21]. Samantaray et al. [22] proposed the Modified Zerilli–Armstrong (MZA) model, based on this model, considering the effects of work hardening, isotropic hardening, and dynamic softening, which had been well applied in predicting the flow behavior of alloys with FCC structure [23,24,25]. In this paper, the MZA model was used to construct the constitutive equations of 1420 Al–Li alloy by the process shown in Figure 10, and the model is represented as follows:
σ = C 1 + C 2 ε n exp C 3 + C 4 ε T * + C 5 + C 6 T * l n ε * ˙
where C1, C2, C3, C4, C5, C6, and n are material constants. The same reference temperature and reference rate as the MJC model were chosen. At the reference rate, Equation (13) could be rewritten as:
σ = C 1 + C 2 ε n exp C 3 + C 4 ε T *
Logarithmic operation on both sides of the equal sign of Equation (14) yielded:
l n σ = l n C 1 + C 2 ε n C 3 + C 4 ε T *
Order I = l n C 1 + C 2 ε n , S = C 3 + C 4 ε . The flow data of ε = 0.1~0.7 at each deformation temperature were selected at an interval of 0.05 and linearly fitted to lnσ and T*. The I and S values at each strain shown in Table 4 were obtained by the arithmetic processing of the slope and intercept of the curves.
C1 was the yield stress of the material at reference temperature and reference strain rate, and C1 = 116 MPa was taken from the flow data. lnε − ln(expI − C1) and ε-S relationship curves were fitted as shown in Figure 11, respectively, and by processing the intercept and slope of the fitted curves we obtained: C2 = 10.68189 MPa; n = 0.92305; C3 = 0.00801 K−1; C4 = 6.34286 × 10⁻⁴ K−1.
Taking the logarithm of Equation (13) yielded:
l n σ = l n C 1 + C 2 ε n C 3 + C 4 ε T * + C 5 + C 6 T * l n ε * ˙
The slope of the fitted line S 2 = C 5 + C 6 T * was fitted by the least-squares method for lnσ and l n ε * ˙ at different temperatures. The fitted curves of T*-S2 for strain variables of 0.1, 0.3, 0.45, 0.6, and 0.7 are shown in Figure 12. Fitting the T*-S2 relationship curves for each strain variable, the mean of the curve intercept C5 = 0.12191 and the mean of the slope of the curve, i.e., C6 = 6.56022 × 10⁻⁴.
This led to the MZA constitutive model for the material.
σ = 116 + 10.68189 ε 0.92305 exp [ 0.00801 + 6.34286 × 10 4 ε T * + 0.12191 + 6.56022 × 10 4 T * l n ε * ˙ ]
The corresponding stress values were obtained by bringing the material strains, strain rates, and deformation temperatures into the MZA constitutive model described above. Figure 13 shows the flow curves of the 1420 Al–Li alloy compared with the predicted values from the MZA model. It can be seen that the flow law of the material under various deformation parameters was roughly predicted by the MZA model. In particular, the MZA model accurately predicted the flow behavior at each temperature at the reference rate of 0.1 s−1, but it did not predict the flow behavior of the material well at the reference temperature of 350 °C.

3.5. VOCE Model

The VOCE constitutive model is a phenomenological constitutive model proposed by Voce E [26]. Its expression is shown in Equation (18). The study of its differential form by Sainath G et al. [27] gave some physical meaning to the parameters of the model, so that the VOCE constitutive model had a greater scope of application.
σ = σ s + σ 1 σ s exp ε ε 1 / ε c
where σs is the saturation stress, σ1 is the stress value corresponding to the start of plastic strain, ε1 indicates the strain at the start of plastic deformation, and εc is the characteristic strain, which responds to the rate at which the material reaches the saturation stress value.
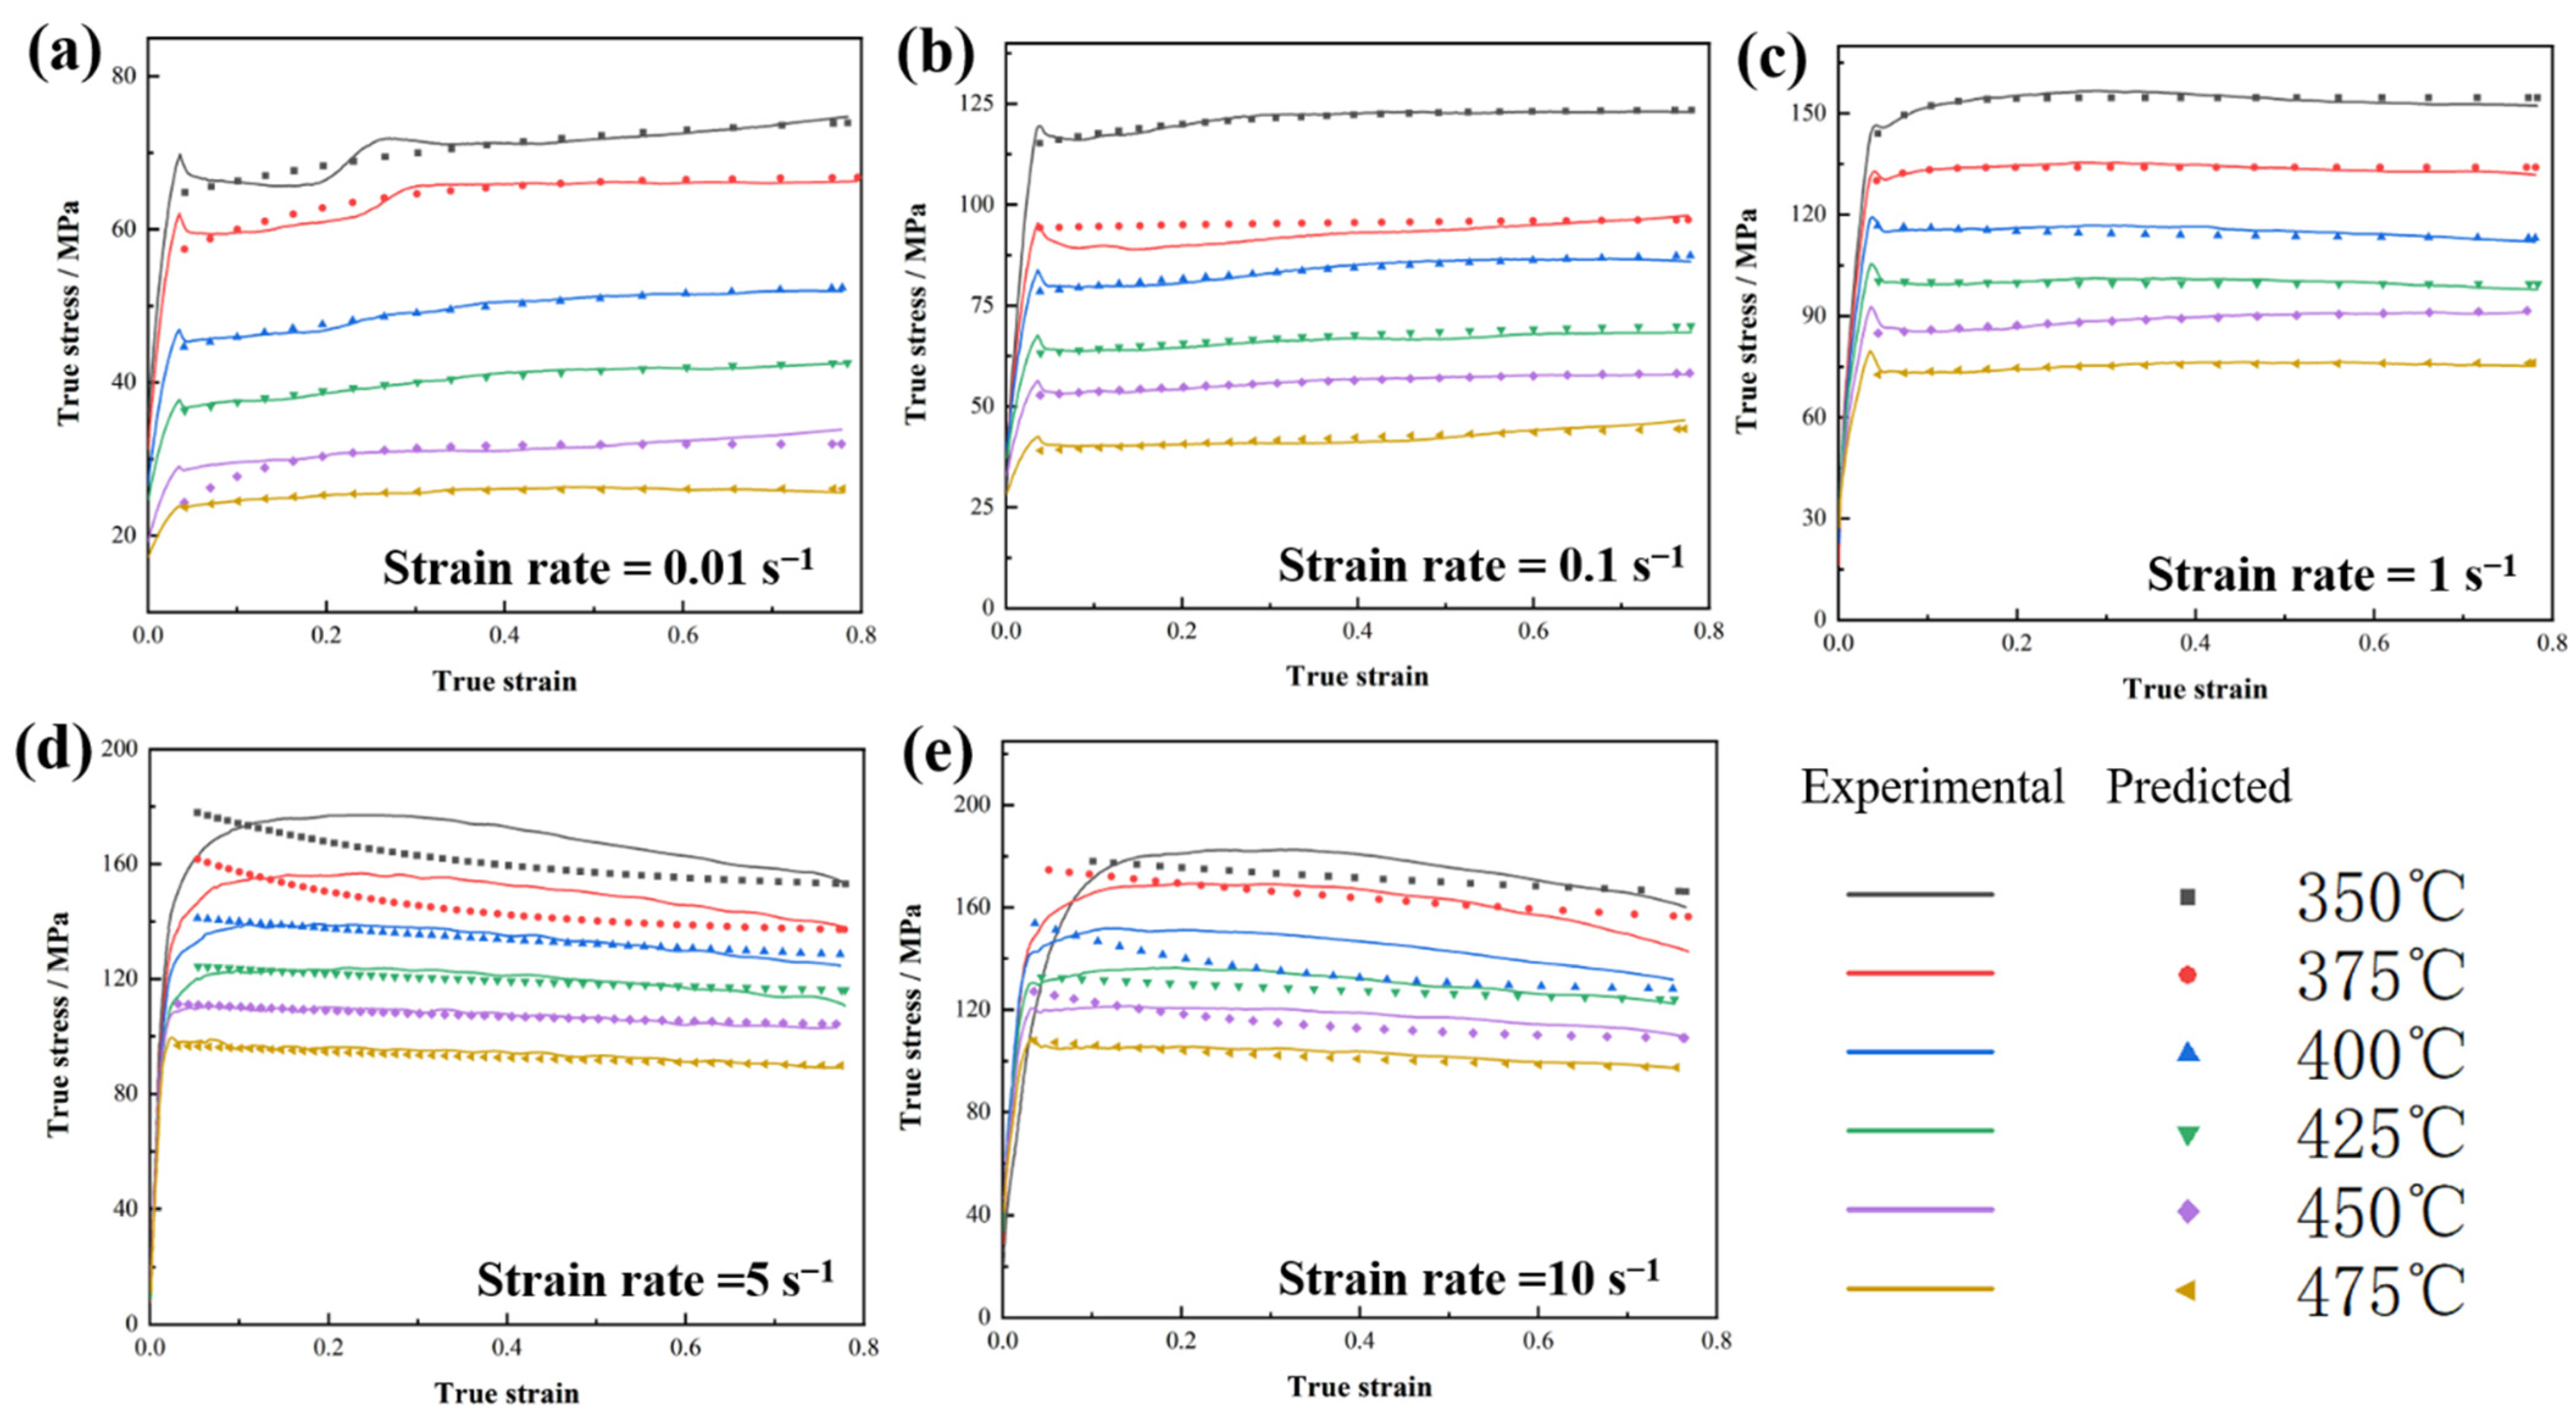
Equation (18) was fitted using the Universal Global Optimization (UGO) algorithm. The predicted flow behavior of this 1420 Al–Li alloy by the VOCE constitutive equation for each deformation condition was plotted against the experimental measurements, as shown in Figure 14. It can be seen from Figure 14 that the VOCE model accurately predicted the flow behavior of this test material at all deformation rates and temperatures. However, at low temperatures and high rates (350 ℃-5 s−1, 375 ℃-5 s−1, 350 ℃-10 s−1, 375 ℃-10 s−1), there was a large deviation, which was due to the downward trend in the action conditions of dynamic recrystallization at low temperature and high rate, which meant it was difficult to achieve a higher prediction accuracy due to the inherent mathematical model of the VOCE model.

4. Discussion

4.1. Comparison of Ontogenetic Model Predictions

To compare the predictive ability of the AR model, MJC model, MZA model, and VOCE model for the flow behavior of 1420 Al–Li alloy, the correlation coefficient (R2), the average absolute relative error (AARE), and the root mean square error (RMSE) were introduced in this paper for quantitative analysis. Their calculation equations are shown as follows.
R = i = 1 N E i E ¯ P i P ¯ i = 1 N E i E ¯ 2 i = 1 N P i P ¯ 2
R M S E = 1 N i = 1 N ( E i P i ) 2
A A R E % = 1 N i = 1 N | E i P i | E i × 100 %
In the formula, E and P are the experimental flow stress and predicted values, E ¯ and P ¯ are their average values, and N is the total amount of data.
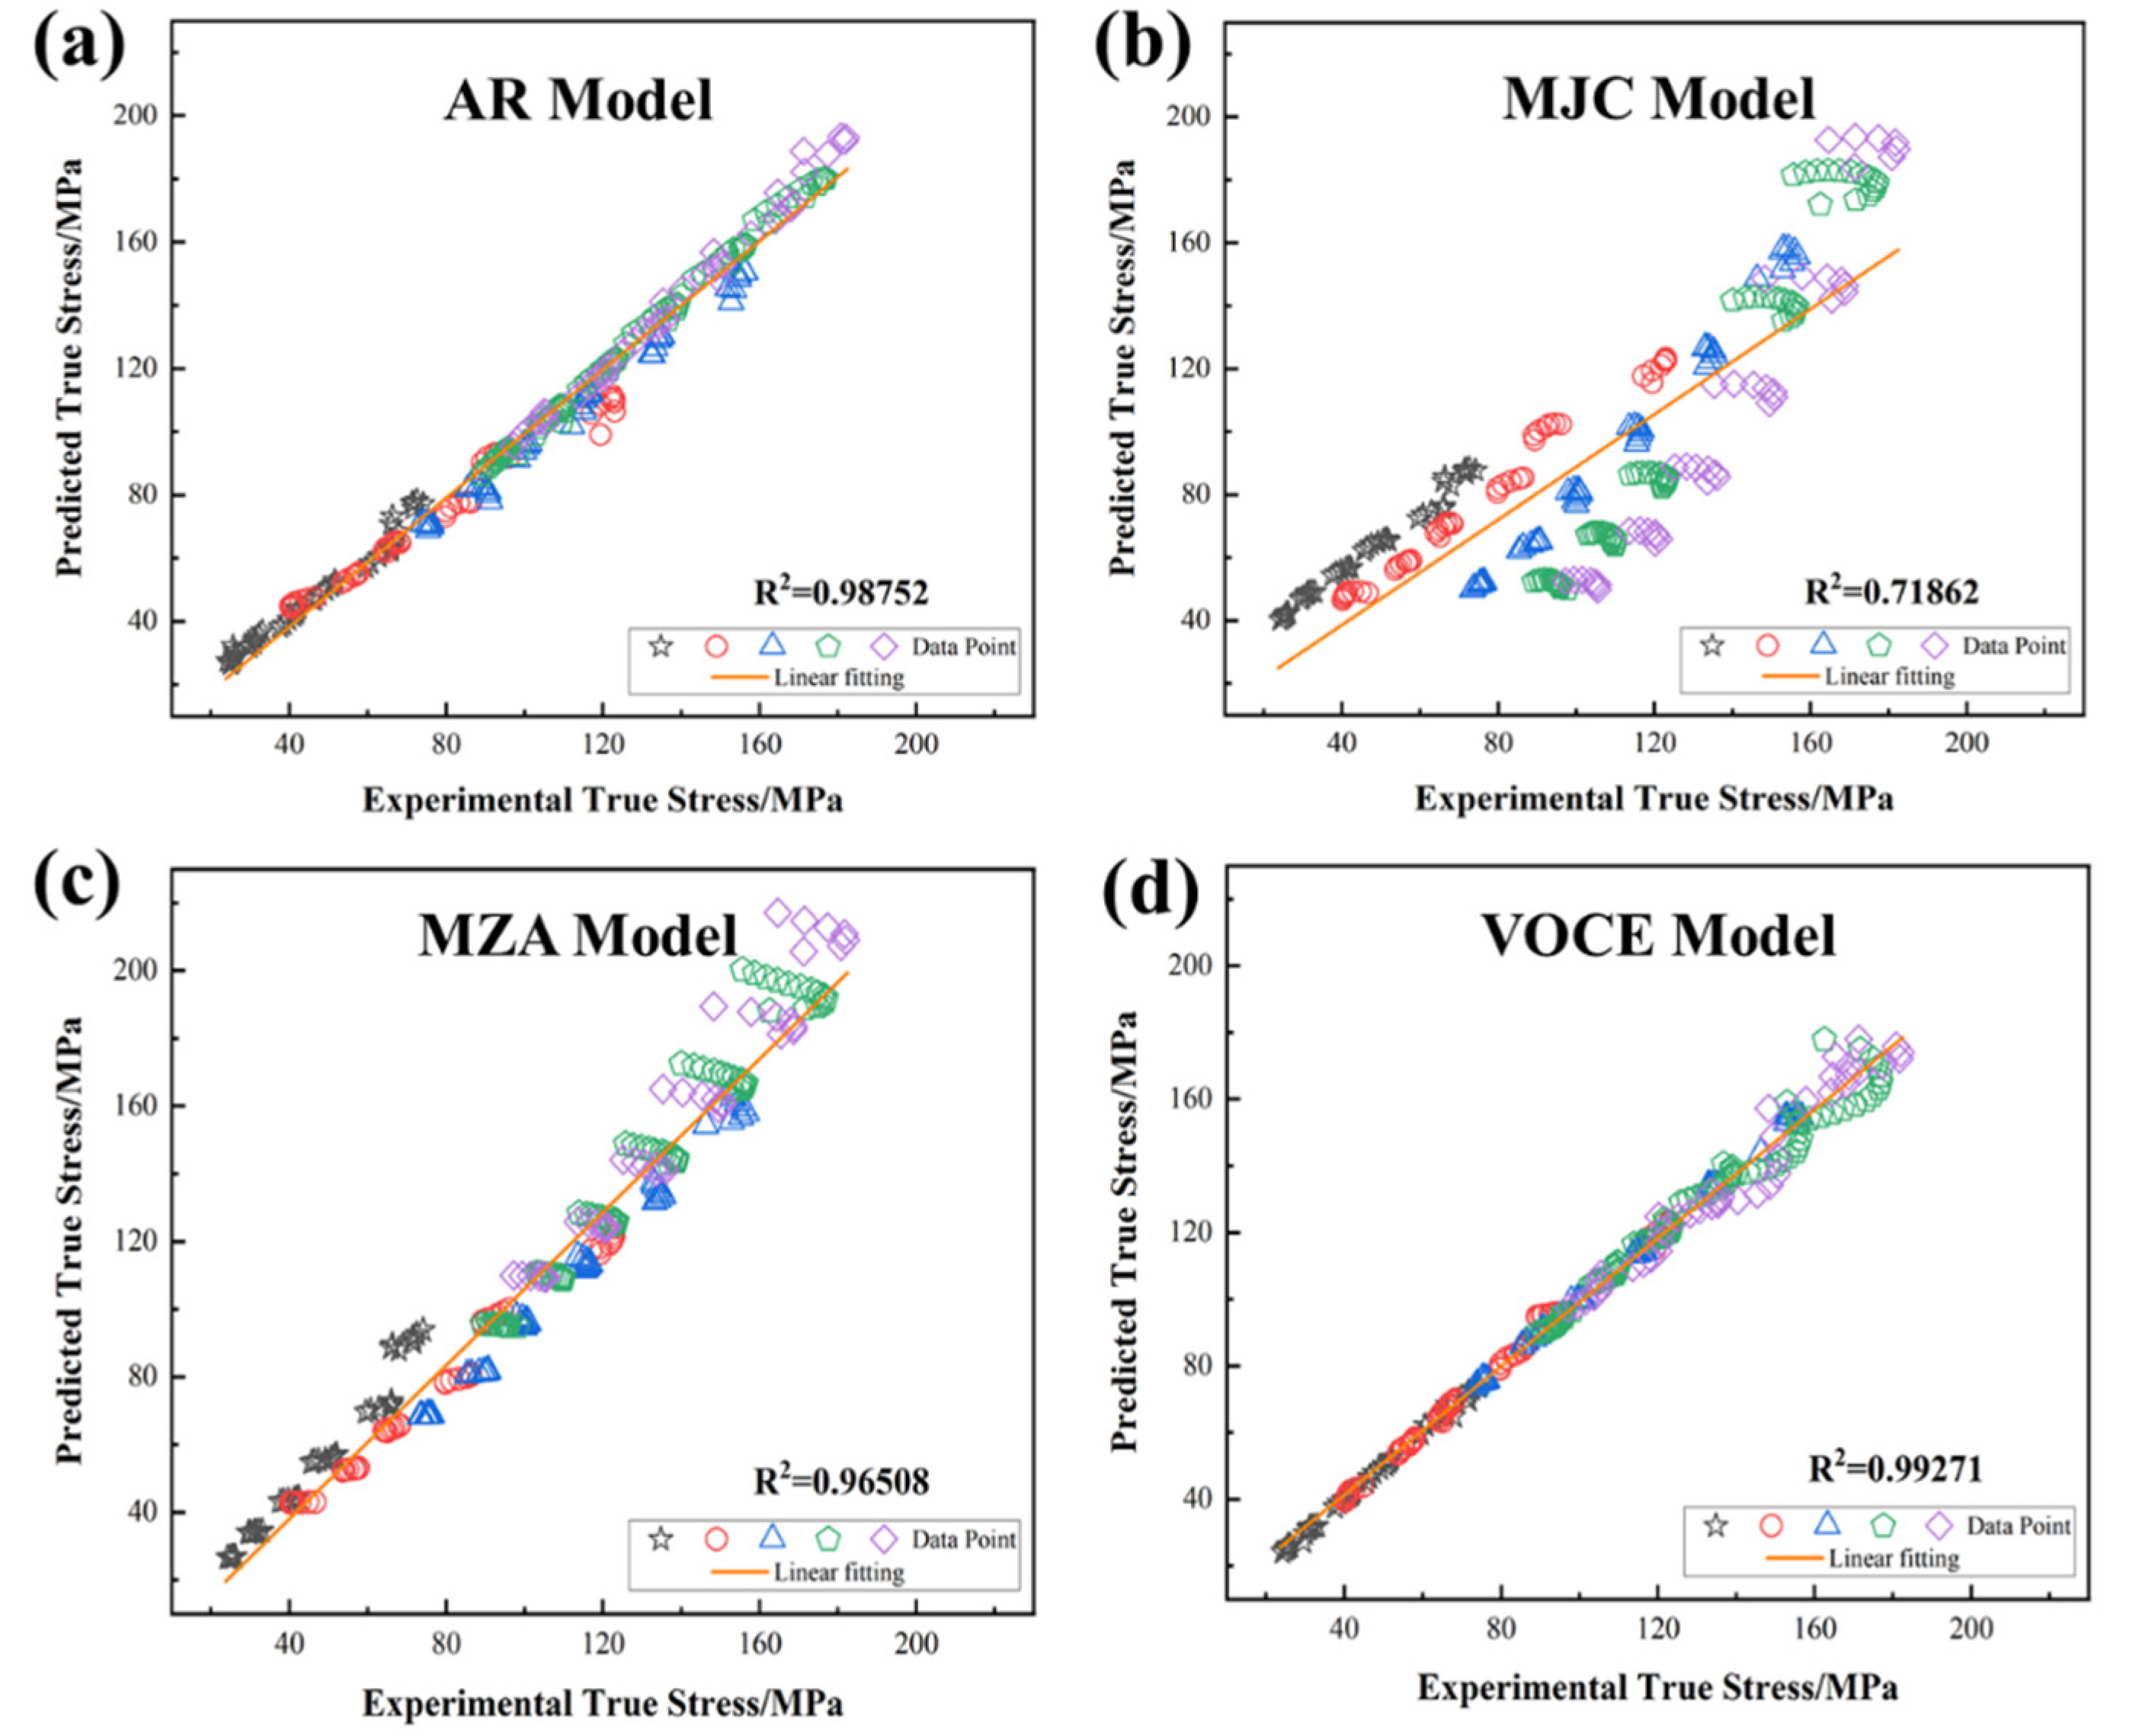
The accuracy of the predictions of the four models was measured by R2, as shown in Figure 15. It can be seen that the linear correlation between the predicted and experimental values calculated by the three models AR, MZA, and VOCE, R2, was greater than 0.96 with good agreement. However, the MJC model R2 was only 0.71862 with a large error.
The correlation coefficient indicated the strength of the linear relationship between the predicted and tested values. However, higher values of R2 did not necessarily indicate better prediction accuracy because the trend of the equation might be biased. AARE and RMSE were calculated by comparing relative errors one by one. The smaller their values were the higher the prediction accuracy of the equation was. From the analysis of R2, RMSE, and AARE of the four models in Figure 16, it was not difficult to find that the VOCE model and the AR model, with coupled strain variables, had significantly higher accuracy than the MJC and MZA constitutive models, and the VOCE model had the highest prediction accuracy with AARE and RMSE of only 1.8933% and 3.9822, respectively. However, the phenomenological constitutive model MJC had a larger error and could not accurately predict the flow behavior of the 1420Al–Li alloy. Although the MZA constitutive equation took into account the coupling effect between the deformation parameters, it still had a large error compared to the AR and VOCE models. This was because the VOCE model used a complex nonlinear fitting iterative algorithm when fitting using the UGO algorithm, while the AR model considered the coupling effects of temperature and rate in the calculation, the coupling strain was calculated using as many data points as possible, and the calculation process was significantly more complex and used more data points, compared to both the MJC and MZA models.
It is worth mentioning that there was only one independent variable (ε) in the VOCE constitutive model, compared with the other three models, which lacked two independent variables, temperature (T) and strain rate ( ε ˙ ). This was one of the reasons for the higher prediction accuracy than those of the other three constitutive models, but it also led to the inability of the VOCE model to reflect the flow behavior of the material under continuous changes in temperature and strain rate, which limits the practical application of the model. However, the physical significance of the parameters in the differential form of the VOCE equation can be used to analyze the flow behavior of the material, thus providing a preliminary understanding of the microscopic mechanism of the material during plastic deformation. Therefore, the role of the VOCE model should not be limited to the predicted stress values of the phenomenological constitutive model, and its possible value in subsequent studies deserves attention. It can be considered that the theoretical value of the VOCE model is greater than that of both the AR and MJC phenomenological constitutive models.

4.2. Effect of Deformation Parameters on the Accuracy of the Intrinsic Model

The overall predictive ability of the four constitutive models for the flow behavior of the 1420 Al–Li alloy used in the tests, as described in the previous section, had a large difference, but the different models presented different accuracies at different temperatures, rates, and strain variables. In this study, the errors of the four constitutive models under these three factors were discussed separately to provide a theoretical basis for the selection of the constitutive model when studying the heat deformation behavior of 1420 Al–Li alloy under different conditions.
The distribution of AARE with strain for the four models, shown in Figure 17, showed that the VOCE and AR models, with high overall prediction accuracy, showed the advantage of their accuracy in predicting flow stress for this material at each strain variable. The average relative error of the VOCE model fitted with the UGO algorithm had a weaker sensitivity for the corresponding variables. The AR model constructed, based on fixed strain variables with post-coupling, showed an increasing trend of AARE with increasing strain variables, which might be due to the different degrees of continuous dynamic recrystallization, discontinuous dynamic recrystallization, and dynamic reversion of the material at different temperatures and rates at high strain variables, with different trends of smooth stress plateaus and stress decreases, increasing the prediction difficulty of the AR model. However, the MZA model and MJC model of AARE with strain showed opposite trends. The overall less accurate MJC model predicted the flow stress of 1420 Al–Li alloy at strains higher than 0.518 with higher accuracy than the MZA model with a similar prediction range and construction difficulty.
Figure 18 shows the AARE of the four constitutive models at different temperatures and rates, and it can be seen that the AR model and the VOCE model, which had a more complicated model-building process, had higher accuracy at each deformation parameter. By comparison, it could be found that the accuracy of the prediction of all models, except the AR model, showed a certain trend with the change of temperature and rate. The exception of the AR models was because the AR model was built based on the data of different temperatures and rates under certain strain variables, and its prediction accuracy was less affected by the temperature and rate.
From the analysis of the four models at different rates in Figure 18a, it was easy to find that the three models, VOCE, MZA, and MJC, showed a tendency of larger errors with larger strain rates, except for the rate at 0.01 s−1, where the error was largely due to the special fluctuation of the true stress–strain curves. This was probably due to the adiabatic heating during the thermal deformation of the specimens at high strain rates [11]. The temperature of the specimen was higher than the preset temperature, while the stress value decreased, causing an increase in the AARE of the three constitutive models.
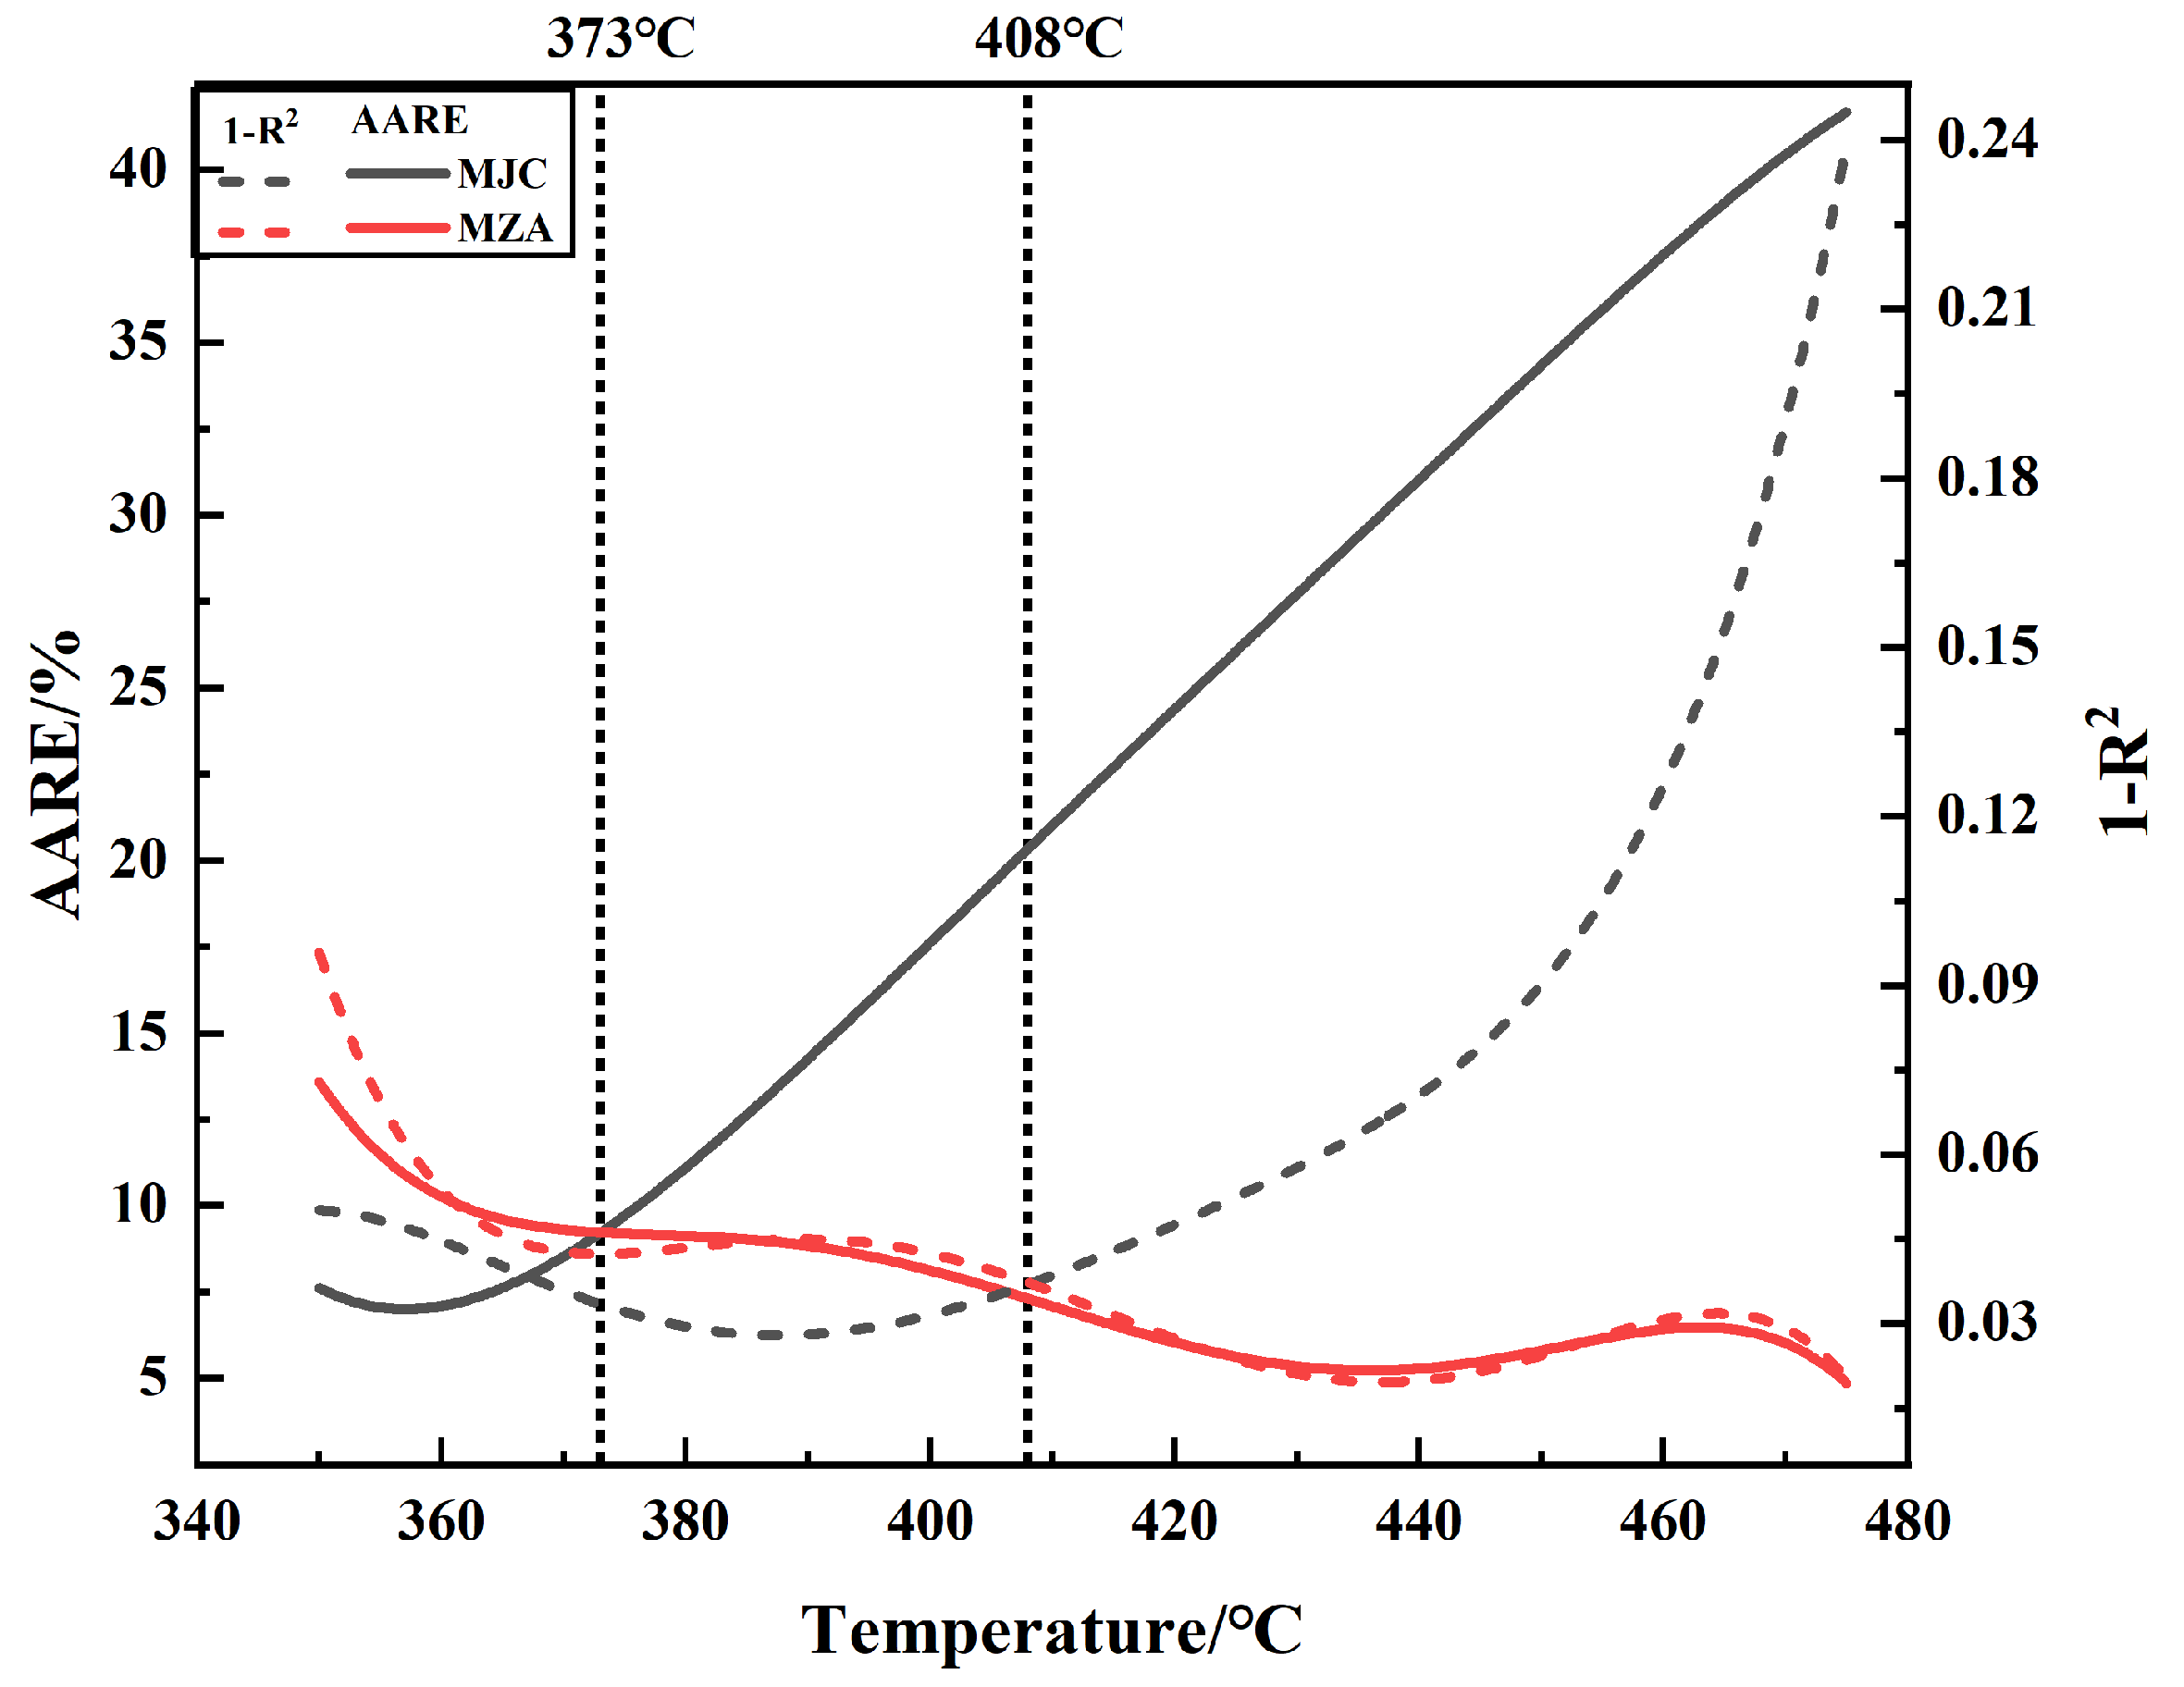
It is worth mentioning that, although the overall accuracy of the MJC model was significantly lower than that of the MZA model, which was similar to it in terms of calculation difficulty and independent variables, it is easy to see in Figure 18c that MJC had a lower average relative error at low temperatures. Therefore, in this study, the AARE and 1-R2 of the two models at different experimental temperatures were subjected to a five- times multinomial fit, as shown in Figure 19. Comparing the variation patterns presented by the two parameters, it could be ascertained that the accuracy of the MJC model was better than that of the MZA model at low temperatures (350–373 °C). The average relative error of the MJC model was higher than that of the MZA model at 373~408 °C, but it still outperformed the MZA model in terms of linear correlation with the experimental values. The prediction accuracy of the MZA constitutive model was significantly higher than that of the MJC model when the temperature was higher than 408 °C.

4.3. Conditions of Application of Different Intrinsic Structure Models

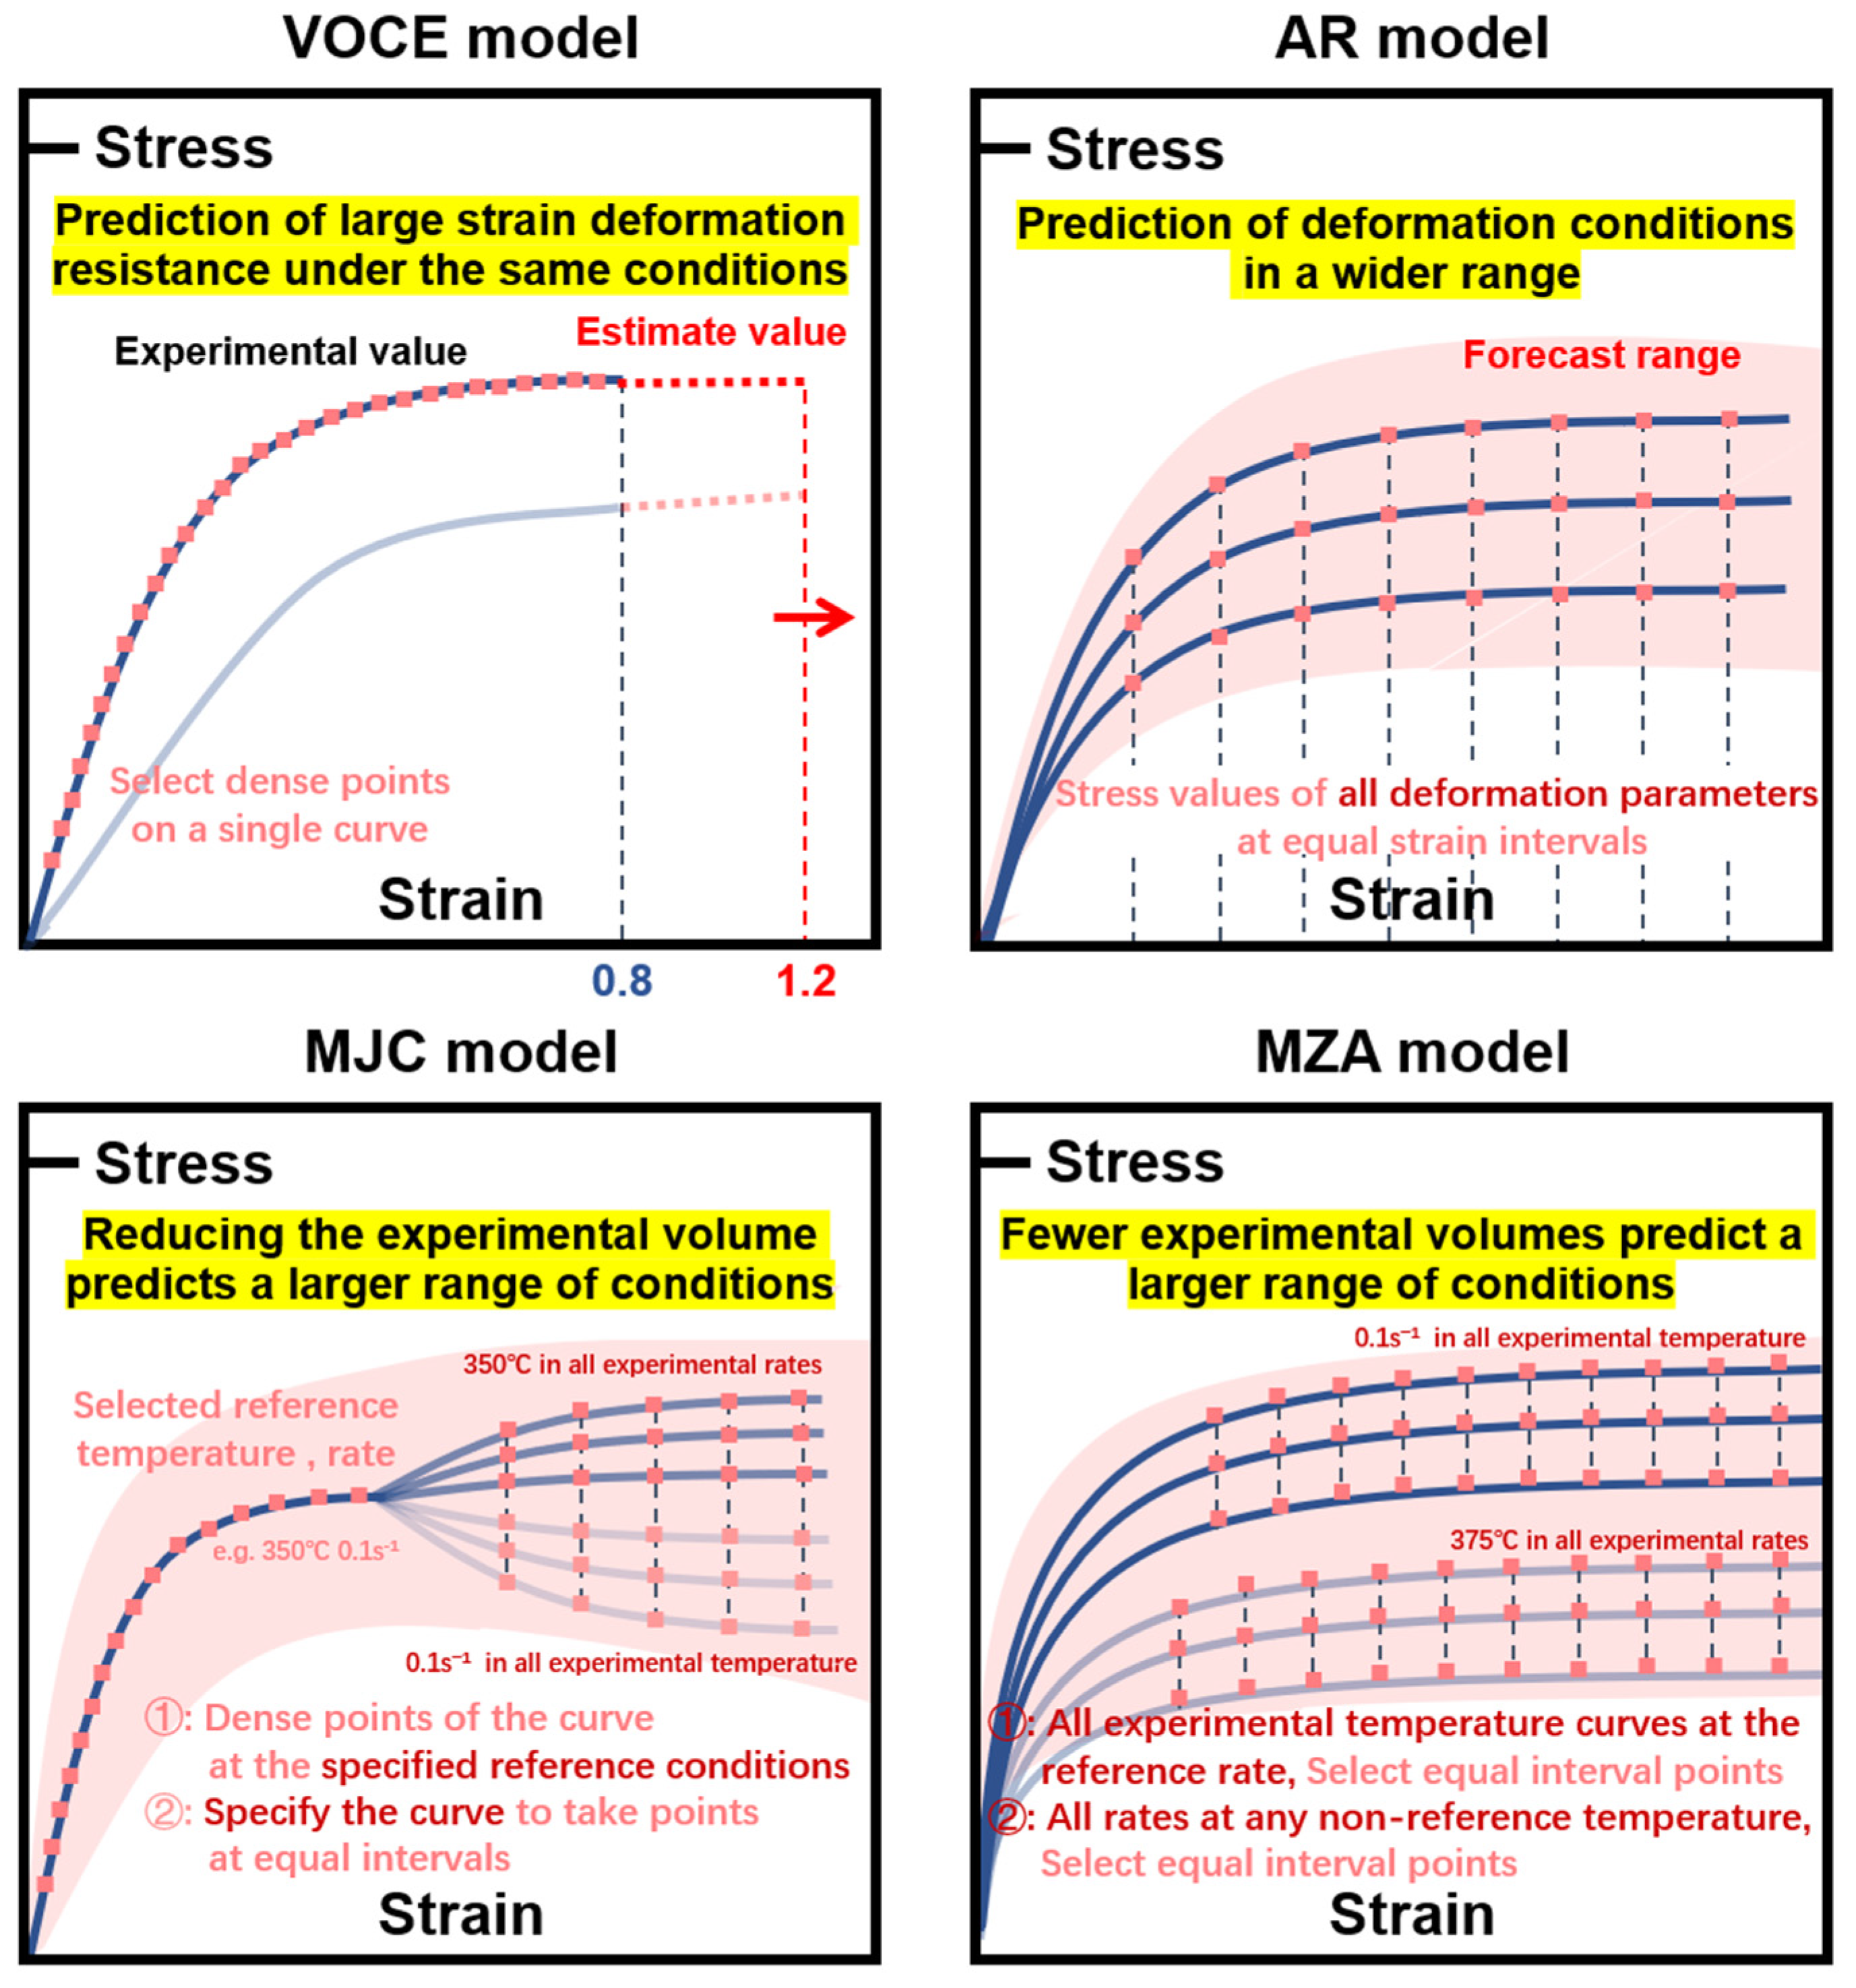
Different constitutive models have different guiding meanings in the process of process parameter formulation, due to their construction characteristics and data selection methods. Figure 20 shows a description of the four model data characteristics and model features.
The VOCE model constructs the relationship between stress and strain under fixed certain deformation conditions (temperature, rate) in the rheological curve through dense multi-point data on a single curve, and the UGO algorithm mathematizes the experimentally obtained rheological curve into a physical curve by a mathematical equation, i.e., any rheological curve obtained corresponds to a unique mathematical equation. The mathematical model focuses on portraying the changing trend of a single curve, and the accuracy is improved by decreasing the interval between data-taking points. When the deformation process of 1420 aluminum–lithium alloy is developed, it is possible to predict the deformation resistance of large strains under small strains in small batch experimental conditions (the experimental strain is only 0.8, but it is possible to predict the rheological stress when the strain is >1.2 such as in the spinning process). The construction characteristics of the VOCE model make it impossible to use the model for predicting a wider range of deformation condition stresses.
The AR model constructs the relationship between deformation rate, deformation temperature, and rheological stress. The relationship between each parameter (n, α, Q, A) is constructed by a coupling method (polynomial fitting) between different strain variables. The prediction of the parameters (n, α, Q, A) is used to achieve the stress prediction under different deformation conditions. The improvement of AR model accuracy depends on the increase of experimental conditions (temperature, deformation rate). The large experimental system and small strain interval make it easier to accurately portray different rheological stress curves by involving more stress data in the AR model. The matrix-like data fetching makes the AR model applicable to a larger range of deformation conditions prediction (the prediction range is larger than the experimental range).
The MJC model and the MZA model require the selection of a reference temperature and reference rate before construction, and the selection method was elucidated in the previous model construction process. Both models can still predict a larger range of process parameter rheological stress values by reducing the number of experiments and the amount of data. The difference is that the MJC model consists of an initial modeling array through a line of dense fetch points and a number table, while the MZA model consists of two number tables. The denseness of the number table fetch points affects the model accuracy.
By calculating the point-by-point errors of the AR model, MJC model, and MZA model under different process conditions, the error distributions of the three models were obtained, as shown in Figure 21a–c. The model with the lowest error, under the same conditions, was taken as the recommended model under this process parameter to get the best matching model under different process parameters, Figure 21i. Figure 21d–h shows the planar detail disassembly graph of Figure 21i. It can be seen that the AR model had the best prediction accuracy when the strain rate was large (strain rate ≥ 5/s), and the AR model should be used as the preferred model for stress prediction for high-rate deformation process. The MJC model had the optimal prediction accuracy for low temperature and low-rate deformation processes. The MZA model had better prediction accuracy for the low-rate high-temperature deformation process.
In summary, within the experimental parameters of this paper, the actual process could be guided by the model matching diagram of the process parameter selection area in the actual process production, at which time the model had the optimal accuracy and had the best guidance significance for the process formulation and performance research.

5. Conclusions

In this study, four constitutive models of 1420 Al–Li alloy were constructed to investigate the flow behavior of this material at high temperatures. The predictive capabilities of the four constitutive models, and their responses under different deformation conditions, were analyzed and compared to classify the conditions under which the different constitutive models are applicable. The main conclusions are as follows:
Comparison of model errors: The AR model, MZA model, and VOCE model have higher overall prediction accuracy: the linear correlation coefficients R2 were 0.9875, 0.9651, and 0.9927, respectively, and the average relative errors AARE were 3.9912%, 7.8422%, and 1.8933%, respectively. The linear correlation coefficient R2 of the MJC model was only 0.7186, but the accuracy of the MJC model was better than that of the MZA model under the conditions of strain greater than 0.518 or temperature lower than 373 °C.
Model building features: The VOCE model enables the prediction of large strain deformation resistance for corresponding conditions at small strains in small experimental quantities and cannot be used to predict a wider range of deformation condition stresses. The AR model is suitable for the prediction of a wider range of deformation conditions (the predicted range is larger than the experimental range) but relies on a huge experimental volume. MZA and MJC models can predict a wider range of flow stress values for process parameters and have a significantly reduced number of experiments and data.
Model application classification: Model matching plots were obtained for the selected process parameters of 1420 Al–Li alloy in the range of experimental parameters (temperature: 350–475 °C, rate: 0.01–10/s−1, strain maximum 0.8). The AR model had optimal prediction accuracy for the high-rate deformation process. The MJC model had the optimal prediction accuracy for low-temperature low-rate deformation process. The MZA model had better prediction accuracy for the low-rate high-temperature deformation process.

Author Contributions

Investigation, Z.Z.; data curation, T.Z. and X.D.; writing—original draft preparation, Y.Y. and X.D.; writing—review and editing, Y.Y. and X.D.; supervision, Y.Q.; project administration, R.L. and F.W.; funding acquisition, R.L. All authors have read and agreed to the published version of the manuscript.

Funding

This research was funded by [China Postdoctoral Science Foundation] grant number [2019M661738], [Natural Science Foundation of Jiangsu Province] grant number [BK20220548], and [Postgraduate Research and Practice Innovation Program of Jiangsu Province] grant number [SJCX21_1703].

Data Availability Statement

Not applicable.

Acknowledgments

The authors are grateful to Yun Cao, Shugang Cui, and Tian Liu from Jiangsu University for helping with high-temperature compression tests.

Conflicts of Interest

The authors declare no conflict of interest.

References

  1. Luo, R.; Cao, Y.; Cui, S.G.; Peng, C.-T.; Yang, Y.; Liu, T.; Chen, L.; Zhou, Y.; Qiu, Y.; Xu, Y.; et al. An Improved Constitutive Model Based on BP Artificial Neural Network and 3D Processing Maps of a Spray-Formed Al-Cu-Li Alloy. Trans. Indian Inst. Met. 2021, 74, 1809–1817. [Google Scholar] [CrossRef]
  2. Zhu, Y.; Cao, Y.; Liu, C.; Luo, R.; Li, N.; Shu, G.; Huang, G.; Liu, Q. Dynamic behavior and modified artificial neural network model for predicting flow stress during hot deformation of Alloy 925. Mater. Today Commun. 2020, 25, 101329. [Google Scholar] [CrossRef]
  3. Zhang, Z.; Huang, Y.; Qin, R.; Ren, W.; Wen, G. XGBoost-based on-line prediction of seam tensile strength for Al-Li alloy in laser welding: Experiment study and modelling. J. Manuf. Process. 2021, 64, 30–44. [Google Scholar] [CrossRef]
  4. Onoro, J. High-temperature mechanical properties of aluminium alloys reinforced with titanium diboride (TiB2) particles. Rare Met. 2011, 30, 200–205. [Google Scholar] [CrossRef] [Green Version]
  5. Xue, B.W. Adiabatic shear localization for steels based on Johnson-Cook model and second- and fourth-order gradient plasticity models. J. Iron Steel Res. Int. 2007, 14, 56–61. [Google Scholar] [CrossRef]
  6. Zhu, H.; Ou, H.A. Constitutive modelling of hot deformation behaviour of metallic materials. Mat. Sci. Eng. A 2022, 832, 142473. [Google Scholar] [CrossRef]
  7. Ashtiani, H.R.R.; Shayanpoor, A.A. New constitutive equation utilizing grain size for modeling of hot deformation behavior of AA1070 aluminum. Trans. Nonferrous Met. Soc. China 2021, 31, 345–357. [Google Scholar] [CrossRef]
  8. Shi, C.J.; Mao, W.M.; Chen, X.G. Evolution of activation energy during hot deformation of AA7150 aluminum alloy. Mat. Sci. Eng. A 2013, 571, 83–91. [Google Scholar] [CrossRef]
  9. Liu, Y.; Li, M.; Ren, X.W.; Xiao, Z.-B.; Zhang, X.-Y.; Huang, Y.-C. Flow stress prediction of Hastelloy C-276 alloy using modified Zerilli−Armstrong, Johnson−Cook and Arrhenius-type constitutive models. Trans. Nonferrous Met. Soc. China 2021, 30, 3031–3042. [Google Scholar] [CrossRef]
  10. Zhao, Q.; Chen, W.; Lin, J.; Huang, S.; Xia, X. Hot deformation behavior of 7A04 aluminum alloy at elevated temperature: Constitutive modeling and verification. Int. J. Mater. Form. 2020, 13, 293–302. [Google Scholar] [CrossRef]
  11. Yu, R.; Li, X.; Li, W.; Chen, J.; Guo, X.; Li, J. Application of four different models for predicting the high-temperature flow behavior of TG6 titanium alloy. Mater. Today Commun. 2021, 26, 102004. [Google Scholar] [CrossRef]
  12. Dong, F.; Yu, P.; Zhang, C.; Zhao, J. Modified Johnson-Cook constitutive model and damage model for 1420 Al-Li alloy. Metall. Funct. Mater. 2021, 28, 28–36. [Google Scholar] [CrossRef]
  13. Zhang, J.; Yi, Y.; Huang, S.; Mao, X.; He, H.; Tang, J.; Guo, W.; Dong, F. Dynamic recrystallization mechanisms of 2195 aluminum alloy during medium/high temperature compression deformation. Mat. Sci. Eng. A 2021, 804, 140650. [Google Scholar] [CrossRef]
  14. Mohammadi, H.; Eivani, A.R.; Seyedein, S.H.; Ghosh, M.; Jafarian, H. An investigation of hot deformation behavior of Zn–22Al alloy and development of its processing maps during isothermal compression. J. Mater. Res. Technol. 2021, 14, 507–520. [Google Scholar] [CrossRef]
  15. Puchi-Cabrera, E.S.; Guérin, J.D.; La Barbera-Sosa, J.G.; Dubar, M.; Dubar, L. Plausible extension of Anand’s model to metals exhibiting dynamic recrystallization and its experimental validation. Int. J. Plast. 2018, 108, 70–87. [Google Scholar] [CrossRef]
  16. Wu, H.; Xu, W.; Wang, S.; Yang, Z.; Chen, Y.; Teng, B.; Shan, D.; Guo, B. A cellular automaton coupled FEA model for hot deformation behavior of AZ61 magnesium alloys. J. Alloys Compd. 2020, 816, 152562. [Google Scholar] [CrossRef]
  17. Gao, Y.; Xue, X.; Gao, H.; Luo, W.; Wang, K.; Li, S.; Liu, X.; Du, Y. Investigation of High-Temperature Constitutive Behavior of Ti555211 Titanium Alloy Subjected to Plastic Deformation in the Different Phase Regions. Metals 2022, 12, 1562. [Google Scholar] [CrossRef]
  18. Abbasi-Bani, A.; Zarei-Hanzaki, A.; Pishbin, M.H.; Haghdadi, N. A comparative study on the capability of Johnson–Cook and Arrhenius-type constitutive equations to describe the flow behavior of Mg–6Al–1Zn alloy. Mech. Mater. 2014, 71, 52–61. [Google Scholar] [CrossRef]
  19. Lin, Y.C.; Chen, X.M.; Liu, G. A modified Johnson–Cook model for tensile behaviors of typical high-strength alloy steel. Mat. Sci. Eng. A 2010, 527, 6980–6986. [Google Scholar] [CrossRef]
  20. Ye, J.H.; Chen, M.H.; Wang, N.; Xie, L. Rheological behavior of TA12 titanium alloy at high temperature based on modified JC model. Chin. J. Nonferrous Met. 2019, 29, 733–741. [Google Scholar] [CrossRef]
  21. Samantaray, D.; Mandal, S.; Borah, U.; Bhaduri, A.; Sivaprasad, P. A thermo-viscoplastic constitutive model to predict elevated-temperature flow behaviour in a titanium-modified austenitic stainless steel. Mat. Sci. Eng. A 2009, 526, 1–6. [Google Scholar] [CrossRef]
  22. Gurusamy, M.M.; Rao, B.C. On the performance of modified Zerilli-Armstrong constitutive model in simulating the metal-cutting process. J. Manuf. Process. 2017, 28, 253–265. [Google Scholar] [CrossRef]
  23. Zhan, H.; Wang, G.; Kent, D.; Dargusch, M. Constitutive modelling of the flow behaviour of a β titanium alloy at high strain rates and elevated temperatures using the Johnson-Cook and modified Zerilli-Armstrong models. Mat. Sci. Eng. A 2014, 612, 71–79. [Google Scholar] [CrossRef] [Green Version]
  24. Samantaray, D.; Mandal, S.; Bhaduri, A.K. A comparative study on Johnson Cook, modified Zerilli-Armstrong and Arrhenius-type constitutive models to predict elevated temperature flow behaviour in modified 9Cr-1Mo steel. Comp. Mater. Sci. 2009, 47, 568–576. [Google Scholar] [CrossRef]
  25. An, H.; Xie, G.; Zhang, H.; Wang, X. A modified Zerilli–Armstrong constitutive model to predict hot deformation behavior of 20CrMo alloy steel. Mater. Des. 2014, 56, 122–127. [Google Scholar] [CrossRef]
  26. Liu, L.; Yao, Y.; Zeng, T. A micromechanical analysis to the elasto-viscoplastic behavior of solder alloys. Int. J. Solids Struct. 2019, 159, 211–220. [Google Scholar] [CrossRef]
  27. Sainath, G.; Choudhary, B.K.; Christopher, J.; Samuel, E.I.; Mathew, M. Applicability of Voce equation for tensile flow and work hardening behaviour of P92 ferritic steel. Int. J. Press. Vessel. Pip. 2015, 132, 1–9. [Google Scholar] [CrossRef]
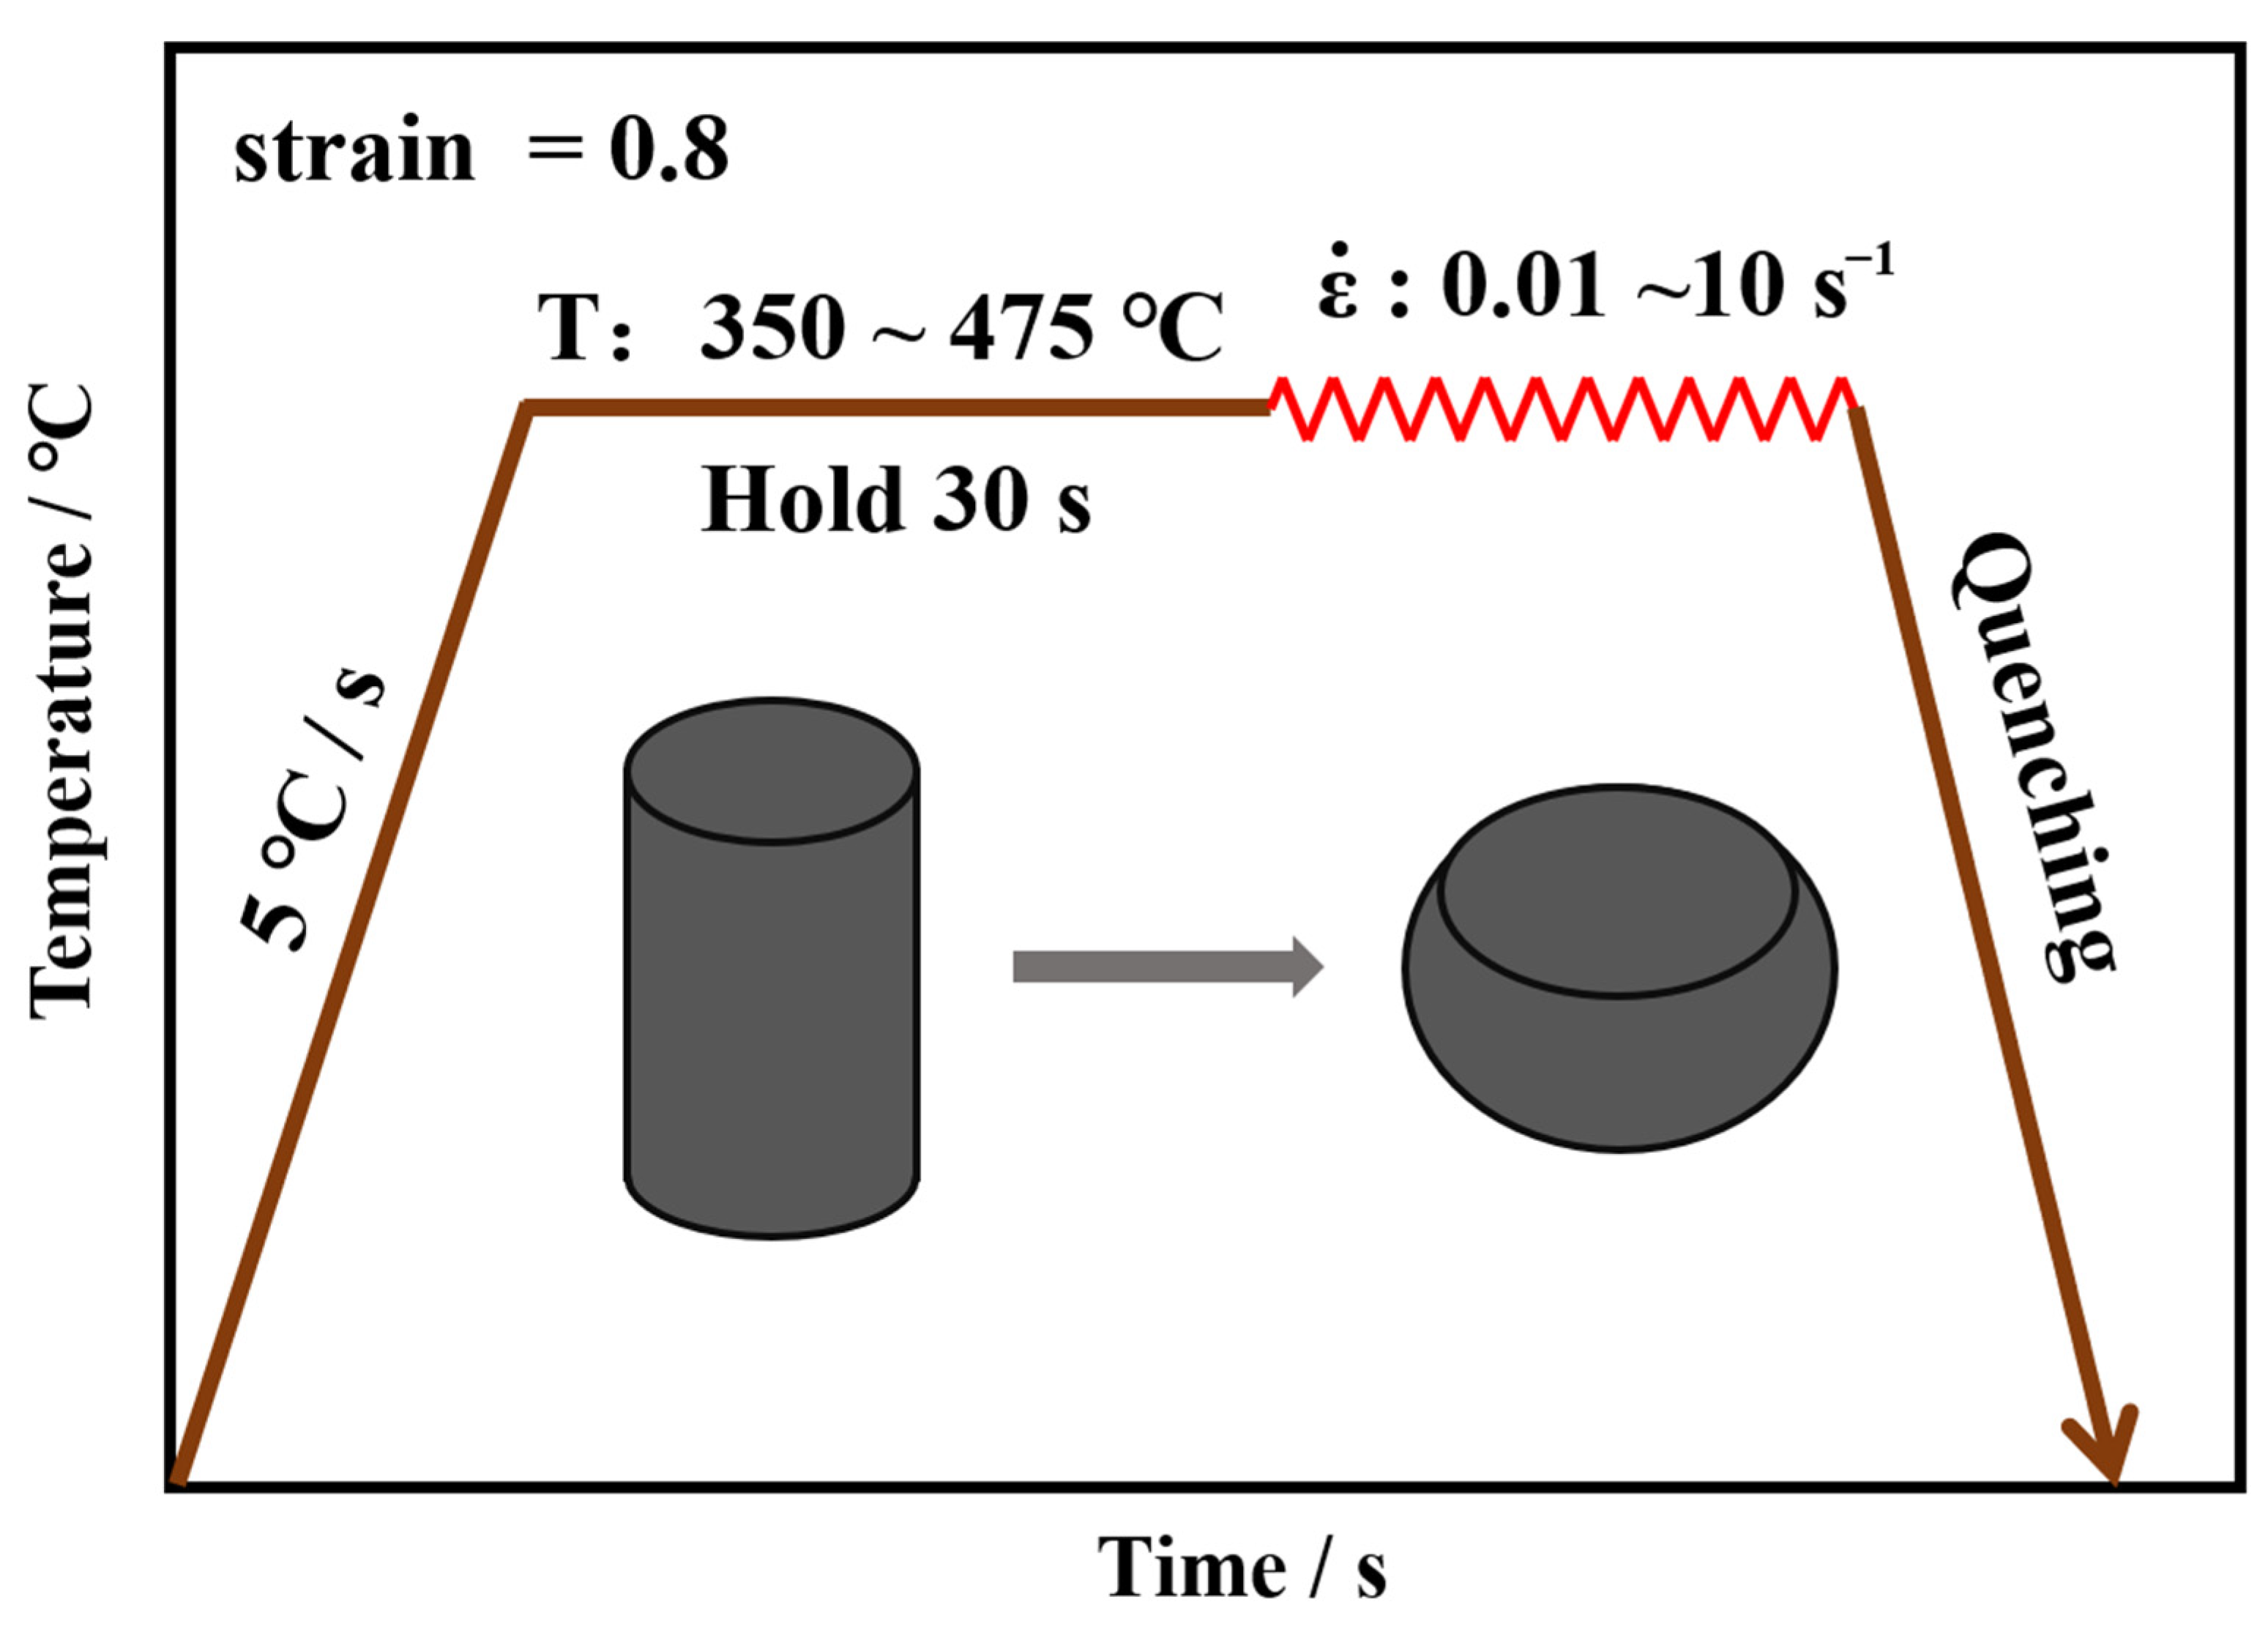
Figure 1. Hot deformation process flow diagram.
Metals 12 02029 g001
Figure 2. Flow stress curves of the 1420 Al–Li alloy. (a) strain rate = 0.01 s−1; (b) strain rate = 0.1 s−1; (c) strain rate = 1 s−1; (d) strain rate = 5 s−1; (e) strain rate = 10 s−1.
Metals 12 02029 g002
Figure 3. Flow chart for solving AR model parameters.
Metals 12 02029 g003
Figure 4. The constitutive model of the 1420 Al–Li alloy for peak stress. (a) l n ε ˙ σ; (b) l n ε ˙ lnσ; (c) l n ε ˙ − ln[sinh(ασ)]; (d) 1000/T − ln[sinh(ασ)]; (e) ln[sinh(ασ)] − lnZ.
Metals 12 02029 g004
Figure 5. Relationship between various constitutive constants and true strain. (a) ε-α; (b) ε-n; (c) ε-Q; (d) ε-lnA.
Metals 12 02029 g005
Figure 6. Prediction results of the AR model with various deformation parameters. (a) strain rate = 0.01 s−1; (b) strain rate = 0.1 s−1; (c) strain rate = 1 s−1; (d) strain rate = 5 s−1; (e) strain rate = 10 s−1.
Metals 12 02029 g006
Figure 7. Flow chart for solving MJC model parameters.
Metals 12 02029 g007
Figure 8. Relationship curve of various MJC constitutive parameters of 1420 Al–Li alloy. (a) ε-σ; (b) l n ε * ˙ σ / A + B 1 ε + B 2 ε 2 1 ; (c) T* − ln{σ/[(A + B1 ε + B2 ε2)(1 + C0 ln ε * ˙ )]}; (d) ln ε * ˙ − λ.
Metals 12 02029 g008
Figure 9. Prediction results of the MJC model with various deformation parameters. (a) strain rate = 0.01 s−1; (b) strain rate = 0.1 s−1; (c) strain rate = 1 s−1; (d) strain rate = 5 s−1; (e) strain rate = 10 s−1.
Metals 12 02029 g009
Figure 10. Flow chart for solving MZA model parameters.
Metals 12 02029 g010
Figure 11. Parameter relationship fitting related to I and S (a) lnε − ln(expI − C1); (b) ε-S.
Metals 12 02029 g011
Figure 12. Plot of T*-S2..
Metals 12 02029 g012
Figure 13. Prediction results of the MZA model with various deformation parameters. (a) strain rate = 0.01 s−1; (b) strain rate = 0.1 s−1; (c) strain rate = 1 s−1; (d) strain rate = 5 s−1; (e) strain rate = 10 s−1.
Metals 12 02029 g013
Figure 14. Prediction results of the VOCE model with various deformation parameters. (a) strain rate = 0.01 s−1; (b) strain rate = 0.1 s−1; (c) strain rate = 1 s−1; (d) strain rate = 5 s−1; (e) strain rate = 10 s−1.
Metals 12 02029 g014
Figure 15. Comparison of correlation coefficients of prediction stress by different models (a) AR Model; (b) MJC Model; (c) MZA Model; (d) VOCE Model.
Metals 12 02029 g015
Figure 16. Comparison of R2, AARE, and RMSE for stress values predicted by different models.
Metals 12 02029 g016
Figure 17. Schematic diagram of the effect of true strain on AARE.
Metals 12 02029 g017
Figure 18. Schematic diagram of the effect of different deformation conditions on AARE. (a,b) Temperature; (c,d) Strain rate.
Metals 12 02029 g018
Figure 19. The effect of deformation on the accuracy of the MJC and MZA models.
Metals 12 02029 g019
Figure 20. Four types of model data characteristics and model characteristics.
Metals 12 02029 g020
Figure 21. (ac) Point-by-point error under different process conditions of the three models; (dh) Diagram of the best-fit model with different process parameters-2D; (i) Diagram of the best-fit model with different process parameters-3D.
Metals 12 02029 g021
Table 1. Composition of the experimental 1420 Al–Li alloys (wt%).
MgLiSiFeZnZrCrCuMnNiAl
4.2722.0000.9760.5450.2950.2520.1870.1400.1340.90Bal.
Table 2. Data filtration for peak stress (MPa).
Strain Rate/s−1Temperature/℃
350375400425450475
0.0171.965.951.942.433.826.3
0.1122.497.386.568.357.946.5
1156.7135.4119.2105.492.579.5
5177.0156.7139.1123.8110.395.5
10182.5169.2151.7136.4121.4108.8
Table 3. Relationship between material constant and true strain.
StrainαnQ/(kJ/mol)lnAStrainαnQ/(kJ/mol)lnA
0.0500.0122094.559042137.910622.308450.4000.0117454.614320158.066825.73670
0.0750.0121184.338828139.777022.612320.4250.0117634.649310158.662125.83112
0.1000.0120684.266068142.554423.081780.4500.0117894.690368159.271025.92943
0.1250.0120424.235275143.791223.291560.4750.0118164.738713160.522826.13667
0.1500.0120134.224244144.374023.389430.5000.0118184.776697160.489926.12919
0.1750.0120014.246913145.944523.654180.5250.0118384.823432161.282026.25799
0.2000.0119354.272918146.612823.769840.5500.0118644.871419162.123926.39138
0.2250.0118594.325442149.259424.232950.5750.0118984.927463163.233326.57052
0.2500.0117924.390176152.349324.775500.6000.0119344.976719164.673326.81127
0.2750.0117324.442624154.144125.089330.6250.0119395.016171164.739526.82268
0.3000.0117194.477367155.594525.339840.6500.0119575.070479165.530926.95745
0.3250.0116944.511795156.283725.457180.6750.0119755.124941166.573527.13054
0.3500.0117324.543699156.914525.548250.7000.0119925.174292167.819427.34495
0.3750.0117364.575884157.451225.63442-----
Table 4. Values of I and S at different strains.
StrainISStrainIS
0.104.749760.008080.454.806210.00818
0.154.751660.008080.504.803870.00807
0.204.766340.008160.554.803770.00795
0.254.779140.008180.604.803850.00783
0.304.790920.008210.654.804430.00779
0.354.798410.008220.704.804720.00773
0.404.803370.00819
Publisher’s Note: MDPI stays neutral with regard to jurisdictional claims in published maps and institutional affiliations.