Article

Online Monitoring and Control of Butt-Welded Joint Penetration during GMAW

1
Jiangsu Key Laboratory of Spectral Imaging and Intelligent Sense, Nanjing University of Science and Technology, Nanjing 210094, China
2
School of Intelligent Manufacturing, Luoyang Institute of Science and Technology, Luoyang 471023, China
*
Authors to whom correspondence should be addressed.
These authors contributed equally to this work.
Metals 2022, 12(12), 2009; https://doi.org/10.3390/met12122009
Submission received: 2 November 2022 / Revised: 17 November 2022 / Accepted: 21 November 2022 / Published: 23 November 2022

Abstract

:
Butt welding is an important link to ensure welding quality, and the penetration state of the weld is the main criterion to achieve this. Online monitoring and control of the penetration state of welded joints is an important measure to ensure welding quality. The molten pool image is monitored by a visual sensor in the gas metal arc welding (GMAW) process, and the bottom molten pool width is predicted by the regression network model. Combined with the real-time control method, the welding current is changed to monitor and control the bottom weld width in real time. Butt-welding experiments with different groove angles verified that the proposed method could achieve satisfactory control accuracy and generalization ability. For butt-welding experiments with constant groove angles of 30° and 45°, the MAE of the controlled backside melt width to the target values was 0.2603 mm and 0.2620 mm. Therefore, it provides a feasible method for the online control of weld penetration.

Graphical Abstract

1. Introduction

The penetration state of a welded joint reflects the mechanical strength of the weld, which is an important indicator that determines the weld quality [1]. The bottom width of the weld reflects whether the base material is completely penetrated, and it is the most direct information that characterizes the penetration state. Monitoring the bottom width of the weld is the key to ensuring the quality of penetration control. However, in the actual production process, due to the limitation of the working environment, the penetration state at the bottom of the weld cannot be monitored in real time in most cases; it can only rely on skilled welders to judge the current weld penetration state according to the surface molten pool shape. By changing the welding parameters, the shape of the surface molten pool is adjusted in time, so as to effectively control the weld penetration state. In the modern development process, various forms of welding process are gradually being developed, from manual welding to automatic welding. In the production of electric arc welding processes, relying only on manual butt welding results in the welding quality not being guaranteed, and it cannot meet the needs of modern industrial automation. If the online control of the penetration state can be effectively realized, the development of welding automation technology will be greatly accelerated and a major breakthrough achieved.
At present, scholars have conducted research on the real-time detection of penetration status based on different welding methods. These are mainly the arc sound method [2], temperature field method [3], oscillation frequency method [4], and visual sensing method [5]. Among them, the molten pool visual sensing method can simulate the visual observation of skilled welders, detect the surface molten pool in real time during welding, and not affect the welding process. At present, in terms of welding automation, the visual sensing method is one of the most effective methods for the online monitoring of welding process and quality. Chen et al. [6] applied the supervised machine learning method to weld penetration prediction based on the new features of passive vision images. However, this method is weak and time-consuming, which is not conducive to real-time monitoring. Yang et al. [7] obtained the characteristic parameters of the aluminum alloy molten pool through a near-infrared vision sensor and established a BP neural network penetration-recognition model. The recognition accuracy of the model is 89%. Wu et al. [8] monitored weld penetration based on the keyhole visual signal. The welding process is controlled by changing current and gas flow to obtain satisfactory penetration results. Veiga et al. [9] presented a novel analysis of a wall fabricated by the WAAM technology based on GMAW. Based on the control of the symmetry of the melt pool in the infrared image, the process parameters for the manufacture of the wall were optimized to move the bead geometry close to the target. Pinto-Lopera et al. [10] proposed an approach for accomplishing real-time measurements of the weld bead width and height in GMAW processes by using a passive vision system and digital image processing techniques. The extremely short processing time offers the possibility of controlling the weld geometry in real time. Most of the above are traditional algorithms, and welding is a complex nonlinear physical phenomenon and process. Only relying on simple traditional methods creates difficulty in adapting to the complex welding environment, and the relationship between vision and penetration state information cannot be fully mined.
Convolutional neural networks (CNN) have been successfully applied in aerospace [11], medical [12], construction [13], unmanned driving [14], and other fields in recent years, thanks to the promotion of academia and industry. Some of these studies combine CNN with welding. Zhang et al. [15] constructed a prediction algorithm of a neuro-fuzzy model based on the geometry of the molten pool in order to control the welding process. The developed control system can achieve the expected fusion state under interference. Chen et al. [16] developed a real-time image processing algorithm to obtain the surface and back sizes of the molten pool. An accurate welding model was established by artificial neural network (ANN). Its simulation effect shows the accuracy of the method. Nomura et al. [17] established a CNN model to predict the penetration of single-bevel groove metal active-gas (MAG) welding. However, the local variation of the estimation accuracy depends on the quality of the training data, and robustness is poor. Furthermore, this method is only suitable for monitoring and not for online control. Martínez et al. [18] developed a GMAW weld geometry prediction framework using welding arc image and deep learning technology. The results show that this method can accurately predict the GMAW process and is capable of online analysis. Bacioiu et al. [19] used a high dynamic range (HDR) camera and an ANN for molten pool image processing to study a welding part classification system to identify welding defects. This model has high detection accuracy, but it requires a large number of datasets. Huang et al. [20] realized the high-precision prediction of pore defects based on the hydrogen porosity neural network prediction model of spectral characteristics. Lee et al. [21] established a deep neural network model to predict the shape and tensile strength of internal welds in welded joints, but it is not universal. Hou et al. [22] used a neural network to extract the inherent features of X-ray images to automatically detect weld defects. However, there is still little research on the online control of welded joint penetration in the GMAW butt-welding process based on CNN. In view of the importance of the online monitoring and control of the molten pool bottom width for welding quality, a useful monitoring and control method was studied.
The rest of this research is divided into five sections. Section 2 introduces the experimental system and the production process of the bottom width dataset of butt welding. Section 3 describes the regression network structure of the bottom molten pool width of the butt welding and the test results of the dataset. In Section 4, a fuzzy proportional integral derivative (PID) controller is established for the online control of the bottom molten pool width. Section 5 proves the effectiveness of the control algorithm through multiple sets of closed-loop welding experiments. The main conclusions are summarized in Section 6.

2. Experimental System and Data Acquisition

2.1. Setup Overview

The molten pool contains a wealth of visual information. Welders normally use vision to determine the shape characteristics of the surface molten pool and to judge the penetration state of the weld. The sum of the surface molten pool volume and bottom molten pool volume is basically constant in butt welding with fixed welding parameters. By monitoring the surface molten pool, the bottom molten pool volume can be predicted. As the shape of the bottom molten pool is similar in the steady state, its width can be obtained according to the pool’s volume. In this experiment, we chose to monitor the surface molten pool to predict the bottom weld width. The welding process for this experiment is DC welding, the wire material is 316 stainless steel, and the substrate material is 304 stainless steel.
The bottom width monitoring and control system of butt welding is described in Figure 1. The system mainly comprised a control cabinet (IRC5 Single), an ABB robot (IRB 2600), a welding power source (Fronius 4000-R, Vels, Austria), a monochrome CCD camera (Basler ace acA1920-155um, Ahrensburg, Germany), a lens with a focal length of 35 mm (Computar, Cary, NC, USA), and a computer. In addition, a protective glass and 850 nm high-pass filter were installed in front of the camera to monitor the state of the molten pool surface. In this way, infrared radiation could be suppressed and the camera lens protected.

2.2. Measured Data

The experiment of creating the butt-welding dataset was divided into four groups, with each group containing three weld data; each group selected two data as the training set and one datum as the test set. The training set contained 11,482 images and the test set 5768 images. The experimental workpiece was a 304 stainless steel plate with a thickness of 5 mm. The root blunt edge of the workpiece bevel was 1 mm. Figure 2 is a schematic diagram of the size of the butt-welding workpiece. The relevant experimental parameters are shown in Table 1.
The steps for the calibration of the bottom weld width data are shown in Figure 3. (a) After the weld was completed, the weld seam on the back of the workpiece was scanned using a 3D scanner (Wiiboox REEYEE 3M, Nanjing, China) to obtain the point cloud data; (b) the weld seam protruded from the workpiece surface, and the height values in the point cloud data were converted to grayscale values in the image; (c) the edge features of the weld seam were enhanced using the Scharr operator, and the segmentation of the weld image was used to obtain the weld geometry data; (d) the length–width relationship curve of the bottom weld was obtained based on the number of non-zero pixels per column versus the actual length of a single pixel.
In the dataset, each image collected of the surface molten pool must correspond to the bottom width of the weld at the same time. The front-end position of the top welding seam corresponds to the surface molten pool image of the arc starting point, and the distance between the front and back welding seams of the butt plate is measured. By dividing the distance by the welding speed and multiplying by the camera frame rate, the number of images with the difference between the bottom penetration time and the surface arcing time can be obtained. In this way, the image of the surface molten pool corresponding to the front-end position of the bottom welding seam is known, as shown in Equation (1), and the surface molten pool images at different positions can be matched with the bottom weld width to obtain the required dataset.
N b ( d ) = ( δ + d ) v f
where Nb(d) is the number of molten pool image frames at acquisition position. δ represents the distance between the top and bottom weld front ends. d is the distance between the acquisition position and the front end of the bottom weld. v = 7 mm/s, representing the welding speed. f = 200 Hz, representing the camera acquisition frame rate.

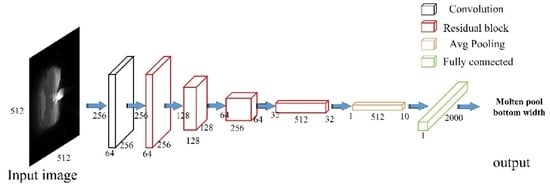
3. Network Structure

The welding process is complex, and the neural network has the ability to learn and build nonlinear models of complex relationships. It can predict unknown data by learning the hidden relationship within them. Traditional CNNs such as LeNet [23], AlexNet [24], and VGGNet [25] have achieved good results in regression tasks. However, with the deepening of these networks, the problem of gradient disappearance or explosion may occur. To solve these problems, He et al. [26] constructed a residual network (ResNet) that includes skip connections. It uses the residual block as a basic unit, where the input is x. For a stacked layer structure, the learned feature is set to x ˜ , and the feature that the residual structure hopes to learn is F ( x ) = x ˜ x , so x ˜ = F ( x ) + x , which means that the feature that needs to be learned is x ˜ . It can be seen that directly learning original features is much more complicated than learning residuals. ResNet not only ensures the integrity of information, but also reduces the amount of network parameters.
In this study, the basic structure of the residual module was used to extract the features of the molten pool image, and a method was proposed to monitor the weld width of the backside of butt welding based on the deep residual network. The size of the molten pool image captured by CCD was 1920 × 1200, and it contained a lot of useless information for the regression network. Therefore, with the molten pool as the center, the molten pool image was cropped to 512 × 512. The details contained in the network are shown in Table 2. The prediction network structure of the bottom molten pool width is described in Figure 4.
In this study, the regression model of the bottom molten pool width of butt welding was used to predict the bottom width of the weld. The test results are described in Figure 5. The evaluation indexes of its prediction accuracy are mean absolute error (MAE) and root mean square error (RMSE).
M A E = 1 m i = 1 m | ( w i w ^ i ) |
R M S E = 1 m i = 1 m ( w i w ^ i ) 2
where m represents the number of data points, w i represents the measured molten pool bottom width at instant i , and w ^ i is the predicted molten pool bottom width at instant i .
After calculation, the MAE of the test set was 0.4663 mm, and the RMSE was 0.5942 mm. The result of curve fitting was good, and the precision was satisfied. Therefore, the bottom molten pool width regression model was verified through the subsequent control experiments.

4. Control Strategy

Welding current is one of the main welding parameters that determine the penetration state. Through welding experiments, the bottom molten pool width of butt welding was found to be closely related to the welding heat input. The equation for heat input per unit length of weld is as follows:
q = η U I v
where η represents thermal efficiency coefficient, I represents current, U represents arc voltage, and v represents welding speed. In the welding experiment, a unified parameter adjustment was used, that is, the welding voltage and current were automatically matched. Therefore, assuming a constant welding speed, heat input increases when welding current increases, resulting in an increase in the bottom molten pool width of the weld.
The PID controller has been widely used in process control due to its advantages of easy implementation, robustness, and high reliability. In addition, the welding system is time-invariant and not linear. Fuzzy control was selected to dynamically adjust the PID parameters to obtain a better control effect. The PID controller formula is:
u ( t ) = K p [ e ( t ) + 1 T i 0 t e ( t ) d t + T d d e ( t ) d t ] = K p e ( t ) + K i 0 t e ( t ) d t + K d d e ( t ) d t
where u(t) represents the output value of the controller, e(t) = r(t) − c(t) represents the deviation between the target value r(t) and the actual output value c(t), Kp represents the proportional coefficient, Ti represents the integral time constant, Td represents the differential time constant, Ki = Kp/Ti represents the integral coefficient, and Kd = Kp/Td represents the differential coefficient.
In the fuzzy control part, the fuzzy subset is {PB, PM, PS, O, NS, NM, NB}, the domain of the fuzzy variables of the deviation e(t) and the deviation change rate ec(t) is [−3,3], and the input value fuzzification adopts a triangle membership function. According to professional experience, the initial values and fuzzy rules of Kp, Ki, and Kd are determined, and the weighted average method is used for defuzzification. The defuzzification formula is as follows:
K d f u z z y = i j [ M e ( i , j ) × M e c ( i , j ) × r u l e ( i , j ) ] i j M e ( i , j ) × M e c ( i , j )
K ( n ) = K ( n 1 ) + β × K d f u z z y
where K is the PID control coefficient, Me and Mεc are the membership degrees of e(t) and ec(t) after fuzzification, rule is the corresponding fuzzy rule value, and β is the scaling factor.
First, the bottom molten pool width value output by the regression model was selected as the actual output value e(t), and the deviation e(t) was obtained by comparing it with the target value r(t), which was used as the input of the fuzzy PID. Then, the current value of the welding machine was determined by the PID coefficient, and the PID coefficient was synchronously corrected by the fuzzy control. By repeating the above steps, the PID control coefficient was adjusted to change the current, so that the width value of the model output was close to the target value. The fuzzy PID controller is described in Figure 6.

5. Experimental Results and Analysis

Non-pulsed direct current was used to conduct butt-welding experiments on steel plates with different bevel angles to verify the effectiveness of the bottom molten pool width closed-loop monitoring system. The relevant experimental parameters are shown in Table 3. The experimental parameters were optimized by trial and error. Finally, Kp = 25, Ki = 0.1 and Kd = 0 are determined in this paper.
The target bottom weld width was set to 3 mm, and the steel plate with a groove angle of 30° was butt welded with an initial current of 105 A. The first group did not use the control strategy for butt welding, while the second group did. The experimental results are described in Figure 7.
The comparison of results shows that the first group of welds that did not use the control strategy were in an unpenetrated state. The width of the bottom molten pool of the second group adopting the control strategy was close to the target value in the initial stage, and the fluctuation amplitude of the width gradually decreased. The MAE of the second group was 0.2603 mm and the RMSE was 0.3673 mm.
Then, the initial current of 130 A was used for welding the steel plate with the groove angle of 45°. The first group did not use the control strategy for butt welding, while the second group did. The experimental results are described in Figure 8.
The comparison of results shows that the first group of welds that did not use the control strategy were in an unpenetrated state. The width of the bottom molten pool in the second group using the control strategy fluctuated around the target value, and the control effect was better. The MAE of the second group was 0.2620 mm and the RMSE was 0.3612 mm.
Then, to verify the robustness of the control strategy, the butt-welding experiment was carried out using a butt plate with a 45° groove angle in the first half and a 30° groove angle in the latter half. The bottom molten pool width result is described in Figure 9.
The first half is similar to the result in Figure 8, and the control effect is obvious. In the latter half of the welding without using the control strategy, due to the sudden decrease in the groove angle and the influence of the previous heat accumulation, the bottom began to be penetrated. When the control strategy was used in the latter half of welding, it was also affected by heat accumulation, which caused the width of the bottom molten pool to increase. However, through the control strategy, the width of the bottom molten pool gradually became smaller and approached the target value. The MAE of the second group was 0.9739 mm and the RMSE was 1.1383 mm.
Finally, a butt-welding experiment was conducted, in which the groove angle gradually changed from 30° to 45°. The bottom molten pool width result is described in Figure 10.
The width of the bottom molten pool that did not use the control strategy gradually decreased with the increase in the groove angle, and it was always smaller than the target value. The width of the bottom molten pool using the control strategy changed from large to small, and gradually stabilized near the target value, proving the effectiveness of the control algorithm. The MAE of the second group was 0.3860 mm, and the RMSE was 0.5076 mm.
The above experiments demonstrated the good effect of the butt-welding penetration online monitoring and control system. For butt welding with a groove angle of 30° to 45°, the final bottom molten pool width was close to the target of 3 mm after the control algorithm, achieving the effect of full penetration.

6. Conclusions

In order to enhance the quality of butt welding, an online monitoring and control strategy of butt-welding penetration in the GMAW process was designed in this paper.
  • The molten pool was monitored by visual sensing, and the width of the bottom molten pool was predicted by a constructed width-regression model.
  • A fuzzy PID control system was established to control the welding current, so as to achieve real-time control of penetration.
  • Experiments with different groove angles showed that the designed closed-loop control system has a good adjustment effect on butt-welding penetration, and a satisfactory bottom weld width can be obtained.
  • For a constant groove angle, the bottom weld width was initially established at the target value. For abruptly varying groove angles, the bottom weld width was first abruptly changed once and then adjusted by the control strategy to eventually approach the target value. For a gradual change in groove angle, the bottom weld width was gradually stabilized at the target value after several fluctuations under the control strategy.
  • The designed closed-loop control system can be extended in the case of more butt-welding process parameters and more groove angles. For WAAM additive manufacturing technology, other geometrical parameters of the weld seam, such as width and height, can also be controlled using this system.

Author Contributions

Conceptualization, X.X. and Y.W.; methodology, X.X. and Y.W.; software, X.X. and Y.W.; validation, X.X. and Y.W.; investigation, J.H. and Z.Z.; resources, J.L. and Z.Z.; data analysis, X.X.; writing—original draft preparation, X.X.; writing—review and editing, Y.W., J.H., J.L. and Z.Z.; supervision, J.L.; project administration, J.L.; funding acquisition, Z.Z. All authors have read and agreed to the published version of the manuscript.

Funding

This research was funded by the National Natural Science Foundation of China (Grant Nos. 62271263), Fundamental Research Funds for the Central Universities (Grant No.30922010705), National Natural Science Foundation of China (Grant Nos. 61901220, 61727802, 62101265), China Postdoctoral Science Foundation (Grant No.2021M691592) and The APC was funded by Nanjing University of Science and Technology.

Data Availability Statement

Not applicable.

Acknowledgments

The work was supported by Jiangsu Key Laboratory of Spectral Imaging and Intelligent Sense, Nanjing University of Science and Technology.

Conflicts of Interest

The authors declare no conflict of interest.

References

  1. Zhang, Y.; Wang, Q.; Liu, Y. Adaptive Intelligent Welding Manufacturing. Weld. J. 2021, 100, 63–83. [Google Scholar] [CrossRef]
  2. Zhang, Z.; Wen, G.; Chen, S. Audible Sound-based Intelligent Evaluation for Aluminum Alloy in Robotic Pulsed GTAW: Mechanism, feature selection and defect detection. IEEE Trans. Ind. Inform. 2018, 14, 2973–2983. [Google Scholar] [CrossRef]
  3. Yu, R.; Han, J.; Bai, L.; Zhao, Z. Identification of butt welded joint penetration based on infrared thermal imaging. J. Mater. Res. Technol. 2021, 12, 1486–1495. [Google Scholar] [CrossRef]
  4. Aendenroomer, A.; Ouden, G. Weld pool oscillation as a tool for penetration sensing during pulsed GTA welding. Weld. J. 1998, 77, 181–187. [Google Scholar]
  5. Wang, X.; Liu, Y.; Zhang, W.; Zhang, Y. Estimation of weld penetration using parameterized three-dimensional weld pool surface in gas tungsten arc welding. In Proceedings of the IEEE International Symposium on Industrial Electronics, Hangzhou, China, 28–31 May 2012; pp. 835–840. [Google Scholar]
  6. Chen, Z.; Chen, J.; Feng, Z. Welding penetration prediction with passive vision system. J. Manuf. Process. 2018, 36, 224–230. [Google Scholar] [CrossRef]
  7. Yang, J.; Wang, K.; Wu, T.; Zhou, X. Welding penetration recognition in aluminum alloy tandem arc welding based on visual characters of weld pool. Trans. China Weld. Inst. 2017, 38, 49–52. [Google Scholar]
  8. Wu, D.; Chen, H.; Huang, Y.; Chen, S. Online monitoring and model-free adaptive control of weld penetration in VPPAW based on extreme learning machine. IEEE Trans. Ind. Inform. 2019, 15, 2732–2741. [Google Scholar] [CrossRef]
  9. Veiga, F.; Suarez, A.; Aldalur, E.; Artaza, T. Wire arc additive manufacturing of invar parts: Bead geometry and melt pool monitoring. Measurement 2022, 189, 110452. [Google Scholar] [CrossRef]
  10. Pinto-Lopera, J.E.; ST Motta, J.M.; Absi Alfaro, S.C. Real-Time Measurement of Width and Height of Weld Beads in GMAW Processes. Sensors 2016, 16, 1500. [Google Scholar] [CrossRef]
  11. Dong, X.; Taylor, C.; Cootes, T. Automatic aerospace weld inspection using unsupervised local deep feature learning. Knowl.-Based Syst. 2021, 221, 106892. [Google Scholar] [CrossRef]
  12. Liu, L.; Wu, F.; Wang, Y.; Wang, J. Multi-Receptive-Field CNN for Semantic Segmentation of Medical Images. IEEE J. Biomed. Health Inform. 2020, 24, 3215–3225. [Google Scholar] [CrossRef]
  13. Nex, F.; Duarte, D.; Tonolo, F.; Kerle, N. Structural Building Damage Detection with Deep Learning: Assessment of a State-of-the-Art CNN in Operational Conditions. Remote Sens. 2019, 11, 2765. [Google Scholar] [CrossRef]
  14. Benjdira, B.; Khursheed, T.; Koubaa, A.; Ammar, A.; Kais, O. Car Detection using Unmanned Aerial Vehicles: Comparison between Faster R-CNN and YOLOv3. In Proceedings of the International Conference on Unmanned Vehicle Systems (UVS), Muscat, Oman, 5–7 February 2019; pp. 1–6. [Google Scholar]
  15. Zhang, Y.; Kovacevic, R. Neurofuzzy model-based predictive control of weld fusion zone geometry. IEEE Trans. Fuzzy Syst. 1998, 6, 389–401. [Google Scholar] [CrossRef] [Green Version]
  16. Chen, S.; Lou, Y.; Wu, L.; Zhao, D. Intelligent Methodology for Sensing, Modeling and Control of Pulsed GTAW: Part I Bead-on-Plate Welding. Weld. J. 2000, 79, 151–163. [Google Scholar]
  17. Nomura, K.; Fukushima, K.; Matsumura, T.; Asai, S. Burn-through prediction and weld depth estimation by deep learning model monitoring the molten pool in gas metal arc welding with gap fluctuation. J. Manuf. Process. 2020, 61, 590–600. [Google Scholar] [CrossRef]
  18. Martínez, A.; Bestard, G.; Silva, A.; Alfaro, S. Analysis of GMAW process with deep learning and machine learning techniques. J. Manuf. Process. 2021, 62, 695–703. [Google Scholar] [CrossRef]
  19. Bacioiu, D.; Melton, G.; Papaelias, M.; Shaw, R. Automated defect classification of Aluminium 5083 TIG welding using HDR camera and neural networks. J. Manuf. Process. 2019, 45, 603–613. [Google Scholar] [CrossRef]
  20. Huang, Y.; Yuan, Y.; Yang, L.; Wu, D.; Chen, S. Real-time Monitoring and Control of Porosity Defects during Arc Welding of Aluminum Alloys. J. Mater. Process. Technol. 2020, 286, 116832. [Google Scholar] [CrossRef]
  21. Lee, K.; Hwang, I.; Kim, Y.; Lee, H.; Kang, M.; Yu, J. Real-Time Weld Quality Prediction Using a Laser Vision Sensor in a Lap Fillet Joint during Gas Metal Arc Welding. Sensors 2020, 20, 1625. [Google Scholar] [CrossRef] [Green Version]
  22. Hou, W.; Wei, Y.; Guo, J.; Jin, Y.; Zhu, C. Automatic Detection of Welding Defects using Deep Neural Network. J. Phys. Conf. Ser. 2018, 933, 1–10. [Google Scholar] [CrossRef]
  23. Lecun, Y.; Bottou, L.; Bengio, Y.; Haffner, P. Gradient-based learning applied to document recognition. Proc. IEEE 1998, 86, 2278–2324. [Google Scholar] [CrossRef] [Green Version]
  24. Krizhevsky, A.; Sutskever, I.; Hinton, G. ImageNet Classification with Deep Convolutional Neural Networks. Adv. Neural Inf. Process. Syst. 2012, 25, 1–7. [Google Scholar] [CrossRef] [Green Version]
  25. Simonyan, K.; Zisserman, A. Very Deep Convolutional Networks for Large-Scale Image Recognition. Comput. Sci. 2014, 6, 1409–1556. [Google Scholar]
  26. He, K.; Zhang, X.; Ren, S.; Sun, J. Deep Residual Learning for Image Recognition. In Proceedings of the 2016 IEEE Conference on Computer Vision and Pattern Recognition, Las Vegas, NV, USA, 27–30 June 2016; Volume 1, pp. 770–778. [Google Scholar]
Figure 1. Schematic diagram of experimental equipment.
Metals 12 02009 g001
Figure 2. Schematic diagram of the longitudinal cross-sectional dimensions of a butt-welded workpiece.
Metals 12 02009 g002
Figure 3. Flow chart for extraction of the bottom width of weld. (a) Bottom weld point cloud (b) Grayscale image of height (c) Binarised image of weld geometry (d) The length–width relationship curve of the bottom weld.
Metals 12 02009 g003
Figure 4. Prediction network structure diagram of the bottom molten pool width.
Metals 12 02009 g004
Figure 5. Comparison of measured data and predicted results.
Metals 12 02009 g005
Figure 6. Block diagram of fuzzy PID controller.
Metals 12 02009 g006
Figure 7. Comparison of results of the bottom molten pool width of butt welding with a groove angle of 30°.
Metals 12 02009 g007
Figure 8. Comparison of results of the bottom molten pool width of butt welding with a groove angle of 45°.
Metals 12 02009 g008
Figure 9. Comparison of results of the bottom molten pool width of the butt welding with the first half of the groove angle of 45° and the latter half of the groove angle of 30°.
Metals 12 02009 g009
Figure 10. Comparison of results of the bottom molten pool width of butt welding with the groove angle gradually changing from 30° to 45°.
Metals 12 02009 g010
Table 1. Experimental parameters.
GroupGroove Angle (°)Current (A)Length (mm)Welding Speed (mm/s)Penetration State
1452001207Full-penetration
2451701207Non-penetration
3301841207Full-penetration
4301601207Non-penetration
Table 2. Bottom molten pool width prediction network specific information.
Network LayersOutput SizeParameters
Input (512 × 512 × 1)
Convolution256 × 256 × 645 × 5, 64, stride = 2
Residual Block 1256 × 256 × 64basicblock × 3
Residual Block 2128 × 128 × 128basicblock × 4
Residual Block 364 × 64 × 256basicblock × 6
Residual Block 432 × 32 × 512basicblock × 3
Pool10 × 1 × 5124 × 3, avg_pool
Linear1 (feature)1000
Linear2 (feature)1
Table 3. Welding parameters.
ParametersValue
Wire diameter (mm)1.2
Ar (98.5%) and O2 (1.5%) (L/min)25
Welding length (mm)120
Welding speed (mm/s)7
Exposure time (μs)200
Acquisition frequency (Hz)100
Publisher’s Note: MDPI stays neutral with regard to jurisdictional claims in published maps and institutional affiliations.

