Article

Dynamic Response of Nanoscale He Bubbles in Single Crystal Al during Release from a High-Pressure State

1
State Key Laboratory of Explosion Science and Technology, Beijing Institute of Technology, Beijing 100081, China
2
Explosion Protection and Emergency Disposal Technology Engineering Research Center of the Ministry of Education, Beijing 100081, China
*
Author to whom correspondence should be addressed.
Metals 2022, 12(10), 1665; https://doi.org/10.3390/met12101665
Submission received: 4 August 2022 / Revised: 22 September 2022 / Accepted: 22 September 2022 / Published: 4 October 2022

Abstract

:
Previous researches have presented some knowledge about the shock loading and unloading of the nanoscale He bubble. However, the He bubble will undergo a long high-pressure adiabatic relaxation process after being shocked. This work focuses on the release path of the nanoscale He bubble in single crystal Al from a stable high-pressure state by molecular dynamics method. Firstly, we consider the case that two opposite release waves meet at the center of the He bubble. Combined with the analysis of deformation mechanism and stress waveform around the He bubble, the difference of evolution law of He bubble under different pressure conditions is revealed. The evolution of the number and distribution of voids with or without the He bubble is compared. And the nucleation region gradually extends to both sides of the He bubble with the increase of initial Hugoniot pressure. Moreover, when a single unloading wave is considered to sweep through the He bubble, the microjet formation in the He bubble is found due to the pressure gradient effect. The shape and velocity distribution of internal and surface jets are discussed.

Graphical Abstract

1. Introduction

He atoms are the natural products of radioactive irradiation, and they eventually form nanoscale He bubbles with high internal pressure due to the extremely low solubility in metals [1,2]. These high-pressurized He bubbles may cause hardening, embrittlement and swelling of the parent matrix [3,4,5]. Therefore, understanding the evolution behavior of He in metals is very important in the research of mechanical properties of irradiated materials.
The formation of the He bubble [6,7,8], the interaction between the He bubble and other defects [9,10,11], and the mechanical effects of He bubbles [12,13,14,15], have received great attention since the 1960s. However, little is known about the dynamic response of He bubbles, as it is difficult to controllably prepare He bubbles and perform detailed in-situ observation under extreme conditions. Previously, Glam et al. [16,17,18] successfully prepared He bubble-induced Al samples with the method of neutron radiation of Al-10B and then conducted the plane impact experiments with a gas gun and VISAR diagnostic. They found that the formation of He bubbles can reduce the spall strength of Al-10B samples to a certain extent at 600 °C, indicating that the effect of He bubbles is some different from that of other impurity elements. While at 25 °C the spall strength of these two kinds of samples is similar. Xiao et al. [19] investigated the spallation behaviors of Al-10B targets with 5 nm radius He bubble subjected to direct laser shock loading and found that the spall strength significantly increases with the tensile strain rate, and the He bubble or boron inclusions in Al reduces the spall strength of materials by 34%. Note that these metal samples often contain many other defects besides He bubbles, which obviously brings uncertainty to the understanding of the influence mechanism of He bubbles.
In recent years, molecular dynamics (MD) simulations have been carried out to study the dynamic response of a He bubble. Kubota et al. [20] simulated the Hugoniot curve of Al containing He bubbles or other defects and found that these defects have little effect on Hugoniot and the dynamic strength under high pressure. In fact, under compression the He bubbles can form polyhedral hardened structures with finite collapse [21], while the He bubbles become damage initiation and affect the development of surrounding voids under tension [22]. Under a strong shock loading, the high-speed jet may form and break the He bubbles into pieces [23]. If He bubbles are distributed near the surface, they will aggravate the surface damage and cause the ejected mass to significantly grow relative to the sample containing He atoms [24]. Wang et al. [25] pointed out the He doping significantly affects the surface damage of nanoporous copper. In the release stage after shock, the influence of the He bubble is more prominent, where the internal pressure of the He bubble may accelerate the local damage evolution. Shao et al. [26] simulated the effect of He bubbles during spallation, and recently Zhou et al. [27,28] presented the detailed investigations on the process of He bubble growth and void nucleation. These investigations have indicated that the growth of the He bubble has pronounced effects on the dynamic responses of metals. The systematic study of the dynamic response of the He bubble during release from the shocked state is helpful to understand the role of the He bubble and interpret its influence mechanism.
In our recent work [29], the shock-induced migration of He bubble is revealed under shock compression. With the increasing of shock intensity, the migration distance of the He bubble inevitably increases with the change of the thermodynamic state of the system. During the following release process, it is almost impossible to accurately identify the pure effect of a certain factor. Therefore, in order to better control the position and the thermodynamic state, we considered to use release from artificially constructed Hugoniot states rather than to perform shock loading. In this work, we set different stable He bubbles with reference to the shock adiabatic states and then the unloading behavior of high-pressured He bubbles at different positions is discussed in detail. The deformation, growth, damage, and microjet are all revealed. This paper is organized as follows. The detailed information of the model and methods are described in Section 2. The results and discussion are demonstrated in Section 3. The conclusion is summarized in Section 4.

2. Simulation Details

First of all, an Al matrix of 100(x) × 100(y) × 180(z) fcc unit cells is constructed. The x, y, and z axes are, respectively, along the [100], [010] and [001] crystallographic directions. For the pertinence of research, a He bubble of d = 10 nm is directly introduced into the Al matrix by first removing the Al atoms and then adding He atoms, without considering the complex formation of the He bubble. The number of He atoms is 31,317 and the He concentration is approximately 48 nm−3. In order to investigate the influence of the position of the He bubble on the dynamic response, three different positions along the z-axis from the center of the simulation cell, i.e., L = 0, 45 and 76 a, are considered respectively. The lattice constant a is taken as 4.05707 Å so that the pressure in the Al matrix is zero, excepting the region of the He bubble. The embedded-atom method (EAM) potential for Al [30] and the exponential-six (exp6) pair potential for He–He [31] are used. The Al–He interaction is described by the two-body potential parameterized by first-principle calculation [32]. The three potentials have been applied successfully in previous works [26,27,28]. Under 3D periodic boundary conditions, the model constructed above is first relaxed by energy minimization using the conjugate gradient method. Then, we use the NPT ensemble with reference to T-P Hugoniot and obtain a series of the relaxation models for different Hugoniot states. Subsequently, we directly release the models in microcanonical ensemble. During the release process, the periodic boundary conditions are applied only along the x and y directions, and the free boundary condition is applied along the z direction. A three-dimensional view of model is presented in Figure 1.
All MD simulations are performed using the parallel MD code, LAMMPS [33]. The visualization is finished using the OVITO program [34]. The statistics of the void number are calculated by the construct surface mesh algorithm [35] embedded in OVITO. The temperature of each atom is calculated by using the average kinetic energy (relative to the center of mass) in a sphere region with 10 Å radius. The average pressure of the He bubble is calculated based on Virial theorem [36], where the He bubble volume is measured by the Voronoi tessellation analysis technique [37].

3. Results and Discussion

3.1. Thermodynamic Relations on Release

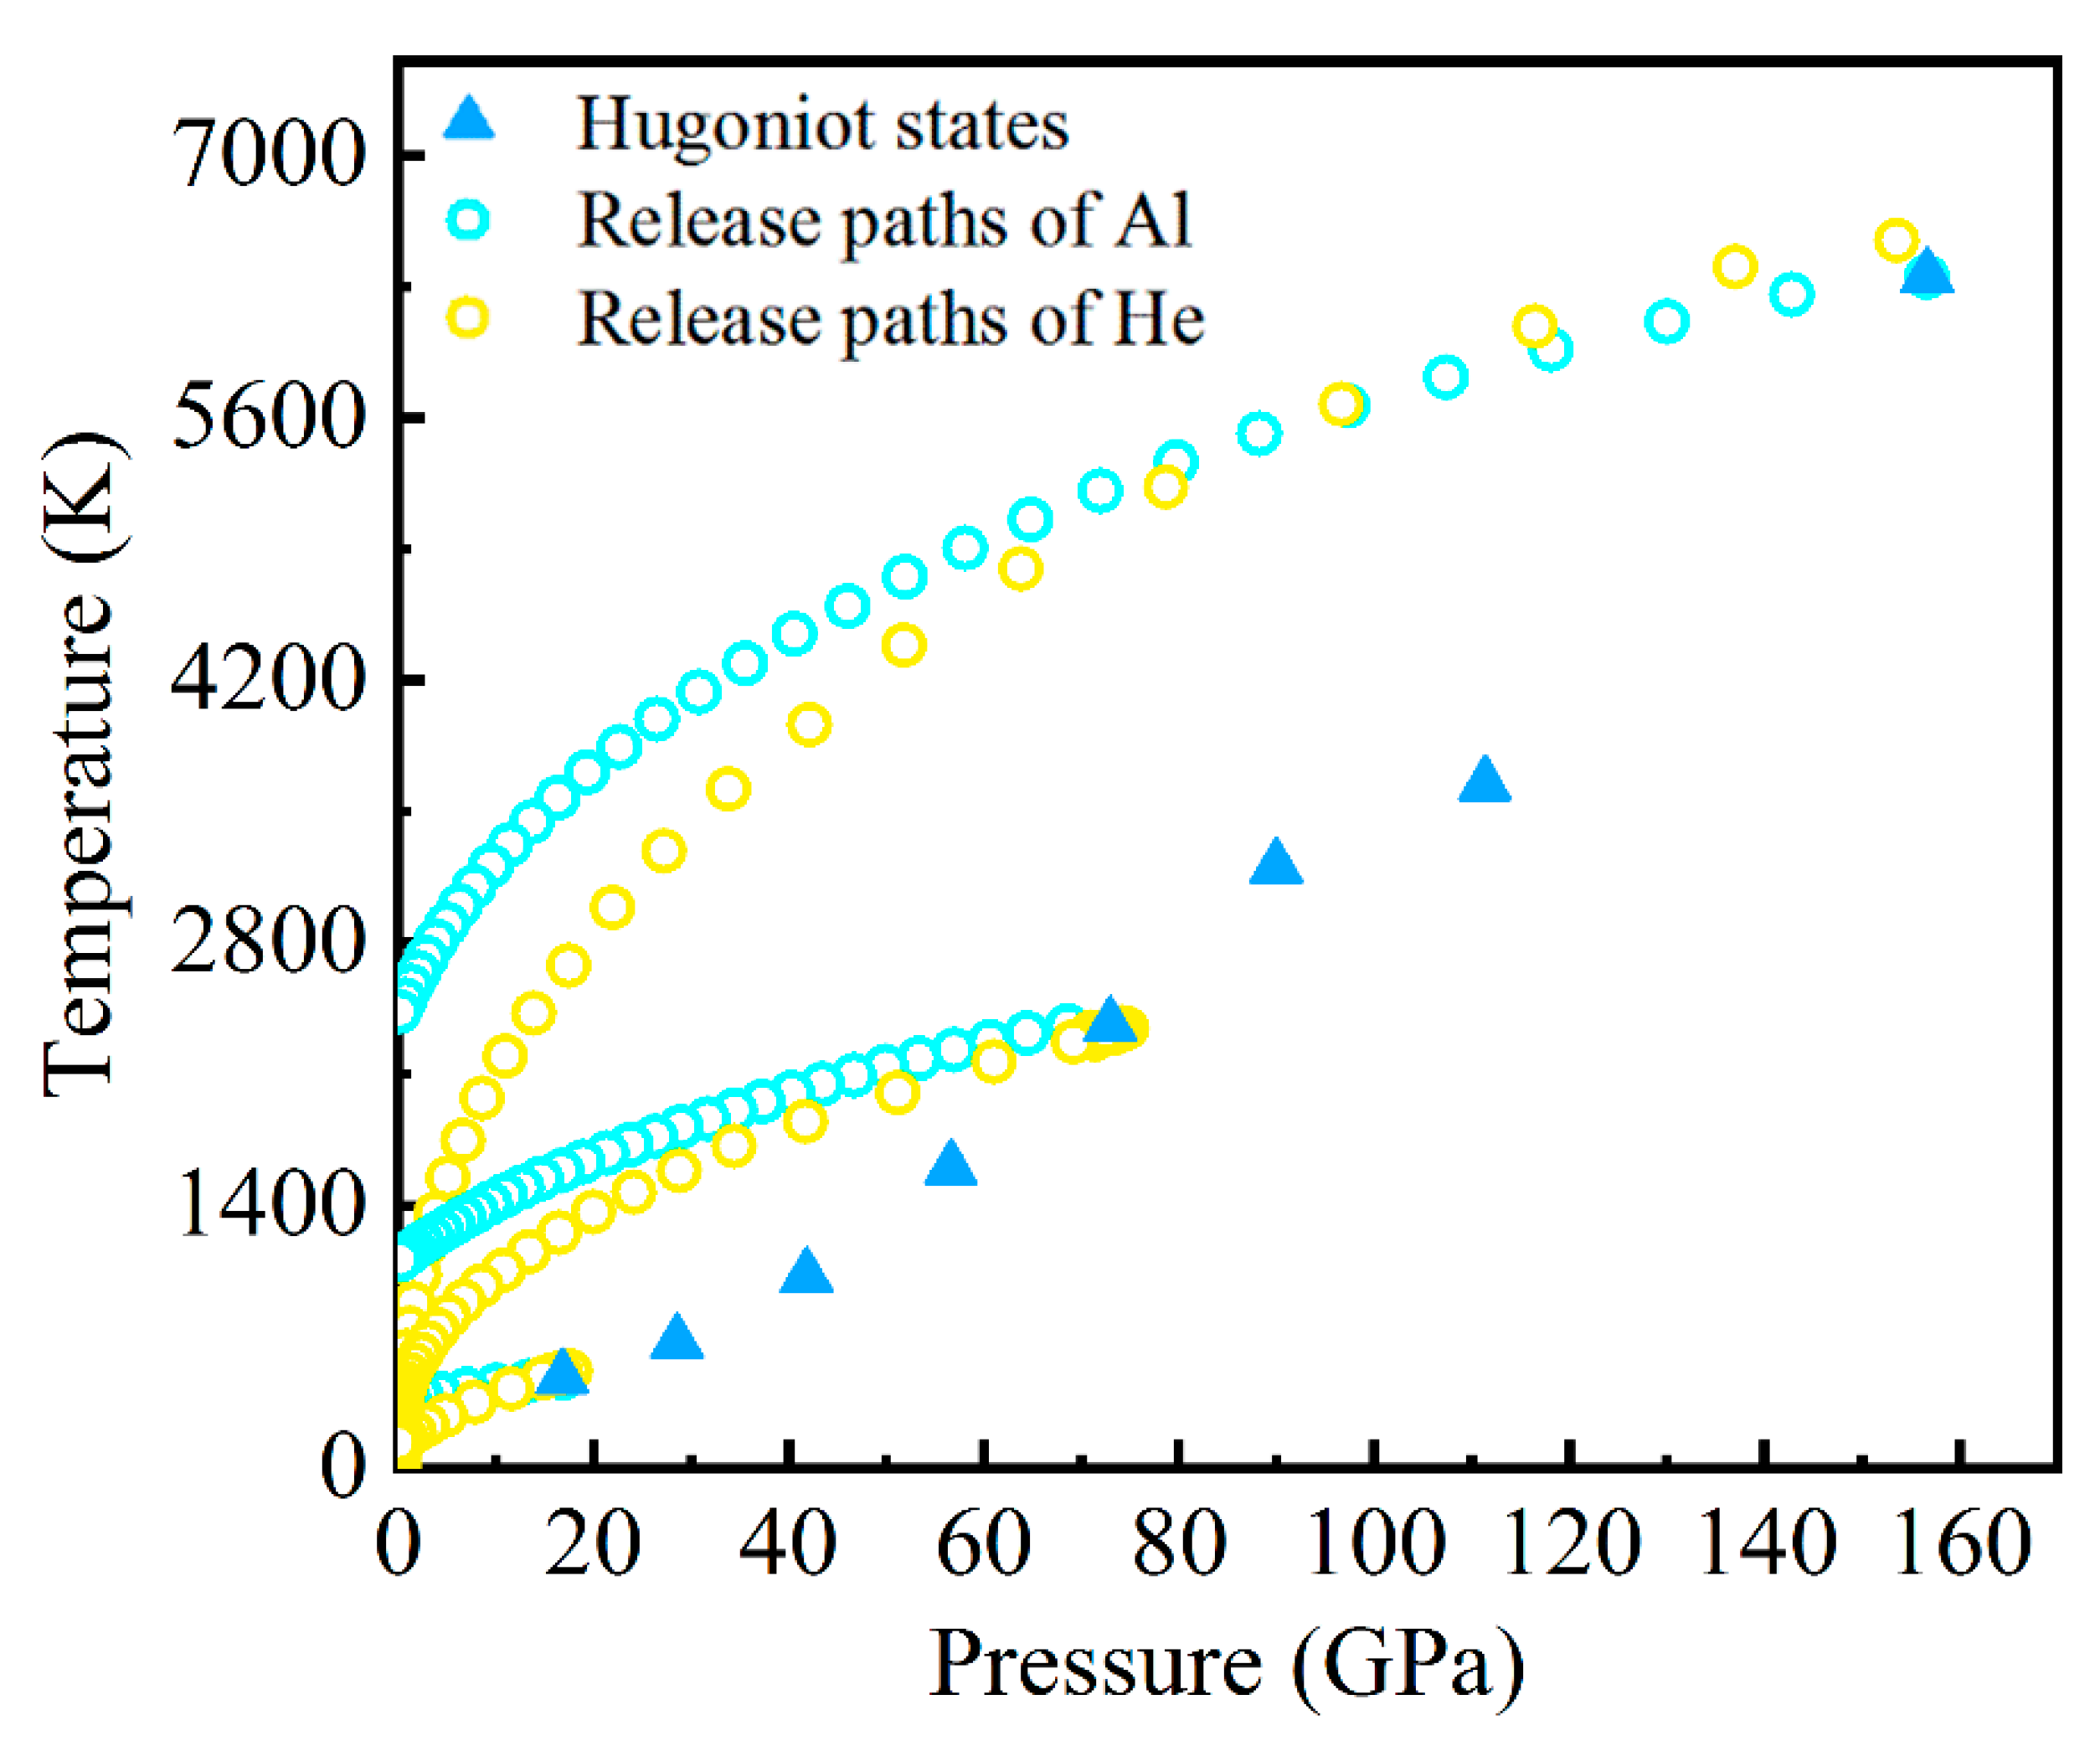
In Figure 2, we present the simulated T-P Hugoniot (solid triangles) and some typical release paths (hollow circles). According to the melting line of Al [38], the release melting occurs at the shock pressure of approximately 72 GPa, and the complete shock melting appears while the shock pressure is more than 90 GPa. Note that for the shocked solid state, the occurrence of local release melting is due to the local hot spot effect of the He bubble. In other words, the bubble expansion process may be accompanied by local melting. On the release paths, the temperature of the He bubble is found to decrease faster than that of the Al matrix. Thus, the additional relaxation time is required for He bubble to absorb the heat of metal to reach the final thermal equilibrium.

3.2. Growth of He Bubbles

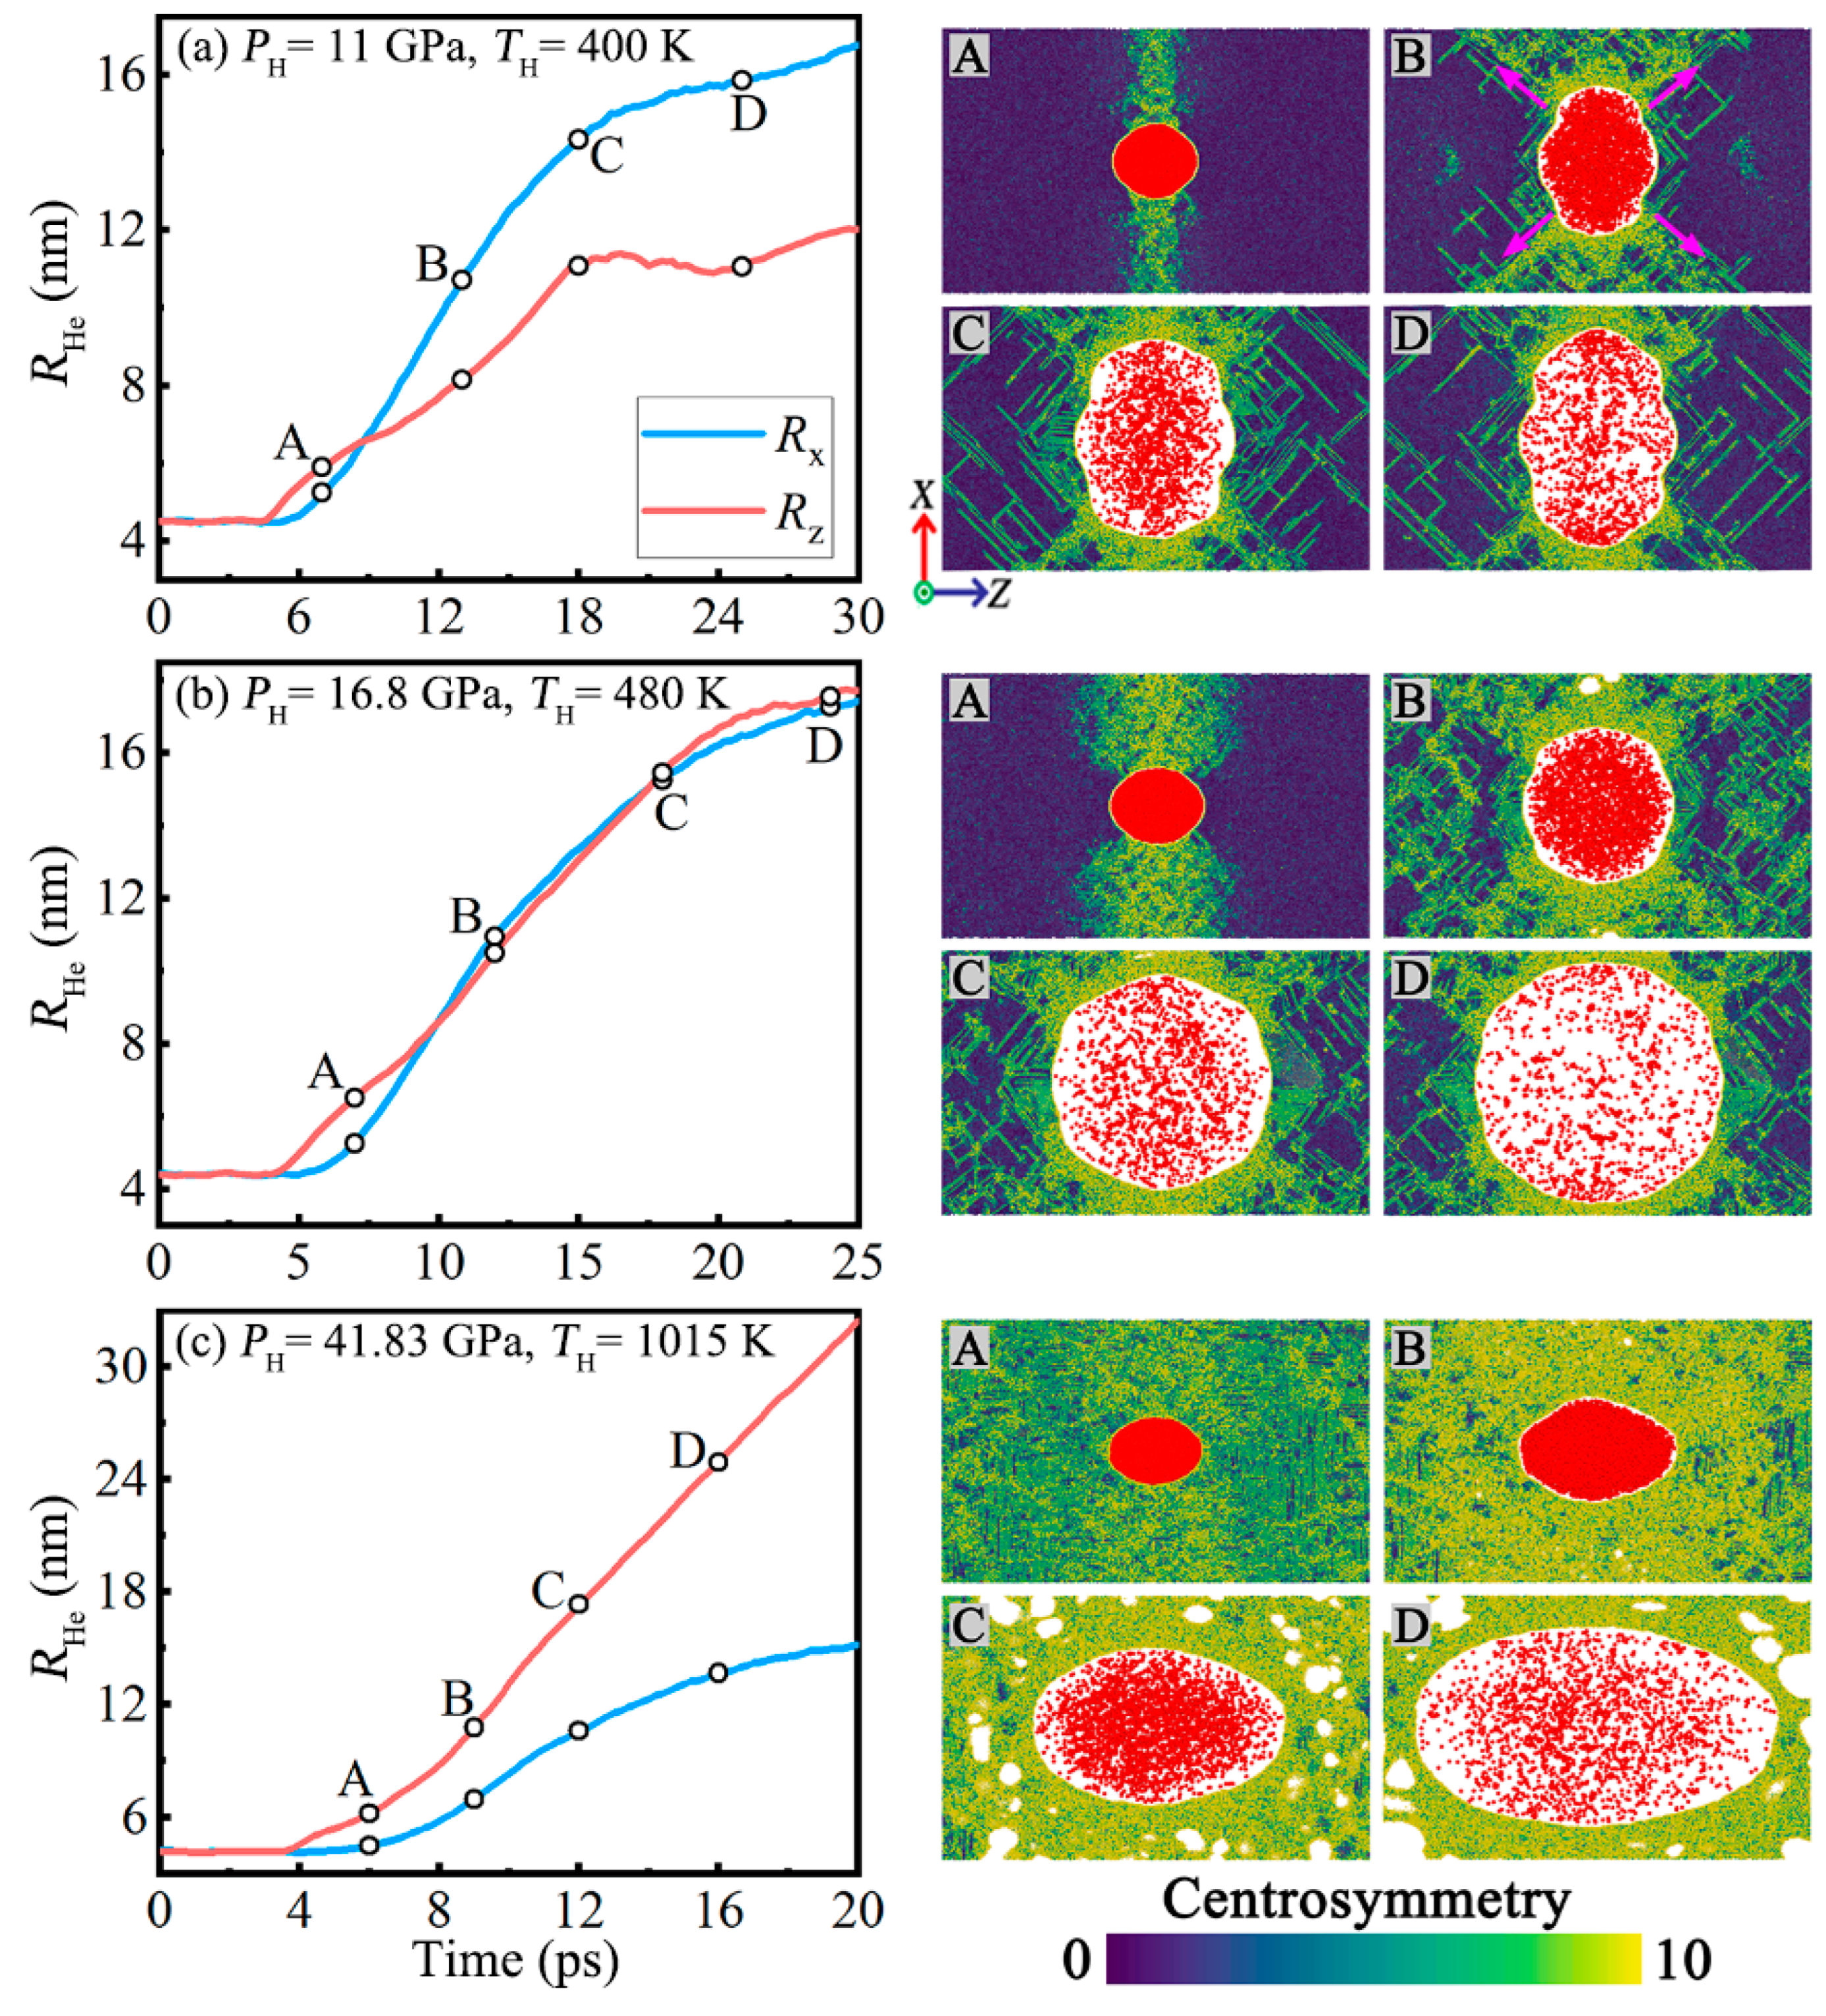
First of all, the bubble radius for three typical Hugoniot states are presented in Figure 3a–c. The three cases are PH = 11 GPa, 16.8 GPa, and 41.83 GPa, respectively. For PH = 11 GPa, the radius in the z direction (release direction) is larger than that in the x direction at the beginning of the growth. However, after a very short time, the growth rate of the radius in x direction is significantly larger than that in z direction. Eventually, the He bubble evolves into an ellipsoid with the minor axis in the release direction. For PH = 16.8 GPa, the growth rates of the radius in x and z directions are almost the same. In this Hugoniot state, the He bubble expands uniformly in a near-spherical shape. As the pressure increases to 41.83 GPa, the bubble radius in the z direction becomes longer than that in the x direction, and eventually the He bubble evolves into an ellipsoid with the minor axis in the x direction. Obviously, under a low pressure, the growth of He bubbles is characterized by the transverse expansion; as the pressure increases, the He bubble begins to grow longitudinally along the release direction.
To reveal the growth mechanism of the He bubble during the release process, the corresponding microstructure evolutions of the matrix around the He bubble are displayed in the right figures of Figure 3. The atoms are color-coded by CSP analysis, which helps to measure the local plastic deformation and lattice disorder. For PH = 11 GPa, we can see that the dislocations and stacking faults grow mainly at the low-latitude regions of the He bubble (marked by pink arrows). The growth of these shear loops along the slip direction provides vacancies for the He bubble expansion, which causes the bubble to expand transversely along the x direction. As the pressure increases, other than the plastic slip, the plastic flow of Al matrix is enhanced. With the combined action of plastic slip and disorder, the He bubble expands uniformly in a near-spherical shape under PH = 16.8 GPa. Under a higher pressure (PH = 41.83 GPa), the matrix material around the He bubble is already in a disordered state. The bubble begins to grow longitudinally along the release direction.
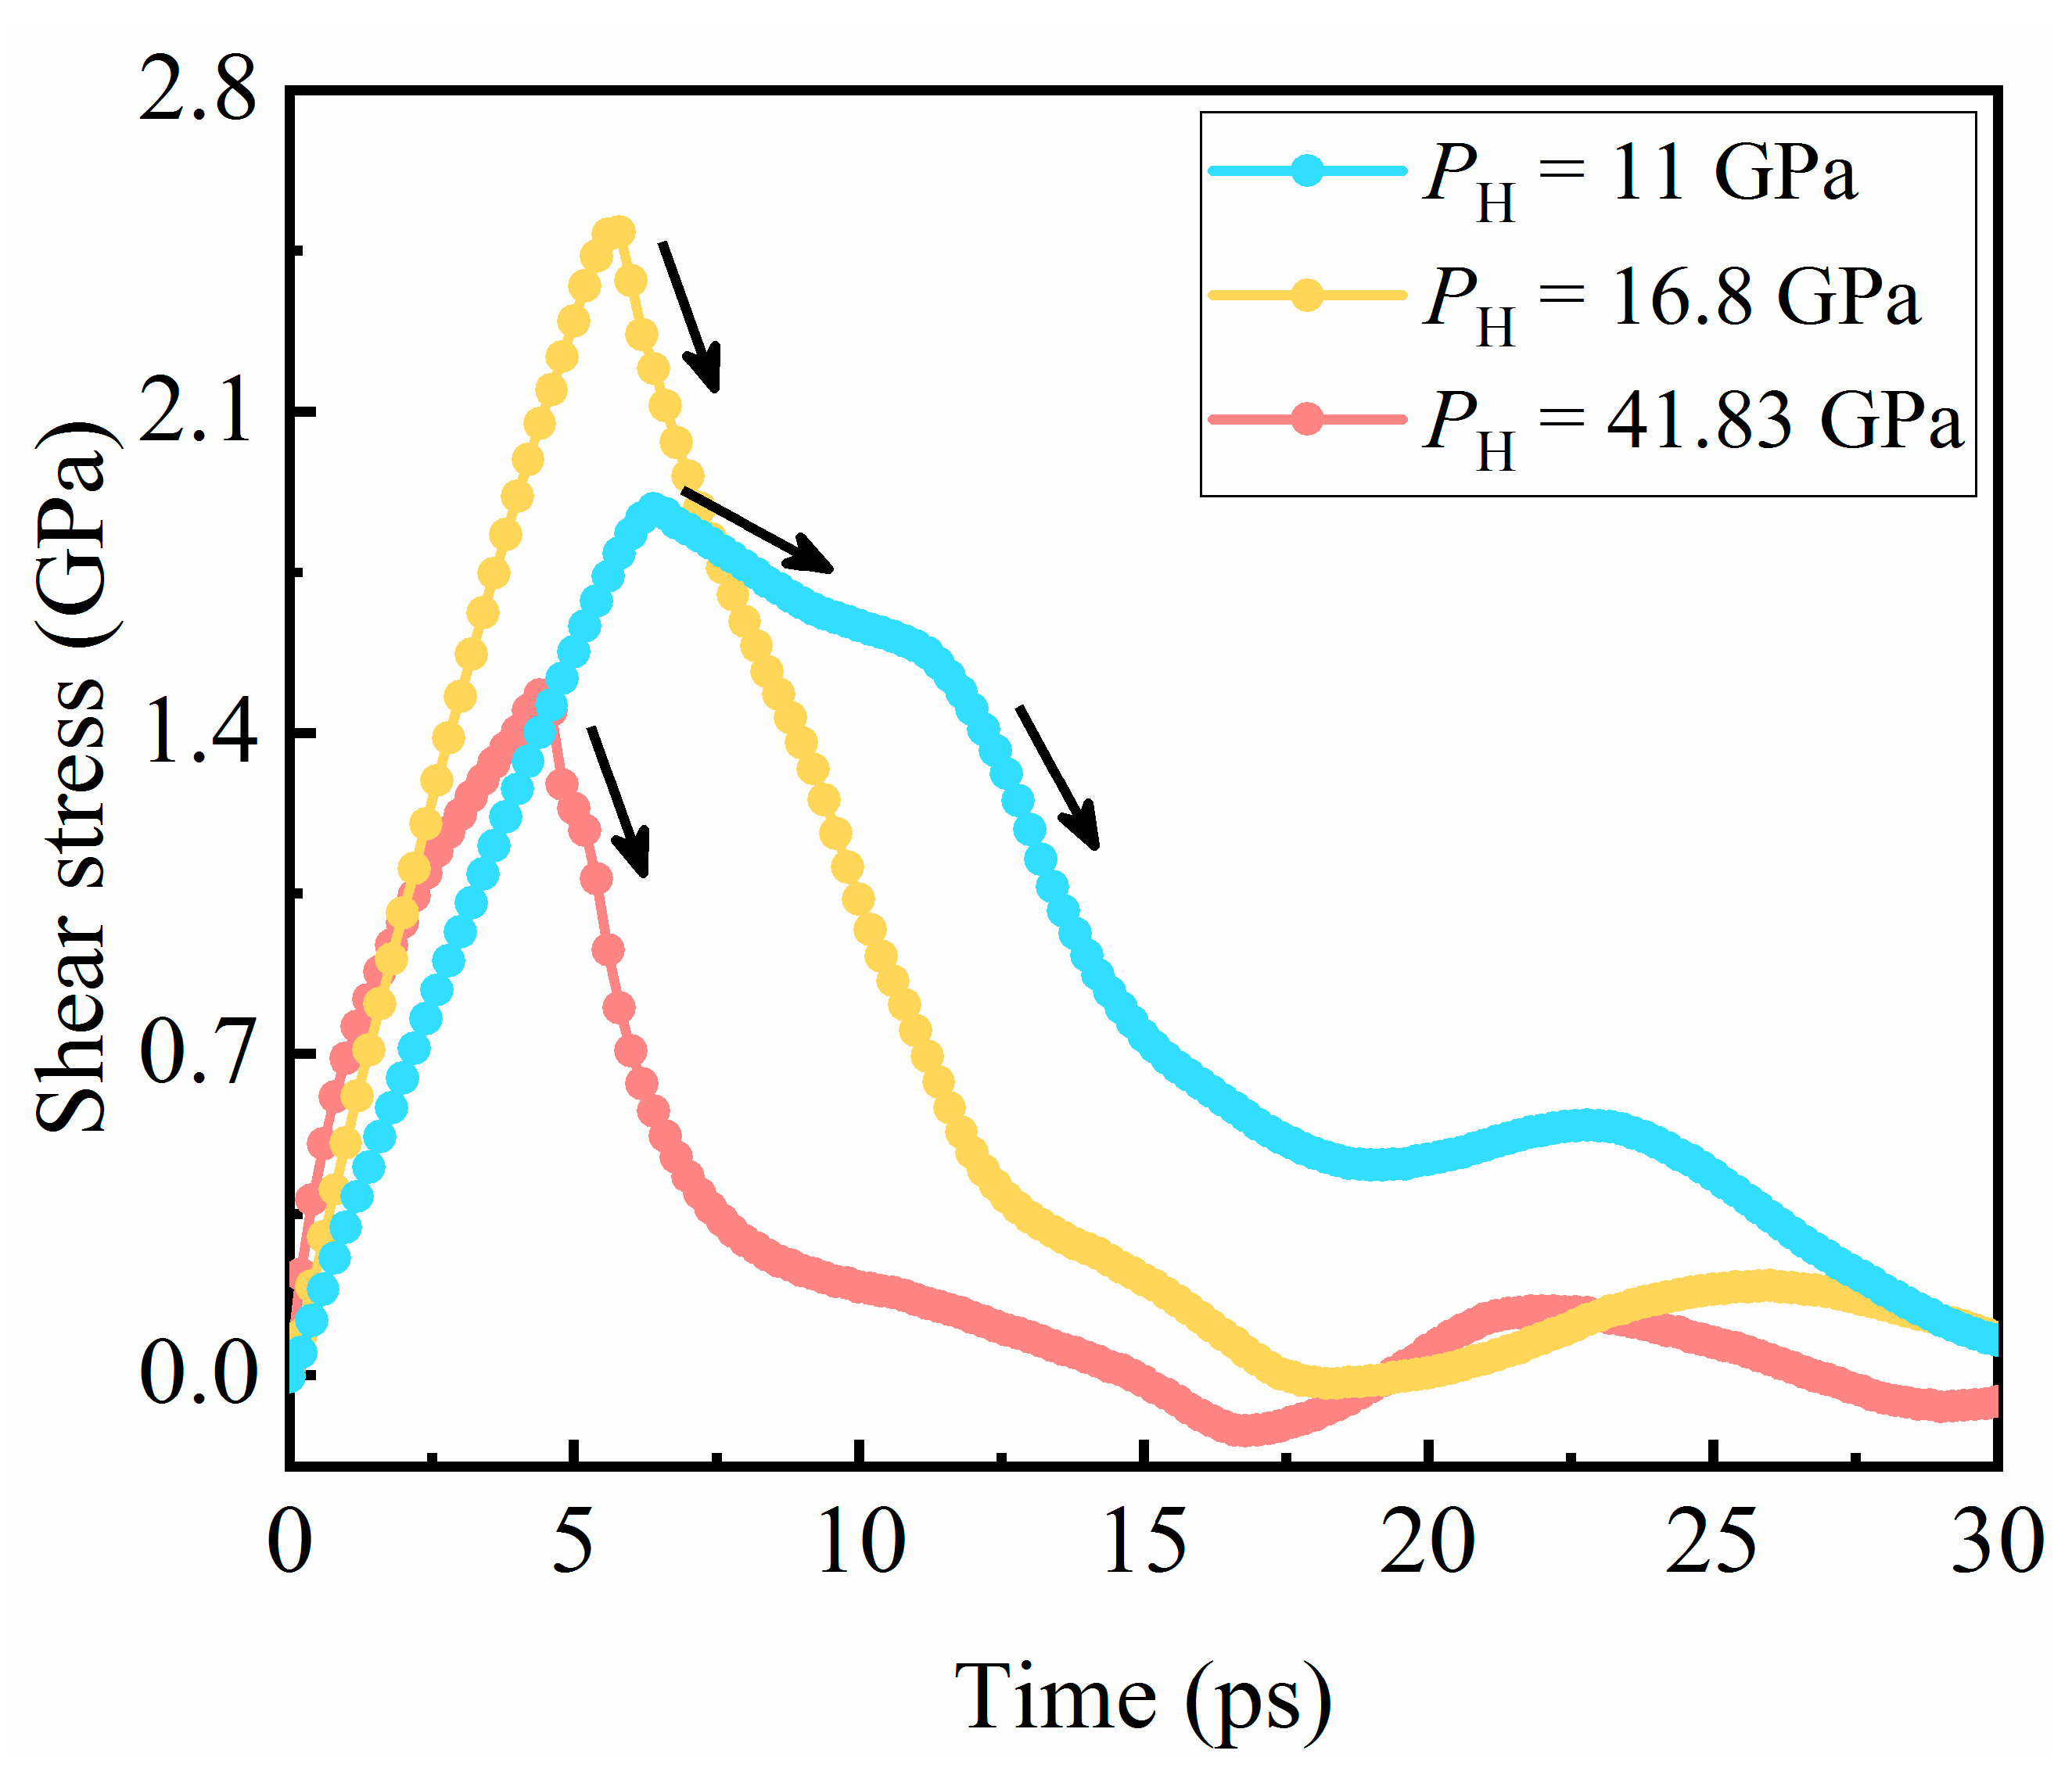
As we all know, the plastic deformation is closely related to the shear stress. Here, the shear stresses for above three typical Hugoniot states were computed and plotted in Figure 4. We use the maximum shear stress for shock simulation analysis [39]
τ s h e a r = 1 2 [ P Z Z 1 2 ( P x x + P Y Y ) ]
where Pxx, Pyy, and Pzz are the normal compressive stresses along the x, y, and z directions. As shown in Figure 4, the shear stress first increases and then decreases during the release process. It should be noted that with the increasing of pressure, the peak value of shear stress would not increase monotonically, and the subsequent stress decay also shows different evolution characteristics. For PH = 11 GPa, after reaching the peak value of 1.9 GPa, the shear stress first slowly linear decreases (7–12 ps) and then enters a rapid decay stage. While for PH = 16.8 GPa, the shear stress continues to increase to 2.5 GPa, but directly enters the rapid decay stage. With further increasing of pressure (PH = 41.8 GPa), due to temperature softening of the yield strength, the peak value of shear stress decreases to only 1.5 GPa, and in the subsequent process the shear stress also decreases rapidly. This explains the transition of the He bubble from the transverse expansion to the longitudinal elongation as the pressure increases.
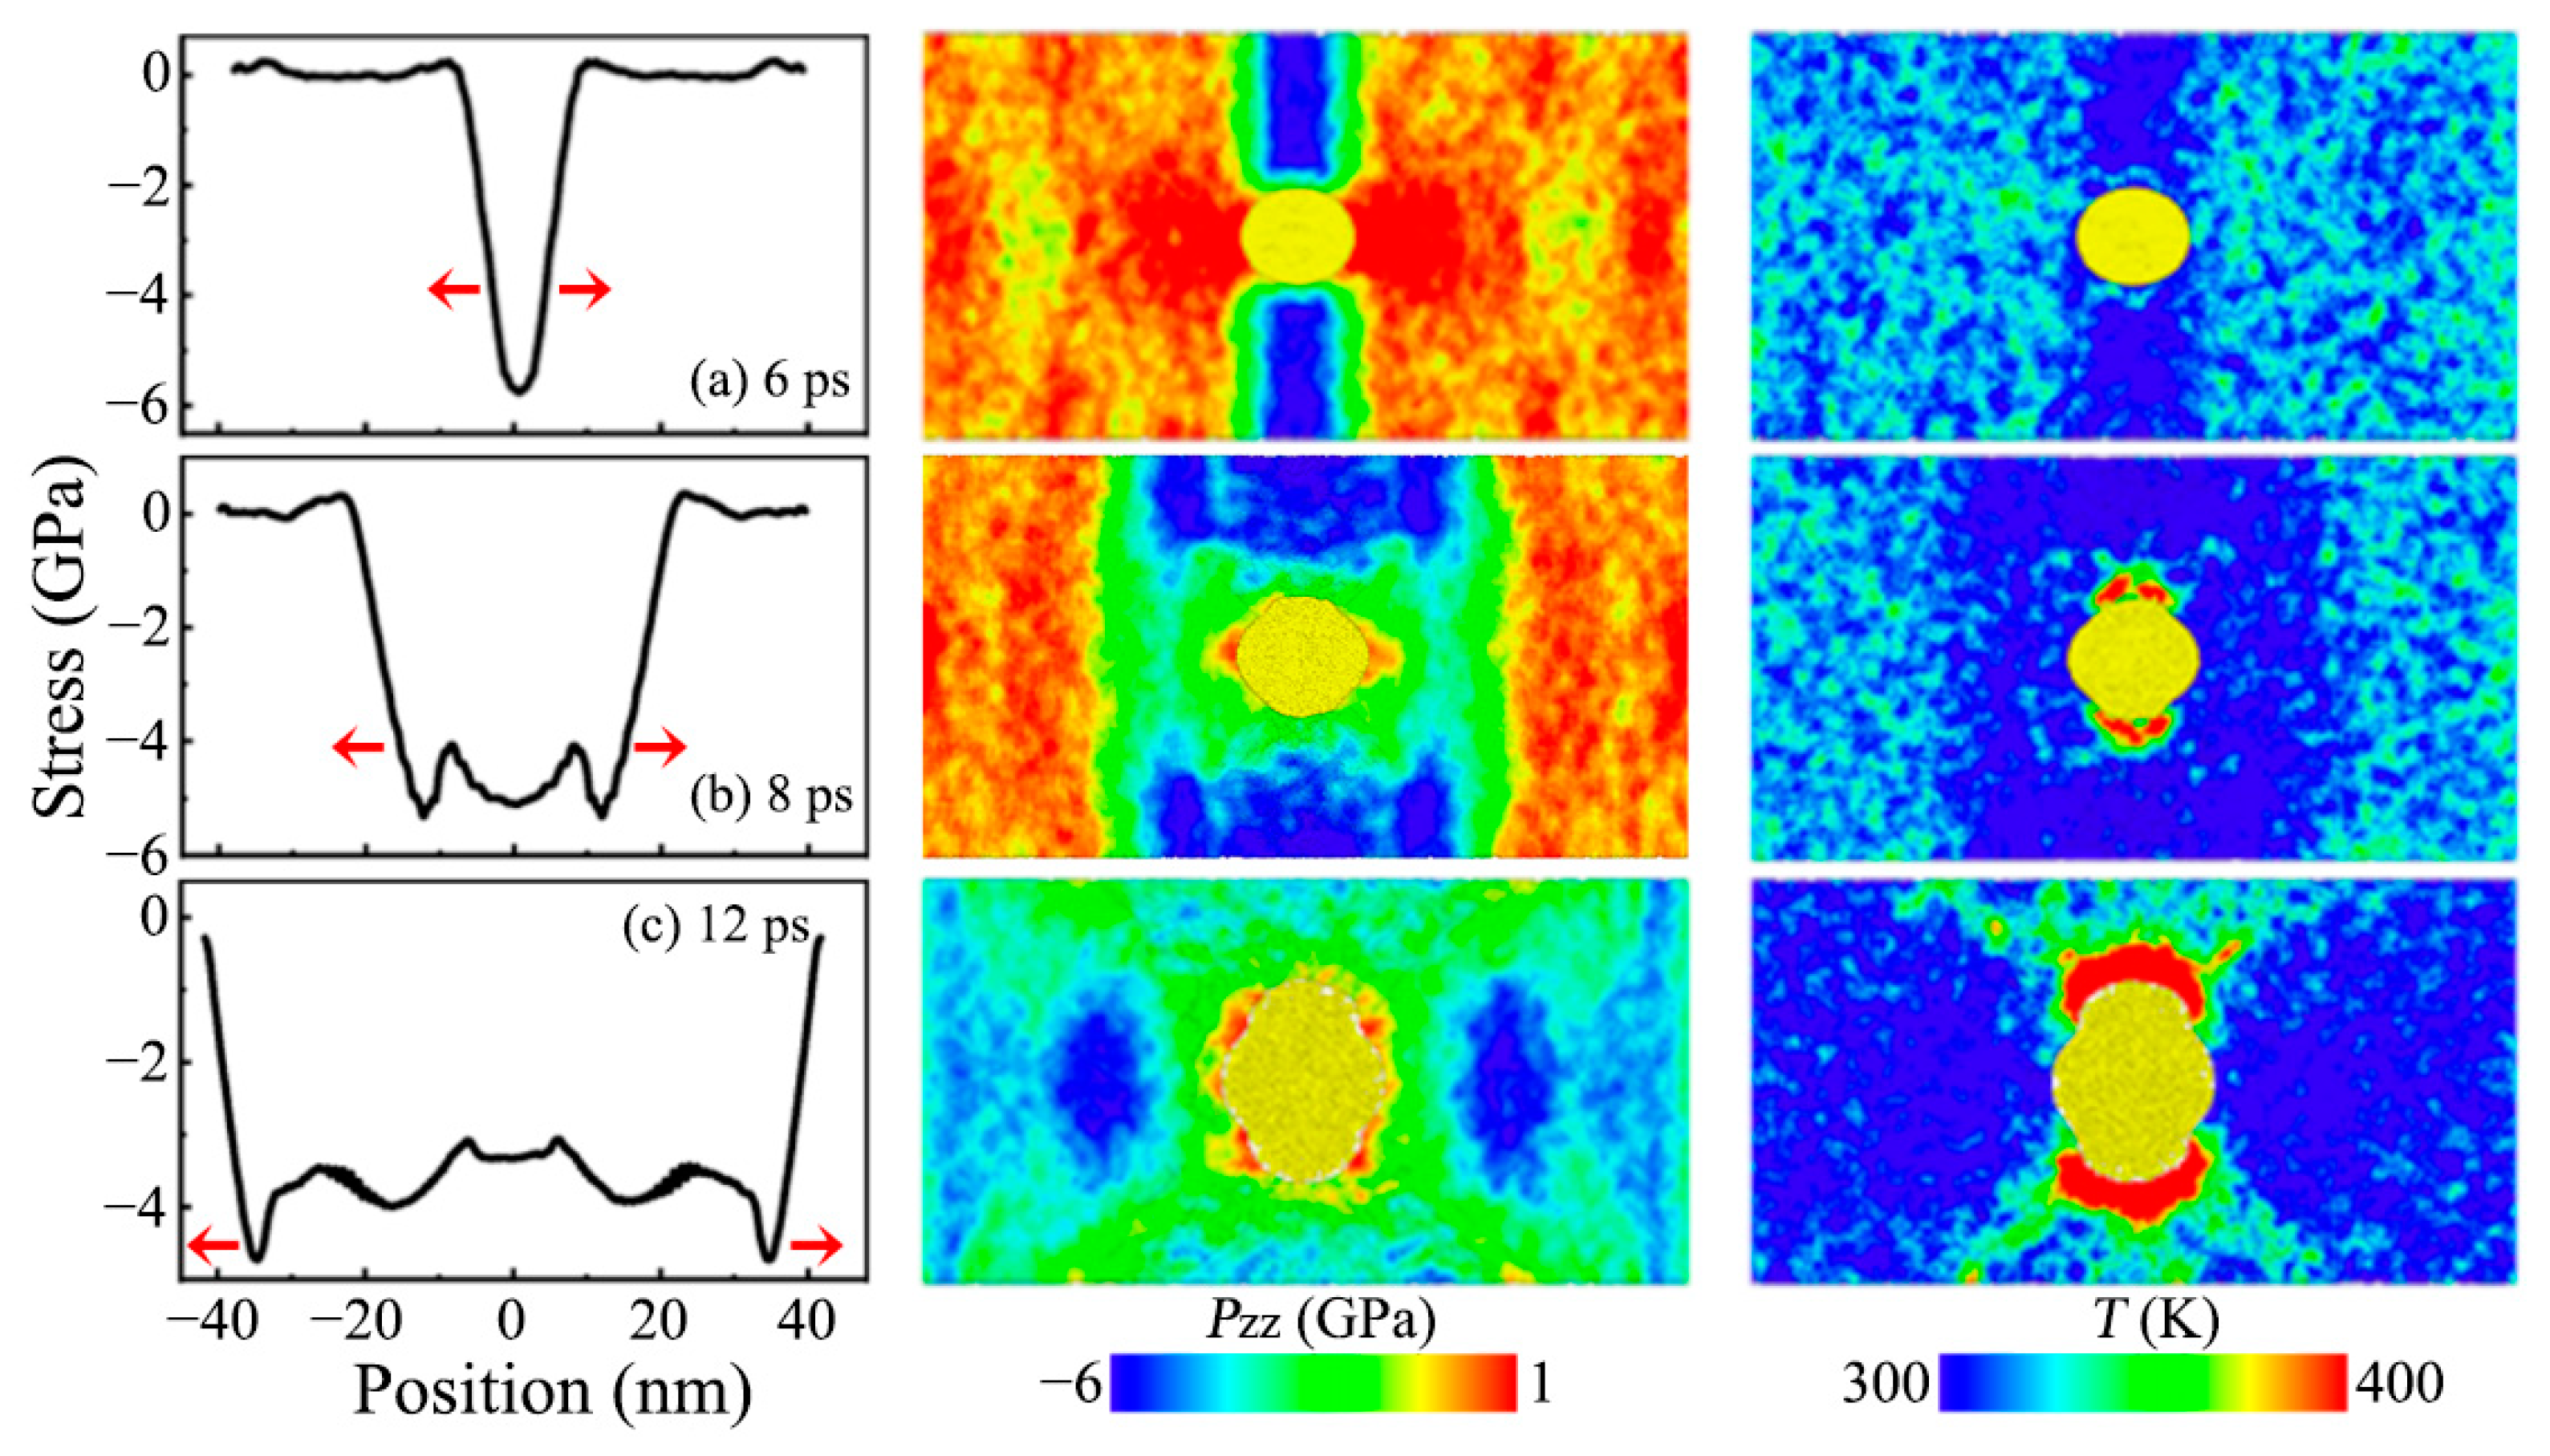
Furthermore, the normal stress and temperature distributions are plotted to give more clues. Two typical Hugoniot states, PH = 11 GPa (Figure 5) and 41.83 GPa (Figure 6), are considered. As shown in Figure 5a–c and Figure 6a–c, two rarefaction waves (from the two-sided free surfaces) propagate toward each other and encounter to form a tensile region. When the tensile stress is high enough, the spall damage of the material occurs, and in the subsequent time evolution, the stress in the damaged area decreases continuously. Note that with the increasing of pressure, the maximum tensile stress becomes smaller and the subsequent stress in the damaged area decays faster, indicating that the spall damage and the void evolution are significantly different for different Hugoniot states. Zhou et al. [28] explained that the difference in the evolution shape of the He bubble is related to the compression wave. Here, the tensile stress and the temperature for the three Hugoniot states are discussed in detail. For PH = 11 GPa, there is an obvious temperature rise effect at the low-latitude regions where plastic deformation occurs, while for PH = 41.83 GPa, the temperature around the He bubble rises significantly. The local temperature rise softens the material in this region, making it more prone to deformation. It should be pointed out the red regions in the temperature distributions is just to highlight the temperature difference around the He bubble.

3.3. Spall Damage and Void Evolution

The spall strength is defined as the maximum tensile stress during the spall process. In our simulations, we find the maximum stress over the sample, that is,
σ s p = M a x [ s t r e s s ( z , t ) ]
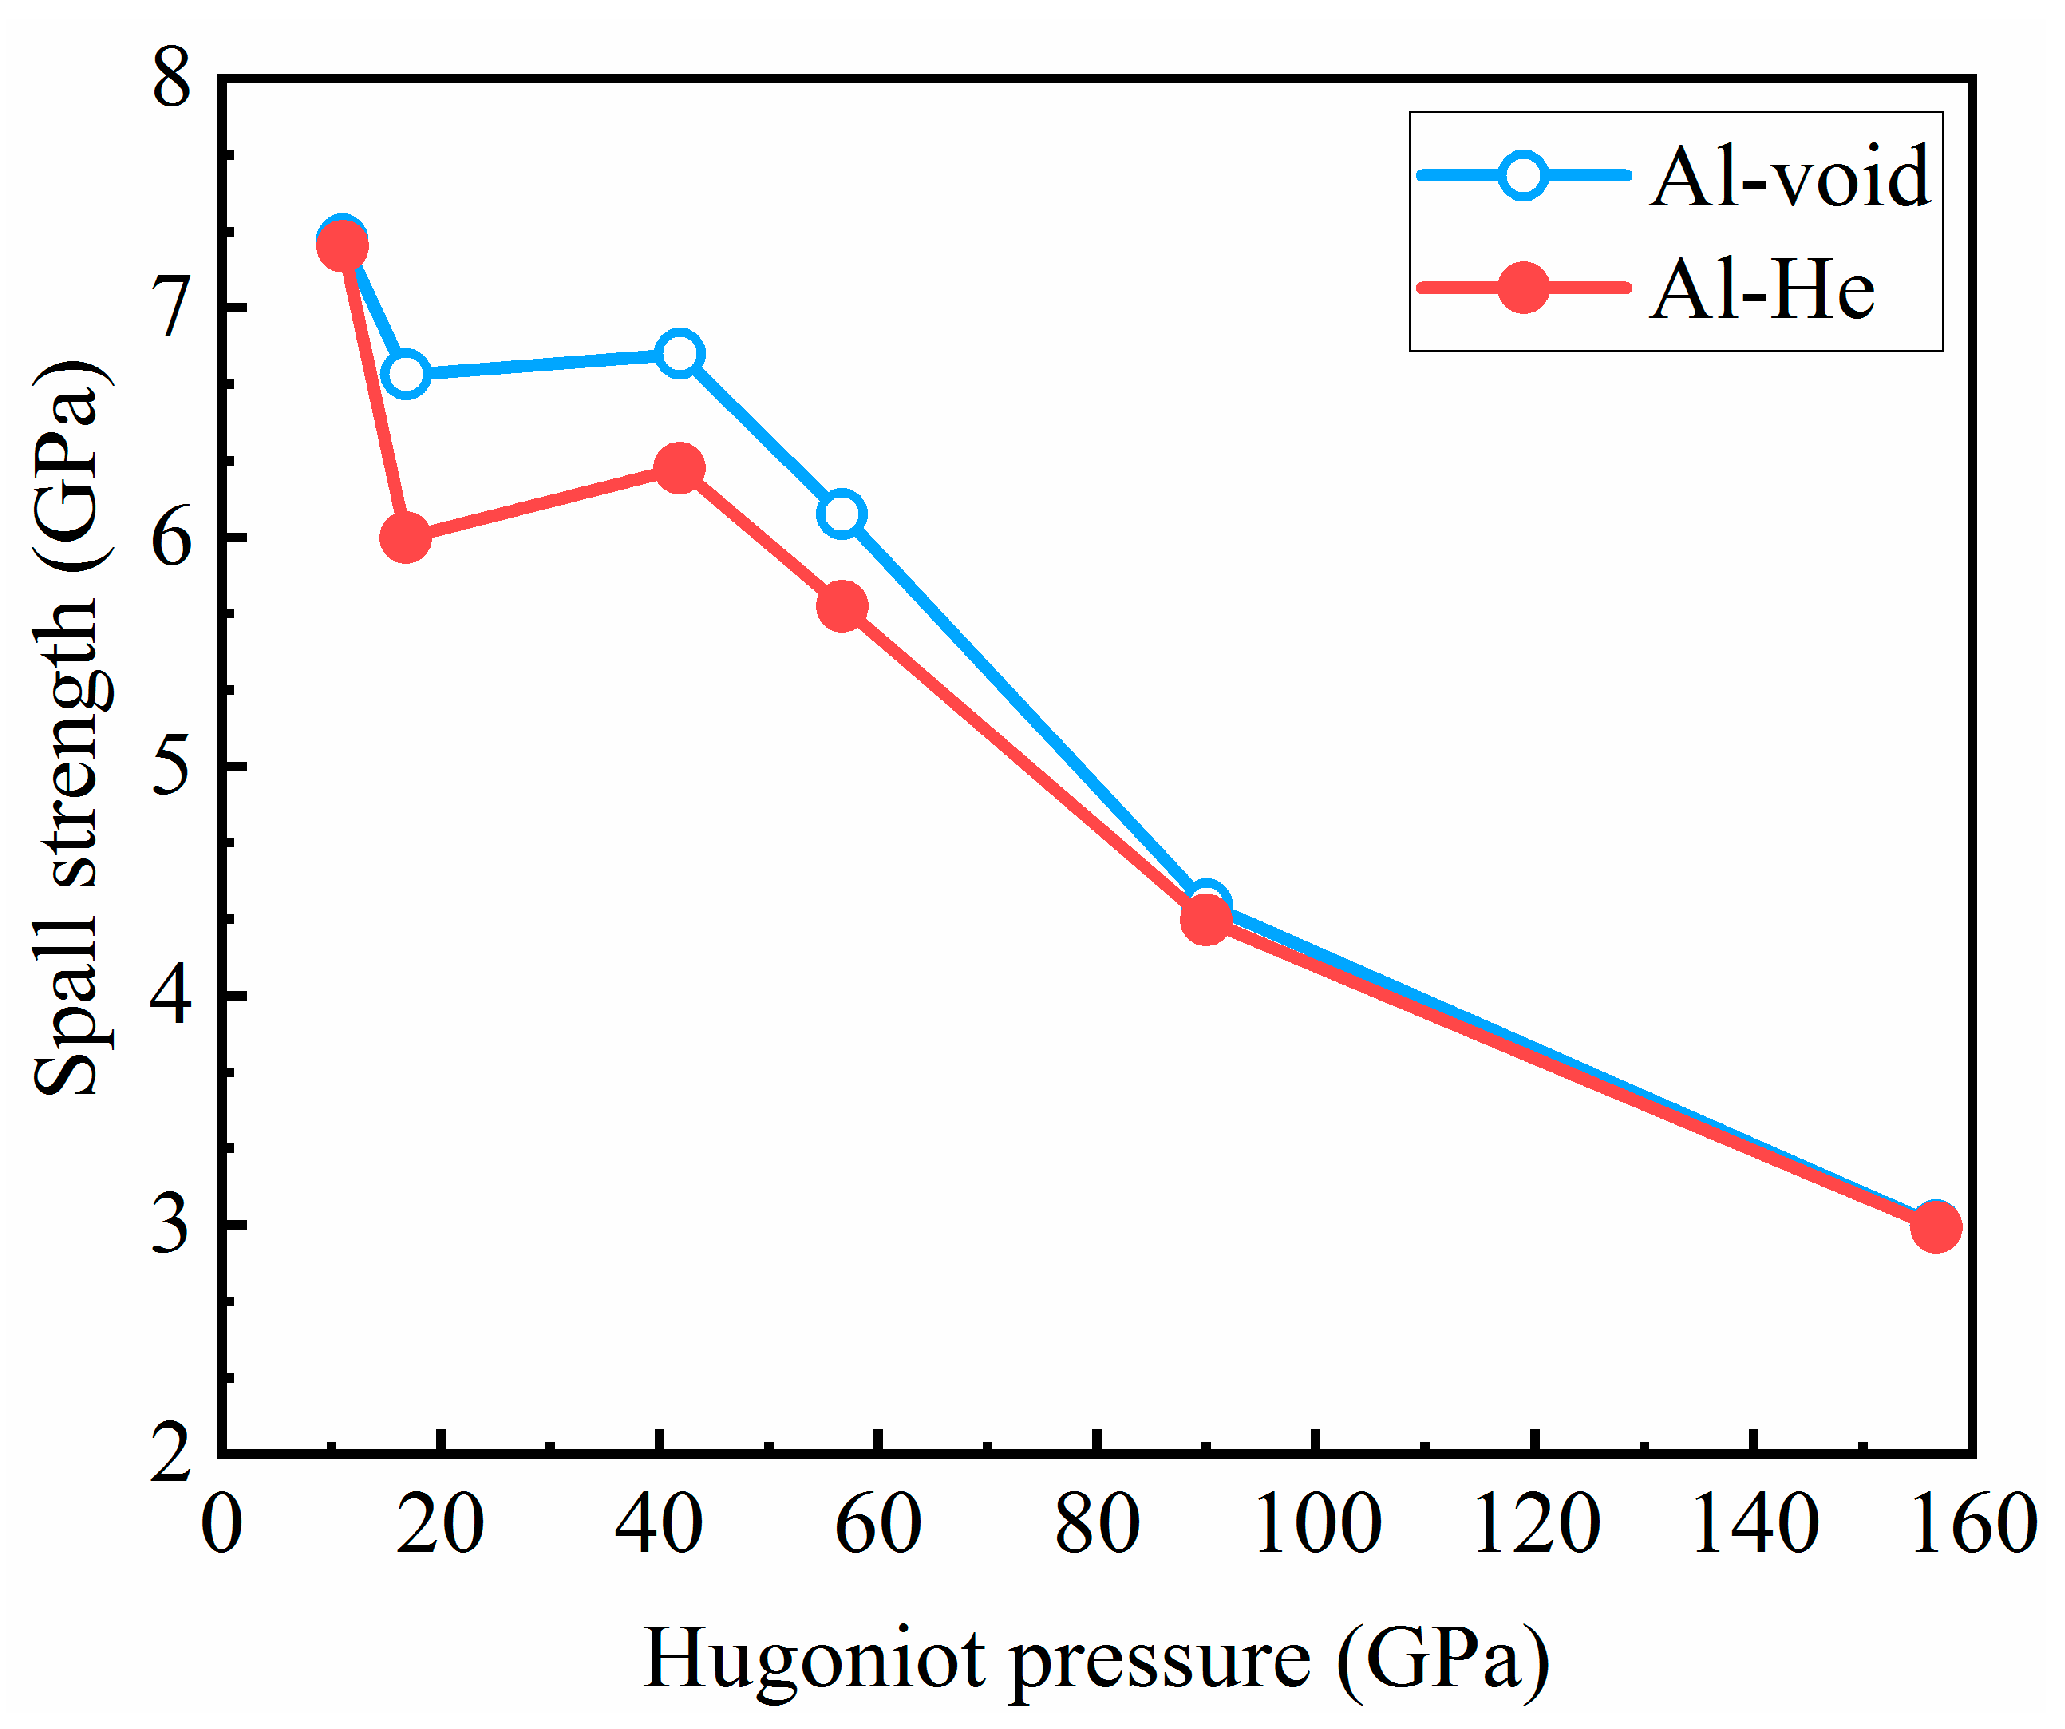
where stress (z,t) is the stress of the material point z at time t. To study the effect of the He bubble on the spall damage, Figure 7 displays the spall strength (σsp) of Al–He samples for different Hugoniot states. For comparison, the spall strength of the Al–void sample is also given. With the increasing initial pressure, the spall strength first suddenly decreases from a higher value (~7.3 GPa). Subsequently, the spall strength starts to increase to a second peak and decreases again. That shows an evident dependence on the shock-induced microstructure [40]. In the case of elastic deformation during shock compression (PH = 11 GPa), the sample remains to be an ideal crystal during the release process. In this case, a very high tensile stress is required to lead to massive nucleation of dislocations. With the increasing of shock intensity (PH = 16.8 GPa), the dislocations and stacking faults formed during the shock compression process did not completely disappear. Once the release occurs, the nanovoids nucleate heterogeneously in the region of these residual dislocation and stacking faults, which leads to a sudden decrease in spall strength. As the pressure further increases, the plastic slip will decrease and the temperature softening effect begins to play a role. After the matrix is melted (~90 GPa), the spall strength shows a relative slow reduction with the initial Hugoniot pressure.
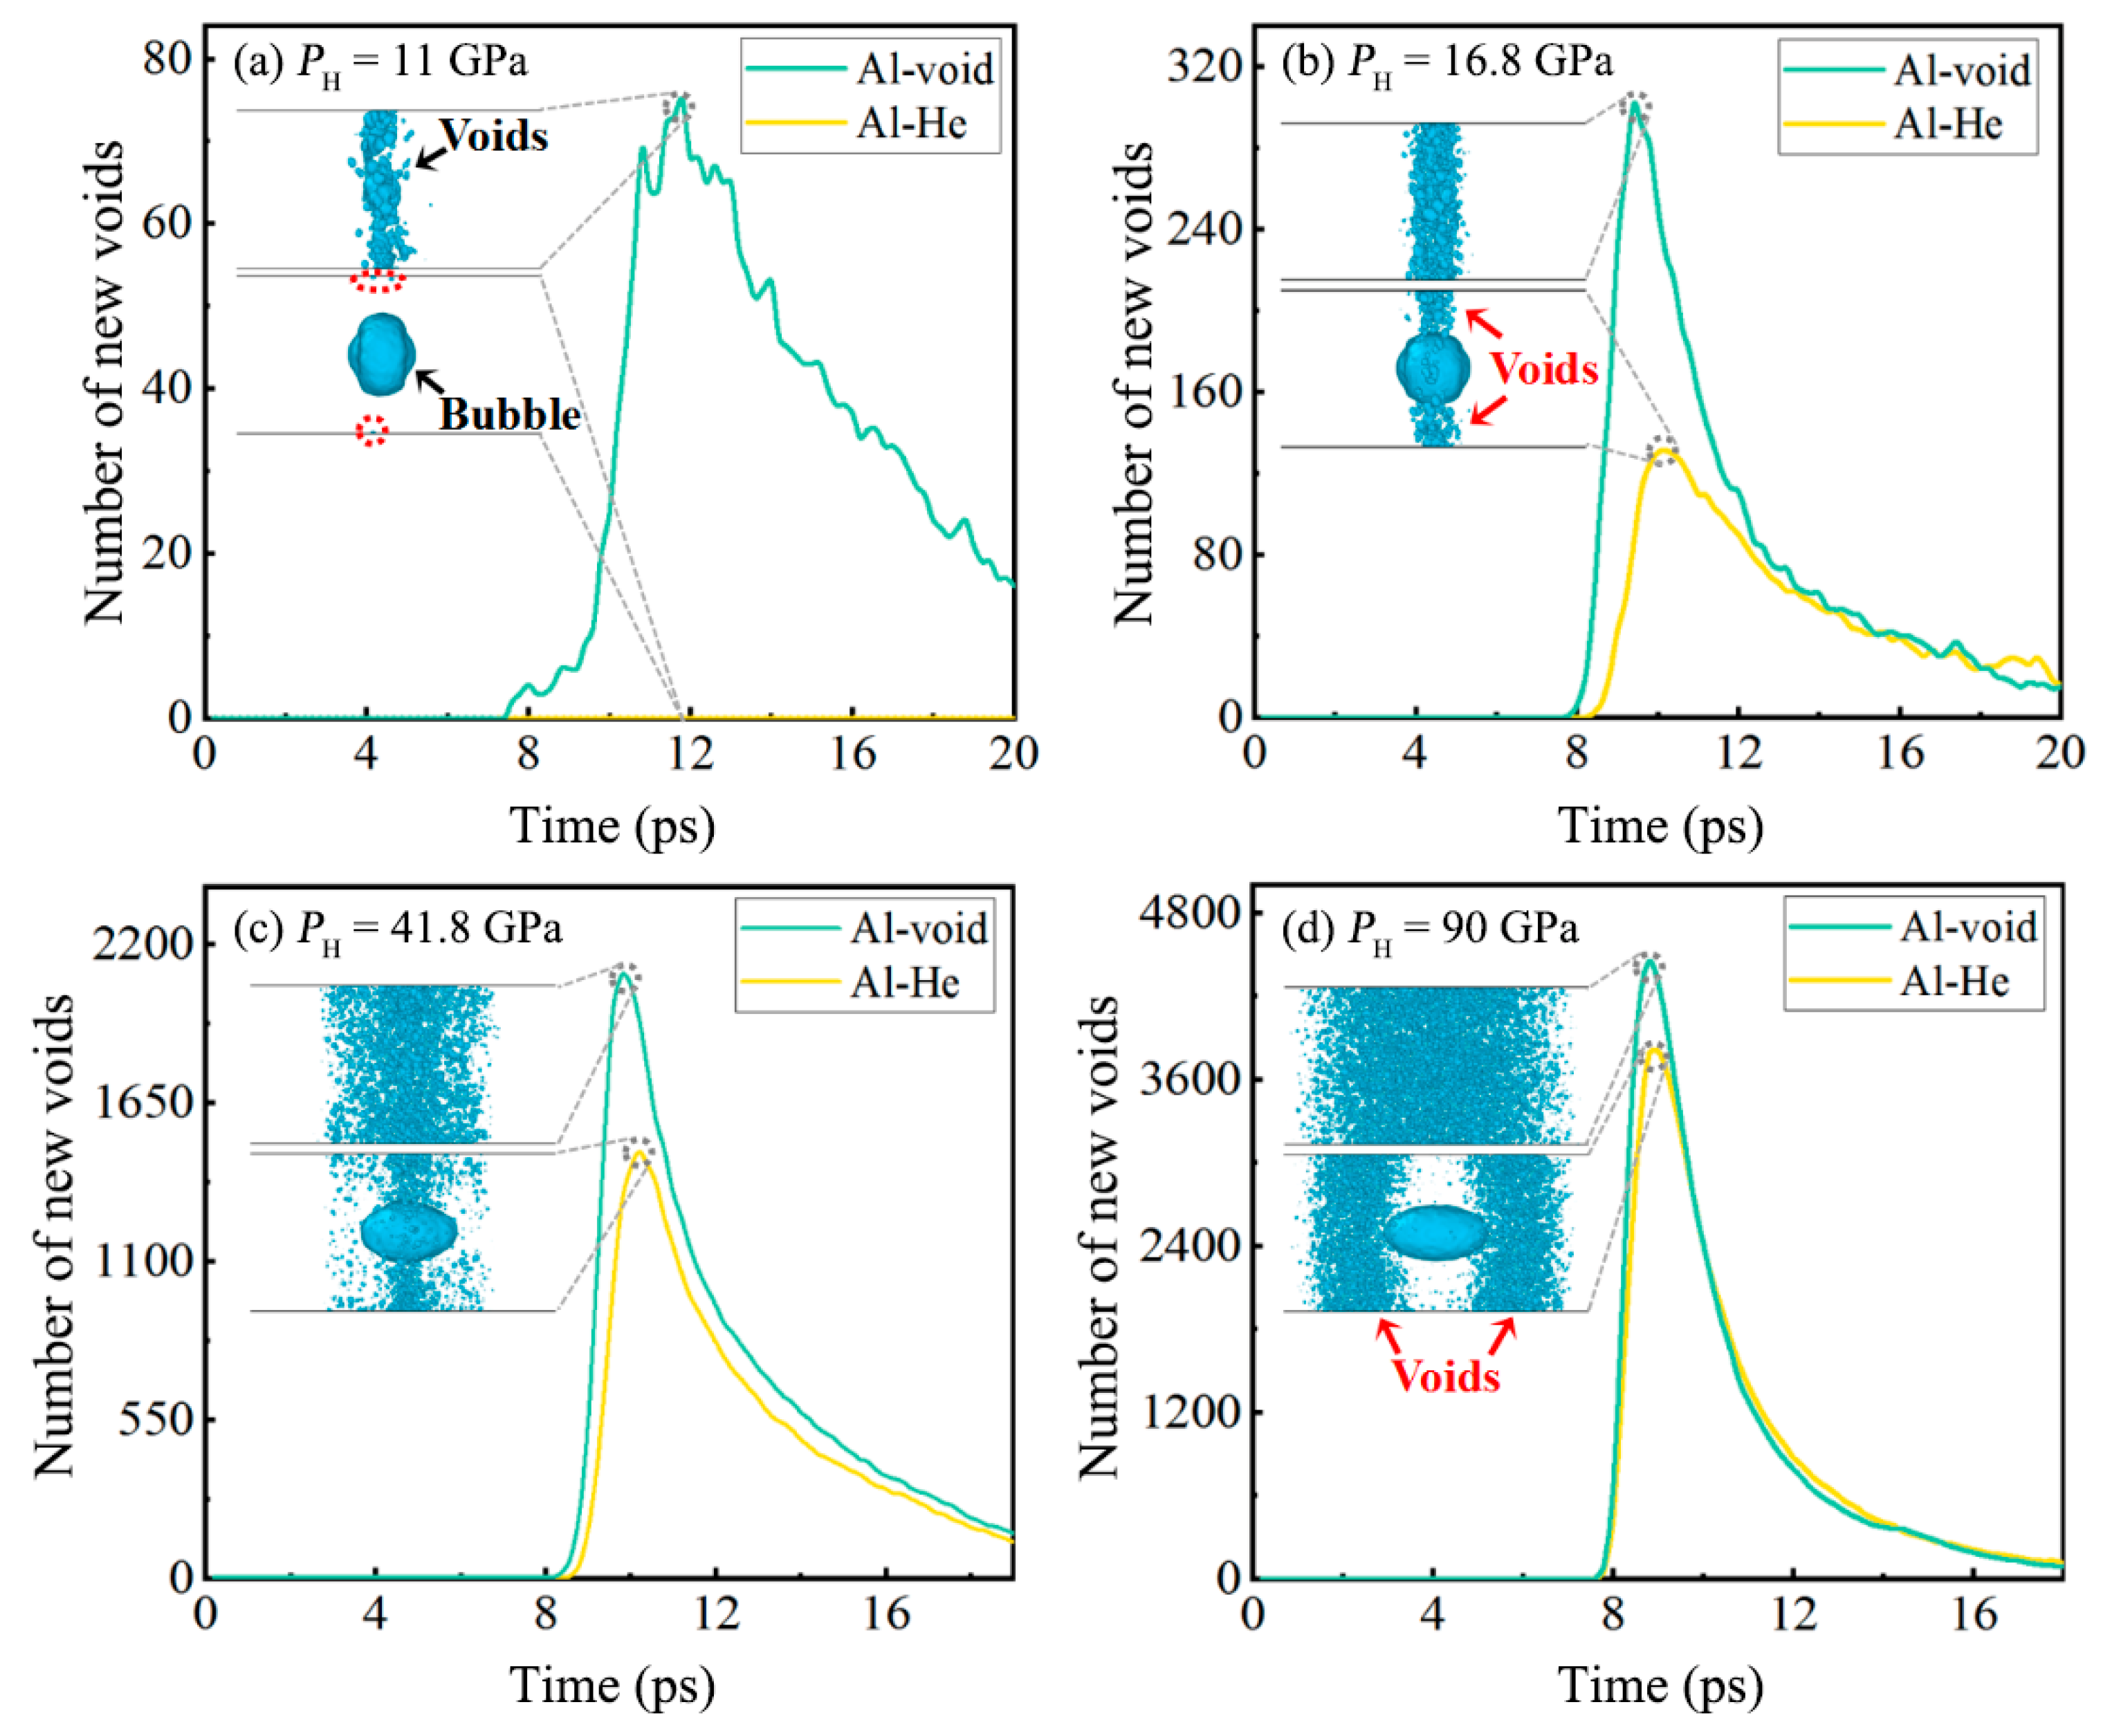
Obviously, it can be seen from Figure 7 that the presence of the He bubble reduces the spall strength of Al, especially in the weaker regime. However, this effect is gradually negligible as the pressure approaches the shock melting point. These results agree with the previous studies [26,27]. As we all known, the nucleation, growth, and coalescence of voids lead to the dynamic fracture of ductile metals. In order to quantitatively analyze the influence of the He bubble on the damage evolution, the number of new voids for four typical Hugoniot states are calculated in Figure 8. These four cases are PH = 11 GPa, 16.8 GPa, 41.83 GPa, and 90 GPa, respectively. The number of new voids increases rapidly (void nucleation and growth), and then decreases after reaching its maximum (void coalescence). We find that the number of new voids in the Al–He sample is significantly smaller than that in the Al-void sample. The reduction in the maximum value between the Al–He and Al-void samples becomes closer as the pressure increases (reduction ratios: 99% for 11 GPa, 56% for 16.8 GPa, 29% for 41.83 GPa, and 14.6% for 90 GPa, respectively).
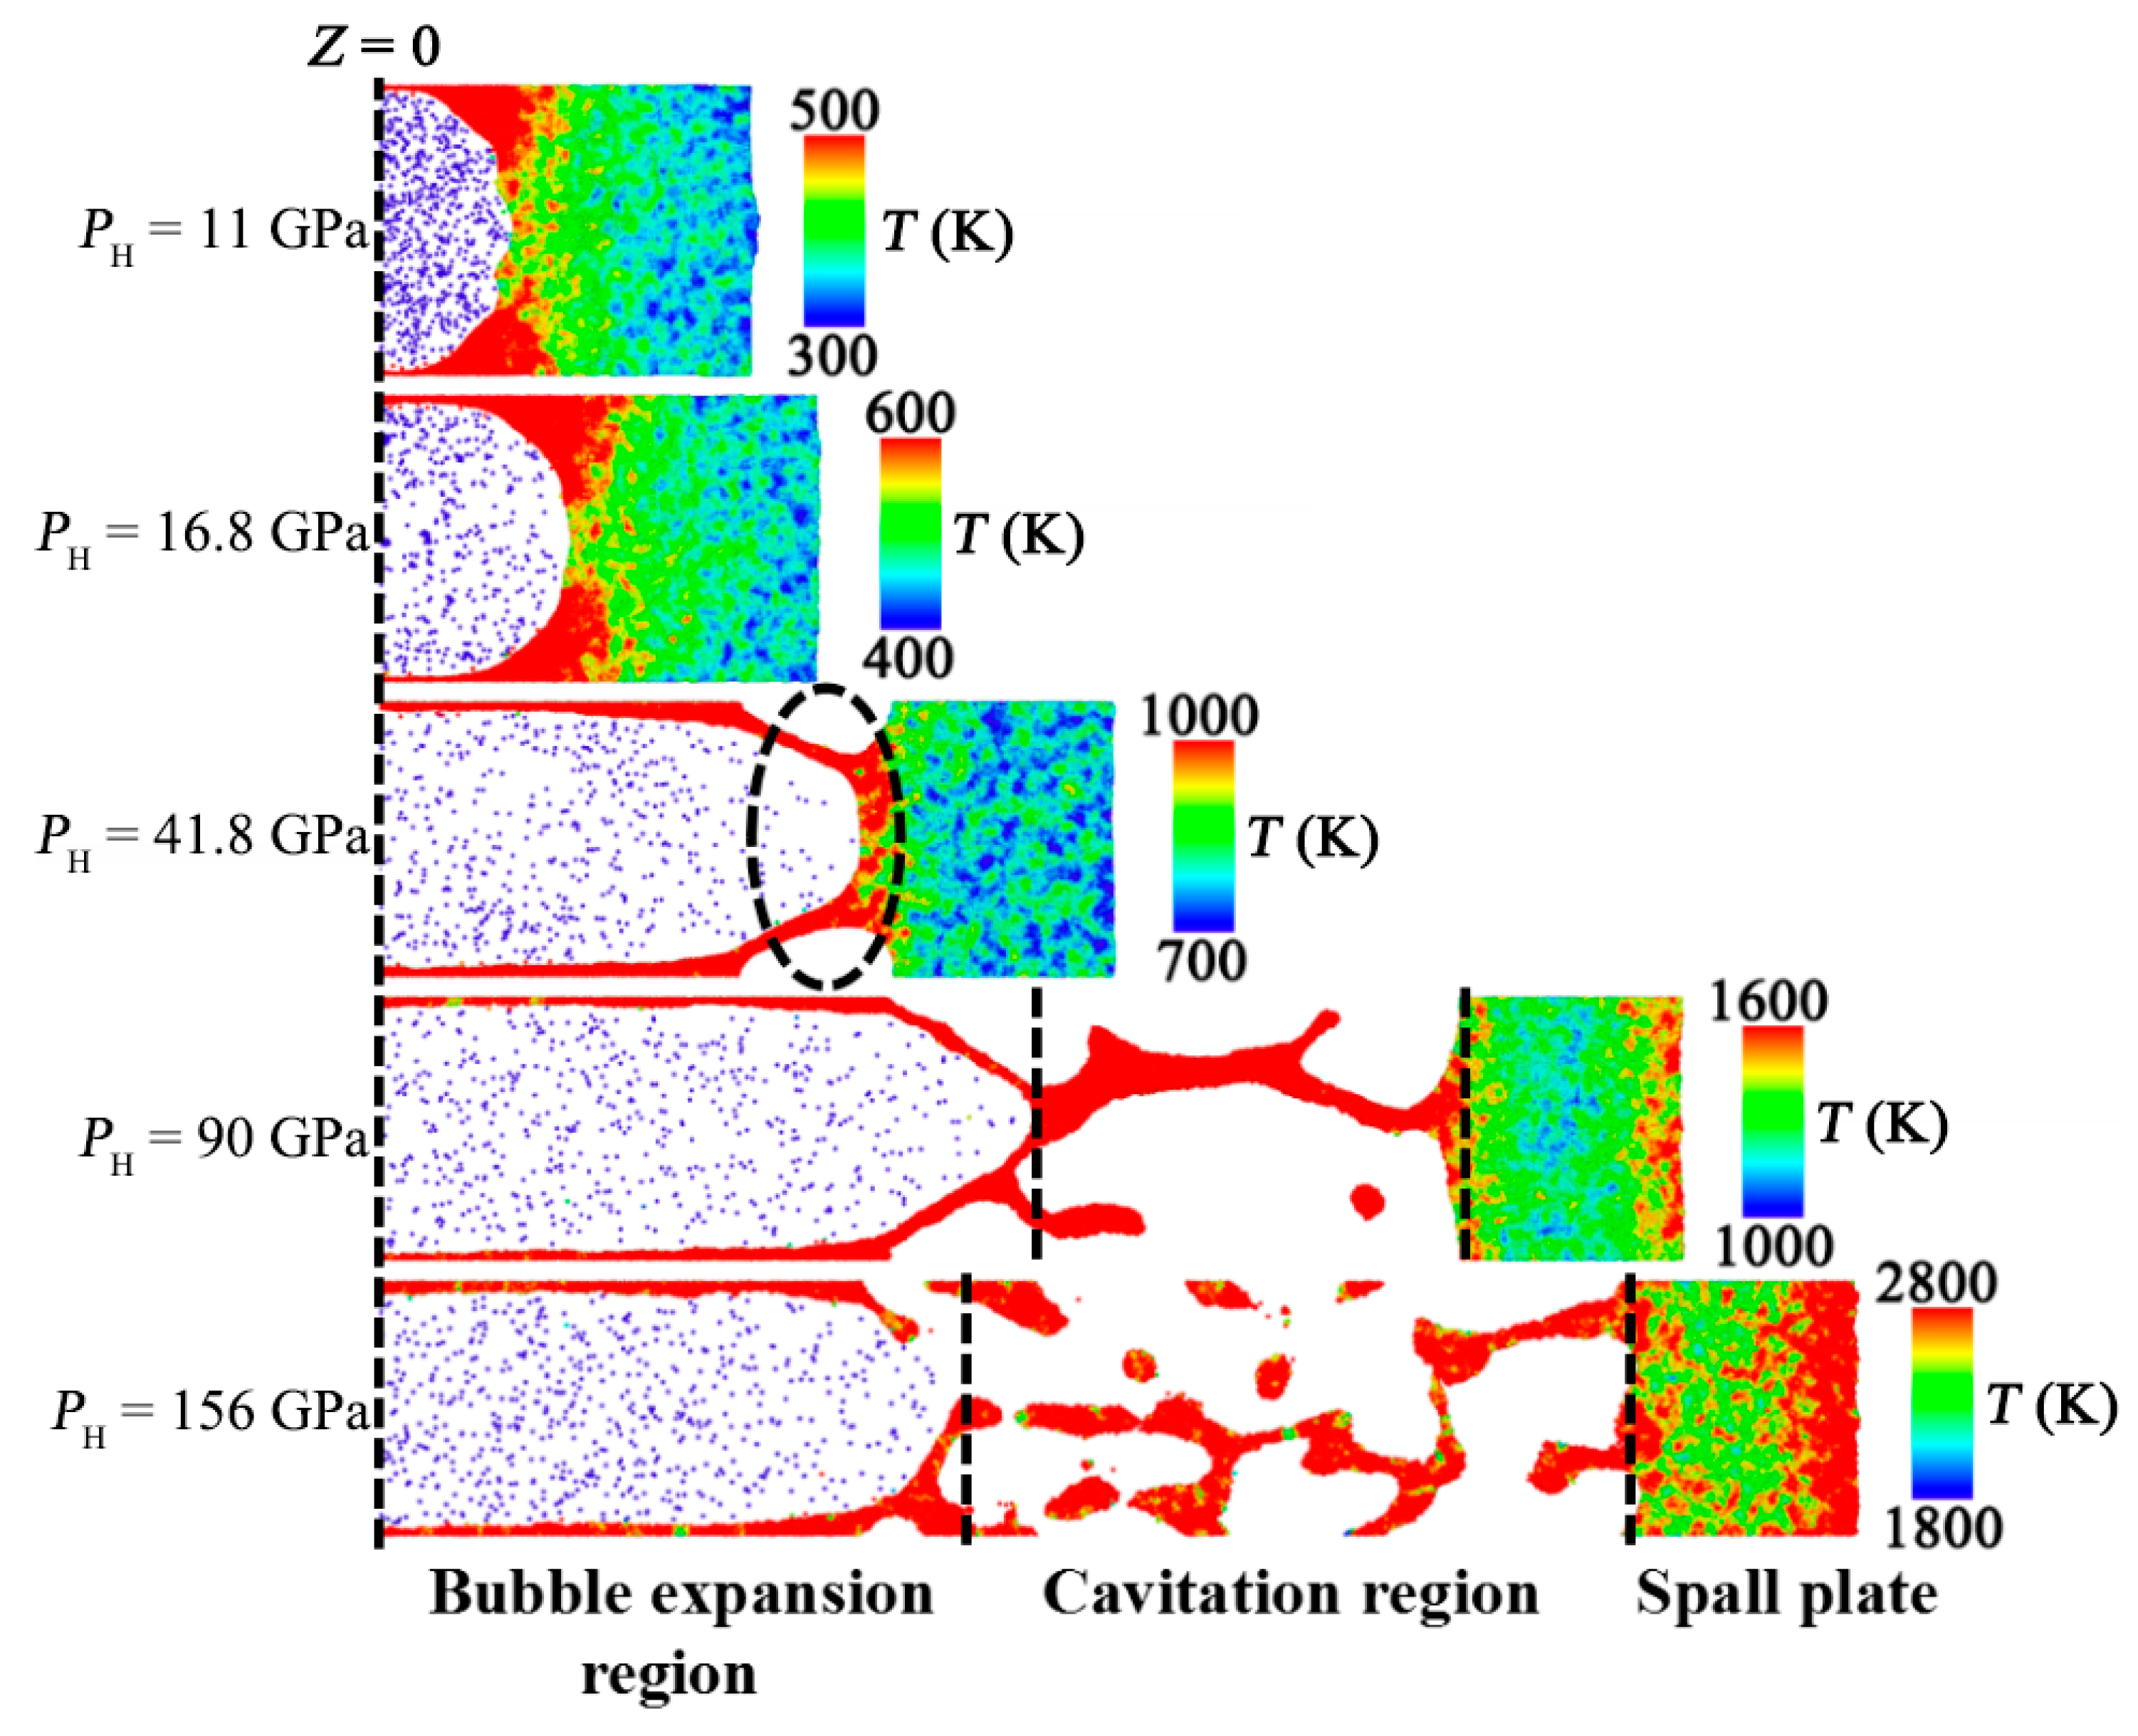
In addition, the distribution characteristics of new voids are significantly different for different Hugoniot states. We further present the microscopic images of the void distribution at peak moment in Figure 8. For PH = 11 GPa, the presence of He bubbles makes the void nucleation very difficult, and the very few voids nucleate near the boundaries of the box. For PH = 16.8 GPa, the voids are mainly distributed in the bubble expansion region. As the pressure increases to 41.83 GPa, other than the bubble expansion region, additional voids are found to be distributed on both sides of the He bubble along the release direction. Interestingly, as the pressure further increases to 90 GPa, the voids are preferentially nucleated on both sides of He bubble, instead of the bubble expansion region. The difference in the distribution characteristics of voids inevitably leads to the different fracture modes. Therefore, we display the final configurations of spallation under various Hugoniot states, as shown in Figure 9. As expected, for PH = 11 GPa and 16.8 GPa, the sample fractures in the bubble expansion region. For PH = 41.8 GPa, new fracture points begin to appear on both sides of the He bubble along the release direction (marked by black ellipse). As the pressure increases to 90 GPa, cavitation regions of a certain width are formed on both sides of He bubbles, which provide the additional positions for fracture failure.

3.4. Microjet and Bubble Bursting

When the He bubble is away from the center of the matrix, i.e., L > 0, the two release waves would not meet at the center of the He bubble. In this case, the He bubble inevitably exhibits a different dynamic response from the He bubble located in the center of the simulation cell. In this section, the behavior of He bubbles that are not located at the center of the cell (L = 45 and 76 a) is investigated.
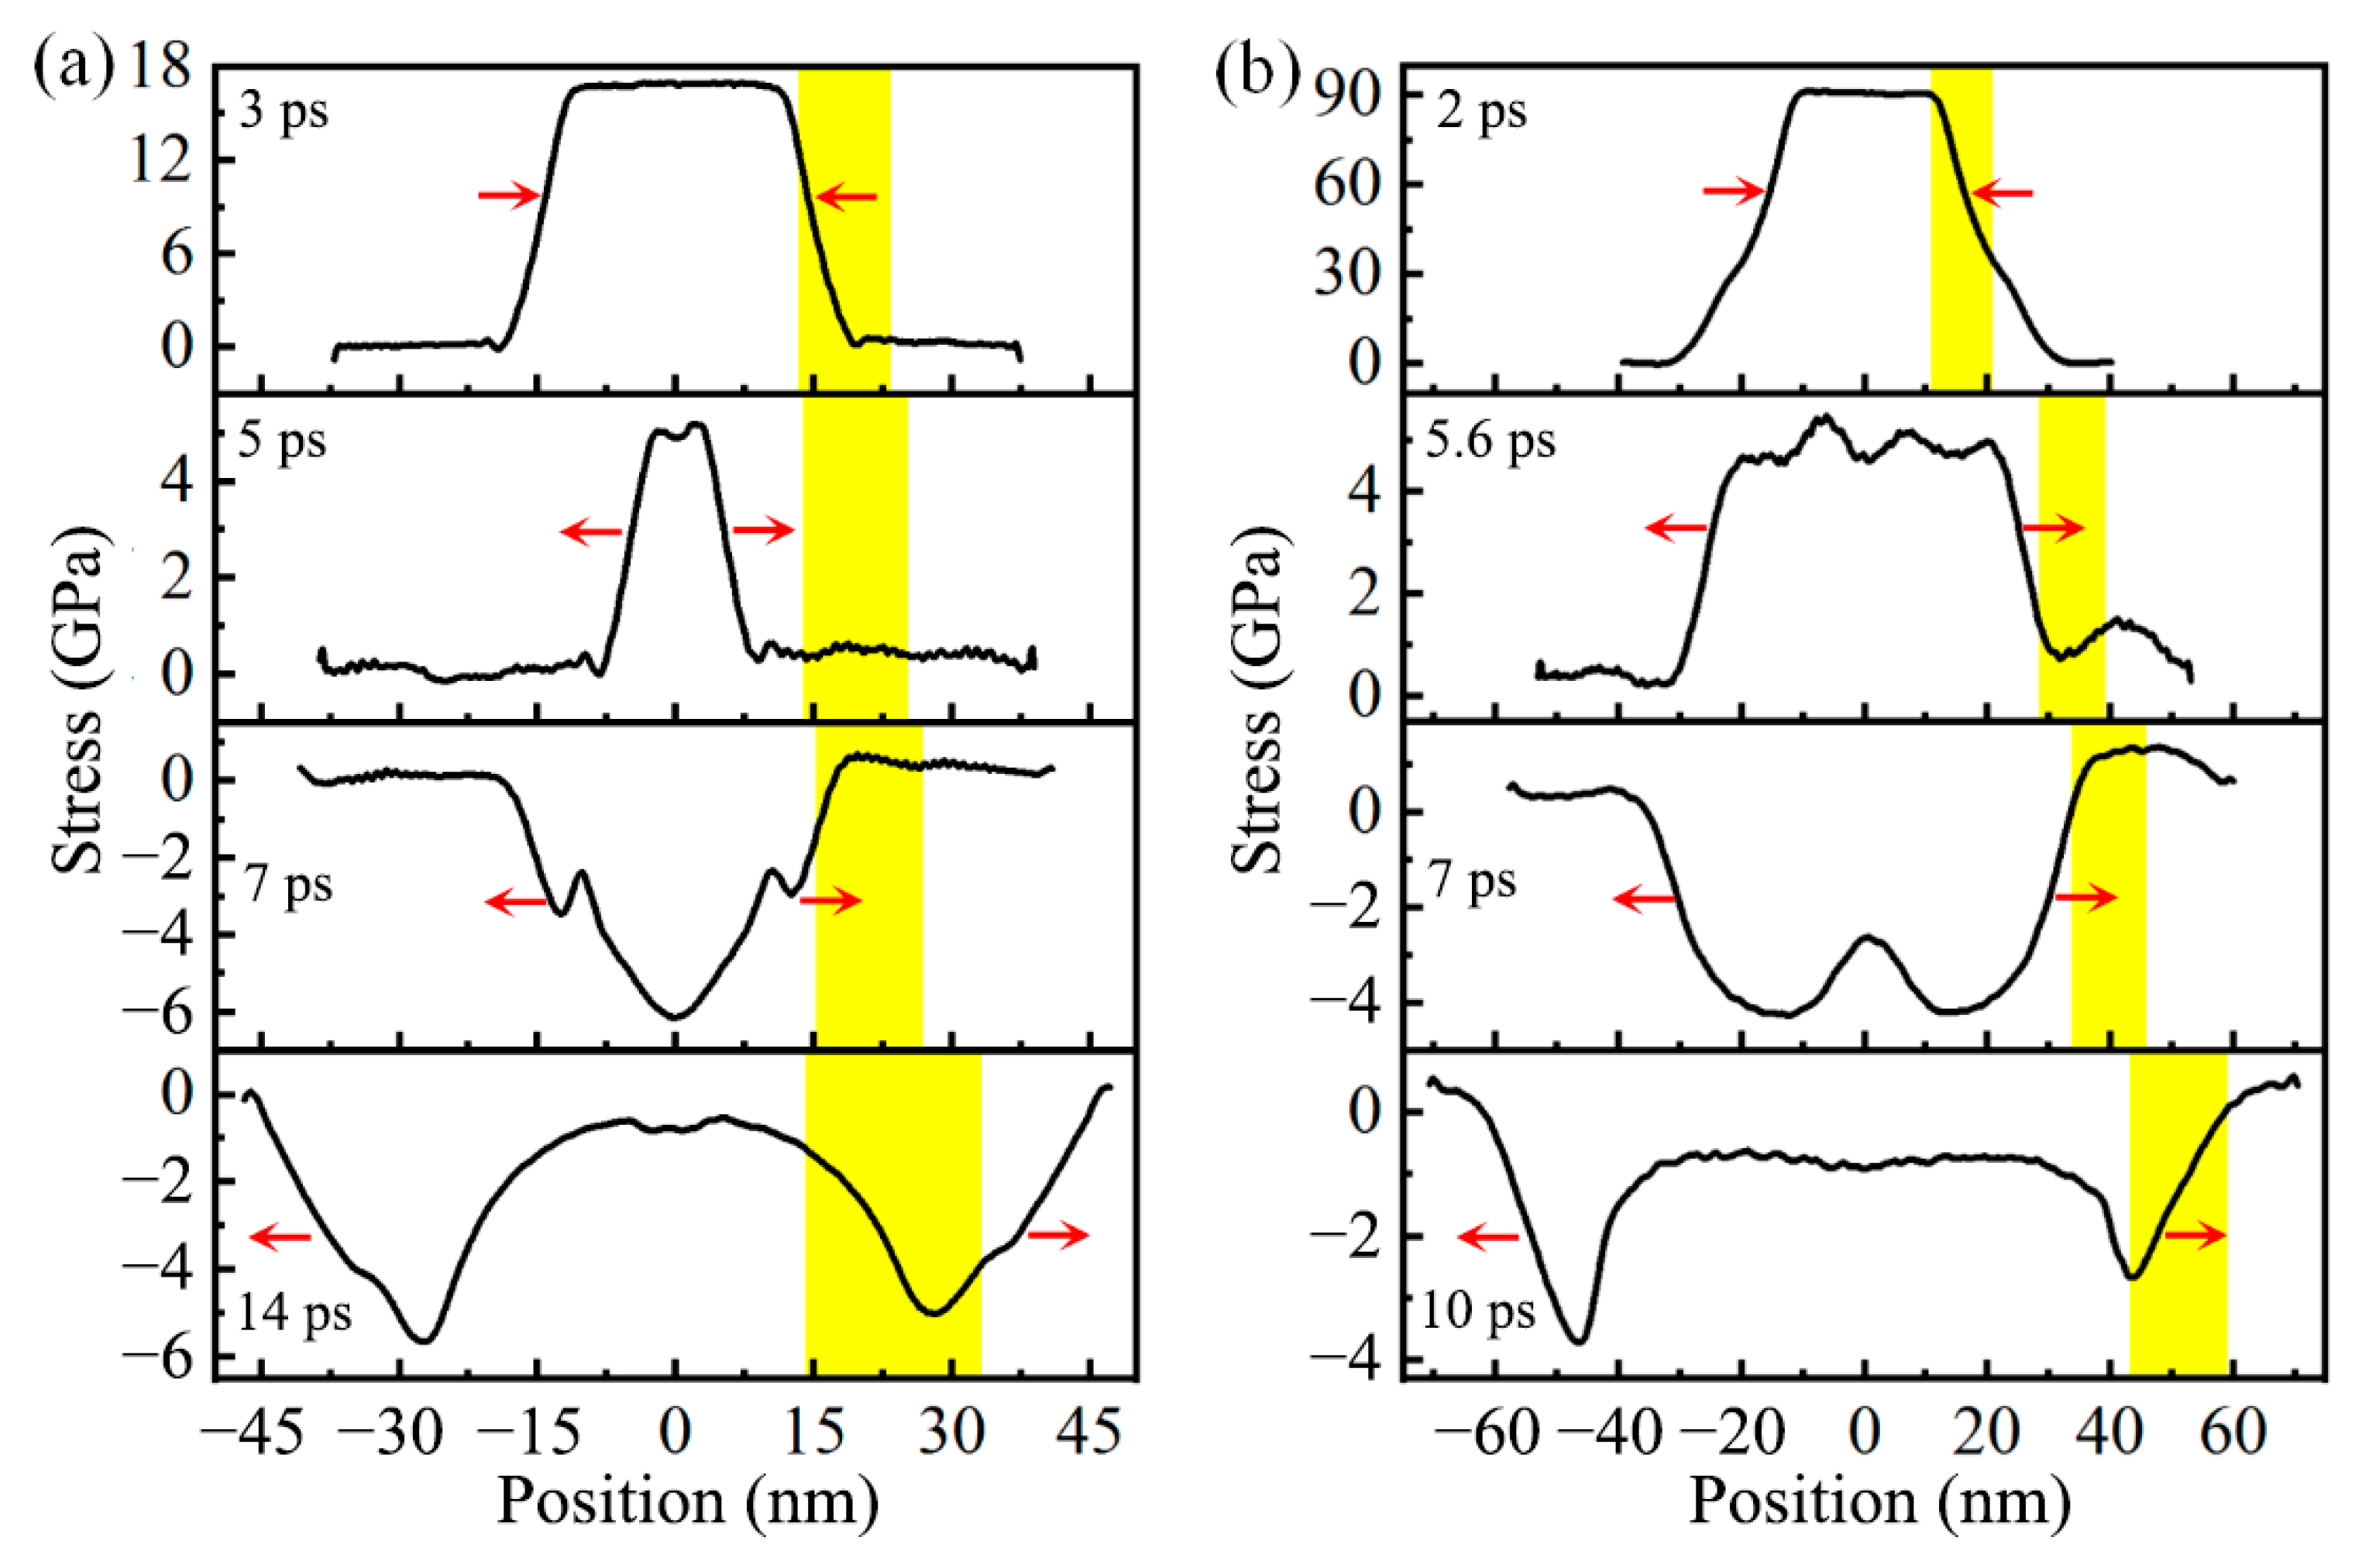
To illustrate the effects of He bubbles in this case, taking L = 45 a as an example, we present longitudinal stress profiles at PH = 16.8 GPa and 90 GPa in Figure 10a,b. Here, the yellow rectangular region represents the space occupied by the He bubble. We can see that a significant stress pullback signal appears around the location of the He bubble. Meantime, the stress pullback at PH = 90 GPa is more pronounced than that at PH = 16.8 GPa. These results are related to the microstructure evolution and the stress state around the He bubble, which will be analyzed in what follows.
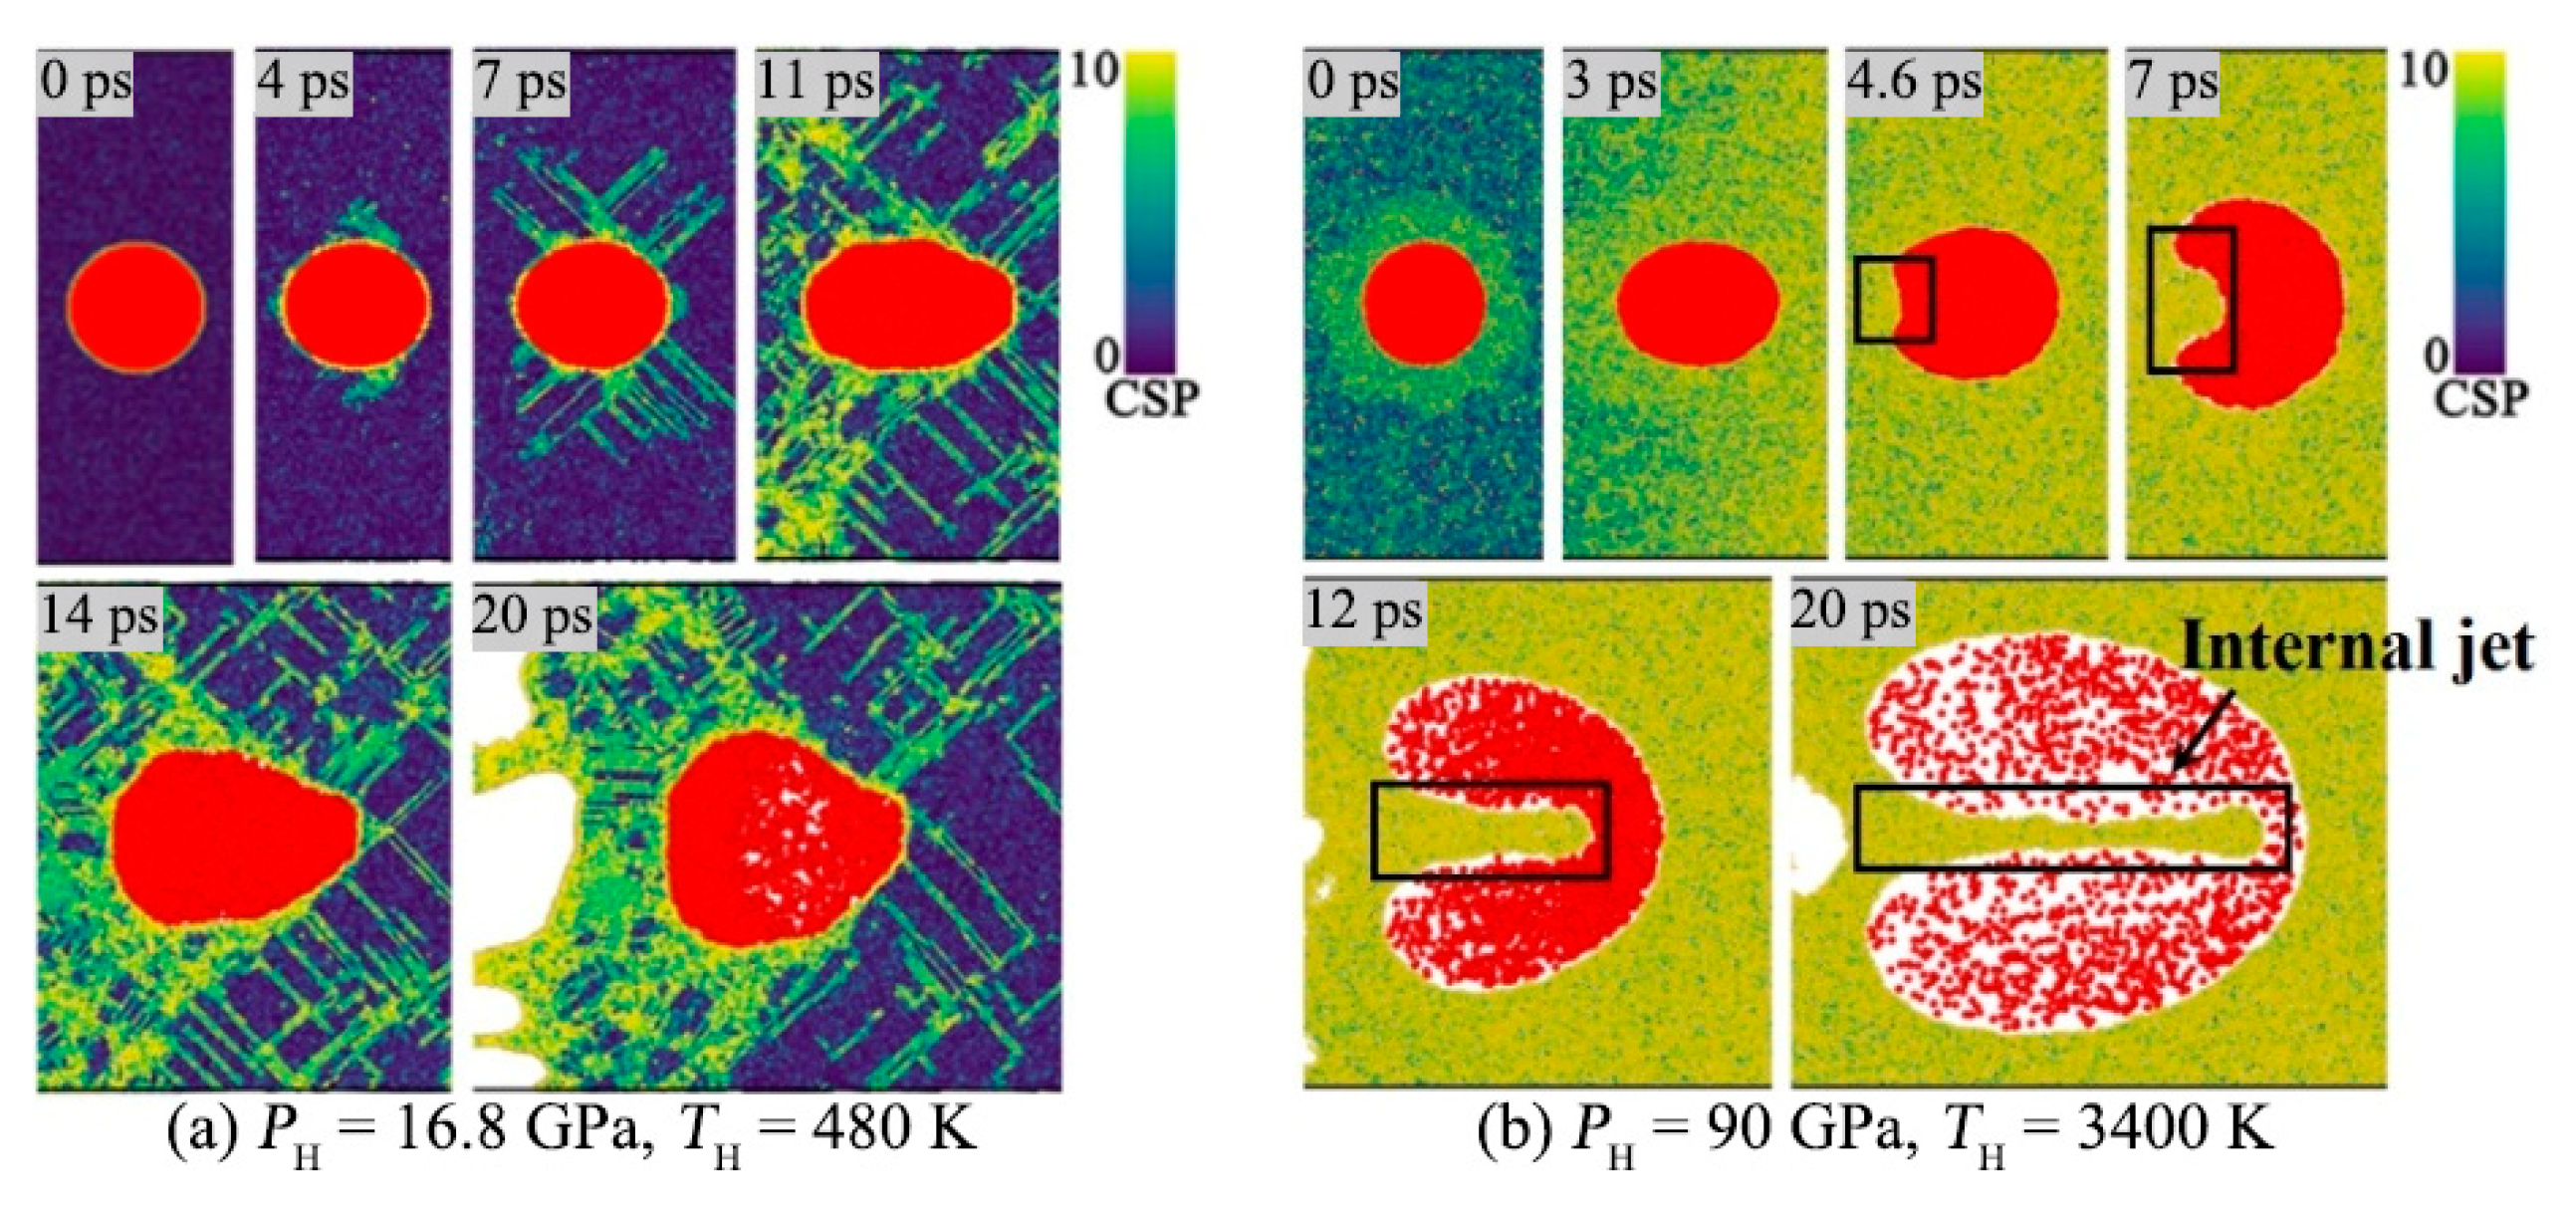
First, the local microstructure evolution of the He bubble under the case of L = 45 a is displayed in Figure 11. Two typical Hugoniot states, PH = 16.8 GPa and 90 GPa are considered. For PH = 16.8 GPa, with the plastic slip of the matrix, the He bubble is first elongated in an ellipsoid shape along the release direction (0–11 ps) and then the left-side half surface is gradually flattened over time (14–20 ps). Eventually, it grows into an irregular shape, which is different from the near-spherical expansion under the case of L = 0. For PH = 90 GPa, in the early stage of evolution (0–3 ps), the bubble grows longitudinally. More importantly, the metallic jet into the He bubble is subsequent observed. The melted Al materials at the left-side of the matrix-bubble interface are pushed into the He bubble to form a groove (4 ps) and gradually evolve into an internal spike (7 ps). With the expansion of the He bubble, the spike continuously ejects into the bubble to further form an internal jet and finally almost penetrates the whole He bubble (12–20 ps). Note that the microjet phenomenon is found during the release process, which is different from the microjet caused by the shock loading [23,25].
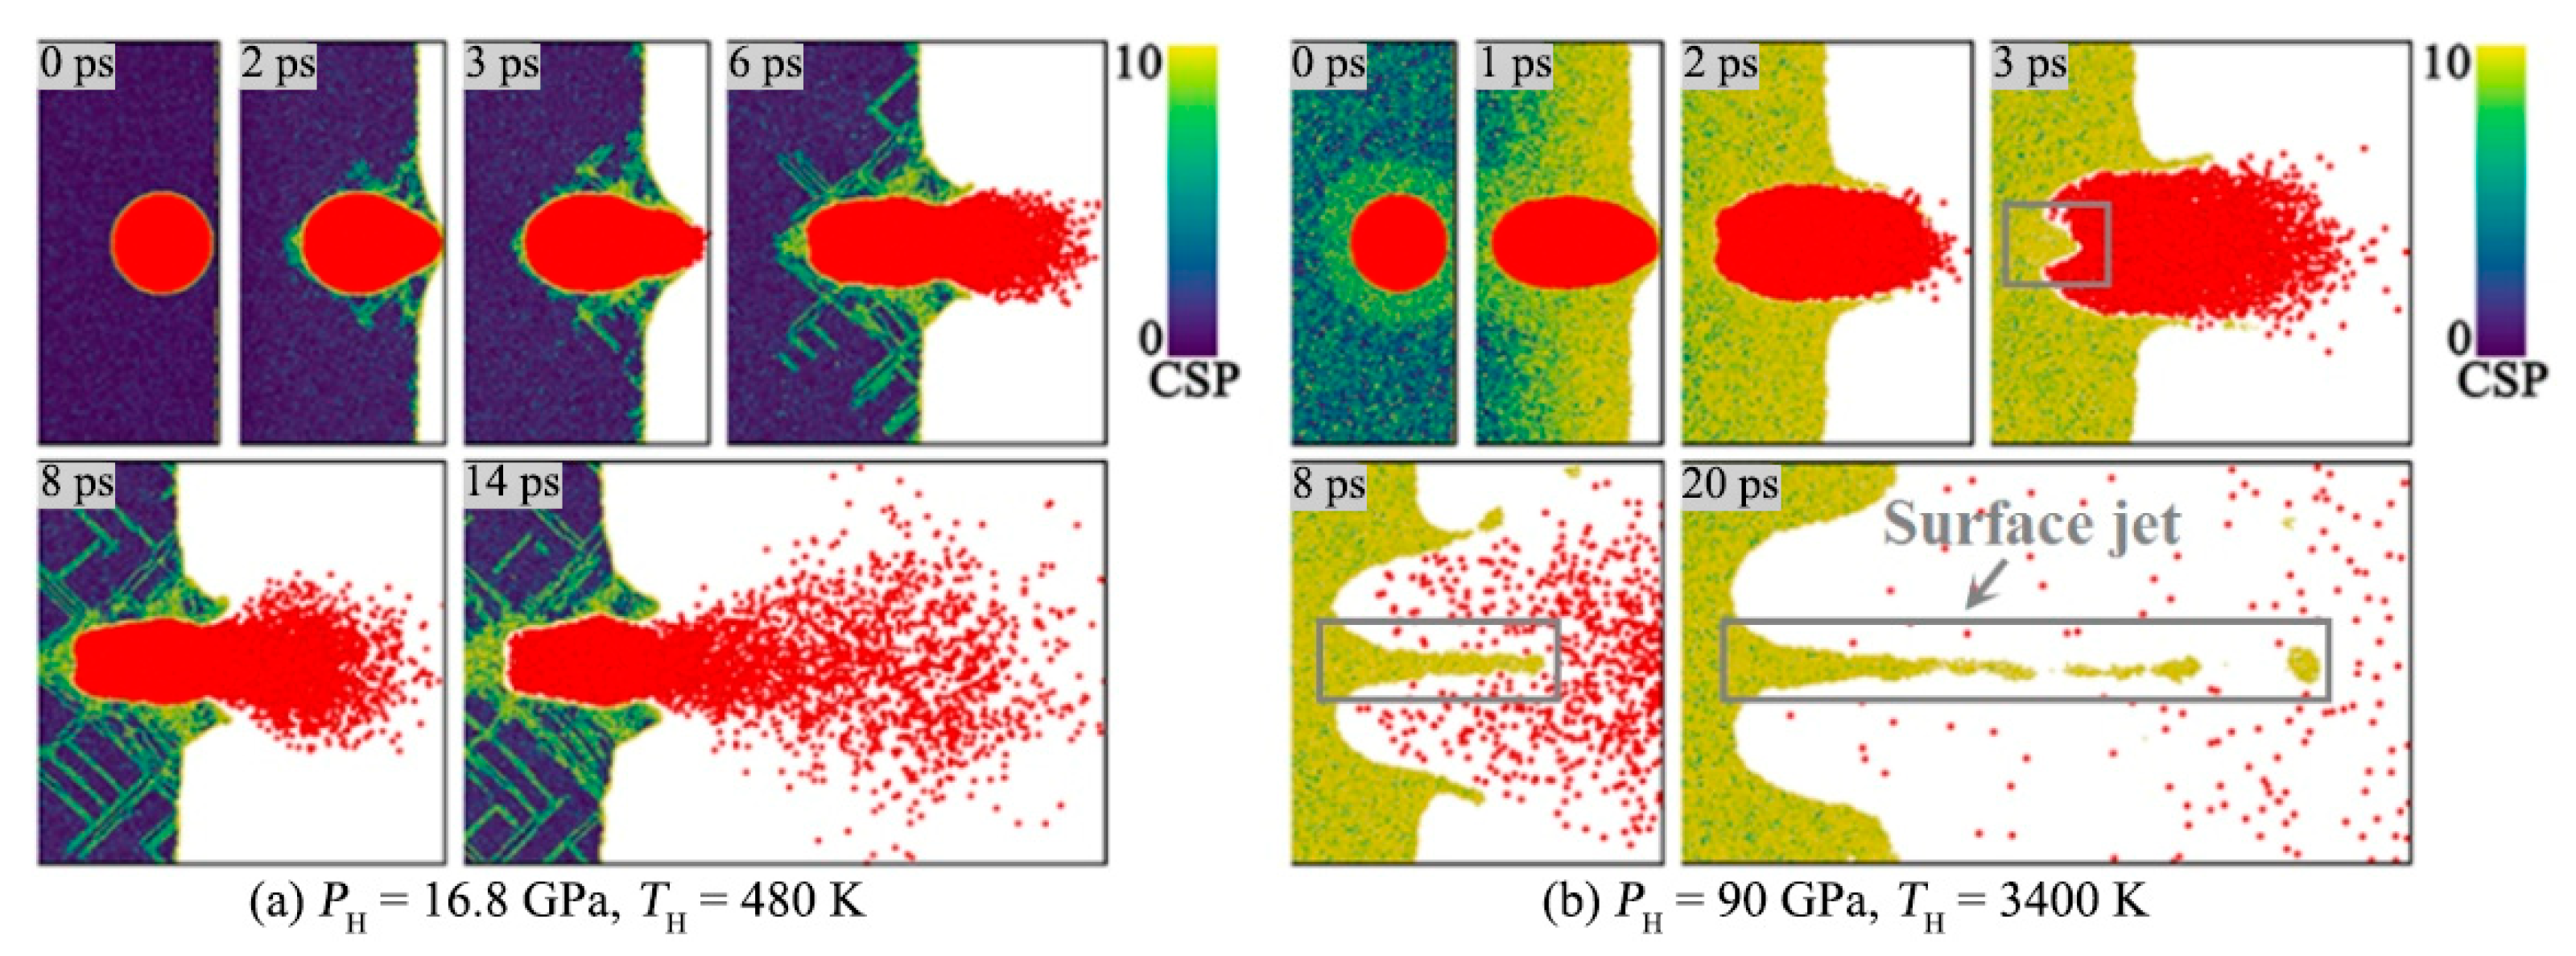
Figure 12 displays the local microstructure evolution of the He bubble under the case of L = 76 a. In this case, the He bubble is located near the surface of the matrix. For PH = 16.8 GPa, with the He bubble growth, the right free surface of Al matrix gradually bulges (2 ps). Then, the thin ligament between the bubble and the surface fails and subsequently the bubble bursts, which causes the released He atoms and the Al cluster atoms to diffuse outward in a funnel shape (3–14 ps). For PH = 90 GPa, the bubble burst is also observed. Moreover, the surface jet is formed at the left-side of the matrix-bubble interface. Note that the surface jet is thinner and longer than the internal jet due to the rapid release of the He bubble pressure.
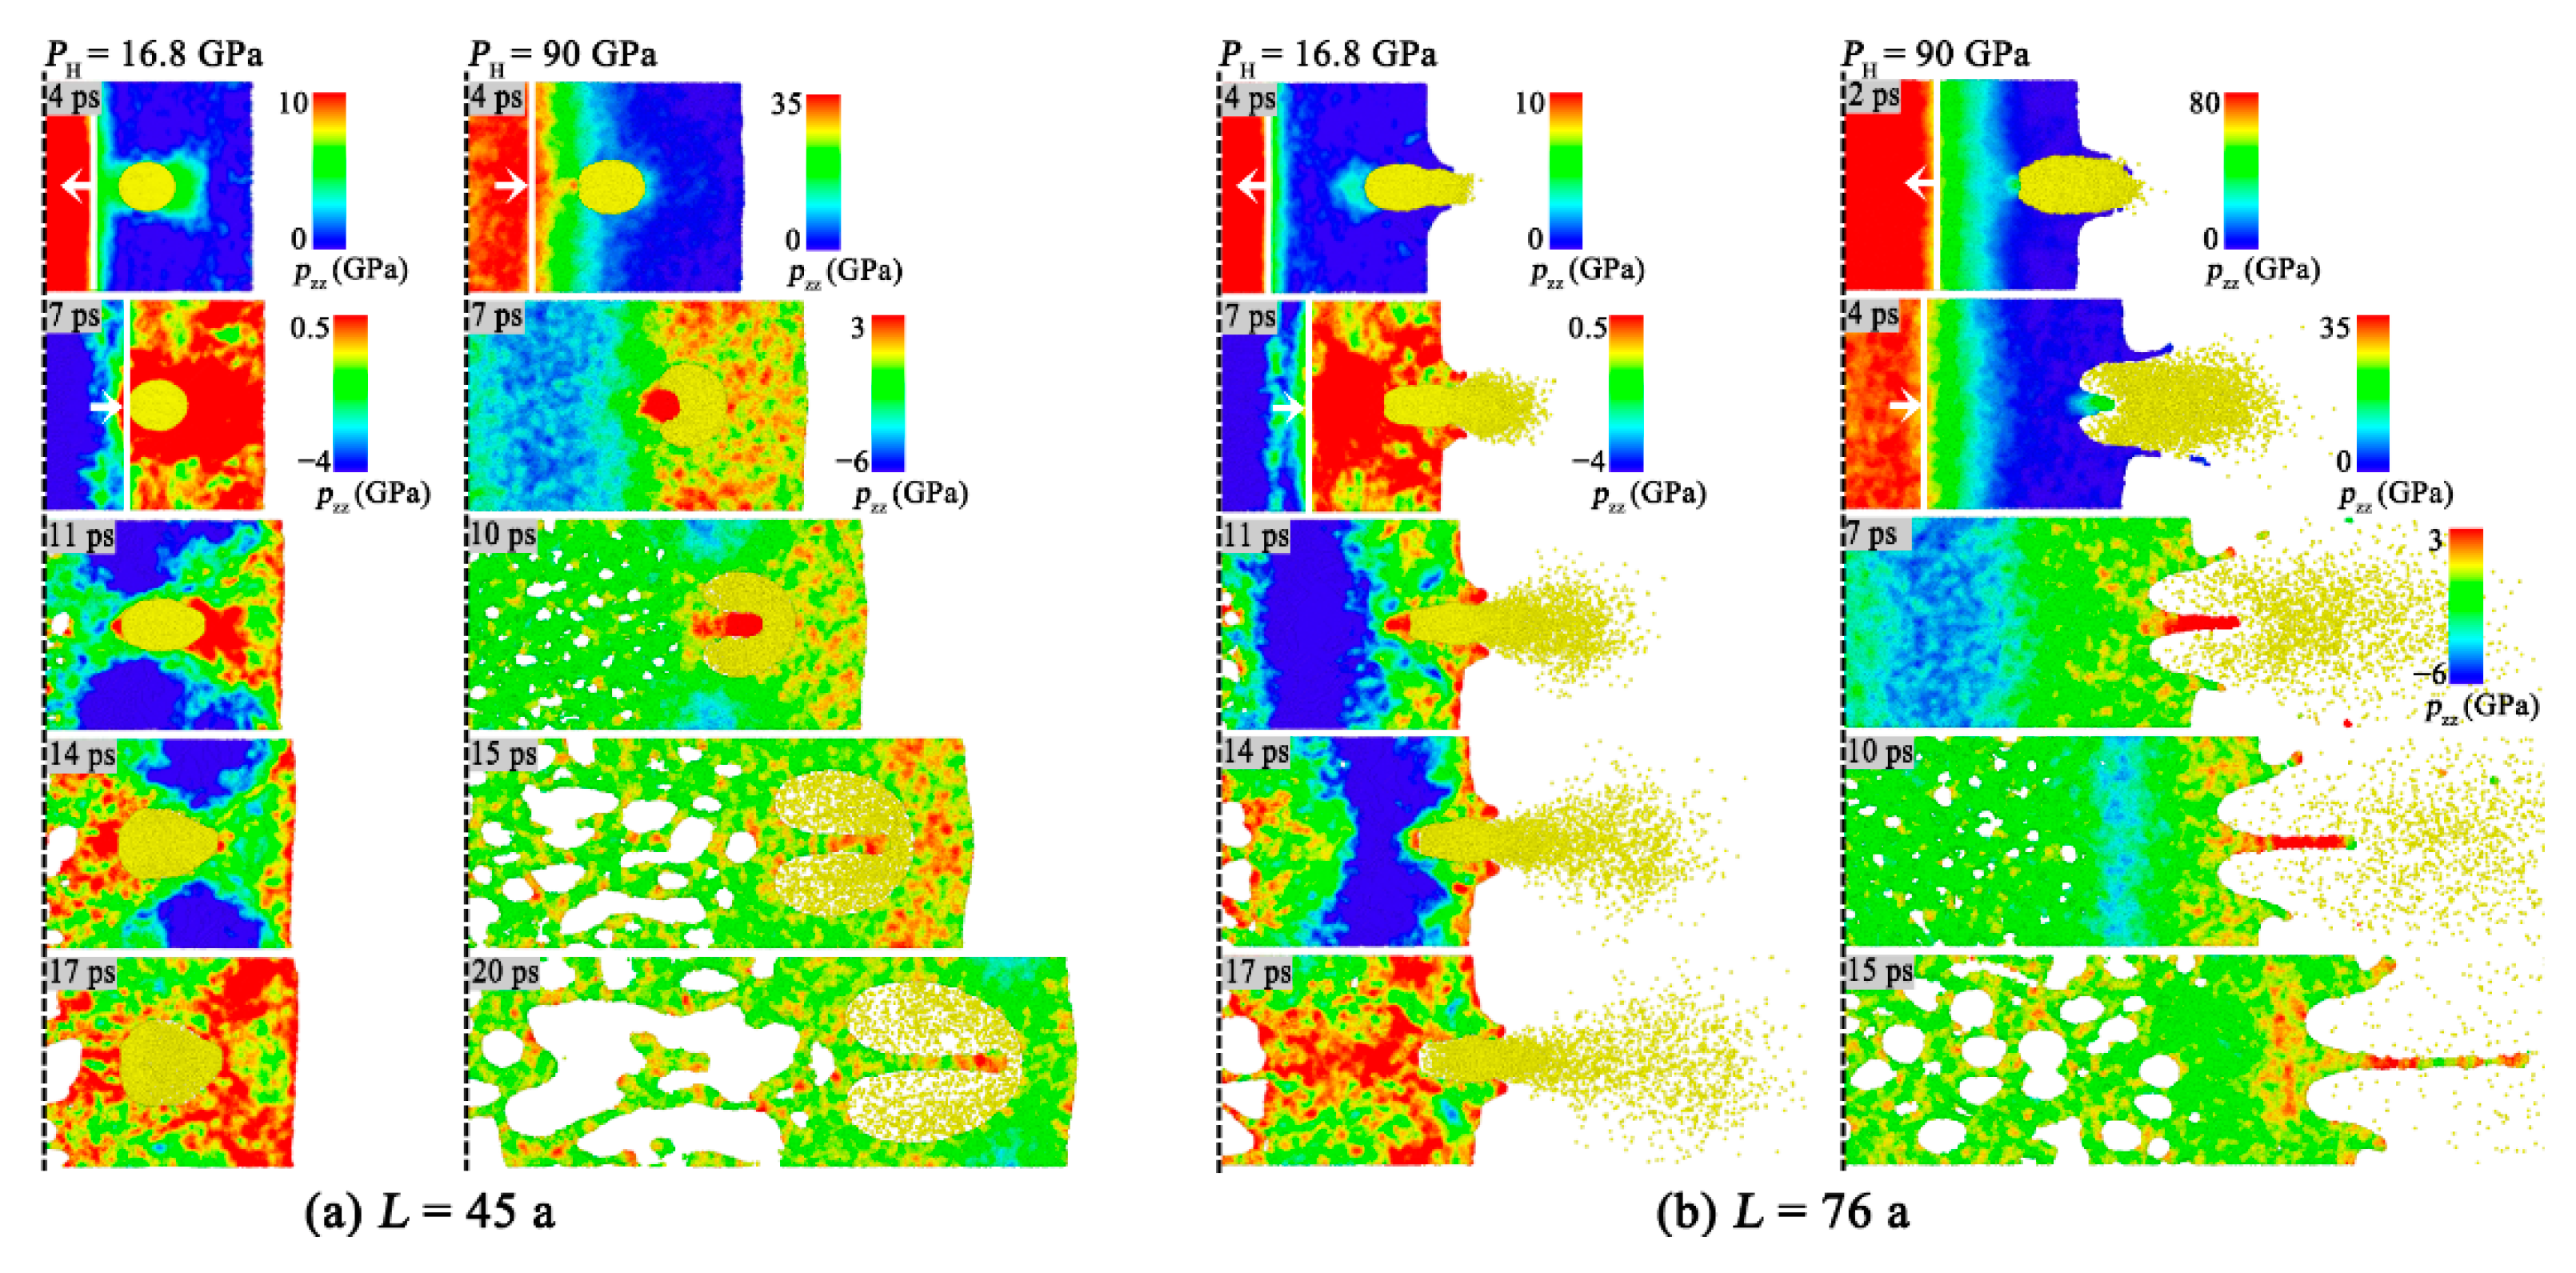
To further interpret the deformation characteristics of the He bubble and the formation mechanism of the jet during release, the corresponding stress distribution are presented in Figure 13. Once the release occurs, one rarefaction wave will generate from the right-side free surface. There is a significant pressure difference on both sides of the He bubble when the rarefaction wave passes through the He bubble. Under this pressure difference, the Al materials can be pushed into He bubble. For PH = 16.8 GPa, the matrix is still in a solid state, and the pressure difference is insufficient to cause matter ejection at the interface. While for PH = 90 GPa, the matrix is completely melted and the local materials on the left side of interface easily collapse. The collapsed matter obtains enough kinetic energy under this pressure difference to produce the microjet.
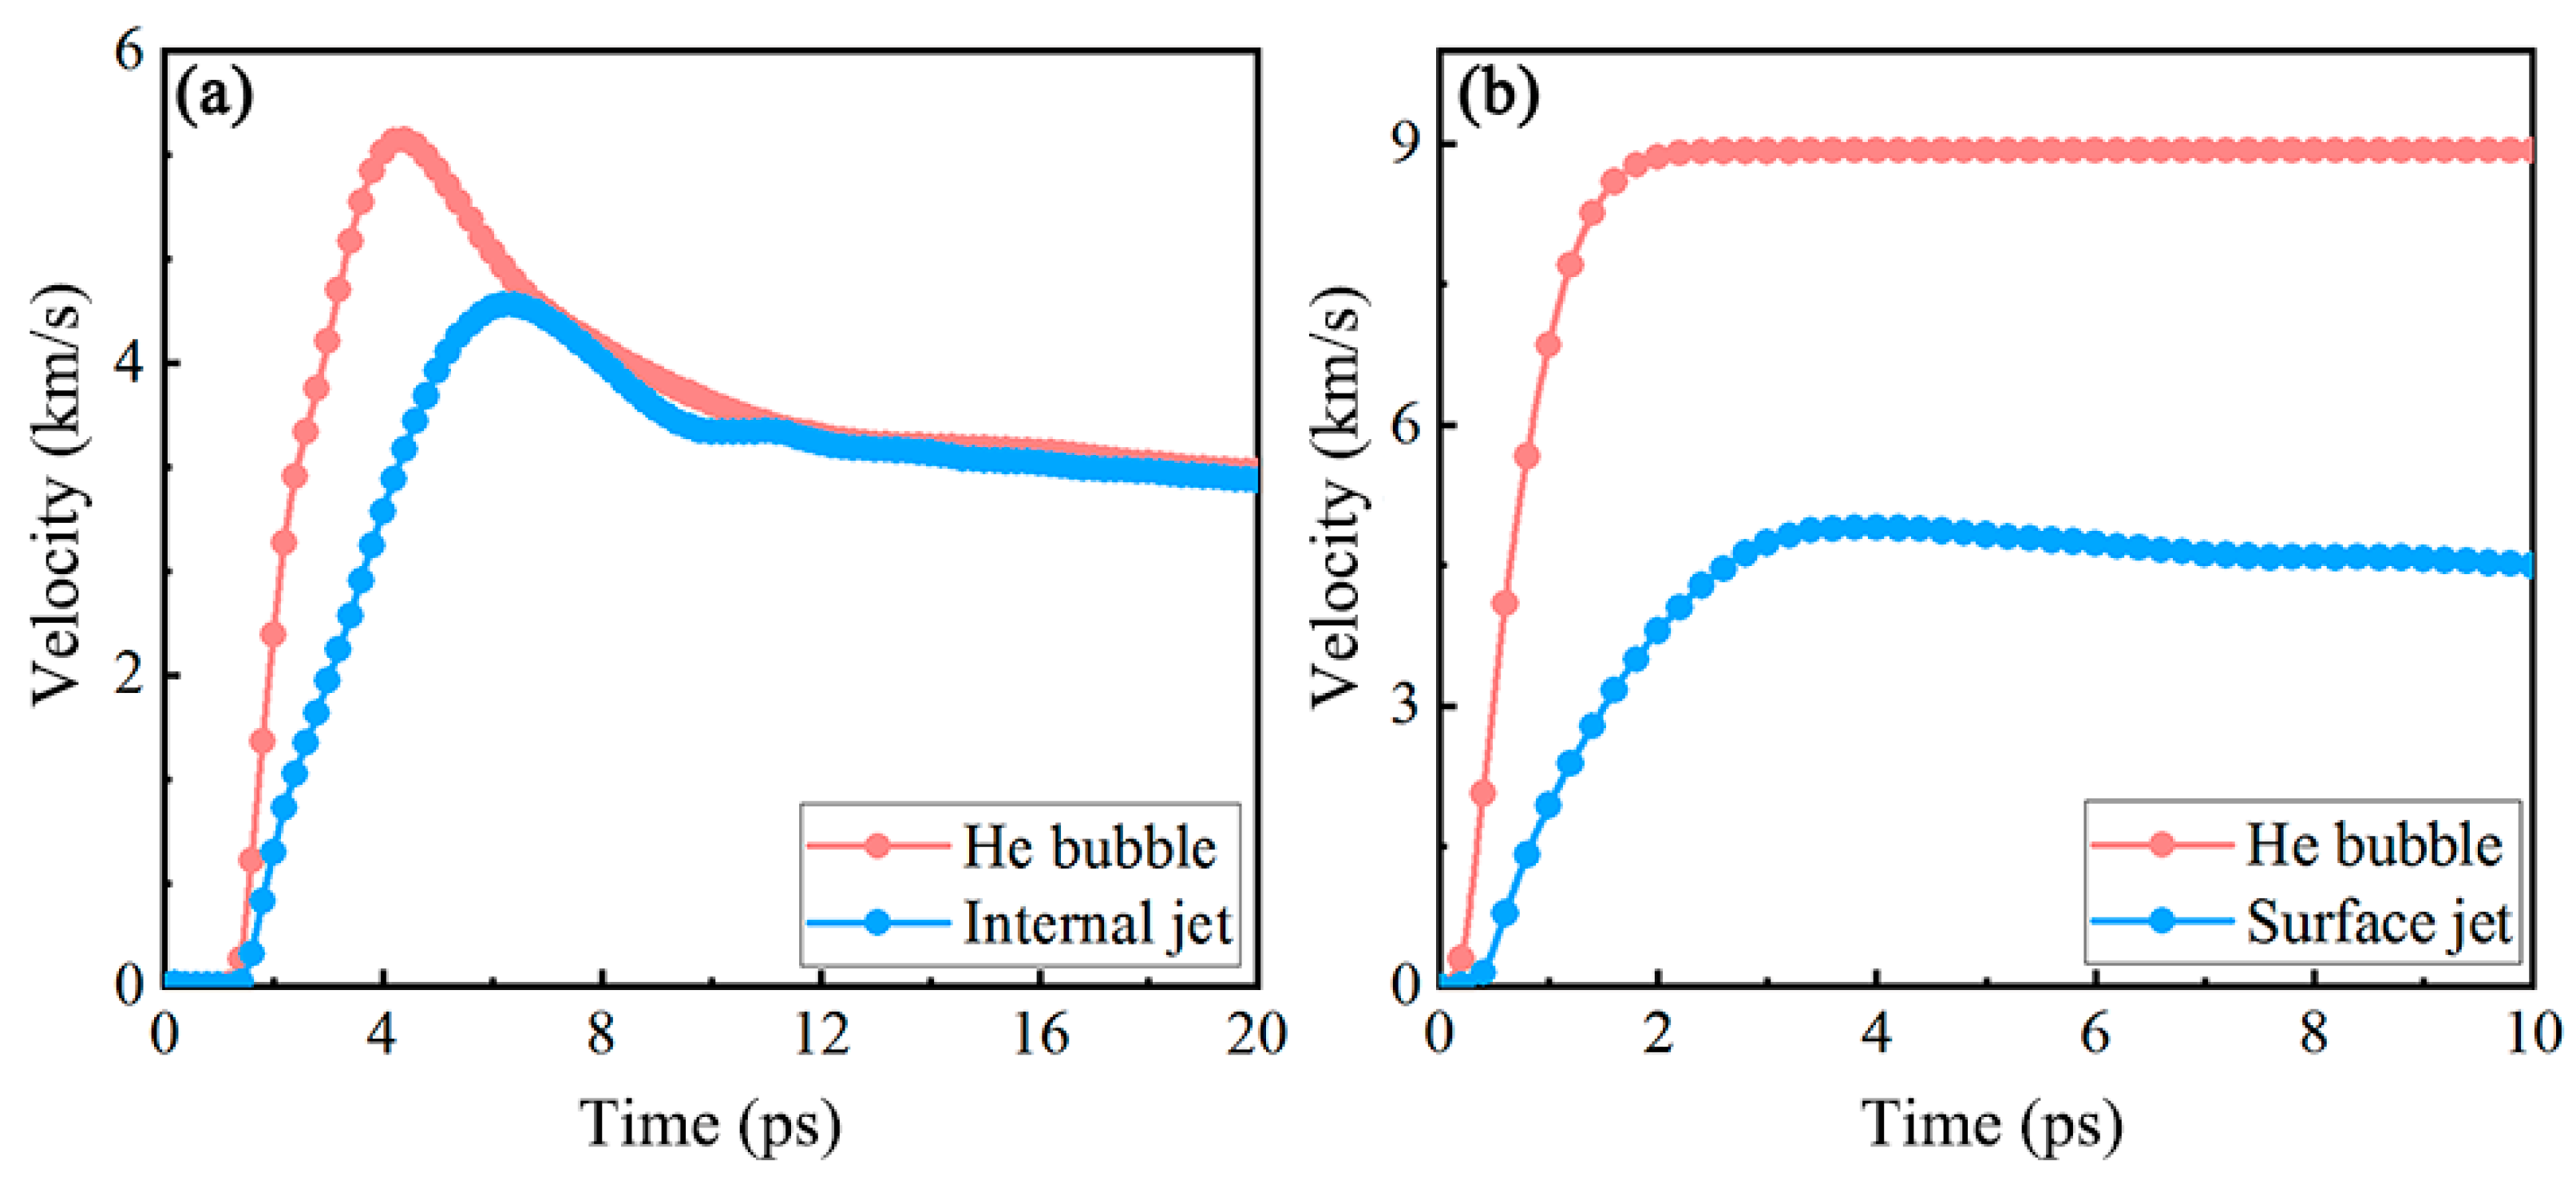
Finally, comparisons of the average velocity evolution between the whole jet and He bubble are plotted in Figure 14. As for the internal jet, the velocities of the jet and He bubble first undergo the rapid acceleration stage. During this stage, the velocity of the jet is always smaller than that of the He bubble. After reaching the maximum value, the velocities of the jet and He bubble rapidly decrease and finally flatten and stabilize at approximately 3.5 km/s. While for the surface jet, due to the failure of the ligament, the velocities of the jet and He bubble have no obvious decreasing trend after reaching the maximum value but directly enter a flat slope. The velocities of the jet and He bubble are approximately 4.4 km/s and 9 km/s, respectively.

4. Conclusions

In this work, the deformation and release path of the nanoscale He bubble in metal from a high-pressure state has been investigated by molecular dynamics methods. We set different stable He bubbles with reference to the shock adiabatic states, and then the behavior of high-pressured He bubbles at different positions during release is discussed in detail. The deformation, damage, and microjet are all revealed. Firstly, the case that two opposite release waves meet at the center of the He bubble is considered. Combined with the analysis of deformation mechanism and stress waveform around the He bubble, the transversal and longitudinal growth of the He bubble during release is clarified. The plastic slip and the plastic flow are observed. Then, the evolution of the number and distribution of voids with or without the He bubble is compared. Moreover, when a single unloading wave is considered to sweep through the He bubble, the jet formation in the He bubble is found due to the pressure gradient effect. The shape and velocity distribution of internal and surface jets are discussed.

Author Contributions

Conceptualization, J.S.; validation, W.W.; methodology, J.S. and W.W.; supervision, J.S.; visualization, W.W. and J.S.; writing—original draft, W.W.; writing—review and editing, W.W. and J.S. All authors have read and agreed to the published version of the manuscript.

Funding

This research was funded by the Foundation of Science and Technology on Plasma Physics Laboratory (Grant No. 6142A04190108).

Data Availability Statement

The data that support the findings of this study are available from the corresponding author upon reasonable request.

Conflicts of Interest

The authors declare no conflict of interest.

References

  1. Rajainmäki, H.; Linderoth, S.; Hansen, H.E.; Nieminen, R.M.; Bentzon, M.D. Nucleation and growth of helium bubbles in aluminum between 20 and 900 K. Phys. Rev. B 1988, 38, 1087–1904. [Google Scholar] [CrossRef] [PubMed] [Green Version]
  2. Li, Q.; Parish, C.M.; Powers, K.A.; Miller, M.K. Helium solubility and bubble formation in a nanostructured ferritic alloy. J. Nucl. Mater. 2014, 445, 165–174. [Google Scholar] [CrossRef]
  3. Wang, Z.J.; Allen, F.; Shan, Z.W.; Hosemann, P. Mechanical behavior of copper containing a gas-bubble superlattice. Acta Mater. 2016, 121, 78–84. [Google Scholar] [CrossRef] [Green Version]
  4. Neogi, A.; Askari, H.; Abdolrahim, N. Atomistic simulations of the strengthening effect of high-density bubble formation in helium irradiated single crystalline copper. Materials 2018, 1, 139–149. [Google Scholar] [CrossRef]
  5. Agarwal, S.; Bhattacharya, A.; Trocellier, P.; Zinkle, S.J. Helium induced microstructure damage, nano-scale grain formation and helium retention behaviour of ZrC. Acta Mater. 2019, 163, 14–27. [Google Scholar] [CrossRef]
  6. Trinkaus, H. Energetics and formation kinetics of helium bubbles in metals. Radiat. Eff. 1983, 78, 189–211. [Google Scholar] [CrossRef]
  7. Bonilla, L.L.; Carpio, A.; Neu, J.C.; Wolfer, W.G. Kinetics of helium bubble formation in nuclear materials. Physica D 2006, 222, 131–140. [Google Scholar] [CrossRef] [Green Version]
  8. Robinson, M.; Kenny, S.D.; Smith, R.; Storr, M.T. He migration and bubble formation in Ga stabilised δ-Pu. J. Nucl. Mater. 2014, 444, 493–500. [Google Scholar] [CrossRef] [Green Version]
  9. Singh, A.; Maji, S.; Nambissan, P.M.G. Helium-dislocation interaction in aluminum. J. Phys. Condens. Matter 2001, 13, 177–187. [Google Scholar] [CrossRef]
  10. Yang, L.; Zu, X.T.; Gao, F.; Peng, S.M.; Heinisch, H.L.; Long, X.G.; Kurtz, R.J. Dynamic interactions of helium-vacancy clusters with edge dislocations in α-Fe. Physica B 2010, 405, 1754–1758. [Google Scholar] [CrossRef]
  11. Abe, Y.; Tsuru, T.; Shi, S.; Oono, N.; Ukai, S. Effect of the dilation caused by helium bubbles on edge dislocation motion in α-iron: Molecular dynamics simulation. J. Nucl. Sci. Technol. 2016, 53, 1528–1534. [Google Scholar] [CrossRef]
  12. Schäublin, R.; Chiu, Y.L. Effect of helium on irradiation-induced hardening of iron: A simulation point of view. J. Nucl. Mater. 2007, 362, 152–160. [Google Scholar] [CrossRef]
  13. Li, N.; Mara, N.A.; Wang, Y.Q.; Nastasi, M.; Misra, A. Compressive flow behavior of Cu thin films and Cu/Nb multilayers containing nanometer-scale helium bubbles. Scr. Mater. 2011, 64, 974–977. [Google Scholar] [CrossRef]
  14. Landau, P.; Guo, Q.; Hattar, K.; Greer, J.R. The effect of He implantation on the tensile properties and microstructure of Cu/Fe nano-bicrystals. Funct. Mater. 2013, 23, 1281–1288. [Google Scholar] [CrossRef]
  15. Landau, P.; Guo, Q.; Hosemann, P.; Wang, Y.; Greer, J.R. Deformation of as-fabricated and helium implanted 100 nm-diameter iron nano-pillars. Mater. Sci. Eng. A 2014, 612, 316–325. [Google Scholar] [CrossRef]
  16. Glam, B.; Eliezer, S.; Moreno, D.; Perelmutter, L.; Sudai, M.; Eliezer, D. Dynamic fracture and spall in aluminum with helium bubbles. Int. J. Fract. 2010, 163, 217–224. [Google Scholar] [CrossRef]
  17. Glam, B.; Strauss, M.; Eliezer, S.; Moreno, D. Shock compression and spall formation in aluminum containing helium bubbles at room temperature and near the melting temperature: Experiments and simulations. Int. J. Impact Eng. 2014, 65, 1–12. [Google Scholar] [CrossRef]
  18. Glam, B.; Strauss, M.; Eliezer, S.; Moreno, D. The preheating effect on the dynamic strength of aluminium containing helium bubbles. J. Phys. Conf. Ser. 2014, 500, 182012. [Google Scholar] [CrossRef]
  19. Xiao, D.W.; He, L.F.; Zhou, P.; Zou, D.L.; Shu, H. Spall in aluminium with helium bubbles under laser shock loading. Chin. Phys. Lett. 2017, 34, 056201. [Google Scholar] [CrossRef]
  20. Kubota, A.; Reisman, D.B.; Wolfer, W.G. Dynamic strength of metals in shock deformation. Appl. Phys. Lett. 2006, 88, 241924. [Google Scholar] [CrossRef]
  21. Shao, J.L.; Wang, P.; He, A.M. Compression-induced stacking fault tetrahedra around He bubbles in Al. J. Appl. Phys. 2014, 116, 163516. [Google Scholar] [CrossRef]
  22. Wu, W.D.; Shao, J.L. Atomistic study on the dynamic response of the void or helium bubble in aluminum under compression and tension. J. Appl. Phys. 2020, 127, 154902. [Google Scholar] [CrossRef] [Green Version]
  23. Li, B.; Wang, L.; E, J.C.; Ma, H.H.; Luo, S.N. Shock response of He bubbles in single crystal Cu. J. Appl. Phys. 2014, 116, 213506. [Google Scholar] [CrossRef]
  24. Flanagan, R.M.; Hahn, E.N.; Germann, T.C.; Meyers, M.A.; Fensin, S.J. Moleculardynamics simulations of ejecta formation in helium-implanted copper. Scr. Mater. 2020, 178, 114–118. [Google Scholar] [CrossRef]
  25. Wang, X.X.; He, A.M.; Yang, Y.; Wang, P.; Wang, J.G. Shock responses of nanoporous copper with helium doping by molecular dynamics simulations. Comput. Mater. Sci. 2021, 188, 110190. [Google Scholar] [CrossRef]
  26. Shao, J.L.; Wang, P.; He, A.M.; Duan, S.Q.; Qin, C.S. Influence of voids or He bubbles on the spall damage in single crystal Al. Model. Simul. Mater. Sci. Eng. 2014, 22, 025012. [Google Scholar] [CrossRef]
  27. Zhou, T.T.; He, A.M.; Wang, P.; Shao, J.L. Spall damage in single crystal Al with helium bubbles under decaying shock loading via molecular dynamics study. Comput. Mater. Sci. 2019, 162, 255–267. [Google Scholar] [CrossRef]
  28. Zhou, T.T.; He, A.M.; Wang, P. Dynamic evolution of He bubble and its effects on void nucleation-growth and thermomechanical properties in the spallation of aluminum. J. Nucl. Mater. 2020, 542, 152496. [Google Scholar] [CrossRef]
  29. Shao, J.L.; Wu, W.D. Shock-induced collapse and migration of nanoscale He bubble in single crystal Al. Scr. Mater. 2023, 222, 115033. [Google Scholar] [CrossRef]
  30. Zhakhovskii, V.V.; Inogamov, N.A.; Petrov, Y.V.; Ashitkov, S.I.; Nishihara, K. Molecular dynamics simulation of femtosecond ablation and spallation with different interatomic potentials. Appl. Surf. Sci. 2009, 255, 9592–9596. [Google Scholar] [CrossRef]
  31. Young, D.A.; Mcmahan, A.K.; Ross, M. Equation of state and melting curve of helium to very high pressure. Phys. Rev. B 1981, 24, 5119–5127. [Google Scholar] [CrossRef]
  32. Wang, H.Y.; Zhu, W.J.; Liu, S.J.; Song, Z.F.; Deng, X.L.; Chen, X.R.; He, H.L. Atomistic simulations of the elastic properties of helium bubble embedded aluminum. Nucl. Instrum. Methods Phys. Res. Sect. B 2009, 267, 849–855. [Google Scholar] [CrossRef]
  33. Plimpton, S. Fast parallel algorithms for short-range molecular dynamics. J. Comput. Phys. 1995, 117, 1–19. [Google Scholar] [CrossRef] [Green Version]
  34. Stukowski, A. Visualization and analysis of atomistic simulation data with OVITO: The open visualization tool. Model. Simul. Mater. Sci. Eng. 2010, 18, 015012. [Google Scholar] [CrossRef]
  35. Stukowski, A. Computational analysis methods in atomistic modeling of crystals. JOM 2014, 66, 399–407. [Google Scholar] [CrossRef]
  36. Tsai, D.H. The virial theorem and stress calculation in molecular dynamics. J. Chem. Phys. 1979, 70, 1375–1382. [Google Scholar] [CrossRef]
  37. Barber, C.B.; Dobkin, D.P.; Huhdanpaa, H. The quickhull algorithm for convex hulls. ACM Trans. Math. Softw. 1996, 22, 469–483. [Google Scholar] [CrossRef] [Green Version]
  38. Loison, D.; de Resseguier, T.; Dragon, A.; Mercier, P.; Benier, J.; Deloison, G.; Lescoute, E.; Sollier, A. Skew photonic doppler velocimetry to investigate the expansion of a cloud of droplets created by microspalling of laser shock-melted metal foils. J. Appl. Phys. 2012, 112, 113520. [Google Scholar] [CrossRef]
  39. Tramontina, D.; Erhart, P.; Germann, T.; Hawreliak, J.; Higginbotham, A.; Park, N.; Ravelo, R.; Stukowski, A.; Suggit, M.; Tang, Y.; et al. Molecular dynamics simulations of shock-induced plasticity in tantalum. High Energy Density Phys. 2014, 10, 9–15. [Google Scholar] [CrossRef]
  40. Jiang, D.D.; Shao, J.L.; Wu, B.; Wang, P.; He, A.M. Sudden change of spall strength induced by shock defects based on atomistic simulation of single crystal aluminum. Scr. Mater. 2022, 210, 114474. [Google Scholar] [CrossRef]
Figure 1. Three-dimensional view of Al–He system. A nanoscale He bubble of d = 10 nm is created inside the matrix. Three different positions along the z-axis from the center of the simulation cell, i.e., L = 0, 45 and 76 a, are considered respectively.
Metals 12 01665 g001
Figure 2. T-P Hugoniot relationship (solid triangles) and some typical release paths (hollow circles).
Metals 12 01665 g002
Figure 3. The bubble radius and corresponding microstructure evolutions for three typical Hugoniot states. (ac) shows the radius evolution of the He bubble in the x direction and z direction (release direction) during release from different Hugoniot states. The right figures (A–D) present the microstructure corresponding to the marked points on the left figure, where the atoms are color-coded by CSP.
Metals 12 01665 g003
Figure 4. Evolution of shear stress with time on release for different Hugoniot states.
Metals 12 01665 g004
Figure 5. The stress along the release direction and temperature distributions at PH = 11 GPa. (ac) shows the stress profiles of the Al-He sample at different moments. On the right is the corresponding 2D side views of the stress or temperature parallel to the release direction.
Metals 12 01665 g005
Figure 6. The stress along the release direction and temperature distributions at PH = 41.8 GPa. (ac) shows the stress profiles of the Al-He sample at different moments. On the right is the corresponding 2D side views of stress or temperature parallel to the release direction.
Metals 12 01665 g006
Figure 7. Spall strength of Al–void and Al–He for different Hugoniot states.
Metals 12 01665 g007
Figure 8. The difference of void number between Al-void and Al–He. (ad) shows the comparison of these two samples for different Hugoniot states. The microscopic images of the void distribution at peak moment are presented.
Metals 12 01665 g008
Figure 9. Final configurations of spallation under various Hugoniot states. Here, the right half of model is selected.
Metals 12 01665 g009
Figure 10. Longitudinal stress profiles under the case of L = 45 a. Two Hugoniot pressure are compared: (a) 16.8 GPa and (b) 90 GPa. The yellow rectangular region represents the space occupied by the He bubble, where the significant pullback signal of the stress profile is observed.
Metals 12 01665 g010
Figure 11. The local microstructure evolution of the He bubble under the case of L = 45 a for (a) PH = 16.8 GPa and (b) 90 GPa. The matrix atoms are color-coded by CSP.
Metals 12 01665 g011
Figure 12. The local microstructure evolution of the He bubble under the case of L = 76 a for (a) PH = 16.8 GPa and (b) 90 GPa.
Metals 12 01665 g012
Figure 13. The stress distribution for the Al–He samples with two different configurations: (a) L = 45 a and (b) 76 a. To clearly distinguish the stress state, only the Al atoms are colored. Here, the right half of model is selected.
Metals 12 01665 g013
Figure 14. Comparisons of the average velocity evolution of the microjet and He bubble. (a) Internal jet; (b) Surface jet.
Metals 12 01665 g014
Publisher’s Note: MDPI stays neutral with regard to jurisdictional claims in published maps and institutional affiliations.