Article

Optimization of As(V) Removal by Dried Bacterial Biomass: Nonlinear and Linear Regression Analysis for Isotherm and Kinetic Modelling

by
Wahid Ali Hamood Altowayti
1,*,
Ali Ahmed Salem
2,
Abdo Mohammed Al-Fakih
3,4,
Abdullah Bafaqeer
5,
Shafinaz Shahir
1,* and
Husnul Azan Tajarudin
6,*
1
Department of Biosciences, Faculty of Science, Universiti Teknologi Malaysia, Johor Bahru 81310, Johor, Malaysia
2
Institute of High Voltage and High Current, School of Electrical Engineering, Universiti Teknologi Malaysia, Johor Bahru 81310, Johor, Malaysia
3
Department of Chemistry, Faculty of Science, Universiti Teknologi Malaysia, Johor Bahru 81310, Johor, Malaysia
4
Department of Chemistry, Faculty of Science, Sana’a University, Sana’a P.O. Box 1247, Yemen
5
School of Chemical and Energy Engineering, Universiti Teknologi Malaysia, Johor Bahru 81310, Johor, Malaysia
6
Division of Bioprocess, School of Industrial Technology, Universiti Sains Malaysia, Gelugor 11800, Pinang, Malaysia
*
Authors to whom correspondence should be addressed.
Metals 2022, 12(10), 1664; https://doi.org/10.3390/met12101664
Submission received: 30 August 2022 / Revised: 20 September 2022 / Accepted: 25 September 2022 / Published: 4 October 2022

Abstract

:
Arsenic occurrence and toxicity records in various industrial effluents have prompted researchers to find cost-effective, quick, and efficient methods for removing arsenic from the environment. Adsorption of As(V) onto dried bacterial biomass is proposed in the current work, which continues a line of previous research. Dried bacterial biomass of WS3 (DBB) has been examined for its potential to remove As(V) ions from aqueous solutions under various conditions. Under optimal conditions, an initial concentration of 7.5 ppm, pH 7, adsorbent dose of 0.5 mg, and contact period of 8 h at 37 °C results in maximum removal of 94%. Similarly, amine, amide, and hydroxyl groups were shown to contribute to As(V) removal by Fourier transform infrared spectroscopy (FTIR), and the adsorption of As(V) in the cell wall of DBB was verified by FESEM-EDX. In addition, equilibrium adsorption findings were analyzed using nonlinear and linear isotherms and kinetics models. The predicted best-fit model was selected by calculating the coefficient of determination (R2). Adsorption parameters representative of the adsorption of As(V) ions onto DBB at R2 values were found to be more easily attained using the nonlinear Langmuir isotherm model (0.95). Moreover, it was discovered that the nonlinear pseudo-second-order rate model using a nonlinear regression technique better predicted experimental data with R2 than the linear model (0.98). The current study verified the nonlinear approach as a suitable way to forecast the optimal adsorption isotherm and kinetic data.

1. Introduction

Water is an integral part of the environment that is needed by all organisms to maintain their survival. Water is a vital element for socioeconomic development and equally important to preserve environmental sustainability [1]. Arsenic is the twentieth-largest component by weight in the Earth’s crust and is highly common in the environment [2,3,4]. Arsenic is a toxic heavy metal that may be found in water due to both natural and human-caused processes. Even if the typical quantity of arsenic in certain rocks and sediments is modest, weathering of these materials causes the release of this toxic element [5]. However, the vast majority of arsenic released into the environment directly results from human activities, making humans the primary source of arsenic occurrence. Several common human activities, such as working with minerals (mining, water percolation, and smelting ore) or agriculture (using fertilizers, pesticides, and herbicides), or even certain industrial processes, might lead to increased arsenic levels (coloring or wood conservation). However, the vast majority of arsenic released into the environment directly results from human activities, making humans the primary source of arsenic occurrence. Several common human activities, such as working with minerals (mining, water percolation, and smelting ore) or agriculture (using fertilizers, pesticides, and herbicides), or even certain industrial processes, might lead to increased arsenic levels (coloring or wood conservation) [2,6,7]. Arsenic occurs naturally in many different forms in both soil and water. It is widely agreed that inorganic arsenic is hundreds of times more poisonous than its organic counterpart. Even in groundwater, where arsenic is slowly absorbed by the underlying mineral, naturally contaminated fresh water may be detected at high concentrations.
Arsenic’s extreme toxicity at low doses is a massive attraction. Because of its high toxicity and widespread distribution, the Registry of Toxic Substances and Diseases has placed arsenic at the top of its 2015 priority list of hazardous compounds [8,9]. Primary exposure occurs when one drinks contaminated water; secondary exposure happens when one irrigates plants with water containing arsenic or when one comes into direct contact with polluted soils. Two hundred million people, roughly, drink water with concentrations of contaminants higher than the recommended threshold of 0.01 mg/L [10,11,12,13]. Bangladesh has “the biggest mass toxicity in its history”, and the country is severely polluted. Arsenic levels in the region are often ten times higher than the recommended limit, and an estimated 30 percent of the whole population of 157 million is exposed to it [11,12]. Each year, there are approximately 1.3 billion tonnes of food for humans is lost and wasted globally [14].
This arsenicosis epidemic peaked in the 1990s when people began to prefer drinking deeper groundwater, which is often higher in arsenic concentrations [13]. Developing nations are not the only ones affected by the issue. Over 26 million people in Arizona and California, for instance, are at risk since 35–38 percent of water supply sources have arsenic at or over the safety level. The Canadian mining region of Deloro, which has been abandoned, has also left a legacy of environmental contamination. Furthermore, other places also contain low-level radioactive waste, such as arsenic, cobalt, copper, and nickel [15,16,17]. Meanwhile, arsenic contamination has been recorded in over 70 nations across 6 continents [18]. Arsenic groundwater poisoning poses the biggest risk to human health since, for many communities, groundwater is their sole source of drinking water and agriculture.
The process of removing arsenic from water systems via adsorption is widely regarded as one of the most effective and well-respected methods currently available [19,20]. The Egyptians have been using carbonized wood as a medicinal adsorbent and purifier since the year 1500 B.C [21]. Arsenic species in aqueous systems may react chemically or physically with the right adsorbents. Physical adsorption often occurs due to the attraction of adsorbates and adsorbents through Van Der Waals forces. Changing solvents, sonication, or calcination may readily overcome this force. Instead, in the field of chemisorption, actual chemical connections are created between adsorbents. That is why it is common to practice utilizing a chemical process for regenerating used adsorbents [3].
Different adsorbents, including activated carbon [22], resin ion exchange [23], metal oxides [24], and biosorbents [25], have been reported for the removal of arsenic ion species. Moreover, some researchers try to anticipate equilibrium data by using the best isothermal adsorption model, and they do this by using the least squares formula [26,27]. As part of the nonlinear regression process, the error variance between the experimental data and the anticipated isotherm is minimized. However, the use of linear isotherm and kinetic models to explain experimental data has numerous drawbacks. In the first place, the complexity of the regression analysis may increase if three or more parameters are involved [28]. Second, nonlinear equations may include large errors when transformed into linear equations due to changes in the error variances and normality assumptions in conventional least squares [29]. This means that the nonlinear regression method is the most effective tool for selecting appropriate isotherm and kinetics models [20,27]. There are, to the best of our knowledge, just a few critical studies that directly compare nonlinear and linear models for As(V) adsorption isotherms and kinetics utilizing dried bacterial biomass as an adsorbent. These findings have the potential to greatly improve our comprehension of nonlinear and linear models applicable to laboratory adsorption.
In recent years, there has been a rise in research into low-cost adsorbents, such as biosorbents and industrial waste and by-products, which is crucial for addressing the gap in effective and inexpensive treatment in the majority of arsenic-affected areas. Therefore, biosorbents were used in the majority of published investigations, followed by metal oxides and nanocomposites [30]. The drawbacks of commercially available adsorbents, such as activated carbon, are high manufacturing costs and difficulties in regeneration, resulting in a rise in treatment costs [31]. To increase adsorption capacity and adsorption rate, researchers often coat a common and inexpensive substance to make it into an adsorbent. Iron, alumina, and other metals, including zirconium and manganese, are often used as coatings. In addition to their higher adsorbent capacity, iron-impregnated adsorbents are safe, cheap, and easy to use [32]. Therefore, biosorption is a potential approach for treating wastewater because biosorbents are naturally occurring materials or waste biomass, as well as their high adsorption capability and cheap [33]. The bioadsorbents category consists of biochar, agricultural waste, plant biomass, and microbial biomass [34].
The current study set out to determine the efficacy of employing dried bacterial biomass (DBB) of native arsenic-resistant bacteria to extract As(V) from an aqueous solution under a variety of circumstances of operation. Contact time, temperature, pH, adsorbent dosage, and starting concentration were among the many variables studied for their effects on As(V) adsorption potential to find the optimal conditions for As(V) removal. Additionally, FTIR and FESEM-EDX analyses have been performed to learn about the function groups employed for removing As(V) and the morphological changes in dried bacterial biomass before and after adsorption. In addition, isotherms and kinetics adsorption models are the best tools for comprehending adsorption processes and evaluating adsorption system performance. Thus, the experimental equilibrium data were analyzed using both nonlinear and linear regression methods to determine the most appropriate isotherm and kinetic.

2. Materials and Methods

2.1. As(V) Analysis

Arsenate (V) in the solution was determined by modifying the molybdenum blue method, as described in our previous study [35]. By adding 400 μL of the sample to 600 μL of the reaction mixture [(0.136 g) C8H10K2O15Sb2, (6 g) (NH4)6Mo7O24, (10.8 g) C6H8O6 (10.8 g), and (67.3mL) H2SO4 96.0% per liter], the concentration of As(V) remaining in the solution was calculated from the slope and intercept of the standard curve.

2.2. Preparation of Dried Bacterial Biomass of WS3 (DBB)

Indigenous arsenic-resistant Bacillus thuringiensis strain WS3 was grown in the LB medium up to the early exponential phase. The bacterial biomass was then prepared as described by Altowayti et al. [36]. Afterward, the dried biomass is washed with acid to expel the attached arsenic during the growth period [37]. Finally, the washed biomass was dried at 70 °C for 15 h and kept in the desiccators, and used for further experiments.

2.3. Optimization of As(V) Removal

2.3.1. The Impact of Contact Time on the Removal of As(V)

By placing 5 mg of DBB in 5 mL of As(V) liquid in 100 mL conical flasks and shaking at 150 rpm at 37 °C, the impact of contact time on the Removal of As(V) was studied. One milliliter sample was taken every two hours. After centrifuging the solution (1 mL) for 15 min at 10,000 rpm (9391 rcf) and 4 °C to separate the biomass, the As(V) concentration was determined. Using the same methods described above, the residual As(V) concentrations in the solution were determined. From a graph of the adsorption percentage of As(V) vs. the contact time, the optimum contact time was calculated (h).

2.3.2. The Impact of Initial Concentration on the Removal of As(V)

The As(V) concentrations ranged from 0 to 12 ppm, and 5 mL volumes were used in 100 mL conical flasks containing 5 mg of DBB and shaking at 150 rpm at 37 °C. At the optimal contact period, 1 mL samples with varying As(V) concentrations were collected. After 15 min of centrifugation at 10,000 rpm (9391 rcf) and 4 °C, the biomass was separated from the solution, and the As(V) concentration was determined. The optimum concentration was derived using a plot showing the percentage of As(V) adsorption versus the various starting As(V) concentrations.

2.3.3. The Impact of pH on the Removal of As(V)

Five milliliters of As(V) solution were made in 100-milliliter conical flasks using 1 milliliter of HCl and 1 milliliter of NaOH for each of the following pH ranges: 4, 5, 6, 7, 8, and 9. Using a fixed mass of DBB, the As(V) solutions were stirred, left at 37 °C, and shaken at 150 rpm (3 mg). After centrifuging the solution (1 mL) for 15 min at 10,000 rpm (9391 rcf) and 4 °C to separate the biomass, the As(V) concentration was determined. Maximum adsorption of As(V) was observed at a certain pH, which was used to establish that value.

2.3.4. The Impact of Temperature on the Removal of As(V)

It has been hypothesized that the effectiveness of As(V) adsorption varies with temperature [35]. The optimal temperature for As(V) adsorption was analyzed by adding 3 mg of DBB in a 5 mL solution to 100 mL conical flasks and incubating them at temperatures ranging from 10 to 60 °C with a rotational speed of 150 rpm. To determine the optimal temperature for analysis, 1 mL samples were taken after optimum contact time. After centrifuging the 1 mL solution at 10,000 rpm (9391 rcf) and 4 °C for 15 min to separate the biomass, the concentration of As(V) in the residual solution was determined. The optimum temperature was calculated using a graph showing As(V) adsorption (percent) vs. temperature.

2.3.5. The Impact of Adsorbent Dosage on the Removal of As(V)

At the optimum temperature, pH, and starting concentration of As(V), 5 mL As(V) solutions containing varying dosages of DBB (1–5 mg) were incubated until equilibrium was attained at 150 rpm. At the optimal contact time, 1 mL of liquid was taken at various biomass concentrations, and the biomass was removed by centrifugation for 15 min at 10,000 rpm (9391 rcf) and 4 °C. After removing the biomass from the solution, the As(V) concentrations in this solution were determined. The optimum biomass dosage was determined by plotting adsorption percentages of As(V) against various biomass doses.

2.4. Batch Model Study

The following equation was used to get the percentage of adsorbed As(V) as a function of the concentration difference between before and after adsorption [38]:
R   ( % ) = C i C e C i   ×   100  
In addition, the combined adsorption capabilities of DBB for As(V) were determined by using the following equation for the data. These capacities are expressed as qe mg/g [37]:
qe ( mg / g ) = C i C e M   ×   V
where:
Ci: Amount of As present at the beginning, expressed in mg/L
Ce: final As(V) concentration in mg/L.
V: The solution’s volume in (L).
M: The amount of adsorbent in (g)

2.5. Comparison of FTIR and FESE-EDX Characterization Results for DBB before and after Adsorption of As(V)

Fourier transform infrared spectroscopy study was carried out to determine whether or not the cell wall surface of DBB included a variety of distinct functional groups. From 400 to 4000 cm−1, FTIR spectra were taken and compared to the appropriate reference spectrum. The FTIR spectra of DBB before and after adsorption of As(V) were obtained by combining the DBB and KBr in the proportion of 1:100 and exposing the mixtures to a pressure of 5 tonnes by hydraulic pressure for 3 min. This process was repeated before and after the adsorption of As(V). In addition, for the FESEM-EDX analysis, the DBB was centrifuged, washed in ultrapure water, and then dried in an oven at 70 degrees Celsius for 15 h. This was done both before and after the adsorption of As(V). After that, the DBB was placed on a holder made of carbon conductive adhesive tapes and coated with platinum using a sputter coater. Following that, a comparison was made between the cell morphology and the amount of As(V) adsorbed in the bacterial cell wall before and after adsorption.

2.6. Studies of Linear and Nonlinear Isotherm and Kinetic Models

For 8 h at 37 °C with shaking at 150 rpm, the best adsorbent of DBB was combined with several doses of As(V) (0–12 ppm). The adsorptive isotherm of As(V) was characterized using the linear and nonlinear Langmuir and Freundlich models. In addition, nonlinear and linear pseudo-first-order and pseudo-second-order models were used to increase the kinetic adsorption rates of As(V) at different incubation durations (2, 4, 6, 8, and 10 h). Centrifugation at 10,000 rpm (9391 rcf) for 15 min at 4 °C was used to separate the adsorbent (DBB) from the solution in a centrifuge 5424 (Eppendorf) Eppendorf® 5424700004 (EU). In addition, Correlation coefficient R2, represented by the symbol R2, is a common statistical measure of the quality and degree of fit between actual experimental data and the expected model output, as indicated by Equation (3):
R 2 = i = 1 N ( Y a c t u a l i Y m o d e l m e a n ) 2 i = 1 N ( Y m o d e l i Y a c t u a l m e a n ) 2 i = 1 N ( Y a c t u a l i Y m o d e l m e a n ) 2  
where:
Y a c t u a l i : The actual As(V) removal obtained by the experiments
Y m o d e l i : The expected As(V) removal obtained by the model
Y m o d e l m e a n   : The average rate of the removal of As(V).
N: The total number of tests performed.

3. Results and Discussion

3.1. Optimization of As(V) Removal

3.1.1. The Impact of Contact Time on the Removal of As(V)

In batch adsorption, contact time is a crucial process parameter. As can be seen in Figure 1a, the contact duration has a direct impact on the efficiency with which As(V) is removed. The initial adsorption rate grew rapidly, and by 8 h, As(V) (6 ppm or 70%) had been removed at maximum efficiency. Adsorption capabilities rose from 46% to 70% as contact duration went from 2 h to 8 h. As(V) ions were removed in two phases: first quickly and then more slowly. Adsorption appeared to go quickly when the number of accessible sites was large in comparison to the number of As(V) ions to be adsorbed. Consequently, longer periods of contact between the adsorbate and adsorbent resulted in greater amounts of As(V) being adsorbed [39]. After the optimum period for contact time has passed; however, the active sides are already filled and equilibrium is attained; thus, any additional increase in contact time will not cause a significant change in the adsorption of As(V) [40,41]. As a result, the contact time will be set at 8 h for the subsequent experiments.

3.1.2. The Impact of Initial Concentration on the Removal of As(V)

Analysis of As(V) adsorption behavior was performed in the concentration range of 3–10 ppm. The total quantity of As(V) adsorbed per unit mass of DBB increased with an increasing initial concentration in the aqueous solution (Figure 1b). As a result, the starting concentration of As(V) was increased to a level where the removal percentage of As(V) was maximized at 78%, at 7.5 ppm. To overcome the mass transfer barrier of the adsorbate, the initial As(V) concentrations provide a driving force between adsorbate and Adsorbent [42]. Figure 1b shows that after reaching the optimal concentration, the removal percentage hardly changed. Since there is a finite number of active sites for a certain DBB dose, the absorption rate will naturally decrease as the number of accessible active sites depletes [43,44].

3.1.3. The Impact of pH on the Removal of As(V)

As(V) adsorption on DBB was investigated by testing it in a range of starting pH values (from 4 to 9). As can be observed in Figure 1c, As(V) was nearly completely removed (85%) at pH 7. Adsorbent capacity rapidly reduced with increasing pH, and As(V) removal was only 68% at pH 9. Over the pH range studied, anions made up the great majority of the As(V) species in solution (AsO4−3) (4–9) [45]. Consequently, the reduced As(V) adsorption at high pH was caused by the greater repulsion between the negatively charged As(V) (AsO4−3) and the more negatively charged DBB surface sites at high levels of pH [46,47,48].

3.1.4. The Impact of Temperature on the Removal of As(V)

The adsorption of As(V) was examined in the temperature range of 17–67 °C to determine the influence of temperature. Figure 1d shows that when temperatures rise from 17 to 37 °C, As(V) is removed more effectively. Increasing the temperature from 17 to 37 °C, for instance, improved removal efficiency in the optimal As(V) concentration of 7.5 from 53% to 88%. When temperatures rise from 37 to 67 °C, As(V) removal effectiveness falls from 88% to 75%. As a result, the DBB’s adsorption ability was diminished due to denaturation at very high temperatures [36]. In addition, the variations in temperature improved the adsorption capacity of the adsorbent, which was also found by other studies [35,49].

3.1.5. The Impact of Adsorbent Dosage on the Removal of As(V)

Figure 1e shows the effects that varying amounts of adsorbent DBB dosage had on the removal of As(V), with the adsorbent dose ranging from 0.25 to 1.5 mg. As the adsorbent dosage was raised from 0.25 mg to 0.5 mg, the removal efficiency of As(V) steadily improved from 84% to 94%. After the DBB dosage was raised beyond 0.5 mg, however, the removal efficiency of As(V) dropped. It is possible that this might be explained by the fact that the available binding sites were adequate to remove As(V) from the solution at the beginning, which resulted in an increase in the effective adsorption capacity. [20]. Conversely, increasing the dose of the adsorbent from 0.5 mg to 1.5 mg led to a continuing decline in the potential of As(V) adsorption, which resulted in a drop from 94% to 86%. This is for the reason that the existence of unsustainable high-energy adsorption sites has triggered a major decline in a huge proportion of the low-energy removal sites, which has resulted in a poor removal capacity. Consequently, this has led to a low removal capacity [50,51].

3.2. The Biomass Adsorption Capacity

As can be observed in Table 1, the removal potential (qe) was analyzed in this study and compared to that of other adsorbents that have been discussed in the previous research. In addition, DBB has a strong efficiency for removing As(V), with a maximum adsorption capacity of 14 mg/g. It was found that the bio-adsorbent of DBB had a higher removal capacity than any of the other adsorbents that are mentioned in the following table:
Table 1. As(V) removal from water using various adsorbents.
BioadsorbentsAs(V) mg/gReference
Acidithiobacillus ferrooxidans0.223[52]
Canna indica0.487[53]
Chitosan8[54]
Hibiscus rosasinensis0.432[53]
Functionalized
nanocrystalline
12.1[55]
Hydrilla verticilata11.65[56]
Stem of Tecomella
undulata
0.159[57]
Picea abies9.259[58]
DBB14This study
Figure 1. Effect of (a) contact time (h), (b) As(V) concentration (ppm), (c) pH, (d) temperature (°C), and (e) DBB dosage (mg) for As(V) removal. Standard deviations are averaged from three sets of data.
Metals 12 01664 g001

3.3. Analysis of DBB Using Fourier Transform Infrared Spectroscopy (FTIR)

Clarification of the function group participation in As(V) adsorption in the form of (AsO4−3) was achieved via the use of Fourier transform infrared spectroscopy (FTIR), which was performed at 400–4000 cm−1 [59]. According to FTIR analysis, the surface sites and possible functional groups, particularly the amide and amine groups and hydroxyl groups, are involved and participate in the adsorption of As(V) (AsO4−3) by DBB. As(V) was shown to interact with amino (NH) groups on the outside of the cell wall (Figure 2). The amine (-NH) bending was then used to align the observed peaks at 1626.14 cm−1, 1626.27 cm−1, and 1627.01 cm−1, which correspond to the amide group. Stretching at 3276.03 cm−1 reflected the hydroxyl (-OH) group, which shifted at a lower frequency of 3273.83 cm−1. Meanwhile, another investigation conducted by Dadrasnia et al. [60] discovered that a slight change in the peak from 3269.06 to 3269.24 confirms the chromium Cr(VI) adsorption on the surface of the dead cell of Bacillus salmalaya Strain 139SI. Furthermore, a minor change in the peak from 3269.06 to 3269.36 confirms Cr(VI) adsorption on the surface of the living cell of Bacillus salmalaya Strain 139SI. Moreover, another observed peak at 1452.74 cm−1 shifted to a higher frequency at 1453.35 cm−1 due to the complexation of As(V) ions (AsO4−3) with the nitrogen of the N-H group. Another study conducted by Haris et al. [20] for As (III) removal by biomass of psychrotolerant Yersinia sp. strain SOM-12D3 isolated from Svalbard, Arctic revealed that the peak changed before and after adsorption of As(III) from 1453 to 1054 by untreated biomass and from 1055 to 1056 by acid-treated biomass of Yersinia sp. strain SOM-12D3. Additionally, the 1028.96 cm1 peak was in phase with the amine group’s 1054.91 cm1 C-N stretching vibrations. On the other hand, another study done by Bahari et al. [61] for As(III) removal by Non-living Biomass of an Arsenic-Hypertolerant Bacillus cereus Strain SZ2 observed that the peak shift from 1059.49 to a lower frequency of 1058.12, and this small change in frequency confirms the complexation of As(III) on the surface of the bacteria cell. The fingerprint region peaks also shifted, going from 564.06 cm1 to 561.77 cm−1. The amide group complexed with As(V) ions shifted the 1525.73 cm−1 peak to a lower frequency of 1525.51 cm−1.

3.4. Comparative FESEM-EDX Study of DBB before and after As(V) Adsorption

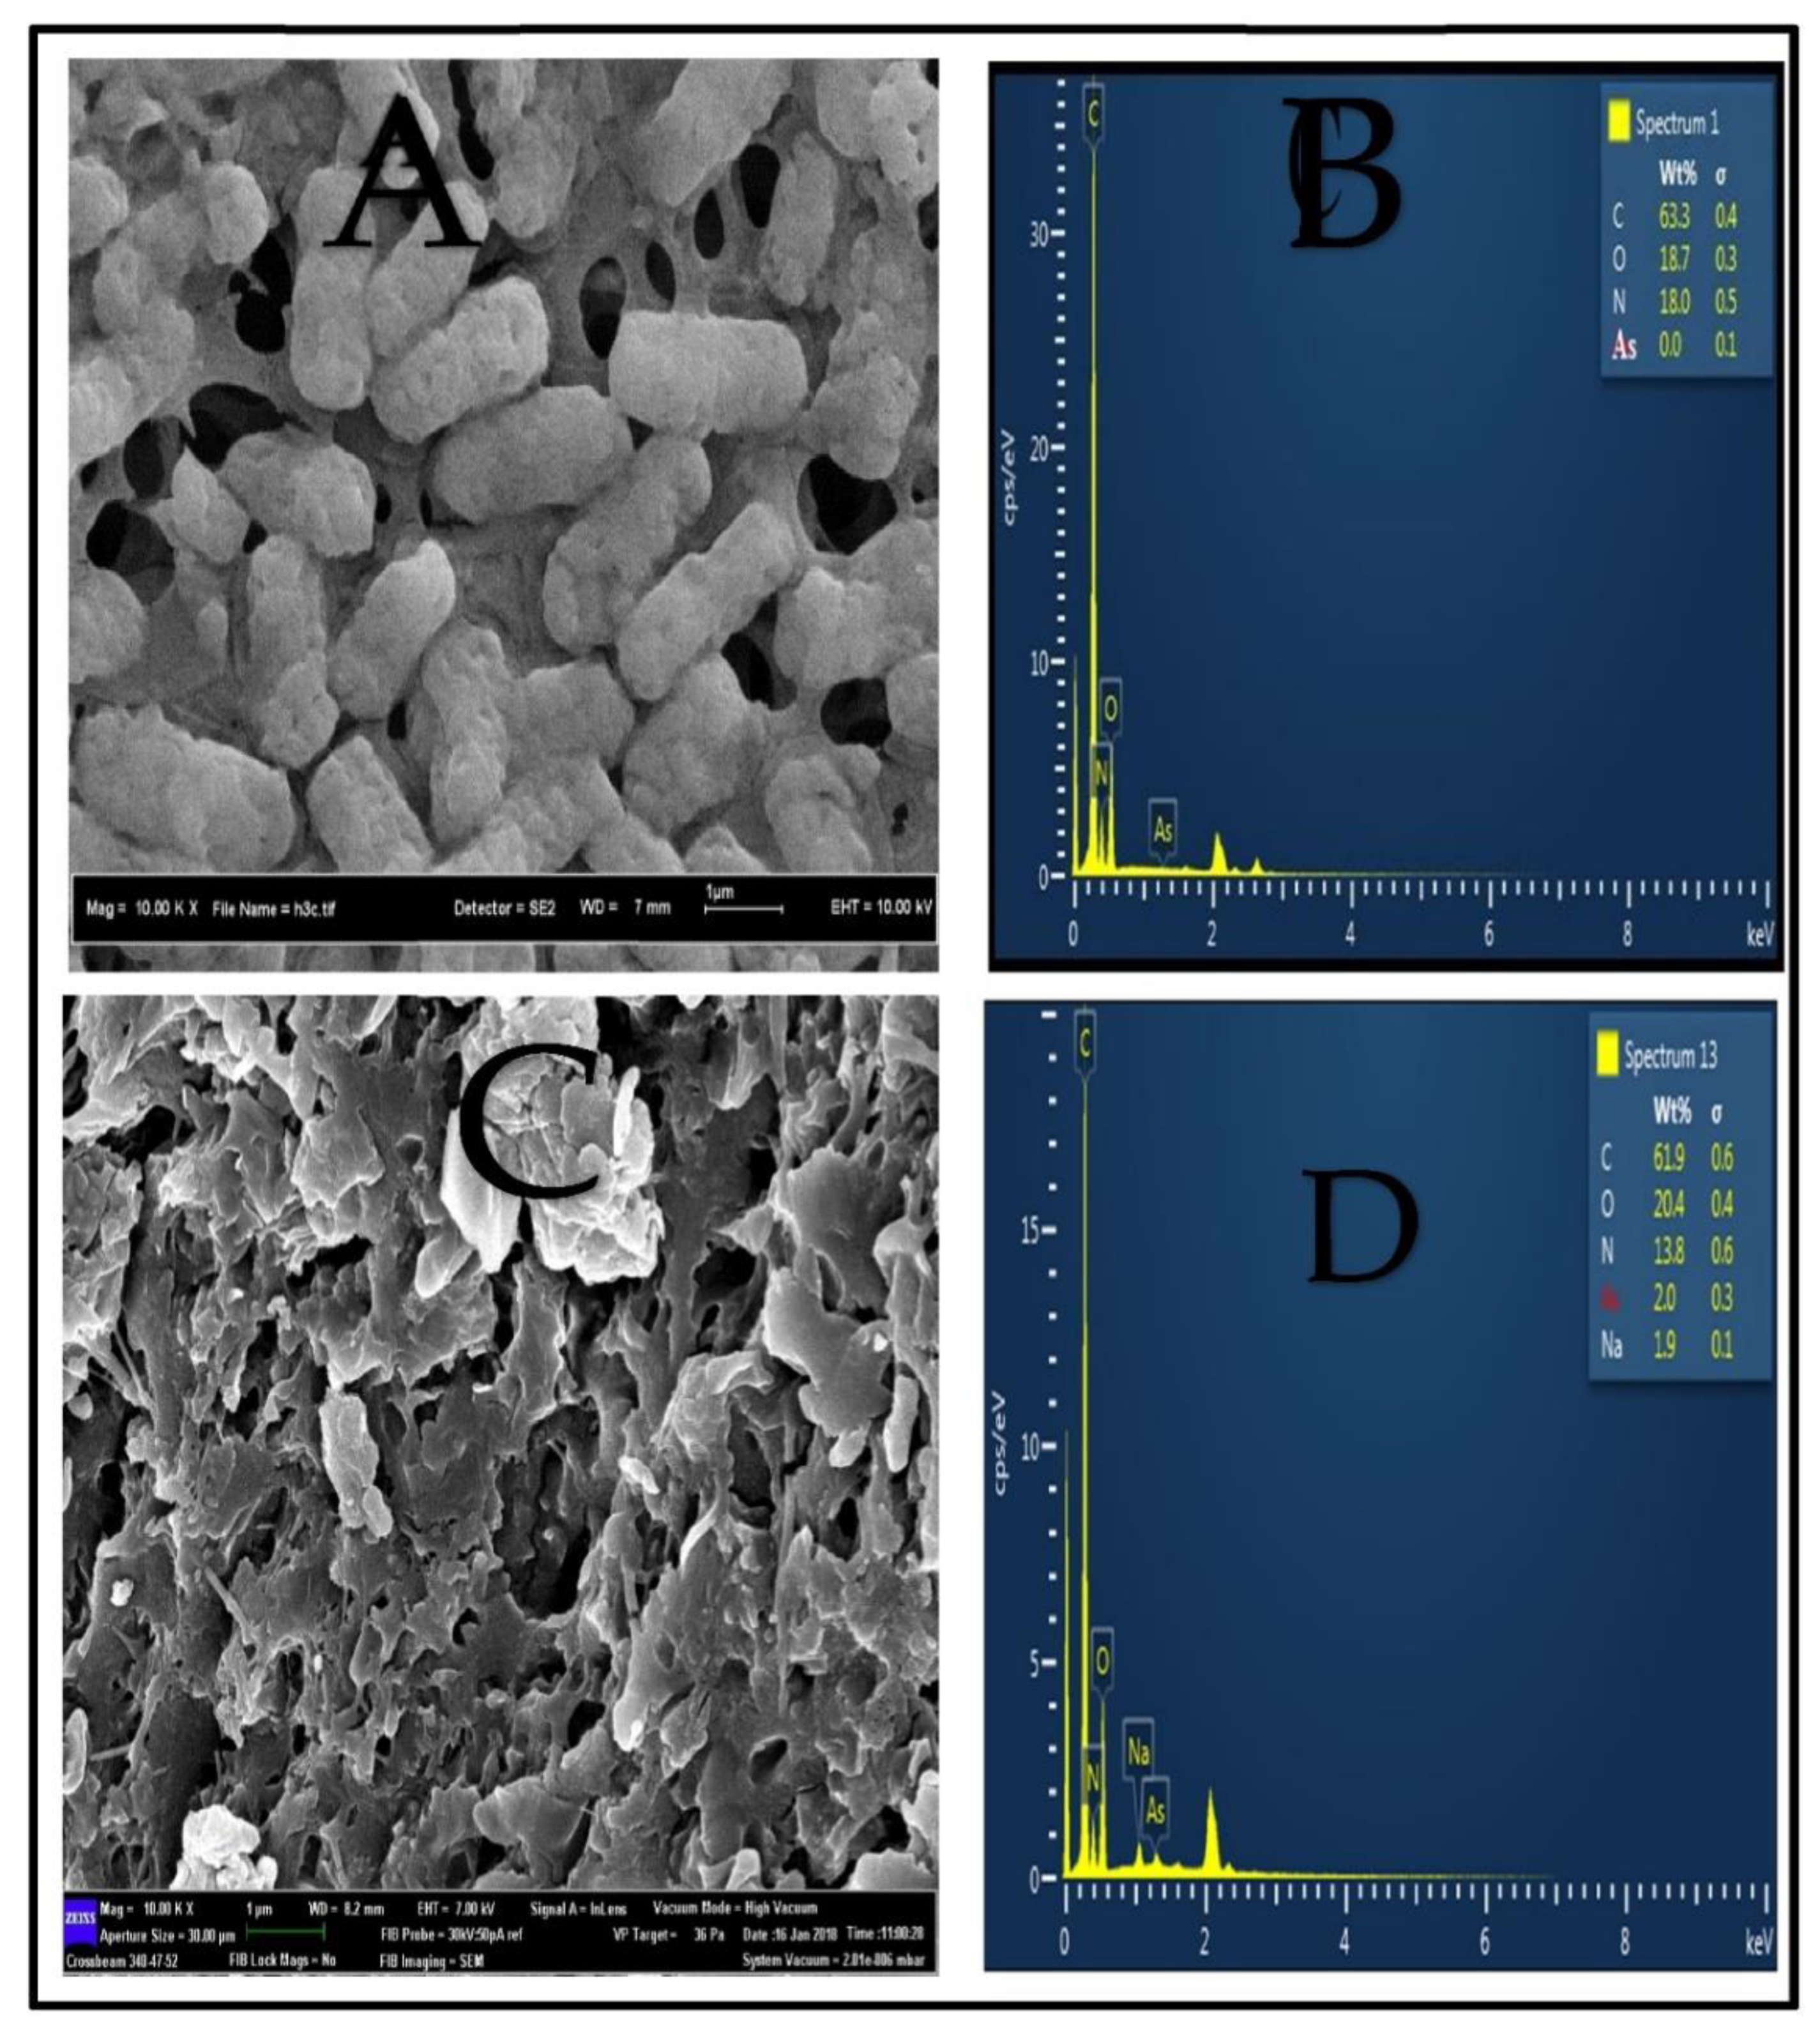
The surface morphology of DBB was analyzed using FESEM both before and after the adsorption procedure, and the results are displayed in (Figure 3A,C). Prior to the adsorption of As(V), the morphological characteristics of DBB were rod-shaped and thin (Figure 3A). Following the consumption of As, it has been discovered that the cells undergo dramatic morphological changes for the As(V). Due to the attachment of As(V) to the cell surface, the resultant covering of As(V) ions on the cell surface had the appearance of being spongy and plumped (Figure 3C). Additionally, the adsorption of As(V) was confirmed by the EDX analysis for DBB before and after the adsorption of As(V), which showed an As(V) peak in the spectra for DBB after the adsorption of As(V) (Figure 3D), despite the fact that no such peak was observed on the DBB surface prior to the adsorption of As(V), which indicates that As(V) was deposited on the cell surface (Figure 3B). This result agrees with the report of Haris et al. [20], who observed that arsenic adsorbed on the surface of pre-treated biomass of psychrotolerant Yersinia sp. strain SOM-12D3 isolated from Svalbard in the Arctic. Moreover, a similar type of observation was reported by Bahari et al. [61] and Altowayti et al. [35]

3.5. Adsorption Isotherms Models

To improve the process of adsorption system development to remove As(V), it is required to build the most appropriate correlation for equilibrium curves, such as adsorption isotherms (V). The experimental data of the quantity of As(V) adsorbed on the DBB was replaced by the nonlinear and linear Langmuir and Freundlich equilibrium isotherm models to select the model that best fits the adsorption process.

3.5.1. Comparison of the Linear and Nonlinear Langmuir Isotherm Model
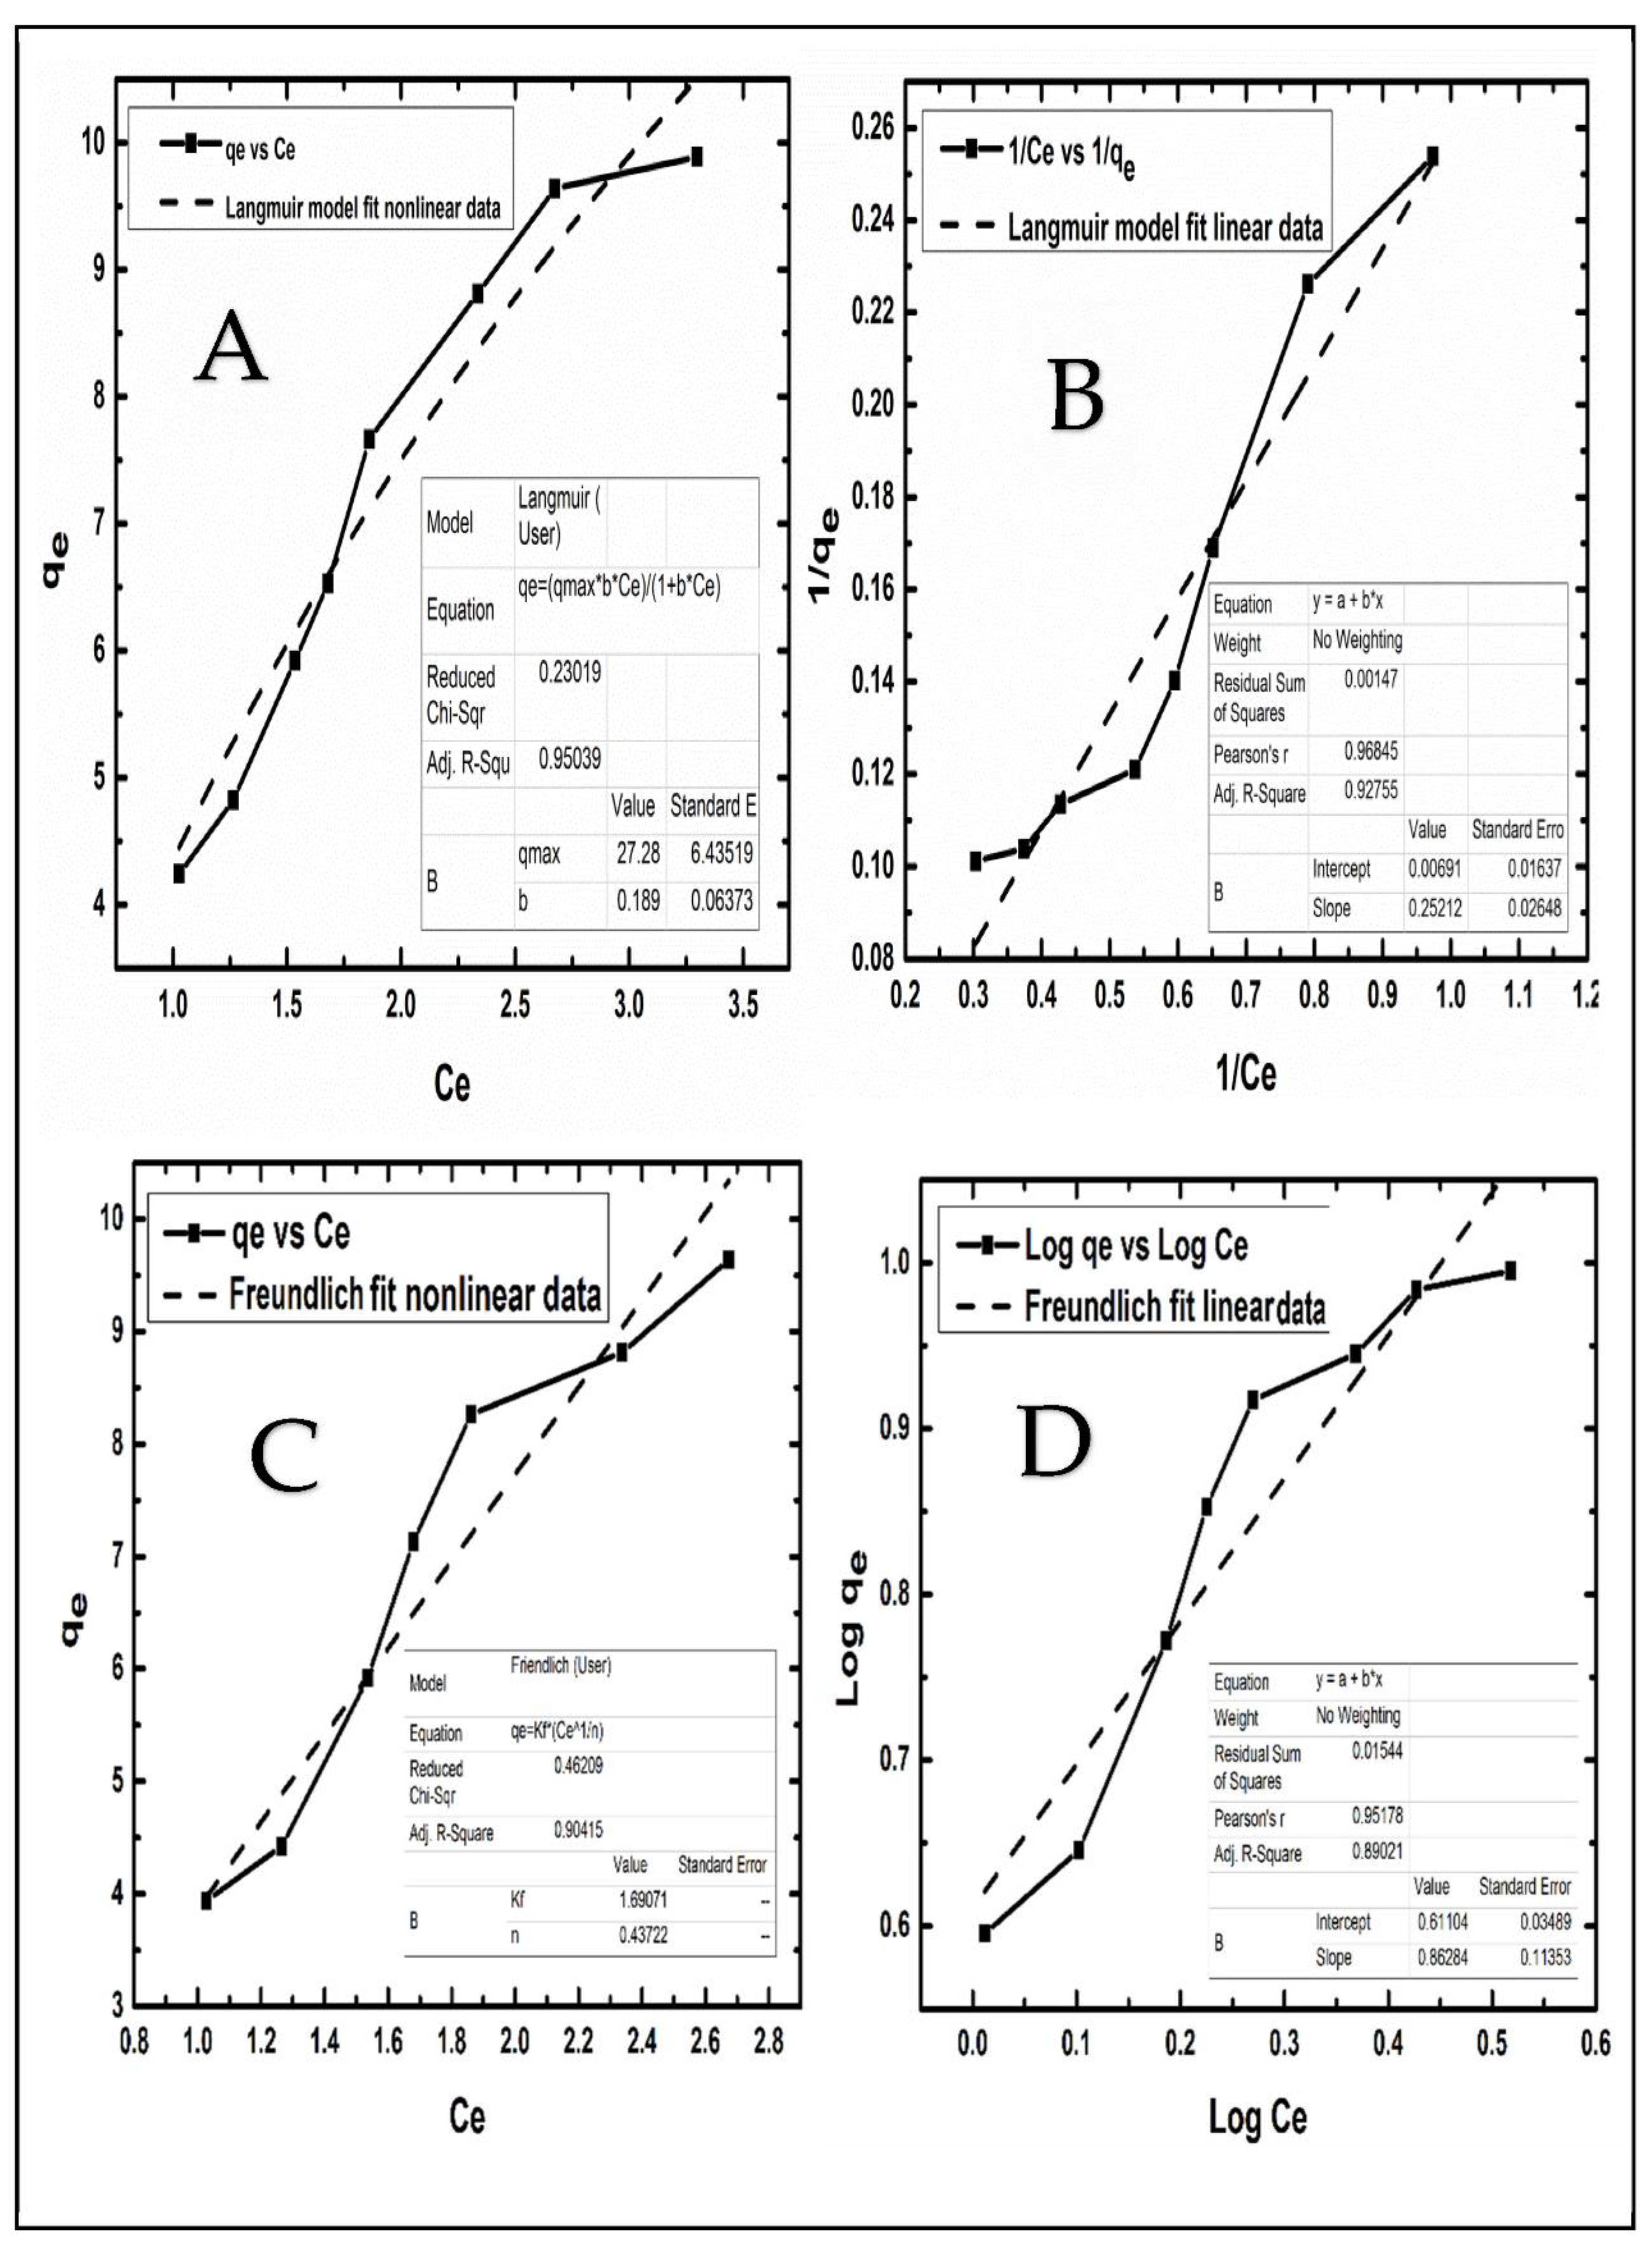
According to the fundamental premise of the Langmuir concept, it is presumed that the adsorption process takes place on the adsorbent in the form of individual monolayers that are homogeneous [62,63]. There are ways to represent both nonlinear and linear isothermal models, as shown in Table 2. Using the OriginPro 9.0 software, the (qmax) (amount of As(V) adsorbed per unit mass of DBB (mg g−1)) and b (Langmuir constant) were calculated for the nonlinear model by fitting the qe versus Ce plot curve, and the (b) (Langmuir constant) was calculated for the linear model by fitting the 1/qe versus 1/Ce Ce plot curve. Both of these calculations are shown in (Figure 4A,B). The qmax for the nonlinear Langmuir model was 27.28, and it was 144 for the linear Langmuir model; however, b was 0.189 for the nonlinear model, while it was 0.028 for the linear model. In contrast, the R2 value of the nonlinear model was 0.95, which was higher than the R2 value of the linear model (0.92). Because of this, the nonlinear model will better fit the adsorption data obtained from experiments than the linear model.

3.5.2. Comparison of the Linear and Nonlinear Langmuir Isotherm Model
Freundlich adsorption isotherms have been created for heterogeneous processes, and they give a concept of multilayer adsorption on the surface of the adsorbent [51,64]. Table 2 provides a representation of both the nonlinear and linear models developed by Freundlich. Using the software OriginPro 9.0, the parameters for the Freundlich isotherm were determined using both its nonlinear and linear forms. Plotting qe against Ce allowed for the estimation of the parameters of the nonlinear Freundlich model (Figure 4C). Plotting log qe vs. log Ce allowed for the calculation of the linear Freundlich isotherm constant parameters (Figure 4D). According to the results of the current investigation, the Freundlich Adsorption Potential, or Kf, was 1.69 for nonlinear models and 4.08 for linear models. Therefore, the (Kf) is an example of the function that indicates whether or not the adsorption conditions are favorable. According to the findings of our research, adsorption is thought to have a good chance due to the KF value being between 1 and 20 [40]. Moreover, if the value of n is larger than 1, the adsorption strength, which is represented by the number n, shows that the model is suitable for use in the adsorption process [21]. In contrast, a value of n of 0.437 was found for the nonlinear model, whereas 1.16 was found for the linear model. The plotted R2 value, however, shows that the nonlinear model (Figure 4C) is preferable to the linear model (Figure 4D) in demonstrating the great fitness of this model for the adsorption of As(V) onto DBB. This is because the R2 value for the nonlinear model (0.904) was higher than the R2 value for the linear model (0.899).
Additionally, the adsorption of As(V) took place on the monolayer of DBB due to the large R2 for the Langmuir isotherm in comparison to the Freundlich isotherm. Additionally, many researchers have found results that are consistent with this [20,36,61]. In addition, Altowayti et al. [27] compared the findings of Zn (II) equilibrium adsorption using the linear least-square technique and the nonlinear isotherm approach. He concluded that the nonlinear models a more effective way to acquire isotherm parameters than the linear models.
Figure 4. DBB was used to develop nonlinear and linear models of As(V) adsorption from water. (A) Langmuir isotherm model fit nonlinear data, (B) Langmuir isotherm model fit linear data, (C) Freundlich isotherm model fit nonlinear data and (D) Freundlich isotherm model fit linear data.
Metals 12 01664 g004

3.6. Kinetic Models of Adsorption Reactions

The kinetic models are presented to determine the connection between the kinetic adsorption capacity qt (mg/g) and the time t (min) [65,66]. Two of the most common models, known as pseudo-first-order and pseudo-second-order rate, were used to analyze the kinetics of the adsorption of As(V).

3.6.1. Comparison of a Linear and Nonlinear Pseudo-Second-Order Rate Model

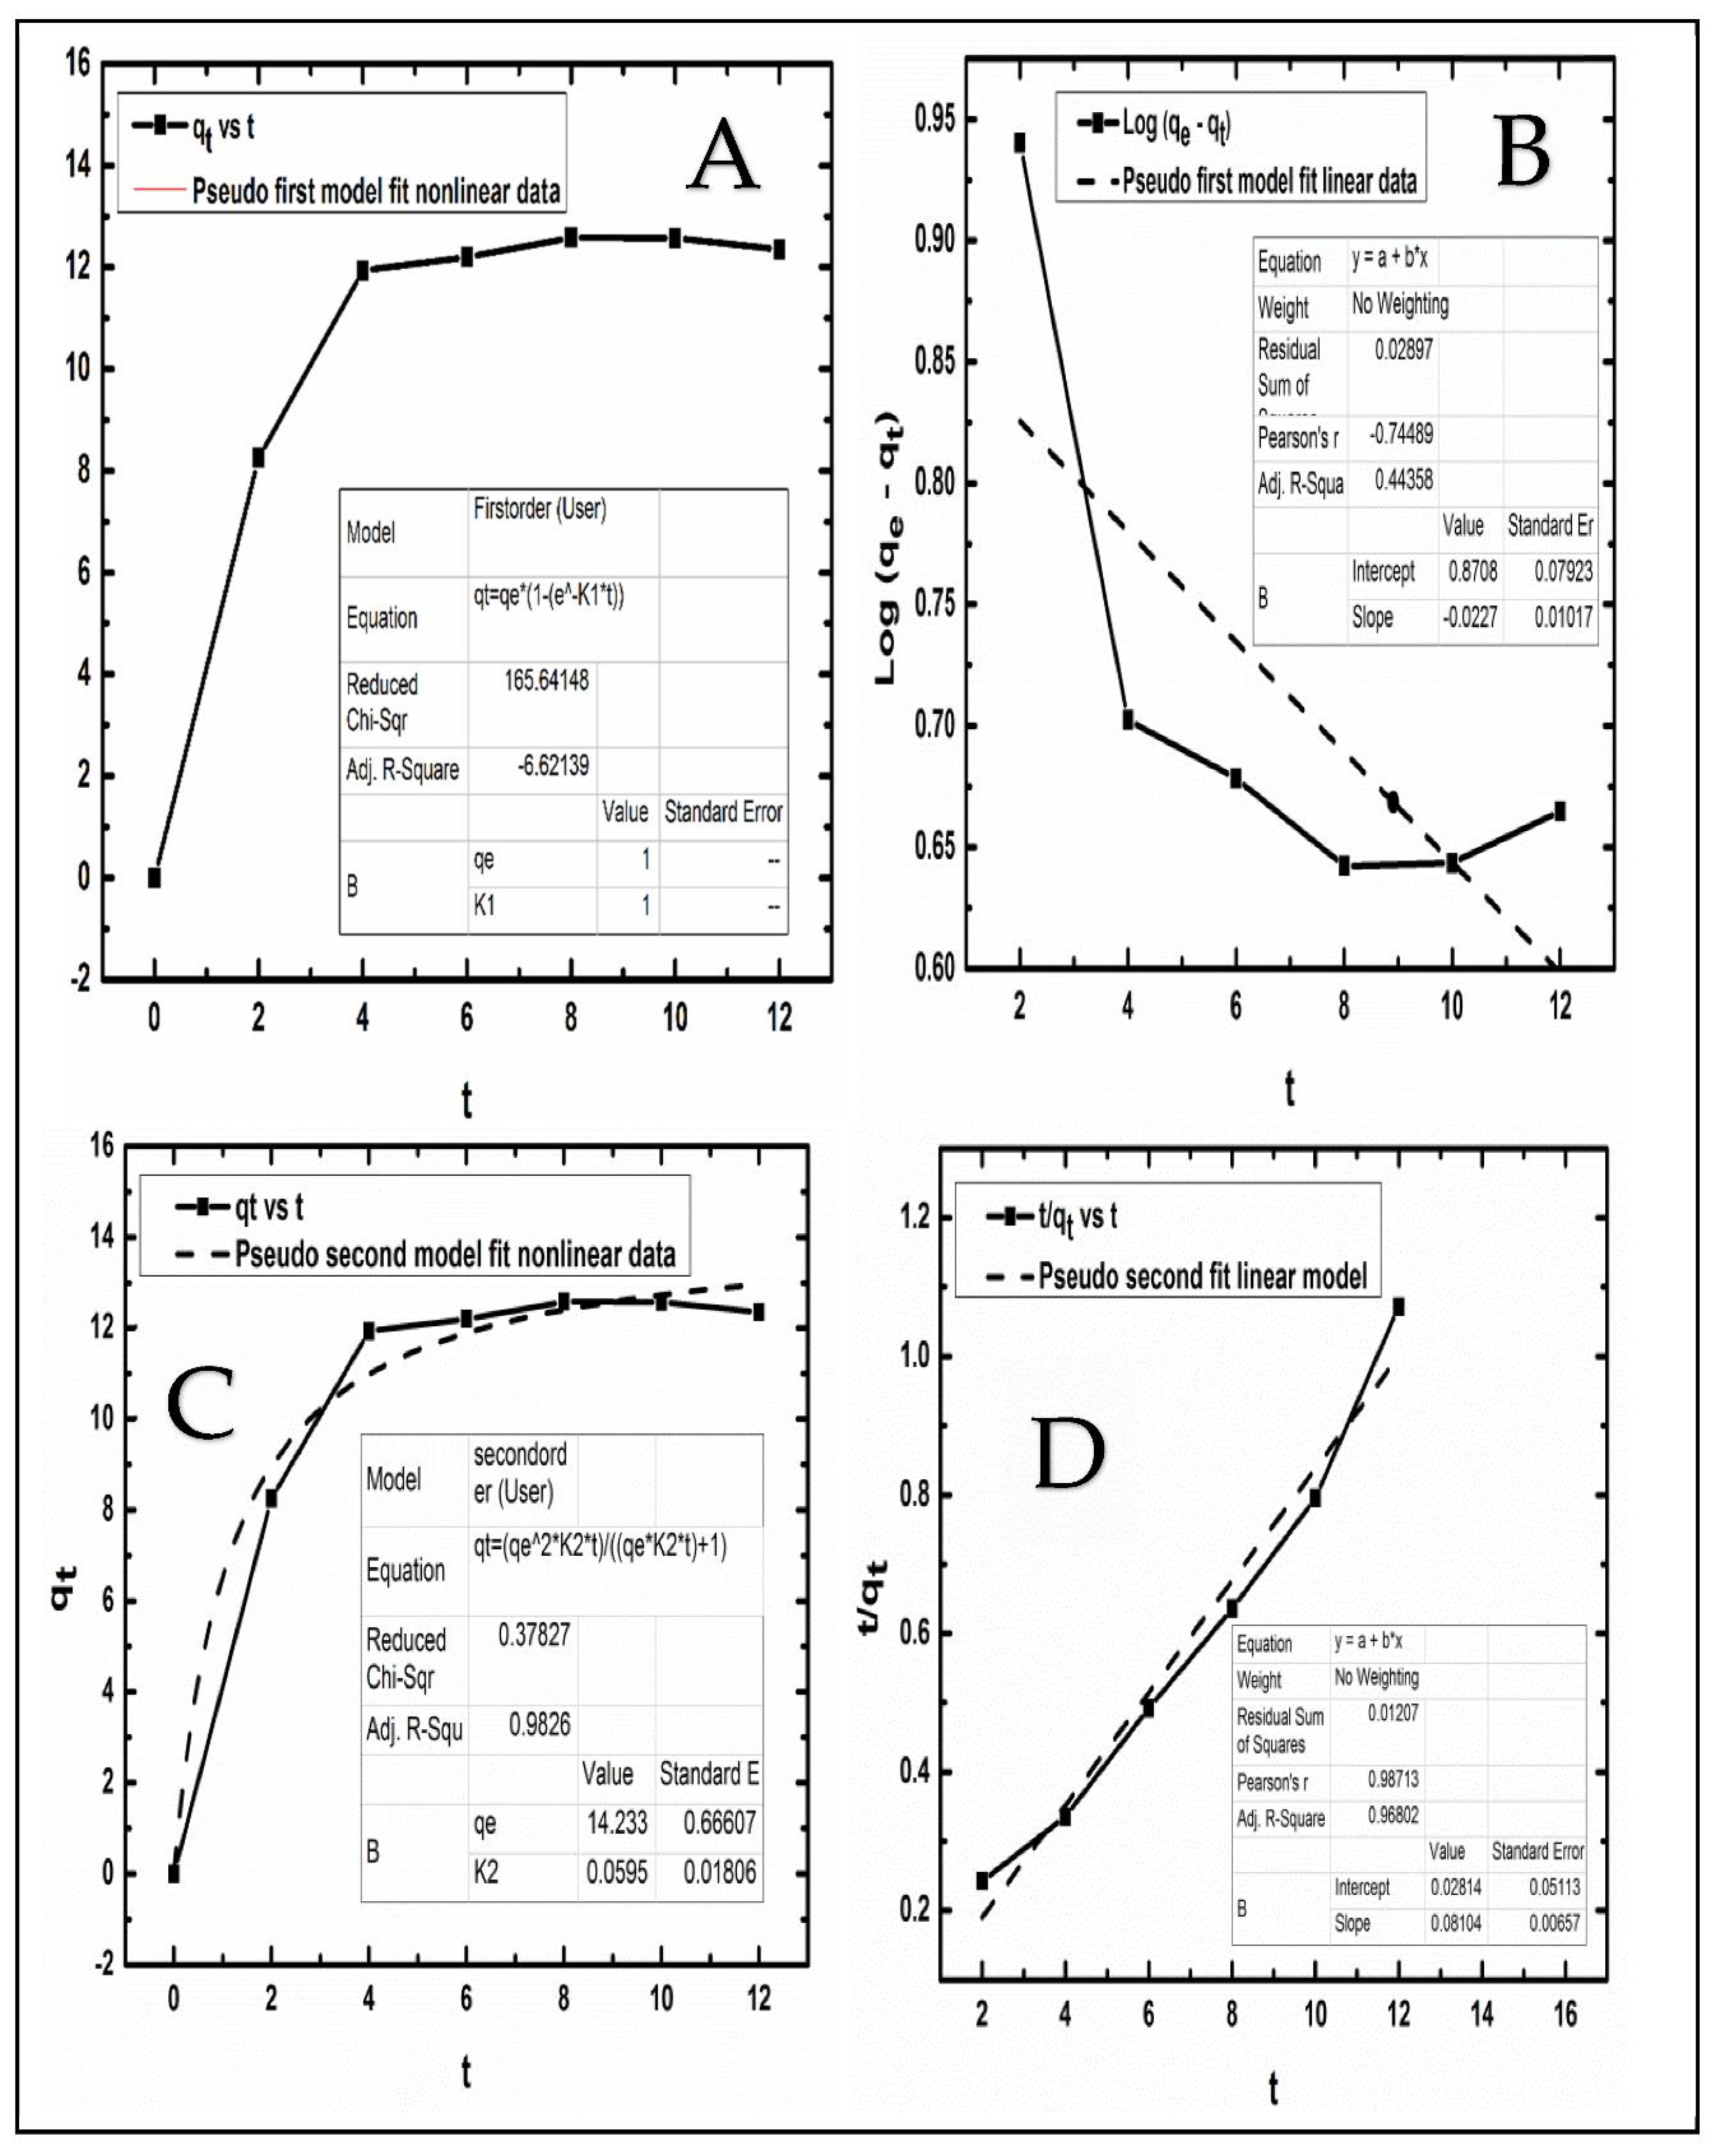
A nonlinear and linear model of the pseudo-first-order rate, which determines the adsorption rate in light of the adsorption capacity, has been applied to the kinetic data [67]. Both the nonlinear and linear models were often presented in the same way, as seen in Table 2. If the pseudo-first-order kinetics are accurate enough, a high R2 value should be obtained from a plot of qt vs. t for the nonlinear model and a plot of log (qe-qt) vs. t for the linear model. Both plots should be compared to time. However, since R2 was so low for both models, the connection between the initial concentration of As(V) and the adsorption rate did not fit either the nonlinear or the linear model. This was owing to the fact that As(V) is an unstable ion (Figure 5A,B). This demonstrated that a first-order process could not be used to adequately characterize the adsorption of As(V) ions on DBB. Others have also reported outcomes that are comparable to these [35,68].

3.6.2. Comparison of the Linear and Nonlinear Langmuir Isotherm Model

In most cases, the kinetics of adsorption were described by the pseudo-second-order rate of nonlinear and linear models, as stated in Table 2. Using the OriginPro 9 program, the pseudo-second parameters were found by plotting qt vs. t for a nonlinear model and plotting t/qt vs. t for a linear model. Both of these plots were done against time. As a result, the values for qe and K2 in the nonlinear model were 14.23 and 0.0595, whereas the values for the same variables in the linear model were 4.4 and 0.0593. In addition, the adsorption of As(V) ions on DBB was suited to be described by the nonlinear pseudo-second-order rate model since it had a better R2 value, as shown in (Figure 5C,D). This can be seen in (Figure 5C,D). In contrast, the findings of the experiment were better described by the pseudo-second-order rate than by the pseudo-fist order rate, which indicated that chemisorption was responsible for the adsorption of As(V). In addition, a number of studies have shown that nonlinear models are often the most accurate representations of functional models [20,21,27].
Figure 5. Adsorption of As(V) from aqueous solution: a comparison of DBB’s nonlinear and linear kinetic models. (A) Pseudo First model fit nonlinear data, (B) Pseudo First model fit linear data, (C) Pseudo Second model fit nonlinear data and (D) Pseudo Second model fit linear data.
Metals 12 01664 g005
Table 2. Isotherms and Kinetics Models in Nonlinear and Linear Forms.
Nonlinear ModelPlotLinear ModelPlot
Langmuir q e =   q m a x   b C e   1 + b C e q e vs. C e 1/qe = (1/qmax + 1/b qmax. 1/Ce)1/qe vs. 1/Ce
Freundlichqe = KF Ce (1/n) q e vs. C e Log qe = Log KF + 1/n log CeLog qe vs. log Ce
Pseudo First q t = q e ( 1 e K 1   t ) q t vs. t log   ( q e q t ) = log   q e K 1 2.303 t log (qe − qt) vs. t
Pseudo Second q t = q e 2 K 2 t q e K 2 t + 1 q t vs. t t q t = 1 K 2   q e 2 + 1 q e   t t/qt vs. t

3.7. Comparison of Nonlinear and Linear Models

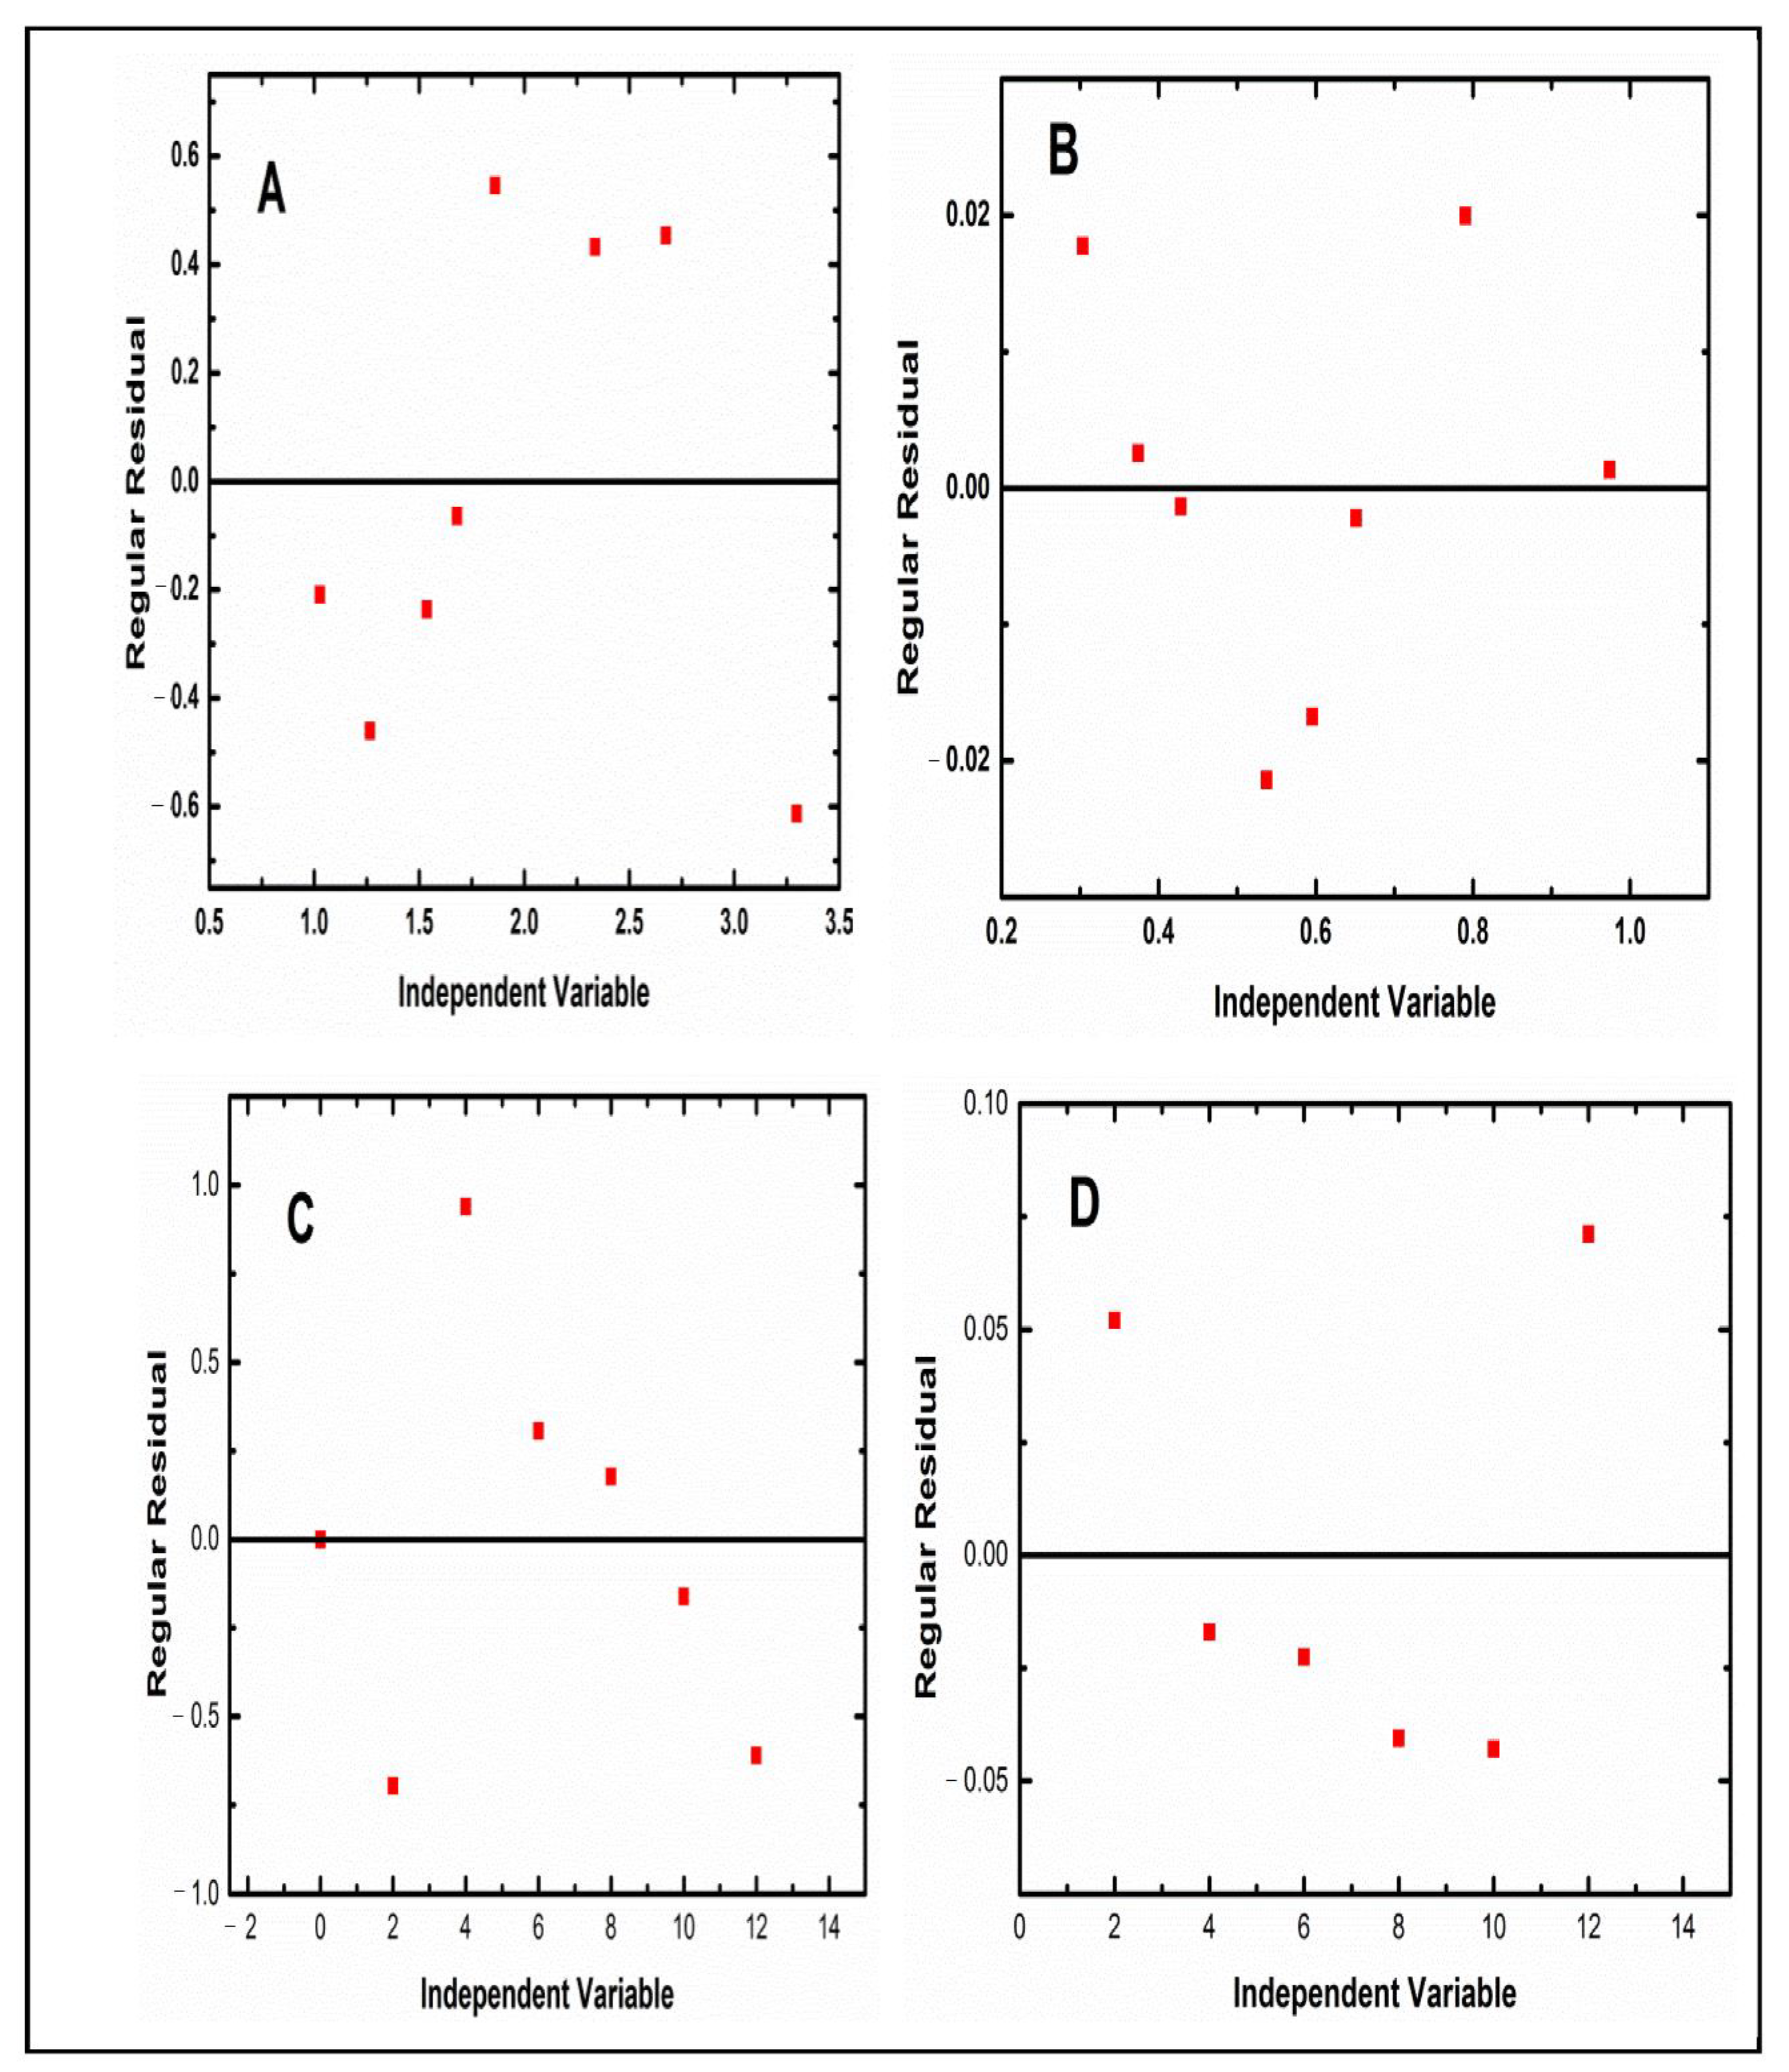
For testing isotherm and kinetic models against adsorption data, the linear technique has generally been chosen owing to its ease of implementation in most adsorption systems. Parameter estimates are affected by how the dependent variables are oriented along their respective axes. Isotherm and kinetics models fail because the regression results are altered by another axis, breaking both accuracy and continuity [20,63,69,70]. The linear method also presumes that the error distribution is uniform across all x-values and that the scatter vertical points along the rows follow a Gaussian distribution [35,71]. The nonlinear approach may be used without difficulty to turn nonlinear isothermal and kinetic equations into linear forms. To properly and dependably depict an isothermal and kinetic model, it is reasonable to use the nonlinear method. Approximating the parameters of an isotherm and kinetic model is possible using the nonlinear method. It has also been suggested in other research that linear equations are the root source of problems and errors in the real world, with isotherm and kinetic model failures the end consequence of uncertainty and the complexity of simultaneous data translation [72,73,74]. When compared to the linear model, the R2 values of the nonlinear models for the kinetic and isotherm models were significantly higher than those of the linear model. As a result, making a prediction on the appropriateness of a certain set of equilibrium data is recommended. However, these limitations of the linear technique may be circumvented by using the nonlinear approach in the process of evaluating the findings of the experiments. This is due to the fact that the experimental equilibrium data on the nonlinear system are done on the same abscissa and ordinate in the set x- and y-axes. [20,75]. When comparing the nonlinear and linear Langmuir and the pseudo-second model using a scatter plot of the regular residual vs. the independent variable, the scatter was more organized below and above the line for the nonlinear model (Figure 6). Least squares are used to determine the most accurate models since they provide the most uniform error across all simulations and experiments. Nonlinear and linear isotherm and kinetic models were found to have distinct R2 values when compared in the current investigation. Values that are different from one another despite any similarities or differences in the underlying error structure of the underlying equations. As a result, parameter estimations are heavily impacted by the isotherm and kinetic linear models.

4. Conclusions

In the current study, it was shown that DBB has an excellent ability to remove As(V) from aqueous solution under the circumstances that were found to be optimal. In addition, the adoption of As(V) on the surface of the bacterial cell wall was verified by FTIR and FESEM-EDX analyses. In addition, the nonlinear Langmuir isotherm and the nonlinear pseudo-second-order rate model were both good representations of the experimental equilibrium data of As(V) onto DBB. Consequently, the investigation of adsorption equilibrium data by using a nonlinear regression model would be more reasonable and accurate under specific circumstances. A nonlinear model was shown to be a superior method for producing equilibrium adsorption data since this was the conclusion reached by this study.

Author Contributions

W.A.H.A.; Conceptualization, data curation, formal analysis, resources, visualization, writing—original draft, writing—review and editing A.A.S.; software, validation, resources, A.M.A.-F.; data curation, formal analysis, resources, visualization, A.B.; resources, data curation, visualization, S.S.; supervision, resources, conceptualization, project administration, funding acquisition, H.A.T.; conceptualization, data curation, funding acquisition. All authors have read and agreed to the published version of the manuscript.

Funding

The Post-Doctoral Fellowship Scheme under Universiti Teknologi Malaysia (UTM) Professional Development Research University Grant (06E27).

Institutional Review Board Statement

Not applicable.

Informed Consent Statement

Not applicable.

Data Availability Statement

Not applicable.

Acknowledgments

The authors fully acknowledged the Ministry of Higher Education Malaysia (MOHE) and Universiti Teknologi Malaysia (UTM) for project funding, which makes this important research viable and effective. Wahid Ali Hamood Altowayti extends his gratitude to Universiti Teknologi Malaysia (UTM) for financial sponsorship and the Post-Doctoral Fellowship Scheme under UTM Professional Development Research University Grant (06E27).

Conflicts of Interest

The authors declare no conflict of interest.

References

  1. Asharuddin, S.M.; Othman, N.; Zin, N.S.M.; Tajarudin, H.A.; Din, M.F.M. Flocculation and antibacterial performance of dual coagulant system of modified cassava peel starch and alum. J. Water Process Eng. 2019, 31, 100888. [Google Scholar] [CrossRef]
  2. Ayob, S.; Othman, N.; Altowayti, W.A.H.; Khalid, F.S.; Bakar, N.A.; Tahir, M.; Soedjono, E.S. A review on adsorption of heavy metals from wood-industrial wastewater by oil palm waste. J. Ecol. Eng. 2021, 22, 3. [Google Scholar] [CrossRef]
  3. Nicomel, N.; Leus, K.; Folens, K.; Van Der Voort, P.; Du Laing, G. Technologies for arsenic removal from water: Current status and future perspectives. Int. J. Environ. Res. Public Health 2016, 13, 62. [Google Scholar] [CrossRef]
  4. Kartinen, E.O.; Martin, C.J. An overview of arsenic removal processes. Desalination 1995, 103, 79–88. [Google Scholar] [CrossRef]
  5. Smedley, P.L.; Kinniburgh, D.G. Source and behavior of arsenic in natural waters. In United Nations Synthesis Report on Arsenic in Drinking Water; World Health Organization: Geneva, Switzerland, 2001; pp. 1–61. [Google Scholar]
  6. van Halem, D.; Bakker, S.; Amy, G.; Van Dijk, J. Arsenic in drinking water: A worldwide water quality concern for water supply companies. Drink. Water Eng. Sci. 2009, 2, 29–34. [Google Scholar] [CrossRef] [Green Version]
  7. Jiang, J.-Q.; Ashekuzzaman, S.; Jiang, A.; Sharifuzzaman, S.; Chowdhury, S.R. Arsenic contaminated groundwater and its treatment options in Bangladesh. Int. J. Environ. Res. Public Health 2012, 10, 18–46. [Google Scholar] [CrossRef] [PubMed] [Green Version]
  8. ATSDR. ATSDR’s Substance Priority List. 2015. Available online: https://www.atsdr.cdc.gov/spl/resources/2015_atsdr_substance_priority_list.html (accessed on 29 August 2022).
  9. Robey, N.M.; Solo-Gabriele, H.M.; Jones, A.S.; Marini, J.; Townsend, T.G. Metals content of recycled construction and demolition wood before and after implementation of best management practices. Environ. Pollut. 2018, 242, 1198–1205. [Google Scholar] [CrossRef] [PubMed]
  10. Mandal, B.K.; Suzuki, K.T. Arsenic round the world: A review. Talanta 2002, 58, 201–235. [Google Scholar] [CrossRef]
  11. Flanagan, S.V.; Johnston, R.B.; Zheng, Y. Arsenic in tube well water in Bangladesh: Health and economic impacts and implications for arsenic mitigation. Bull. World Health Organ. 2012, 90, 839–846. [Google Scholar] [CrossRef]
  12. Kinniburgh, D.; Smedley, P. Arsenic contamination of groundwater in Bangladesh. Risk Manag. Healthc. Policy 2001, 11, 251–261. [Google Scholar]
  13. Amini, M.; Abbaspour, K.C.; Berg, M.; Winkel, L.; Hug, S.J.; Hoehn, E.; Yang, H.; Johnson, C.A. Statistical modeling of global geogenic arsenic contamination in groundwater. Environ. Sci. Technol. 2008, 42, 3669–3675. [Google Scholar] [CrossRef] [PubMed]
  14. Chun Ng, C.W.; Ismail, A.F.; Zaini Makhtar, M.M.; Fikri Jamaluddin, M.N.; Tajarudin, H.A. Conversion of food waste via two-stage fermentation to controllable chicken Feed Nutrients by local isolated microorganism. Int. J. Recycl. Org. Waste Agric. 2020, 9, 33–47. [Google Scholar]
  15. Azcue, J.M.; Nriagu, J.O. Impact of abandoned mine tailings on the arsenic concentrations in Moira Lake, Ontario. J. Geochem. Explor. 1995, 52, 81–89. [Google Scholar] [CrossRef]
  16. Button, M.; Moriarty, M.M.; Watts, M.J.; Zhang, J.; Koch, I.; Reimer, K.J. Arsenic speciation in field-collected and laboratory-exposed earthworms Lumbricus terrestris. Chemosphere 2011, 85, 1277–1283. [Google Scholar] [CrossRef] [PubMed]
  17. Smith, P.G.; Koch, I.; Reimer, K.J. Arsenic Speciation Analysis of Cultivated White Button Mushrooms (Agaricus bisporus) Using High-Performance Liquid Chromatography—Inductively Coupled Plasma Mass Spectrometry, and X-ray Absorption Spectroscopy. Environ. Sci. Technol. 2007, 41, 6947–6954. [Google Scholar] [CrossRef] [PubMed]
  18. Ravenscroft, P.; Brammer, H.; Richards, K. Arsenic Pollution: A Global Synthesis; John and Wiley and Sons: Hoboken, NJ, USA, 2009; Volume 28. [Google Scholar]
  19. Altowayti, W.A.H.; Othman, N.; Shahir, S.; Alshalif, A.; Al-Gheethi, A.; Al-Towayti, F.; Saleh, Z.; Haris, S. Removal of arsenic from wastewater by using different technologies and adsorbents: A review. Int. J. Environ. Sci. Technol. 2021, 19, 9243–9266. [Google Scholar] [CrossRef]
  20. Haris, S.A.; Altowayti, W.A.H.; Ibrahim, Z.; Shahir, S. Arsenic biosorption using pretreated biomass of psychrotolerant Yersinia sp. strain SOM-12D3 isolated from Svalbard, Arctic. Environ. Sci. Pollut. Res. 2018, 25, 27959–27970. [Google Scholar] [CrossRef] [PubMed]
  21. Altowayti, W.A.H.; Othman, N.; Goh, P.S.; Alshalif, A.F.; Al-Gheethi, A.A.; Algaifi, H.A. Application of a novel nanocomposites carbon nanotubes functionalized with mesoporous silica-nitrenium ions (CNT-MS-N) in nitrate removal: Optimizations and nonlinear and linear regression analysis. Environ. Technol. Innov. 2021, 22, 101428. [Google Scholar] [CrossRef]
  22. Hashim, M.A.; Kundu, A.; Mukherjee, S.; Ng, Y.-S.; Mukhopadhyay, S.; Redzwan, G.; Gupta, B.S. Arsenic removal by adsorption on activated carbon in a rotating packed bed. J. Water Process Eng. 2019, 30, 100591. [Google Scholar] [CrossRef]
  23. Çermikli, E.; Şen, F.; Altıok, E.; Wolska, J.; Cyganowski, P.; Kabay, N.; Bryjak, M.; Arda, M.; Yüksel, M. Performances of novel chelating ion exchange resins for boron and arsenic removal from saline geothermal water using adsorption-membrane filtration hybrid process. Desalination 2020, 491, 114504. [Google Scholar]
  24. Zhang, W.; Liu, C.; Wang, L.; Zheng, T.; Ren, G.; Li, J.; Ma, J.; Zhang, G.; Song, H.; Zhang, Z. A novel nanostructured Fe-Ti-Mn composite oxide for highly efficient arsenic removal: Preparation and performance evaluation. Colloids Surf. A Physicochem. Eng. Asp. 2019, 561, 364–372. [Google Scholar] [CrossRef]
  25. Alka, S.; Shahir, S.; Ibrahim, N.; Chai, T.-T.; Bahari, Z.M.; Abd Manan, F. The role of plant growth promoting bacteria on arsenic removal: A review of existing perspectives. Environ. Technol. Innov. 2020, 17, 100602. [Google Scholar]
  26. Asharuddin, S.M.; Othman, N.; Altowayti, W.A.H.; Bakar, N.A.; Hassan, A. Recent advancement in starch modification and its application as water treatment agent. Environ. Technol. Innov. 2021, 23, 101637. [Google Scholar] [CrossRef]
  27. Altowayti, W.A.H.; Othman, N.; Al-Gheethi, A.; Dzahir, N.H.b.M.; Asharuddin, S.M.; Alshalif, A.F.; Nasser, I.M.; Tajarudin, H.A.; Al-Towayti, F.A.H. Adsorption of Zn2+ from Synthetic Wastewater Using Dried Watermelon Rind (D-WMR): An Overview of Nonlinear and Linear Regression and Error Analysis. Molecules 2021, 26, 6176. [Google Scholar] [CrossRef]
  28. Srenscek-Nazzal, J.; Narkiewicz, U.; Morawski, A.W.; Wróbel, R.J.; Michalkiewicz, B. Comparison of optimized isotherm models and error functions for carbon dioxide adsorption on activated carbon. J. Chem. Eng. Data 2015, 60, 3148–3158. [Google Scholar] [CrossRef]
  29. Ho, Y.; Porter, J.; McKay, G. Equilibrium isotherm studies for the sorption of divalent metal ions onto peat: Copper, nickel and lead single component systems. Water Air Soil Pollut. 2002, 141, 1–33. [Google Scholar] [CrossRef]
  30. Carneiro, M.A.; Pintor, A.M.; Boaventura, R.A.; Botelho, C.M. Current trends of arsenic adsorption in continuous mode: Literature review and future perspectives. Sustainability 2021, 13, 1186. [Google Scholar] [CrossRef]
  31. Zeng, H.; Yu, Y.; Wang, F.; Zhang, J.; Li, D. Arsenic (V) removal by granular adsorbents made from water treatment residuals materials and chitosan. Colloids Surf. A Physicochem. Eng. Asp. 2020, 585, 124036. [Google Scholar] [CrossRef]
  32. Hao, L.; Liu, M.; Wang, N.; Li, G. A critical review on arsenic removal from water using iron-based adsorbents. RSC Adv. 2018, 8, 39545–39560. [Google Scholar] [CrossRef]
  33. Igwe, J.; Abia, A. A bioseparation process for removing heavy metals from waste water using biosorbents. Afr. J. Biotechnol. 2006, 5, 1167–1179. [Google Scholar]
  34. Saqib, A.N.S.; Waseem, A.; Khan, A.F.; Mahmood, Q.; Khan, A.; Habib, A.; Khan, A.R. Arsenic bioremediation by low cost materials derived from Blue Pine (Pinus wallichiana) and Walnut (Juglans regia). Ecol. Eng. 2013, 51, 88–94. [Google Scholar] [CrossRef]
  35. Altowayti, W.A.H.; Haris, S.A.; Shahir, S.; Zakaria, Z.; Ibrahim, S. The removal of arsenic species from aqueous solution by indigenous microbes: Batch bioadsorption and artificial neural network model. Environ. Technol. Innov. 2020, 19, 100830. [Google Scholar] [CrossRef]
  36. Altowayti, W.A.H.; Algaifi, H.A.; Bakar, S.A.; Shahir, S. The adsorptive removal of As (III) using biomass of arsenic resistant Bacillus thuringiensis strain WS3: Characteristics and modelling studies. Ecotoxicol. Environ. Saf. 2019, 172, 176–185. [Google Scholar] [CrossRef] [PubMed]
  37. Altowayti, W.A.H.; Dahawi, A.A.; Shahir, S. Significance of bio-treatment by acid washing for enlargement of arsenic desorption in indigenous arsenic-resistant bacteria from gold mine. Malays. J. Fundam. Appl. Sci. 2020, 16, 190–195. [Google Scholar] [CrossRef]
  38. Altowayti, W.A.H.; Almoalemi, H.; Shahir, S.; Othman, N. Comparison of culture-independent and dependent approaches for identification of native arsenic-resistant bacteria and their potential use for arsenic bioremediation. Ecotoxicol. Environ. Saf. 2020, 205, 111267. [Google Scholar] [CrossRef] [PubMed]
  39. Panda, H.; Tiadi, N.; Mohanty, M.; Mohanty, C. Studies on adsorption behavior of an industrial waste for removal of chromium from aqueous solution. S. Afr. J. Chem. Eng. 2017, 23, 132–138. [Google Scholar] [CrossRef]
  40. Batool, F.; Akbar, J.; Iqbal, S.; Noreen, S.; Bukhari, S.N.A. Study of isothermal, kinetic, and thermodynamic parameters for adsorption of cadmium: An overview of linear and nonlinear approach and error analysis. Bioinorg. Chem. Appl. 2018, 2018, 1–11. [Google Scholar] [CrossRef]
  41. Yang, S.; Li, J.; Shao, D.; Hu, J.; Wang, X. Adsorption of Ni (II) on oxidized multi-walled carbon nanotubes: Effect of contact time, pH, foreign ions and PAA. J. Hazard. Mater. 2009, 166, 109–116. [Google Scholar] [CrossRef]
  42. Kord Mostafapour, F.; Bazrafshan, E.; Farzadkia, M.; Amini, S. Arsenic removal from aqueous solutions by Salvadora persica stem ash. J. Chem. 2013, 2013, 1–8. [Google Scholar] [CrossRef] [Green Version]
  43. Zang, S.; Qiu, H.; Sun, C.; Zhou, H.; Cui, L. High Efficiency Adsorption Removal of Arsenilic Acid and Arsenate (V) by Iron-Modified Corncob Biochar. Bull. Environ. Contam. Toxicol. 2022, 109, 379–385. [Google Scholar] [CrossRef]
  44. Gupta, A.R.; Joshi, V.C.; Yadav, A.; Sharma, S. Synchronous removal of arsenic and fluoride from aqueous solution: A facile approach to fabricate novel functional metallopolymer microspheres. ACS Omega 2022, 7, 4879–4891. [Google Scholar] [CrossRef]
  45. Smedley, P.L.; Kinniburgh, D.G. A review of the source, behaviour and distribution of arsenic in natural waters. Appl. Geochem. 2002, 17, 517–568. [Google Scholar] [CrossRef] [Green Version]
  46. Carneiro, M.A.; Pintor, A.M.; Boaventura, R.A.; Botelho, C.M. Efficient removal of arsenic from aqueous solution by continuous adsorption onto iron-coated cork granulates. J. Hazard. Mater. 2022, 432, 128657. [Google Scholar] [CrossRef] [PubMed]
  47. Goren, A.Y.; Kobya, M.; Khataee, A. How does arsenic speciation (arsenite and arsenate) in groundwater affect the performance of an aerated electrocoagulation reactor and human health risk? Sci. Total Environ. 2022, 808, 152135. [Google Scholar] [CrossRef] [PubMed]
  48. Zhu, T.; Zhang, Y.; Chen, Y.; Liu, J.-L.; Song, X.-L. Synthesis of novel hydrated ferric oxide biochar nanohybrids for efficient arsenic removal from wastewater. Rare Met. 2022, 41, 1677–1687. [Google Scholar] [CrossRef]
  49. Kujala, K.; Laamanen, T.; Khan, U.A.; Besold, J.; Planer-Friedrich, B. Kinetics of arsenic and antimony reduction and oxidation in peatlands treating mining-affected waters: Effects of microbes, temperature, and carbon substrate. Soil Biol. Biochem. 2022, 167, 108598. [Google Scholar] [CrossRef]
  50. Zubair, M.; Daud, M.; McKay, G.; Shehzad, F.; Al-Harthi, M.A. Recent progress in layered double hydroxides (LDH)-containing hybrids as adsorbents for water remediation. Appl. Clay Sci. 2017, 143, 279–292. [Google Scholar] [CrossRef]
  51. Lee, S.Y.; Jung, K.-W.; Choi, J.-W.; Lee, Y.J. In situ synthesis of hierarchical cobalt-aluminum layered double hydroxide on boehmite surface for efficient removal of arsenate from aqueous solutions: Effects of solution chemistry factors and sorption mechanism. Chem. Eng. J. 2019, 368, 914–923. [Google Scholar] [CrossRef]
  52. Yan, L.; Yin, H.; Zhang, S.; Leng, F.; Nan, W.; Li, H. Biosorption of inorganic and organic arsenic from aqueous solution by Acidithiobacillus ferrooxidans BY-3. J. Hazard. Mater. 2010, 178, 209–217. [Google Scholar] [CrossRef]
  53. Nigam, S.; Vankar, P.S.; Gopal, K. Biosorption of arsenic from aqueous solution using dye waste. Environ. Sci. Pollut. Res. 2013, 20, 1161–1172. [Google Scholar] [CrossRef]
  54. Kwok, K.C.; Koong, L.F.; Al Ansari, T.; McKay, G. Adsorption/desorption of arsenite and arsenate on chitosan and nanochitosan. Environ. Sci. Pollut. Res. 2018, 25, 14734–14742. [Google Scholar] [CrossRef]
  55. Singh, R.; Singh, S.; Parihar, P.; Singh, V.P.; Prasad, S.M. Arsenic contamination, consequences and remediation techniques: A review. Ecotoxicol. Environ. Saf. 2015, 112, 247–270. [Google Scholar] [CrossRef] [PubMed]
  56. Nigam, S.; Gopal, K.; Vankar, P.S. Biosorption of arsenic in drinking water by submerged plant: Hydrilla verticilata. Environ. Sci. Pollut. Res. 2013, 20, 4000–4008. [Google Scholar] [CrossRef]
  57. Brahman, K.D.; Kazi, T.G.; Baig, J.A.; Afridi, H.I.; Arain, S.S.; Saraj, S.; Arain, M.B.; Arain, S.A. Biosorptive removal of inorganic arsenic species and fluoride from aqueous medium by the stem of Tecomella undulate. Chemosphere 2016, 150, 320–328. [Google Scholar] [CrossRef] [PubMed]
  58. Urik, M.; Littera, P.; Kolen, M. Removal of arsenic (V) from aqueous solutions using chemically modified sawdust of spruce (Picea abies): Kinetics and isotherm studies. Int. J. Environ. Sci. Technol. 2009, 6, 451–456. [Google Scholar] [CrossRef]
  59. Giri, A.; Patel, R.; Mahapatra, S.; Mishra, P. Biosorption of arsenic (III) from aqueous solution by living cells of Bacillus cereus. Environ. Sci. Pollut. Res. 2012, 20, 1281–1291. [Google Scholar] [CrossRef] [PubMed]
  60. Dadrasnia, A.; Chuan Wei, K.S.; Shahsavari, N.; Azirun, M.S.; Ismail, S. Biosorption potential of Bacillus salmalaya strain 139SI for removal of Cr (VI) from aqueous solution. Int. J. Environ. Res. Public Health 2015, 12, 15321–15338. [Google Scholar] [CrossRef]
  61. Bahari, Z.M.; Altowayti, W.A.H.; Ibrahim, Z.; Jaafar, J.; Shahir, S. Biosorption of As (III) by non-living biomass of an arsenic-hypertolerant Bacillus cereus strain SZ2 isolated from a gold mining environment: Equilibrium and kinetic study. Appl. Biochem. Biotechnol. 2013, 171, 2247–2261. [Google Scholar] [CrossRef] [PubMed]
  62. Allozy, H.G.A.; Abd Karim, K.J. Removal of copper ions from aqueous solutions using poly (vinylbenzyl chloride). Malays. J. Anal. Sci 2020, 24, 978–991. [Google Scholar]
  63. Khashbaatar, Z.; Akama, S.; Kano, N.; Kim, H.-J. Development of a New Dolomite-Based Adsorbent with Phosphorus and the Adsorption Characteristics of Arsenic (III) in an Aqueous Solution. Water 2022, 14, 1102. [Google Scholar] [CrossRef]
  64. Aziz, N.I.A.; Othman, N.; Altowayti, W.A.H.; Yunus, Z.M.; Fitriani, N.; Din, M.F.M.; Fikri, F.M. Hardness removal of groundwater through sand, zeolite and rice husk activated carbon. Malays. J. Anal. Sci. 2021, 25, 605–621. [Google Scholar]
  65. Liyun, Y.; Mengdan, G.; Yan, L.; Shaojie, L.; Libing, Y.; Shuwu, L. Removal Arsenic (V) Efficiency and Characteristics Using Modified Basic Oxygen Furnace Slag in Aqueous Solution. J. Resour. Ecol. 2022, 13, 537–546. [Google Scholar] [CrossRef]
  66. Wu, D.; Liu, J.; Yang, Y.; Zheng, Y.; Zhang, J. Experimental and theoretical study of arsenic removal by porous carbon from MSW incineration flue gas. Fuel 2022, 312, 123000. [Google Scholar] [CrossRef]
  67. Van Tran, T.; Nguyen, D.T.C.; Nguyen, T.T.; Pham, Q.T.; Vo, D.-V.N.; Nguyen, T.-D.; Van Pham, T.; Nguyen, T.D. Linearized and nonlinearized modellings for comparative uptake assessment of metal-organic framework-derived nanocomposite towards sulfonamide antibiotics. Environ. Sci. Pollut. Res. 2020, 28, 63448–63463. [Google Scholar] [CrossRef] [PubMed]
  68. Yavari, Z.; Noroozifar, M. Kinetic, isotherm and thermodynamic studies with linear and non-linear fitting for cadmium (II) removal by black carbon of pine cone. Water Sci. Technol. 2017, 76, 2242–2253. [Google Scholar] [CrossRef] [PubMed] [Green Version]
  69. Kumar, K.V. Comparative analysis of linear and non-linear method of estimating the sorption isotherm parameters for malachite green onto activated carbon. J. Hazard. Mater. 2006, 136, 197–202. [Google Scholar] [CrossRef]
  70. Castro, L.; Ayala, L.A.; Vardanyan, A.; Zhang, R.; Muñoz, J.Á. Arsenate and Arsenite Sorption Using Biogenic Iron Compounds: Treatment of Real Polluted Waters in Batch and Continuous Systems. Metals 2021, 11, 1608. [Google Scholar] [CrossRef]
  71. Kumar, K.V. Optimum sorption isotherm by linear and non-linear methods for malachite green onto lemon peel. Dye. Pigment. 2007, 74, 595–597. [Google Scholar] [CrossRef]
  72. Chowdhury, S.; Misra, R.; Kushwaha, P.; Das, P. Optimum sorption isotherm by linear and nonlinear methods for safranin onto alkali-treated rice husk. Bioremediat. J. 2011, 15, 77–89. [Google Scholar] [CrossRef]
  73. Shahmohammadi-Kalalagh, S.; Babazadeh, H.; Nazemi, A. Comparison of linear and nonlinear forms of isotherm models for Zn (II) and Cu (II) sorption on a kaolinite. Arab. J. Geosci. 2015, 8, 397–402. [Google Scholar] [CrossRef]
  74. Kumar, K.V.; Porkodi, K.; Rocha, F. Isotherms and thermodynamics by linear and non-linear regression analysis for the sorption of methylene blue onto activated carbon: Comparison of various error functions. J. Hazard. Mater. 2008, 151, 794–804. [Google Scholar] [CrossRef]
  75. Altowayti, W.A.H.; Allozy, H.G.A.; Shahir, S.; Goh, P.S.; Yunus, M.A.M. A novel nanocomposite of aminated silica nanotube (MWCNT/Si/NH 2) and its potential on adsorption of nitrite. Environ. Sci. Pollut. Res. 2019, 26, 28737–28748. [Google Scholar] [CrossRef] [PubMed]
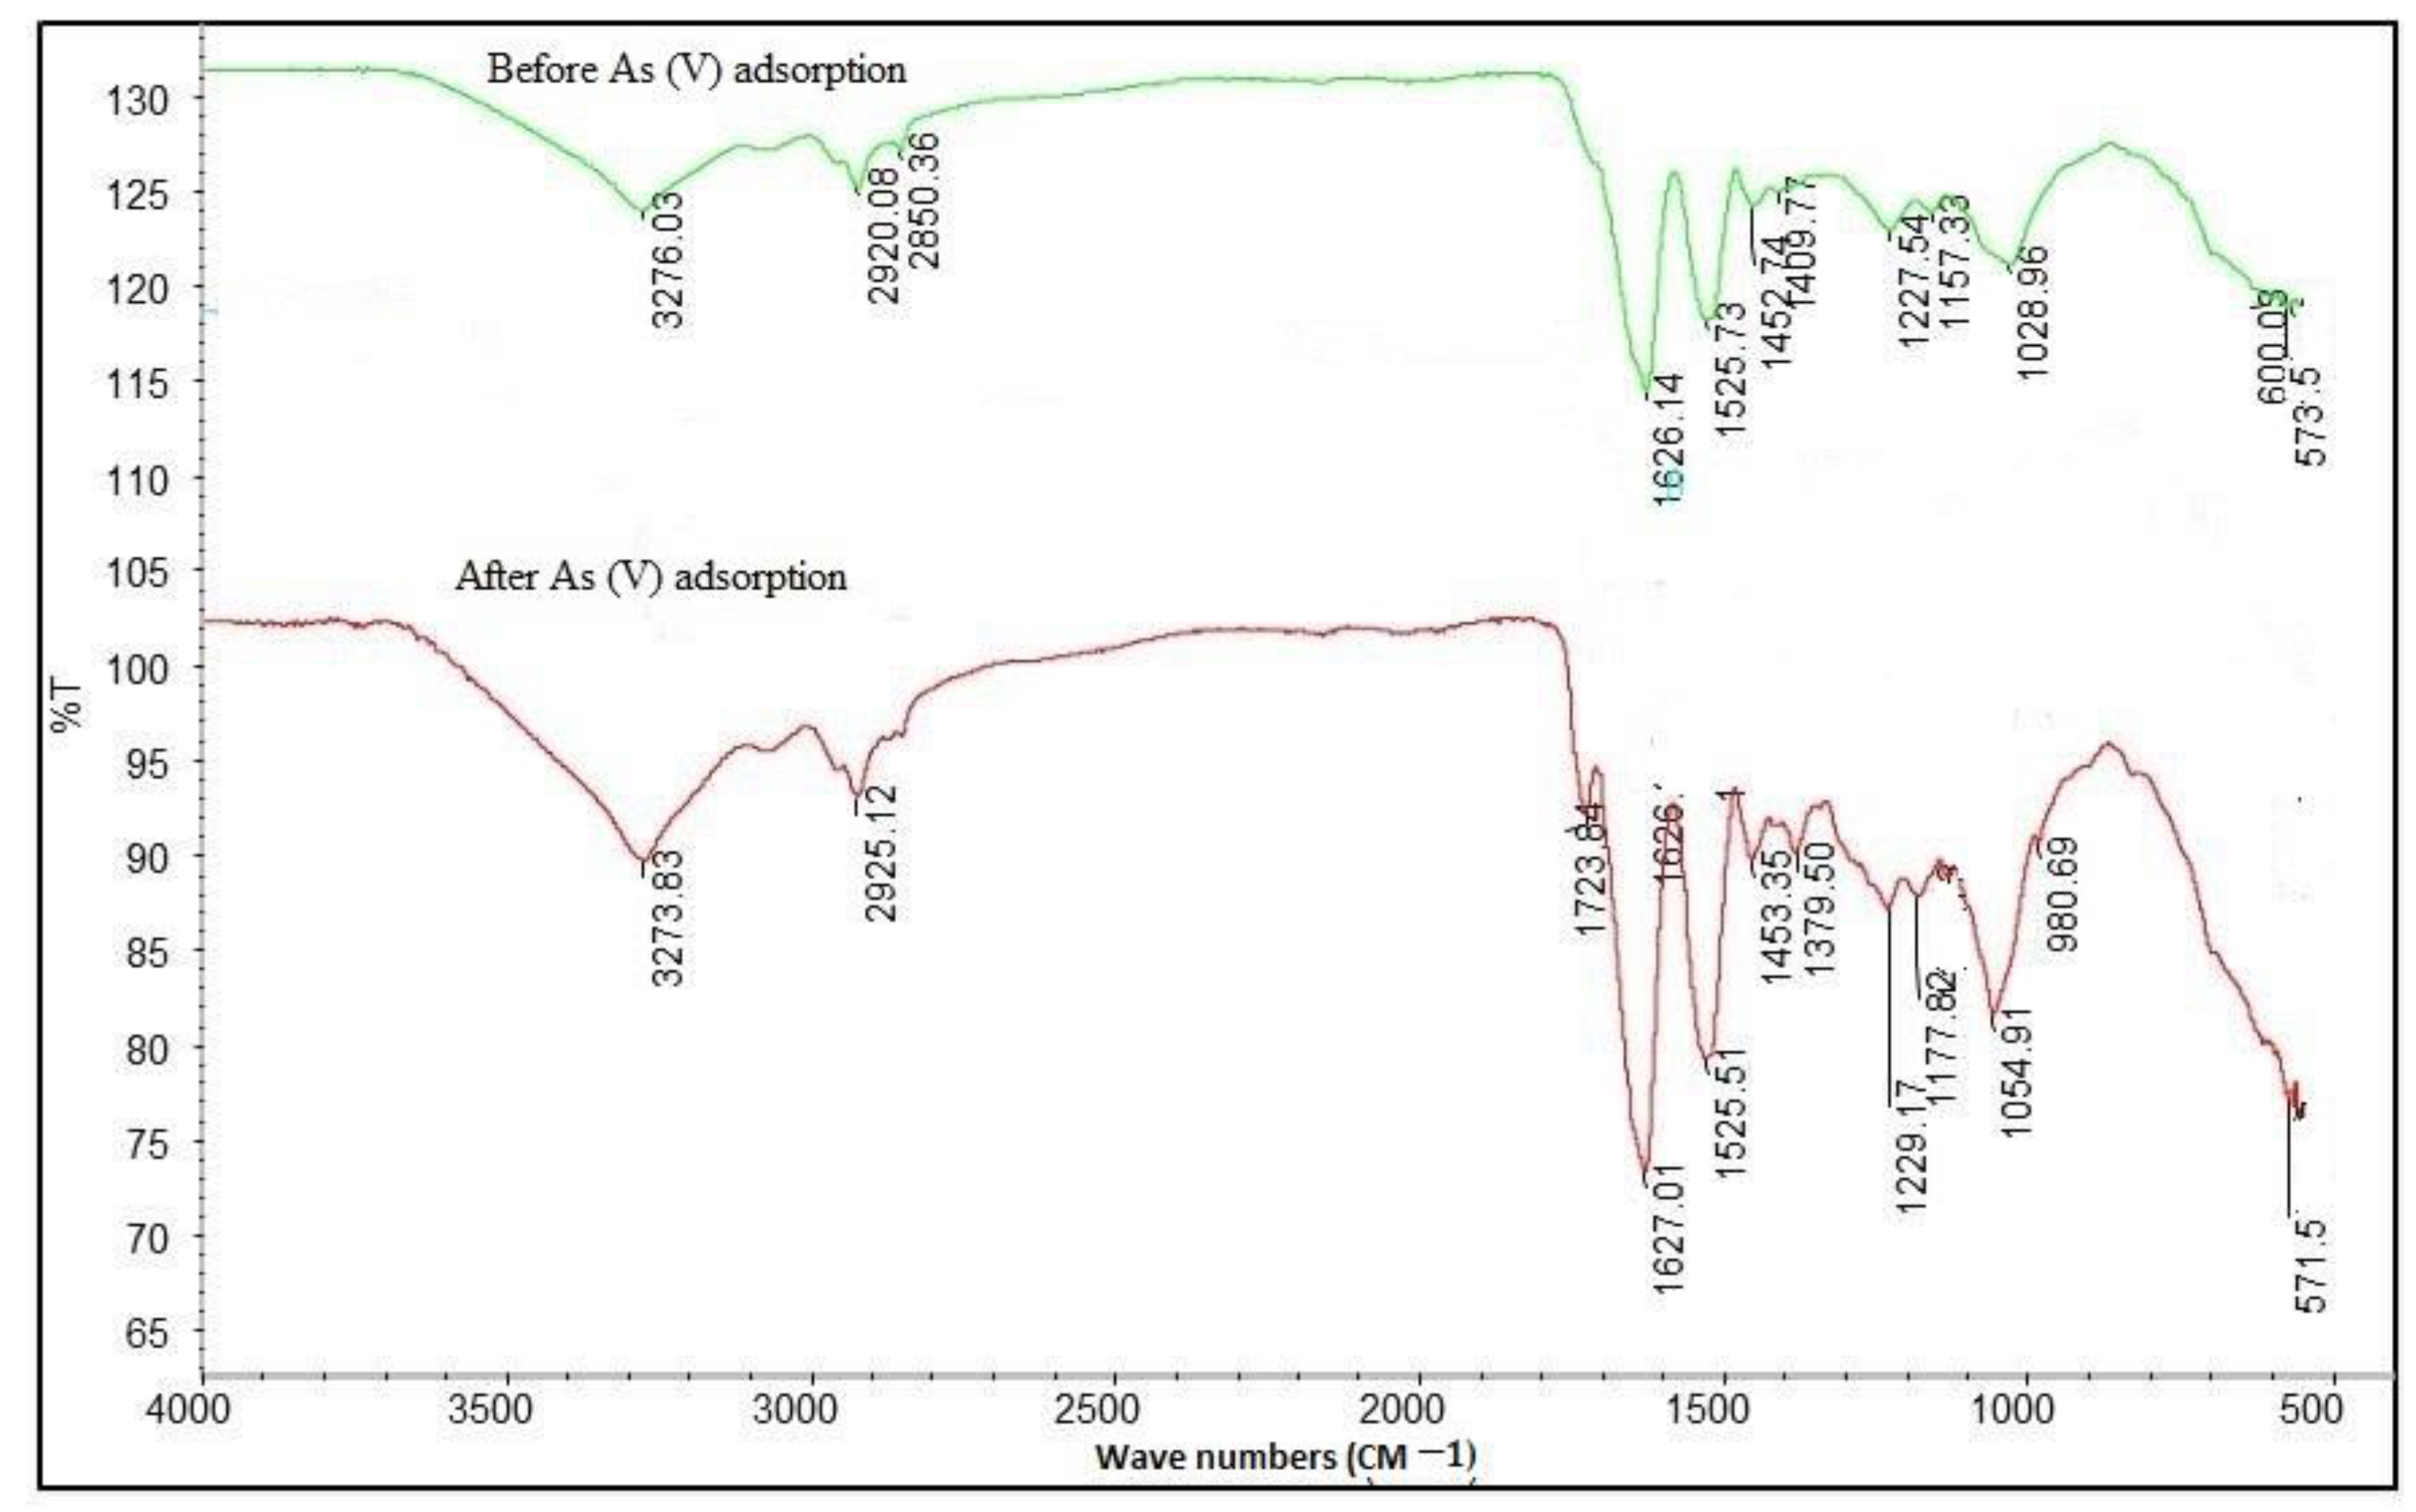
Figure 2. FTIR spectrum analysis before and after As(V) adsorption using DBB.
Metals 12 01664 g002
Figure 3. FESEM-EDX images of DBB, showing (A) DBB without As(V) adsorption and the corresponding EDX spectrum (B), and (C) DBB with As(V) adsorption and the corresponding EDX spectrum (D).
Metals 12 01664 g003
Figure 6. Comparison of residual scatters with independent scatter for the following models: (A) nonlinear Langmuir isotherm model; (B) linear Langmuir isotherm model; (C) nonlinear Pseudo second model; and (D) linear Pseudo second model.
Metals 12 01664 g006
Publisher’s Note: MDPI stays neutral with regard to jurisdictional claims in published maps and institutional affiliations.