Article

Phase Equilibria of the Mg-Zn-Sm System in Mg-Rich Corner at 320 °C and 400 °C

State Key Laboratory of Advanced Special Steel, Shanghai Key Laboratory of Advanced Ferrometallurgy, School of Materials Science and Engineering, Shanghai University, Shanghai 200072, China
*
Authors to whom correspondence should be addressed.
Metals 2022, 12(10), 1553; https://doi.org/10.3390/met12101553
Submission received: 1 September 2022 / Revised: 16 September 2022 / Accepted: 18 September 2022 / Published: 20 September 2022
(This article belongs to the Special Issue Light Alloy and Its Application)

Abstract

:
To clarify the controversy regarding the phase equilibria in the Mg-rich corner of the Mg-Zn-Sm system, alloys annealed at 320 °C and 400 °C were employed to determine the phase constitution, composition and crystal structure by scanning electron microscopy (SEM), X-ray diffraction (XRD) and transmission electron microscopy (TEM). The maximum solubility of Zn in Mg3Sm was measured to be 49.2 at.% at 400 °C. The Y phase (Mg62Zn31Sm7), only observed in the as-cast alloys, was determined to have an orthorhombic structure with lattice parameters of a = 10.20 Å, b = 11.26 Å and c = 9.64 Å by TEM. The hexagonal compound μ7, identified with lattice parameters of a = 34.62 Å and c = 8.94 Å, was detected during the transformation of the Y phase to the Z phase in the alloys located in the (Mg) + Mg3Sm + Z three-phase region. The phase equilibria (Mg) + Mg41Sm5 + Mg3Sm, Mg + Mg3Sm + Z, (Mg) + Z + liquid and Mg2Zn3 + Z + liquid at 400 °C are confirmed, and the three-phase region (Mg) + Z + MgZn exists in the Mg-Zn side at 320 °C. Subsequently, a self-consistent thermodynamic description was obtained based on the experimental data. Meanwhile, solidification simulation of Y phase formation was conducted by suppressing the stale Z phase, which can reasonably explain the as-cast microstructure of alloys in the Mg-rich corner. The thermodynamic database would be helpful for the further development of Mg-Zn-Sm alloys.

1. Introduction

With low density and high specific strength, magnesium (Mg) alloy possesses significant advantages in energy conservation and emission reduction for the aircraft, automobile and high-speed train applications [1,2]. The Mg-Zn alloys containing rare earth (RE) elements exhibit outstanding mechanical properties, which received much attention in recent years [3,4,5,6]. By adjusting the ratio of Zn to RE, different ternary compounds, such as long-period stacking ordered (LPSO) phase [7,8], W (Mg25Zn50RE25) [9], quasicrystal [10,11] and Z (Mg30Zn60RE10) [12], will be formed during solidification or heat treatment. These intermetallic compounds with high thermal stability can effectively hinder the dislocation slip and grain boundary sliding, especially at elevated temperatures, which plays an important role in the enhancement of the mechanical properties of the Mg-Zn-RE alloys.
Samarium (Sm), which has greater solid solubility in Mg and is much cheaper than neodymium (Nd), displayed higher strength for modifying Mg-Zn alloy [13]. Several studies on the mechanical properties of Mg-Zn-Sm alloys with different weight ratios of Zn to Sm have been published [14,15,16]. However, limited information on the ternary compounds has been reported. Three ternary compounds, named X, Y and Z, were found to be in equilibrium with α-Mg by Drits et al. [17]. The detailed information on the compounds is listed in Table 1. Afterward, a series of hexagonal ternary Mg-Zn-Sm phases, which are abbreviated as μ3 [18], μ5 [19] and μ7 [20], with nearly the same c-axis and about 3, 5 and 7 times larger in a-axis compared to μ-MgZn2, were observed around the nominal composition Mg30Zn60Sm10. Note that ternary compounds μ3 and Z should be in the same phase due to their virtually identical lattice parameters. In addition, the icosahedral quasicrystal phase forms in a rapidly solidified Mg30Zn60Sm10 alloy; however, when the solidification rate slows down, it will form a hexagonal crystal phase with lattice parameters of a = 14.6 Å and c = 8.8 Å [21]. It is natural to find that controversies exist related to the composition and stability of the compounds Mg3Sm (or X) and Y. Thus, it is essential to verify the crystal structure and compositions of the intermetallic compounds in the Mg-Zn-Sm system.
The phase equilibria of the Mg-Zn-Sm system also remain controversial. The phase equilibria of the Mg-Zn-Sm system in the Mg-rich corner were studied by Xia et al. [22]. The X phase was identified to be Mg3Sm with large solubility of Zn by TEM and XRD. The Z phase was confirmed in the (Mg) + Mg3Sm + Z three-phase equilibrium at both 350 °C and 400 °C. Because the Y phase was not observed, it was ignored in their thermodynamic modeling. However, the thermodynamic evaluation by Zhu and Pelton [23] only takes into account experimental data from Drits et al. [17]. In their isothermal section at 300 °C, phases X, Y and Z were interpreted as τ3, τ4 and τ5, but the composition of τ4 is apparently far from the Y phase. Therefore, the phase equilibria in the Mg-rich corner are still unconfirmed. It is necessary to study a detailed phase relationship in order to help develop the novel Sm-containing Mg-Zn-based alloys.
The aim of the present work is to study the phase equilibria of the Mg-Zn-Sm system in the Mg-rich corner. The compositions and crystal structure of the ternary compounds are determined by TEM and XRD. Subsequently, combining the experimental data and CALPHAD method, the thermodynamic description of the Mg-Zn-Sm system is provided, which is helpful for further alloy design.

2. Materials and Methods

Eight alloys were prepared by cold crucible levitation melting under a high-purity argon atmosphere, using Mg (99.99%), Zn (99.99%) and Mg-28 wt.%Sm master alloy as the raw materials. For the convenience of discussion, the alloys are numbered from #1 to #8 according to their composition from Mg-Sm side to Mg-Zn side. Each alloy was remelted at least three times to ensure homogeneity. Samples cut from casting ingots were individually wrapped with tantalum foil and sealed in an evacuated silica tube. Annealing was performed in muffle furnaces at 320 °C for 35 days and 56 days and at 400 °C for 18 days and 42 days, followed by water quenching. In order to protect the liquid phase from heavy evaporation in a long-term heat treatment, the annealing time of alloys #6–#8 at 400 °C was reduced to 1 day.
The actual compositions of the alloys were measured by inductively coupled plasma (ICP). Microstructures and phase compositions of the alloys were examined by scanning electron microscopy (SEM, Hitachi-SU1510) equipped with energy-dispersive spectroscopy (EDS). All the XRD patterns in this work were collected from the powder samples. The blocky alloys were crushed into powder and then sifted using a 200 mesh sieve. The powder X-ray diffraction (XRD) measurement was performed on a D/MAX 2500 diffractometer with Cu-Kα radiation and scanning from 10 to 70° at a rate of 2°/min. The TEM samples were prepared using a Helios G4UC FIB/SEM with thinning voltage of 2 kV. The selected area electron diffraction (SAED) was conducted on a JEOL 2100F FEGTEM operating at 200 kV.

3. Results

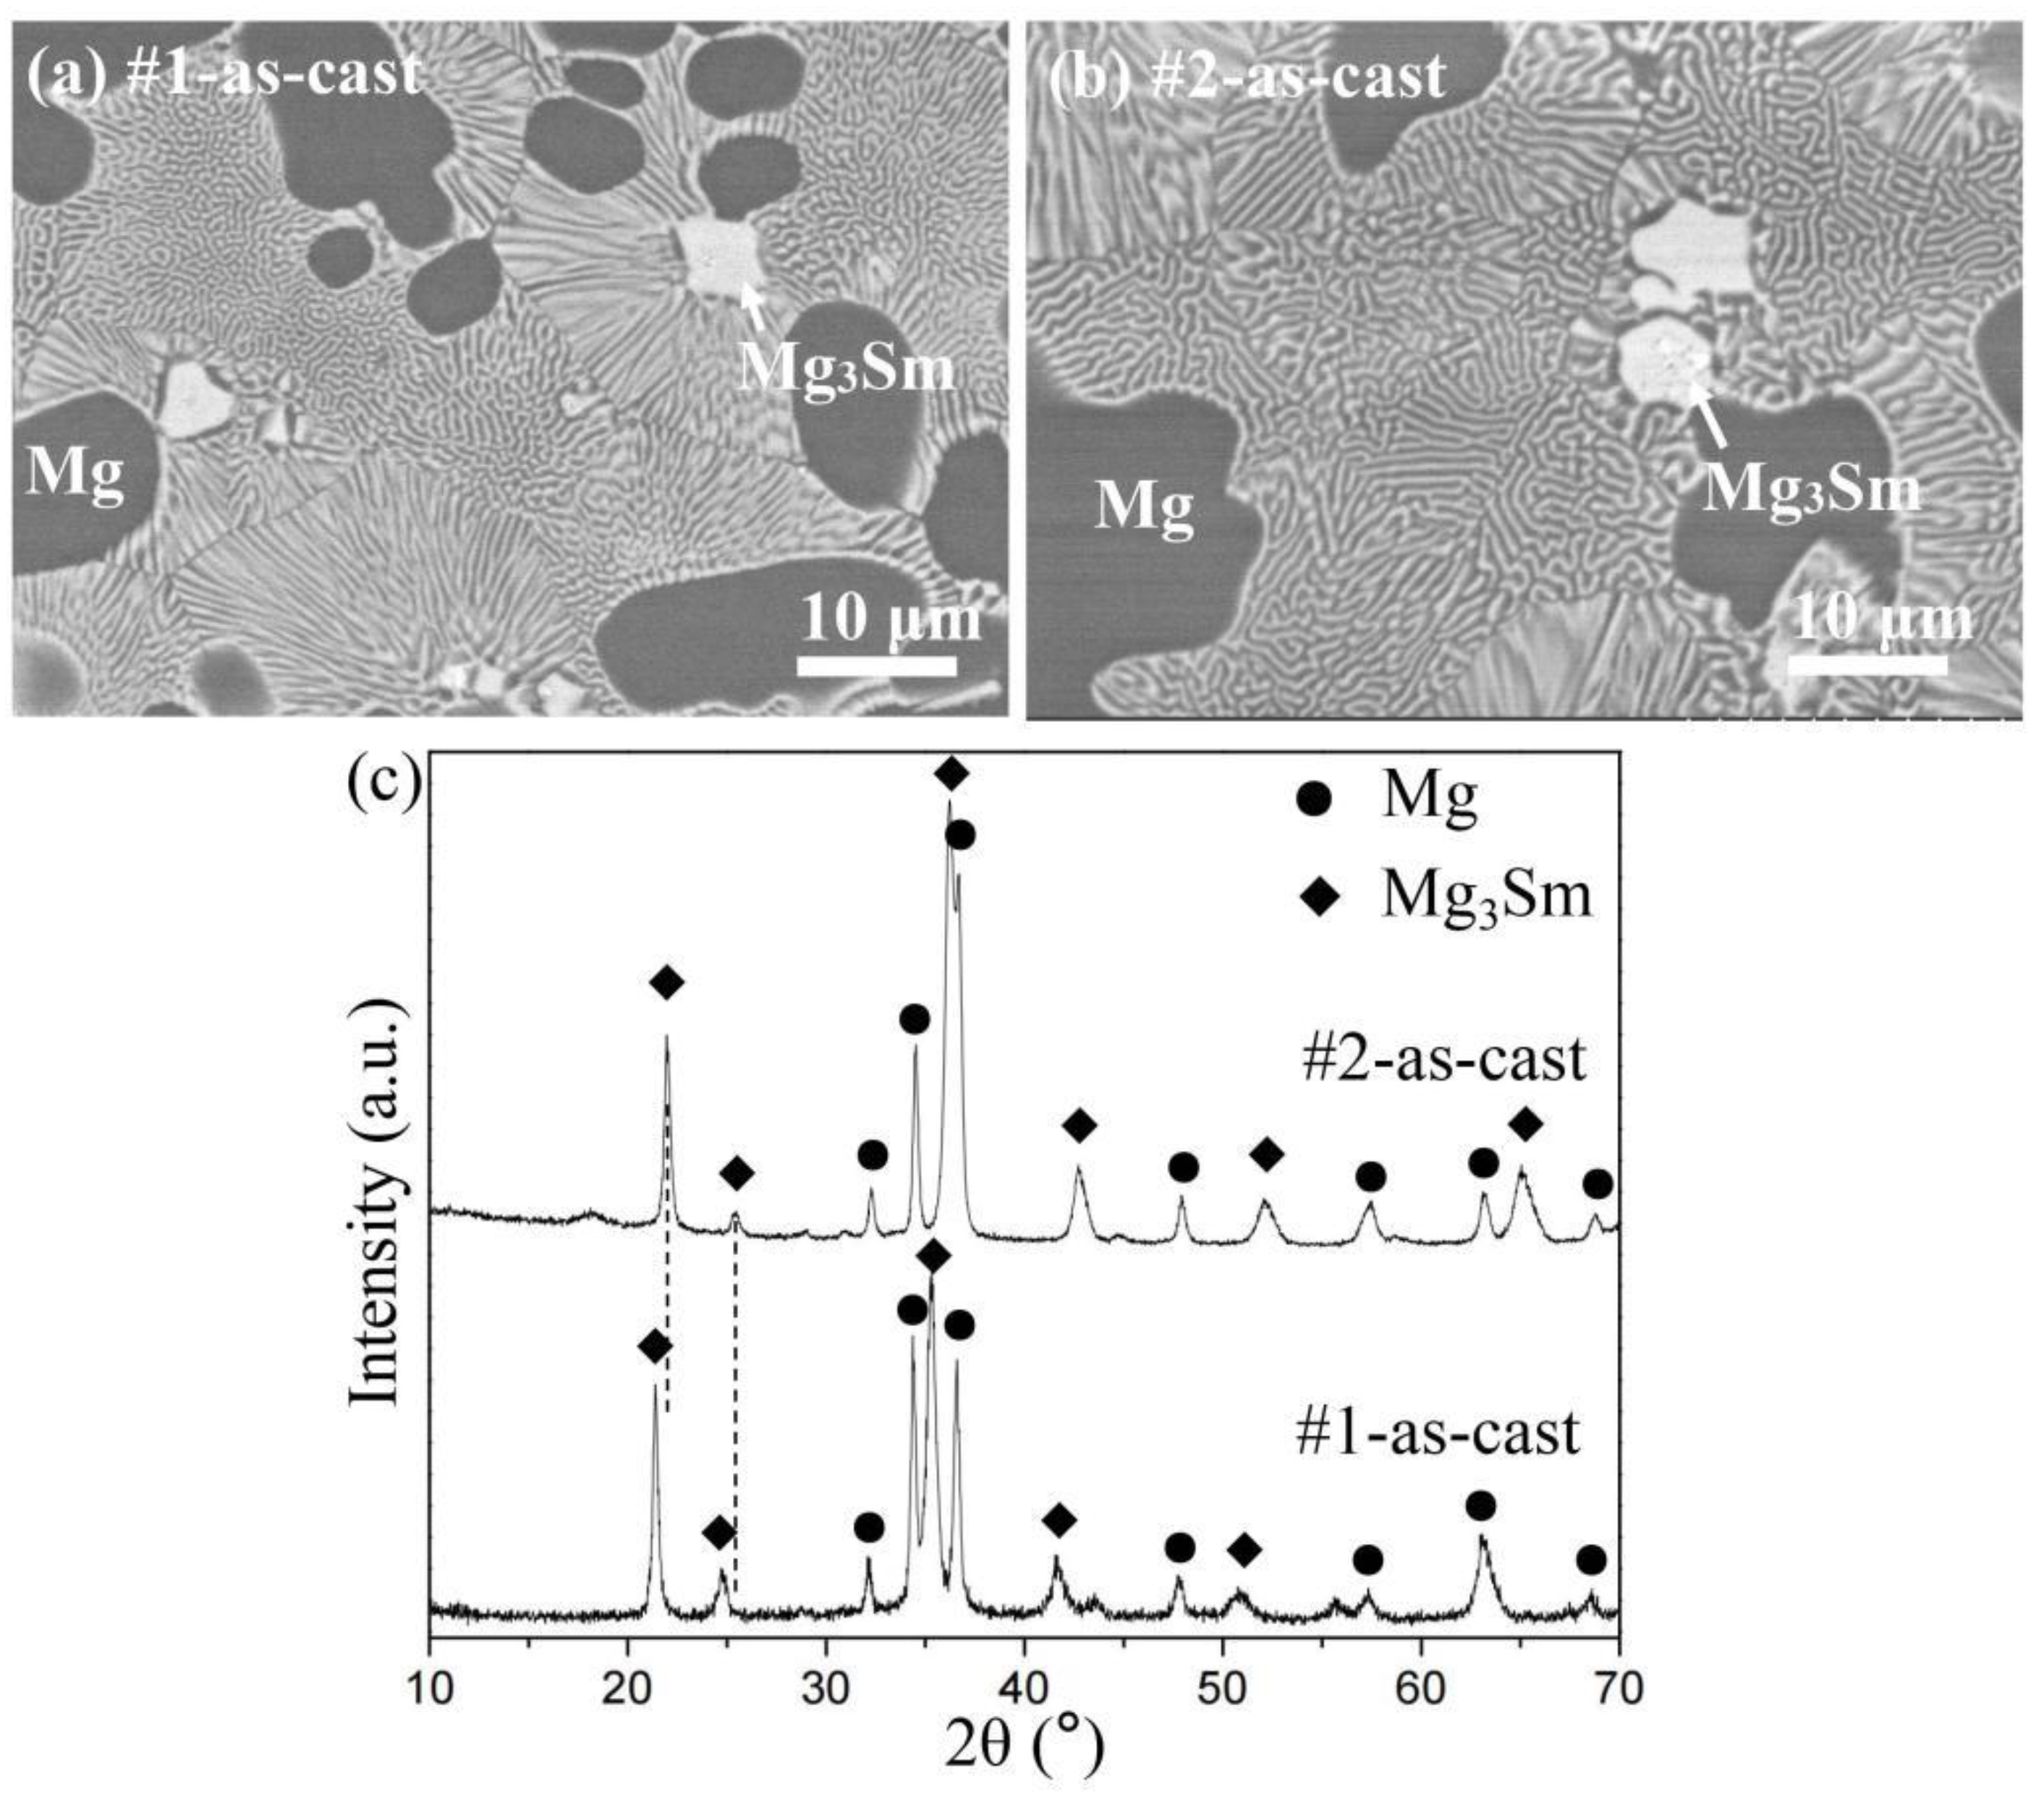
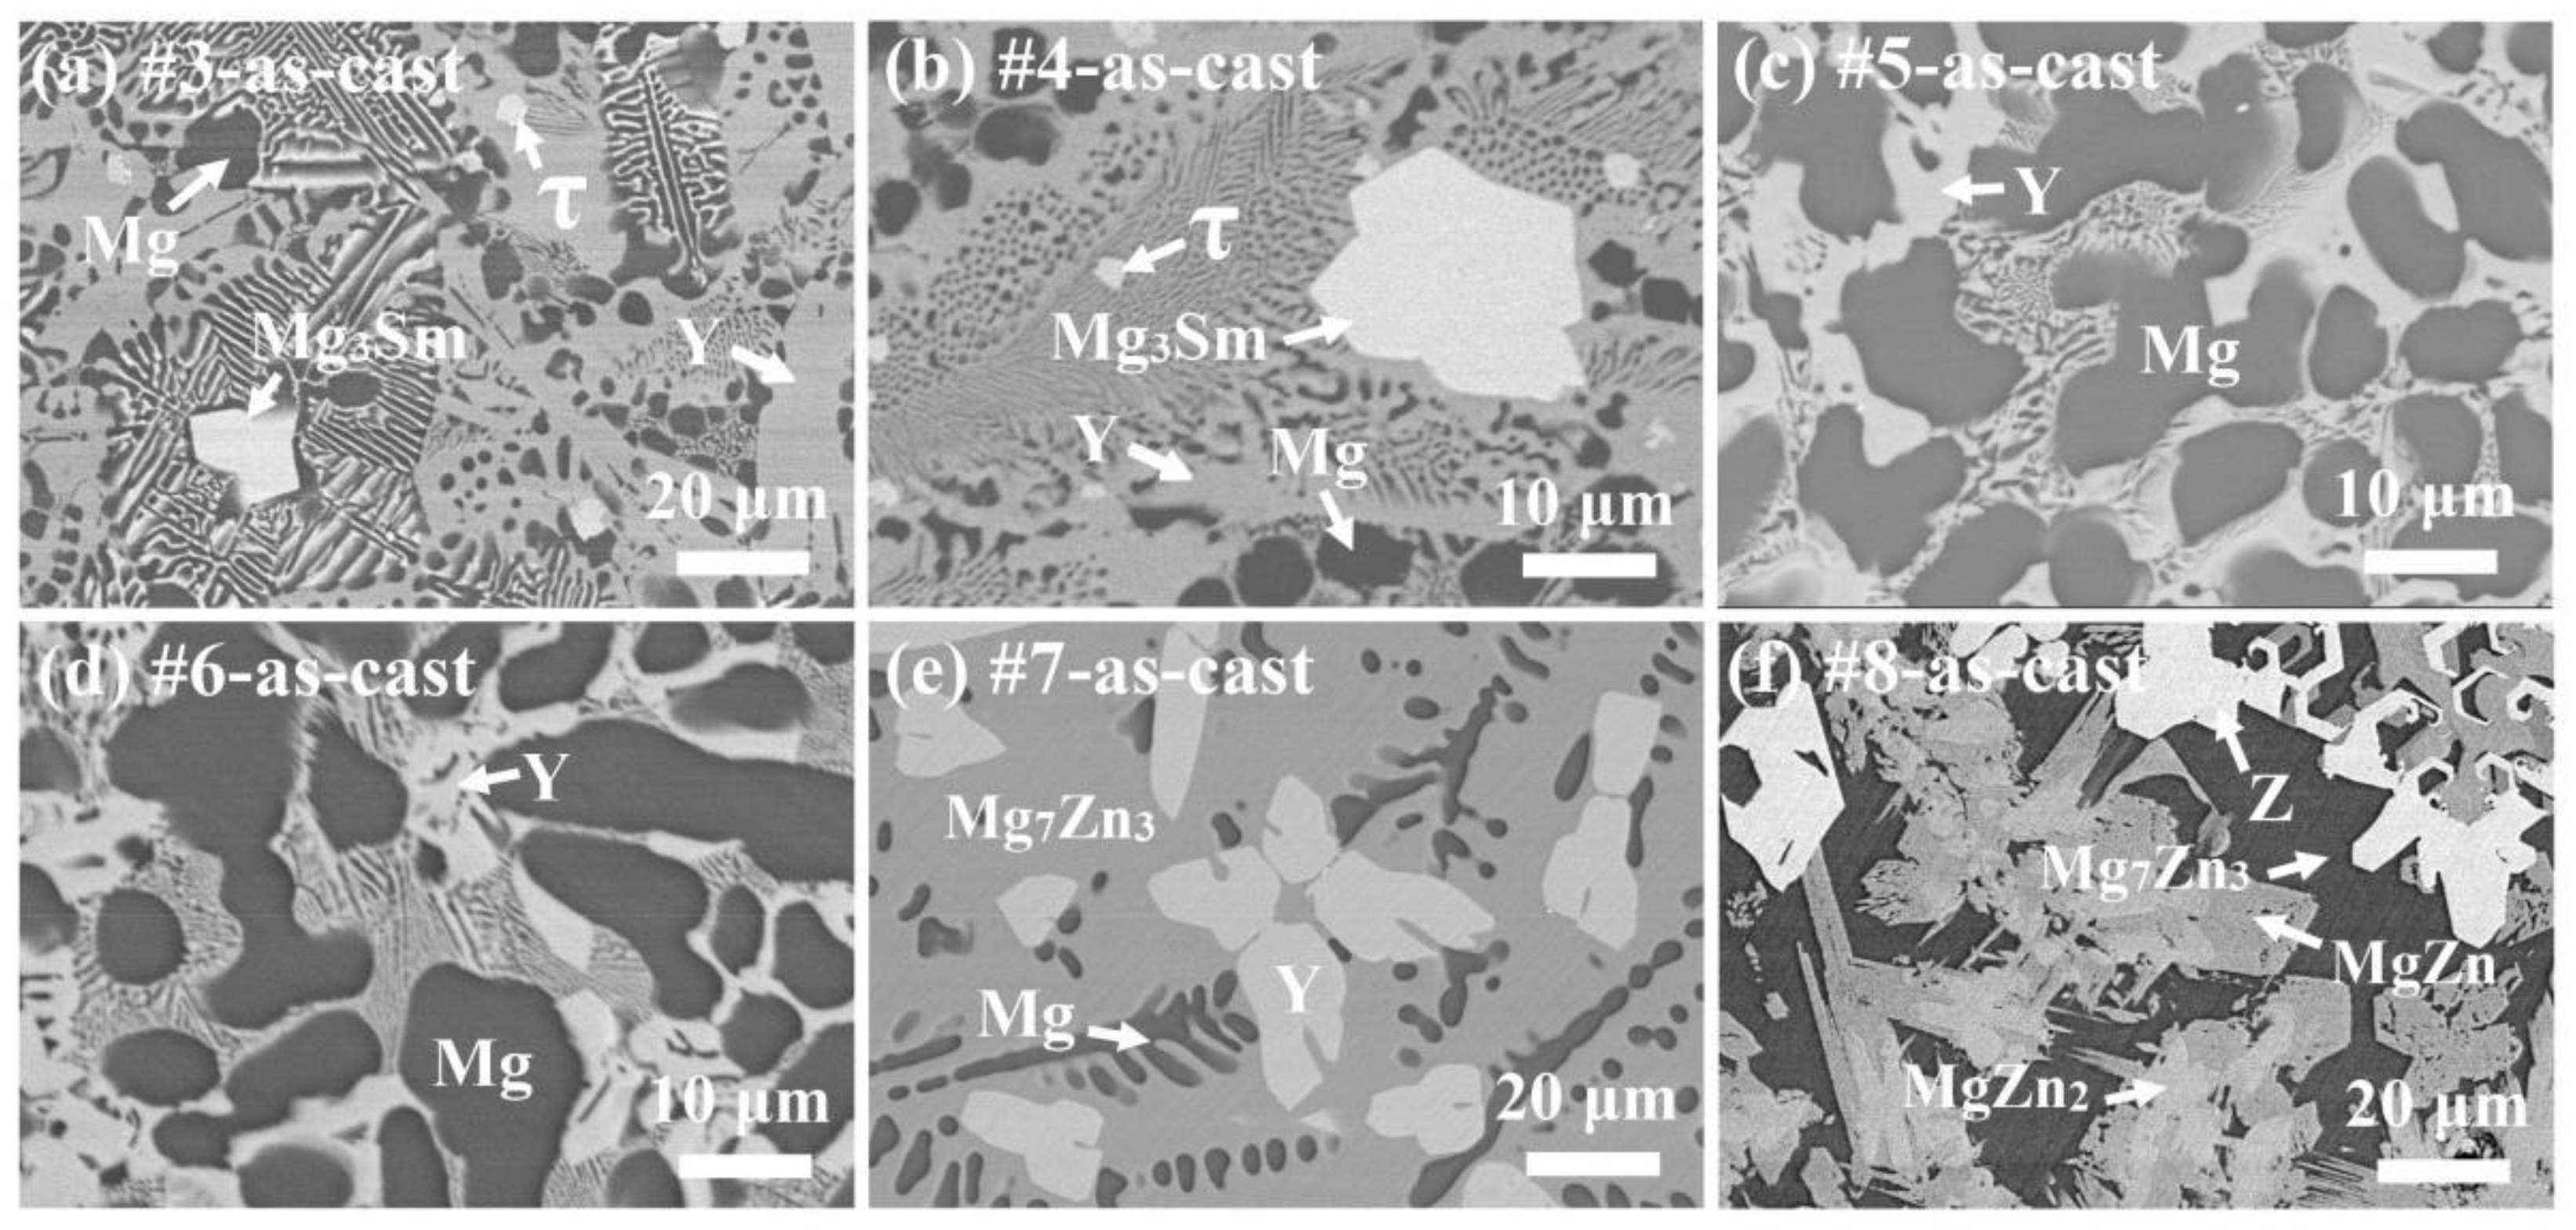
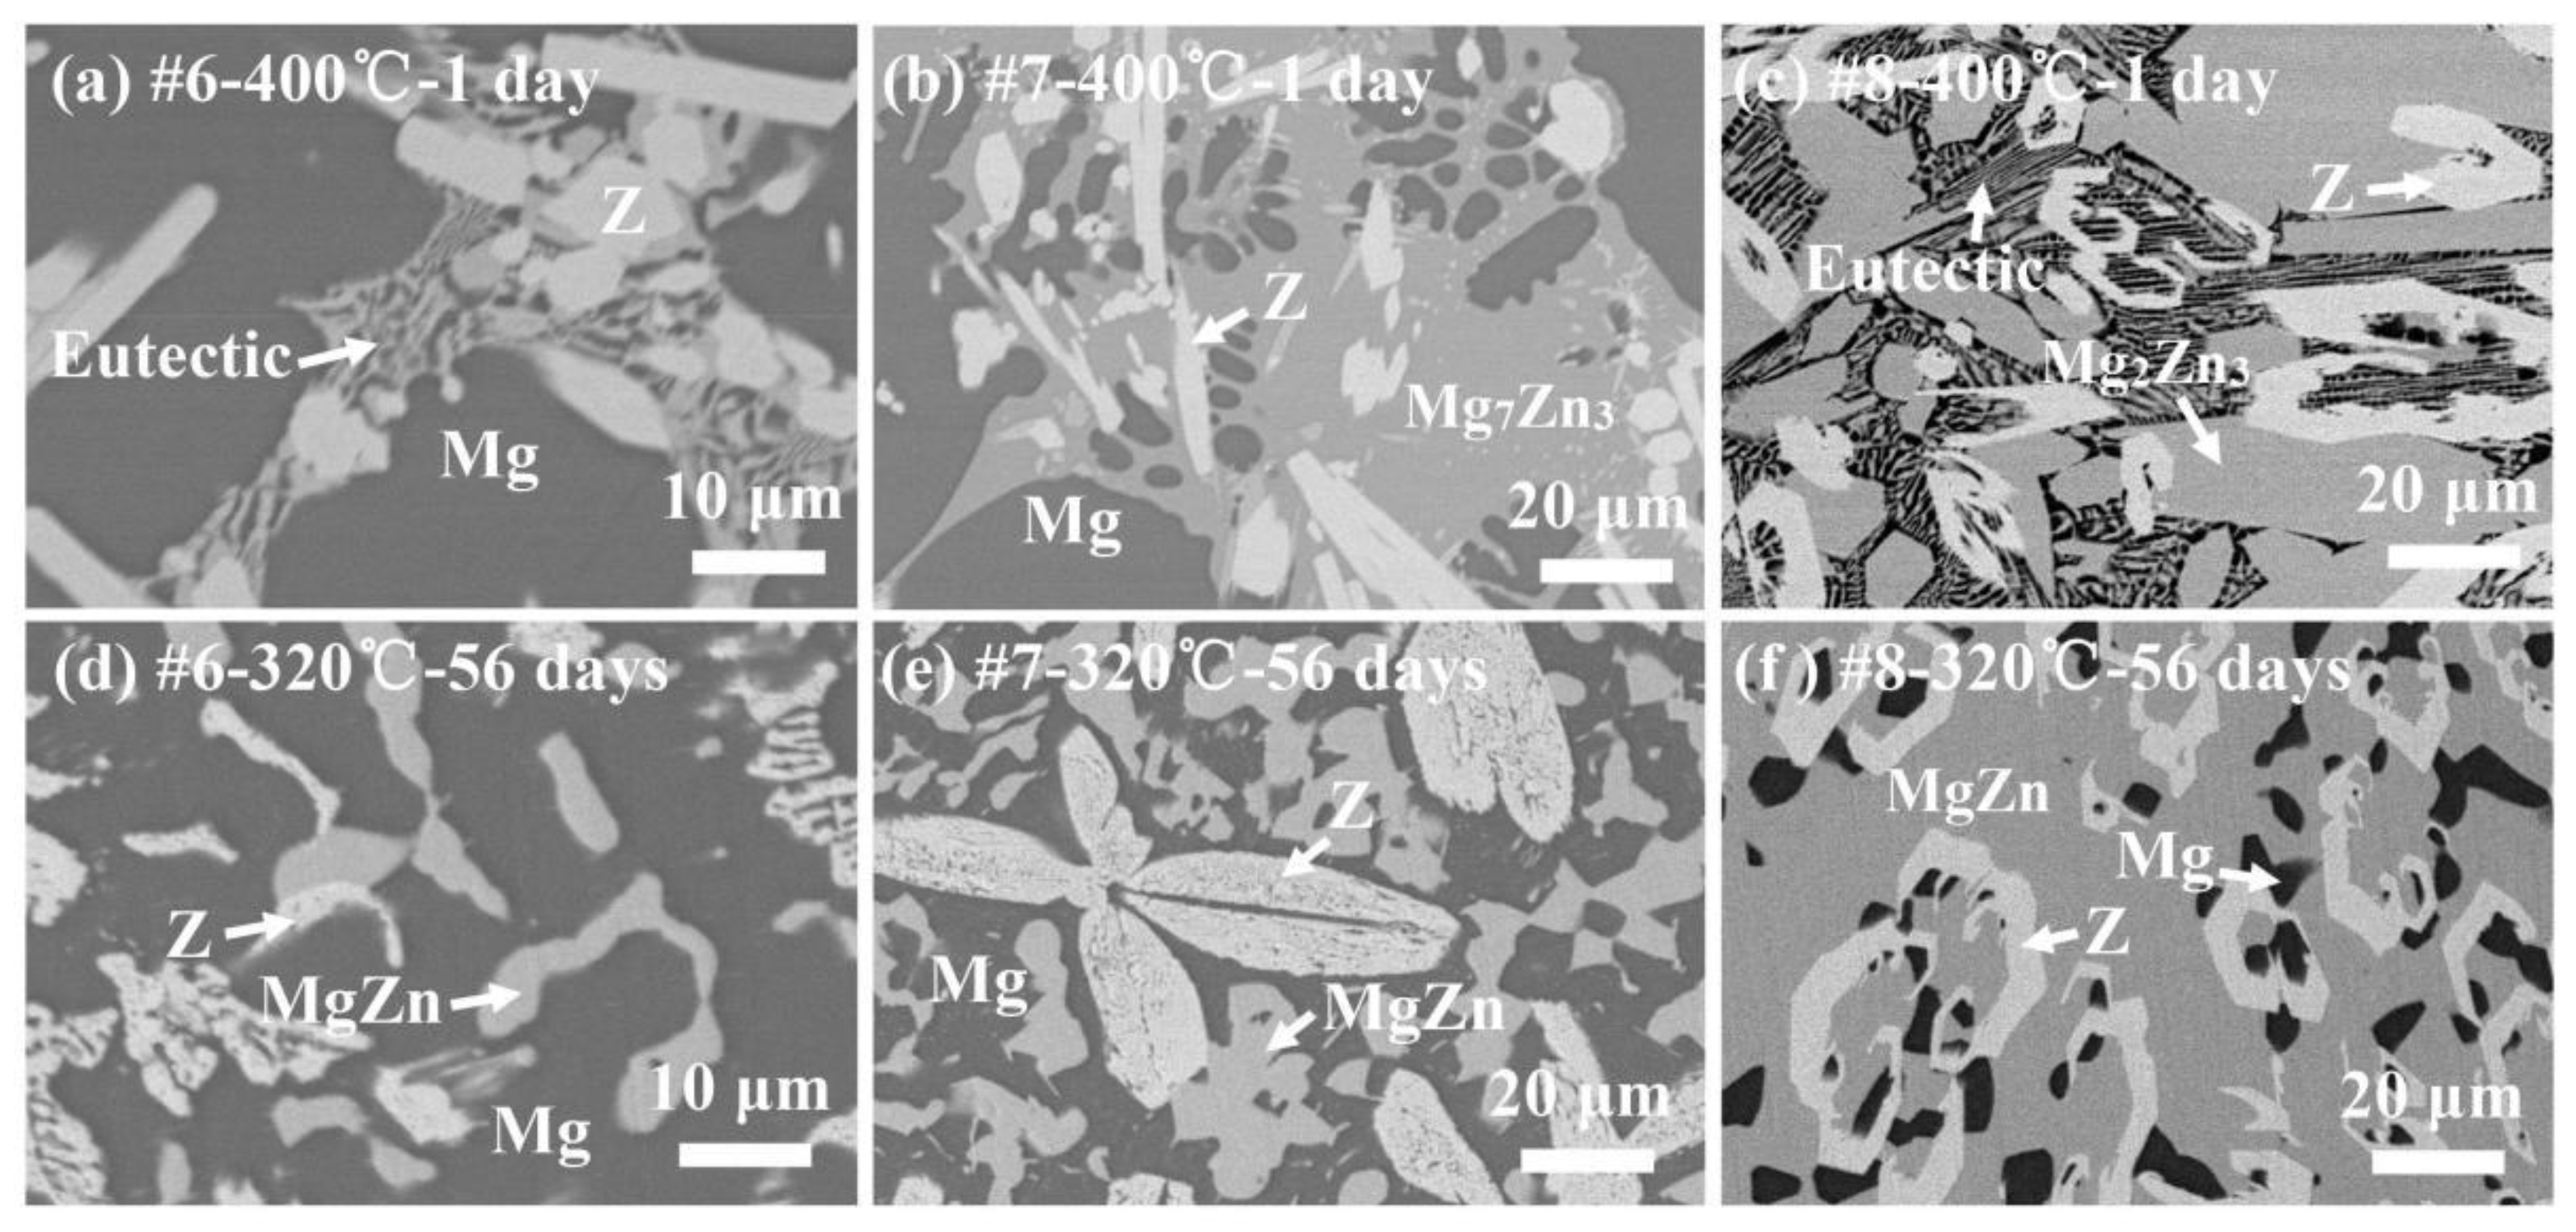
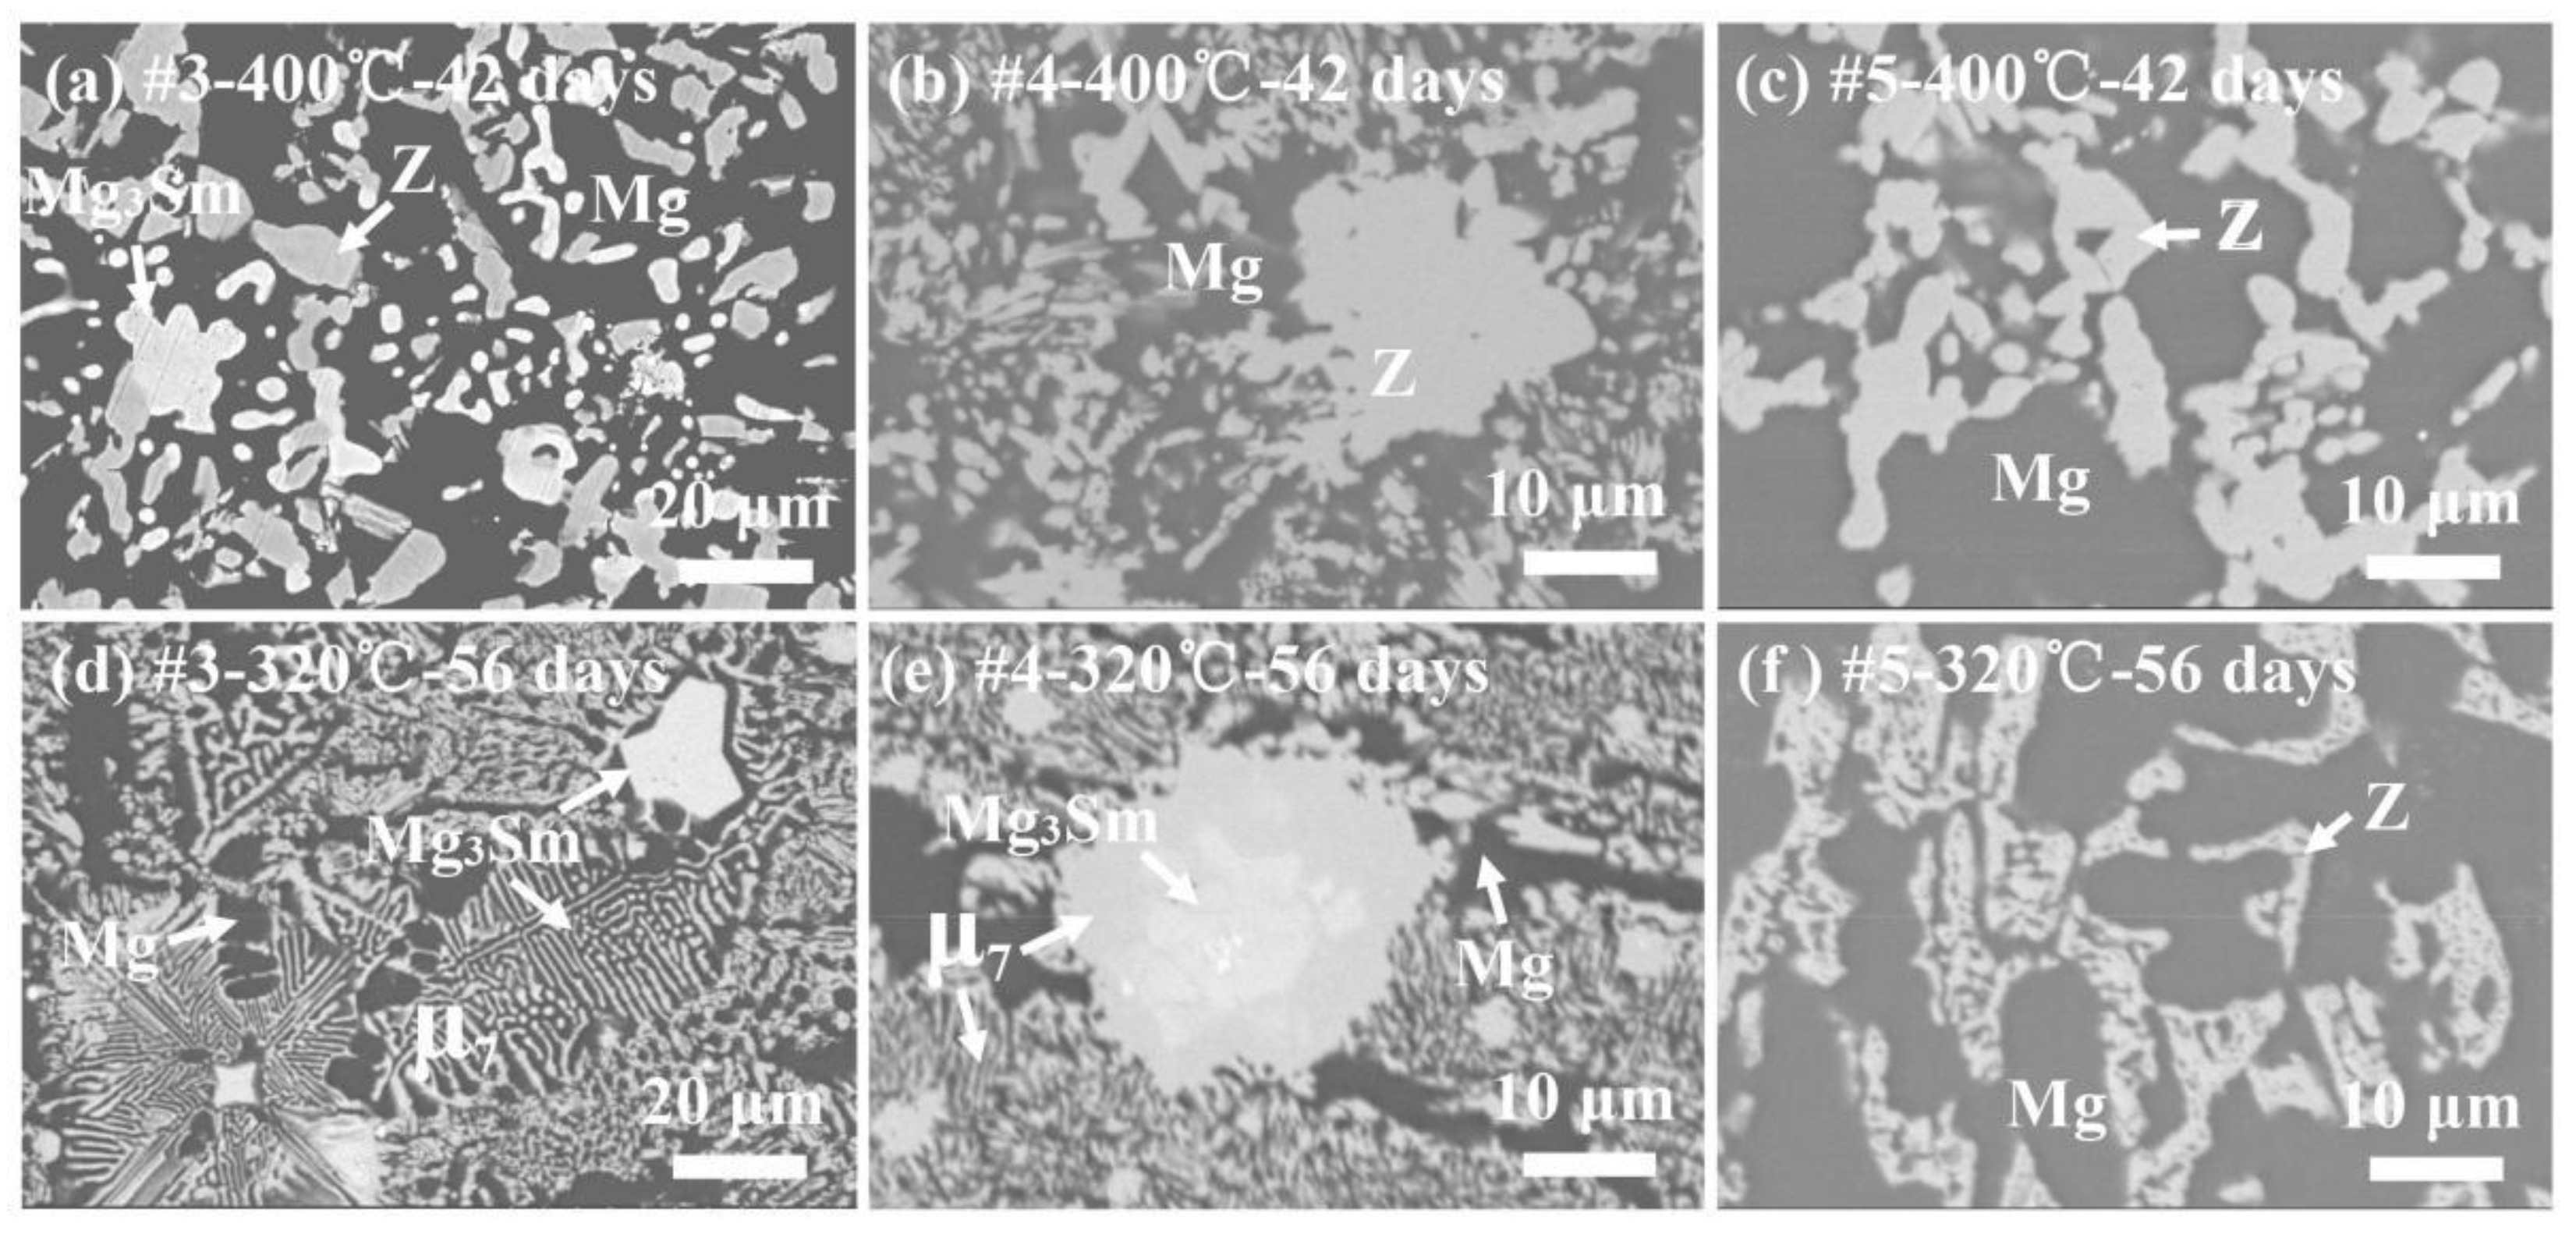
3.1. Microstructures of the As-Cast Mg-Zn-Sm Alloys

The microstructures of as-cast alloys were examined to better understand the phase transformation during solidification. The phase constitutions and compositions are summarized in Table 2.
The back-scatter electron (BSE) images of as-cast alloys #1 and #2 are shown in Figure 1a,b. The dark dendrites are Mg solid solution. The compositions of white particles are measured to be Mg64.1Zn16.7Sm19.2 in alloy #1 and Mg40.3Zn38.2Sm21.5 in alloy #2. The phase is identified to be Mg3Sm by XRD results in Figure 1c. Accordingly, the massive eutectic structure should be composed of Mg and Mg3Sm. A slight shift exists in the diffraction peaks of the Mg3Sm phase, seen in Figure 1c, which could be ascribed to the difference in Zn concentration. The atomic radius of Zn is smaller than that of Mg, and more Zn atoms replacing Mg atoms will reduce the lattice parameters of Mg3Sm phase, resulting in the shift of diffraction peaks to a higher angle.
Figure 2 gives the BSE images of as-cast alloys #3–#8. Four phases, Mg, Mg3Sm, Y and τ, are observed in both as-cast alloys #3 and #4 shown in Figure 2a,b. The solubility of Zn in Mg3Sm phase is measured to be 49.6 at.%, which is significantly higher than that measured in as-cast alloys #1 and #2. The Sm content in the Y phase (Mg62Zn31Sm7) is slightly lower than that reported by Drits et al. [17]. A small particle phase, denoted as τ here, is found to be embedded in the Y phase. The composition of τ is determined to be Mg36Zn50Sm14, but its structure is still unknown. In addition, this newly found phase is no longer detectable in subsequently annealed alloys. As displayed in Figure 2c,d, primary Mg dendrites and secondary coarse Y phase are located in the grain boundary in as-cast alloys #5 and #6. The massive Y phase in alloy #7 (see Figure 2e) suggests that it is the primary phase and is surrounded by subsequently formed Mg dendrites. The as-cast alloy #8, shown in Figure 2f, is composed of primary Z phase, MgZn2, MgZn and Mg7Zn3.

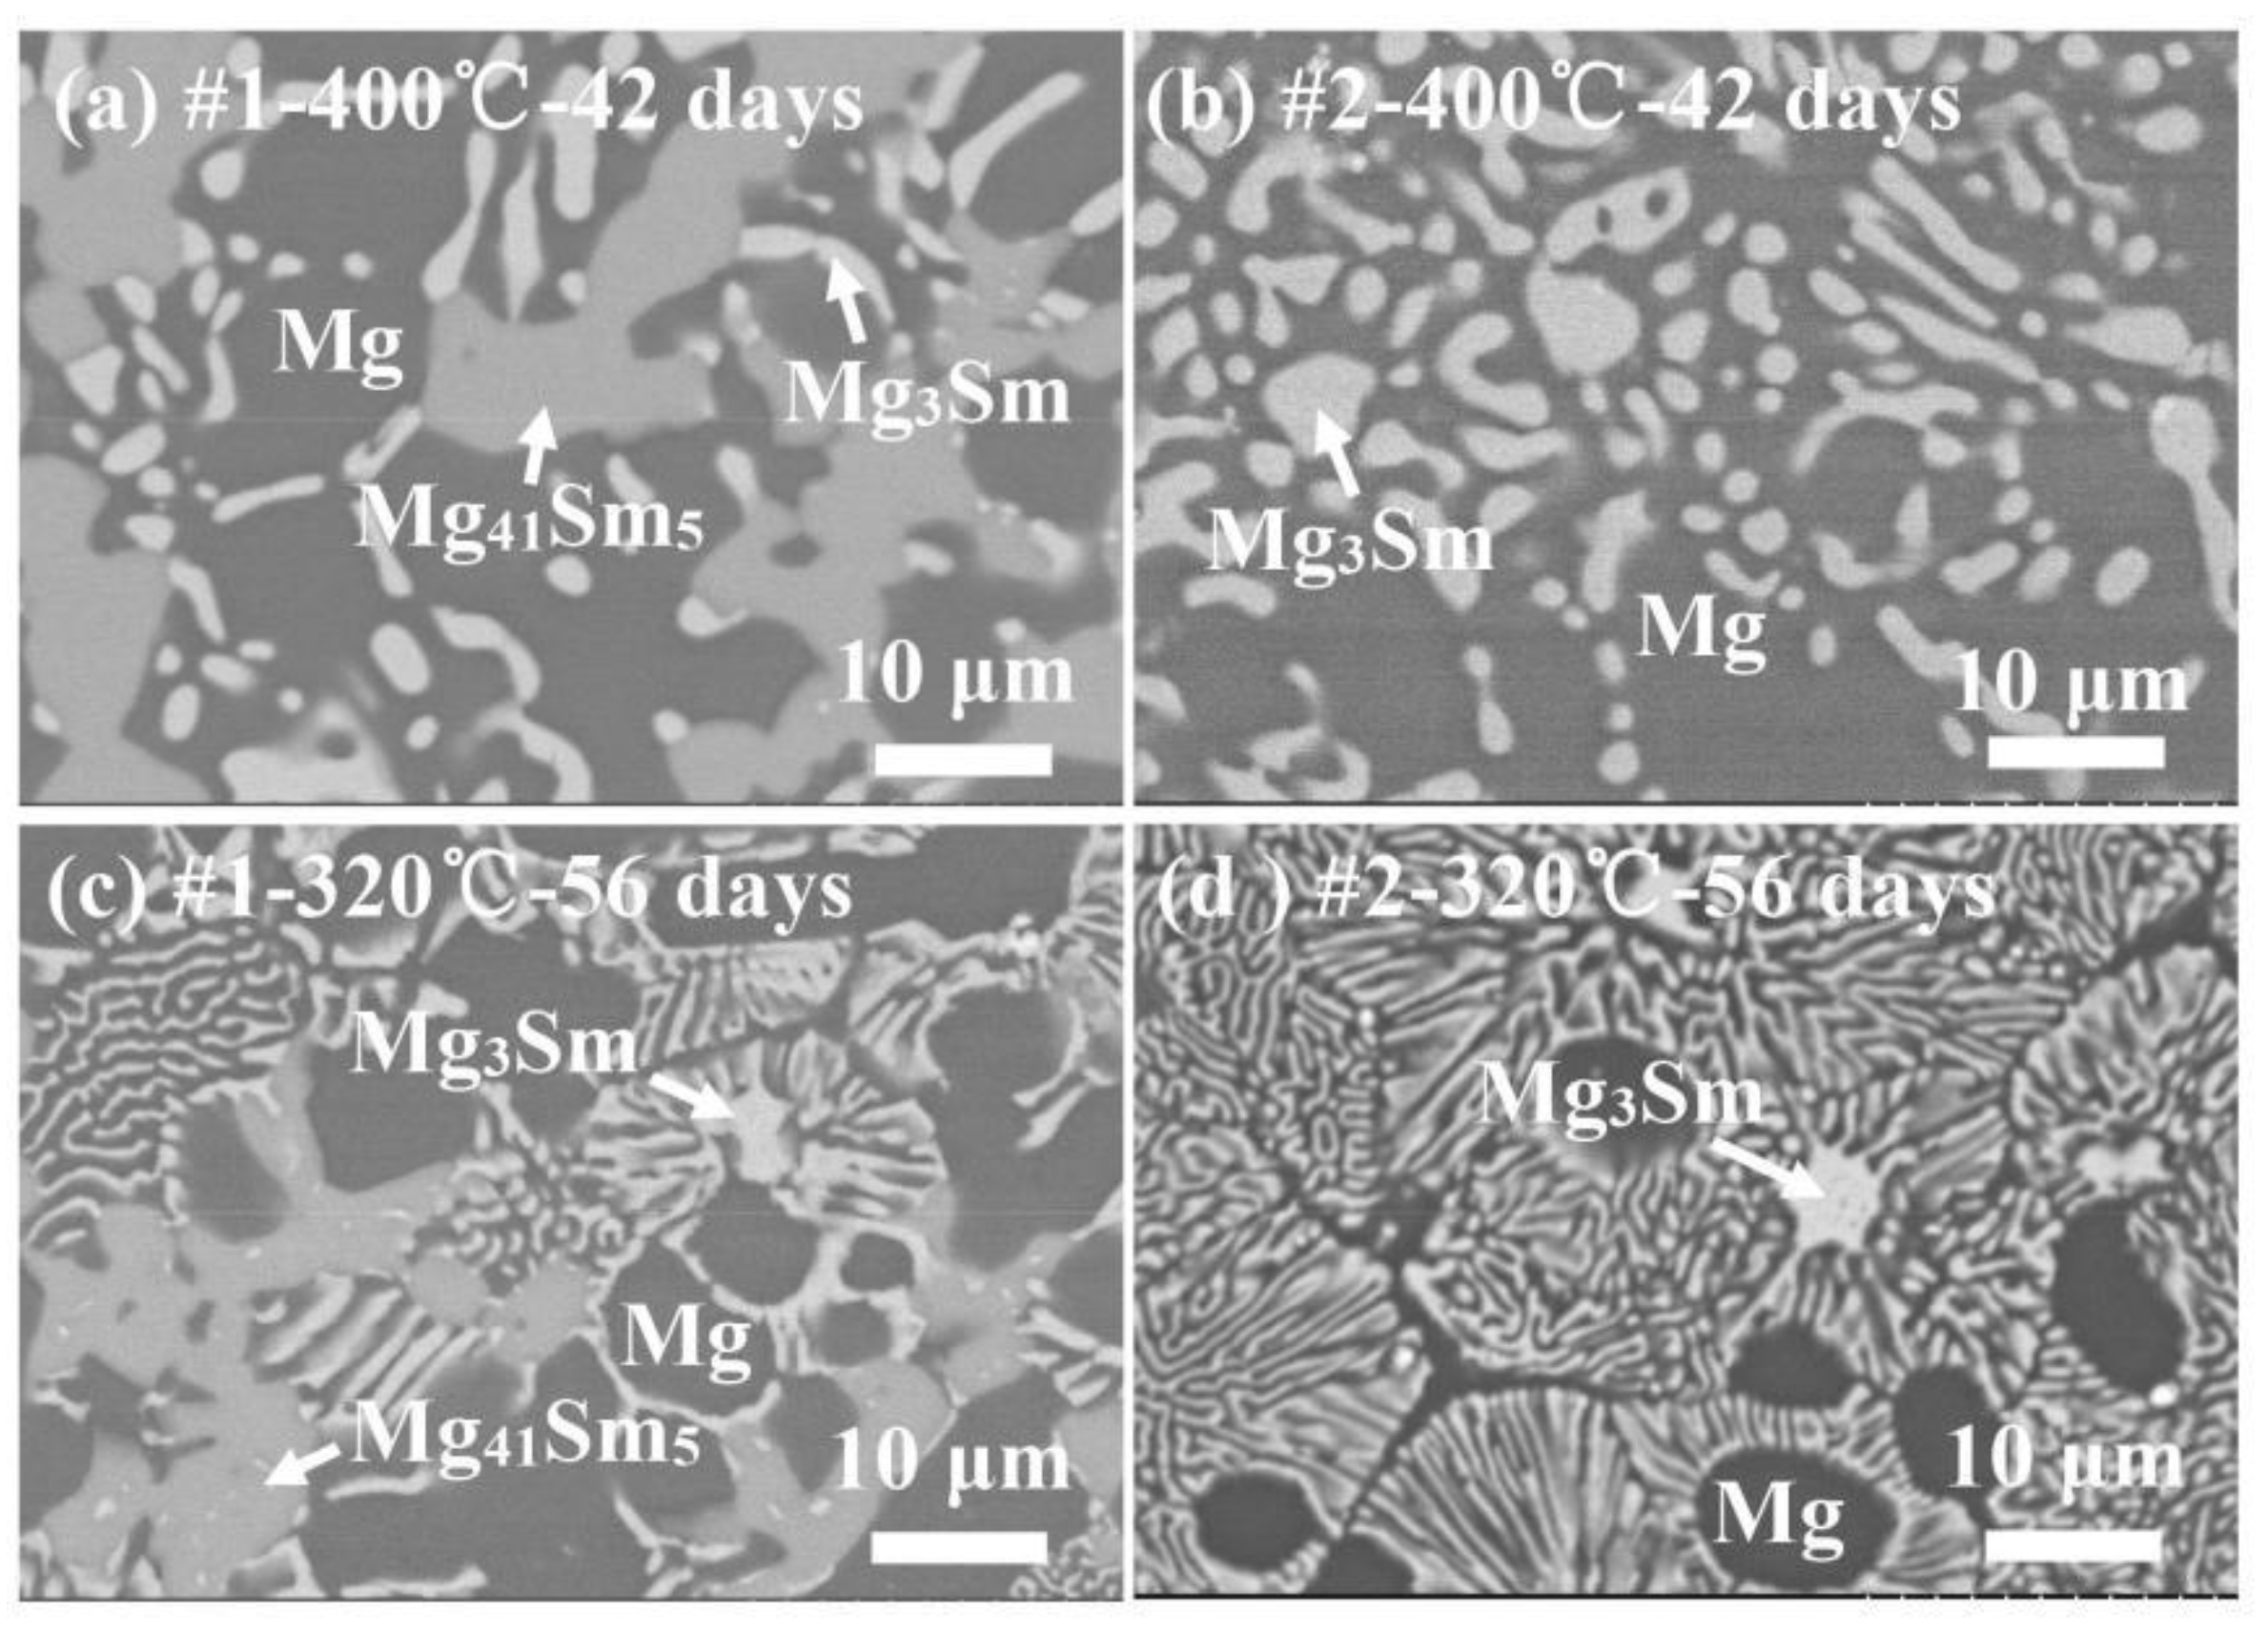
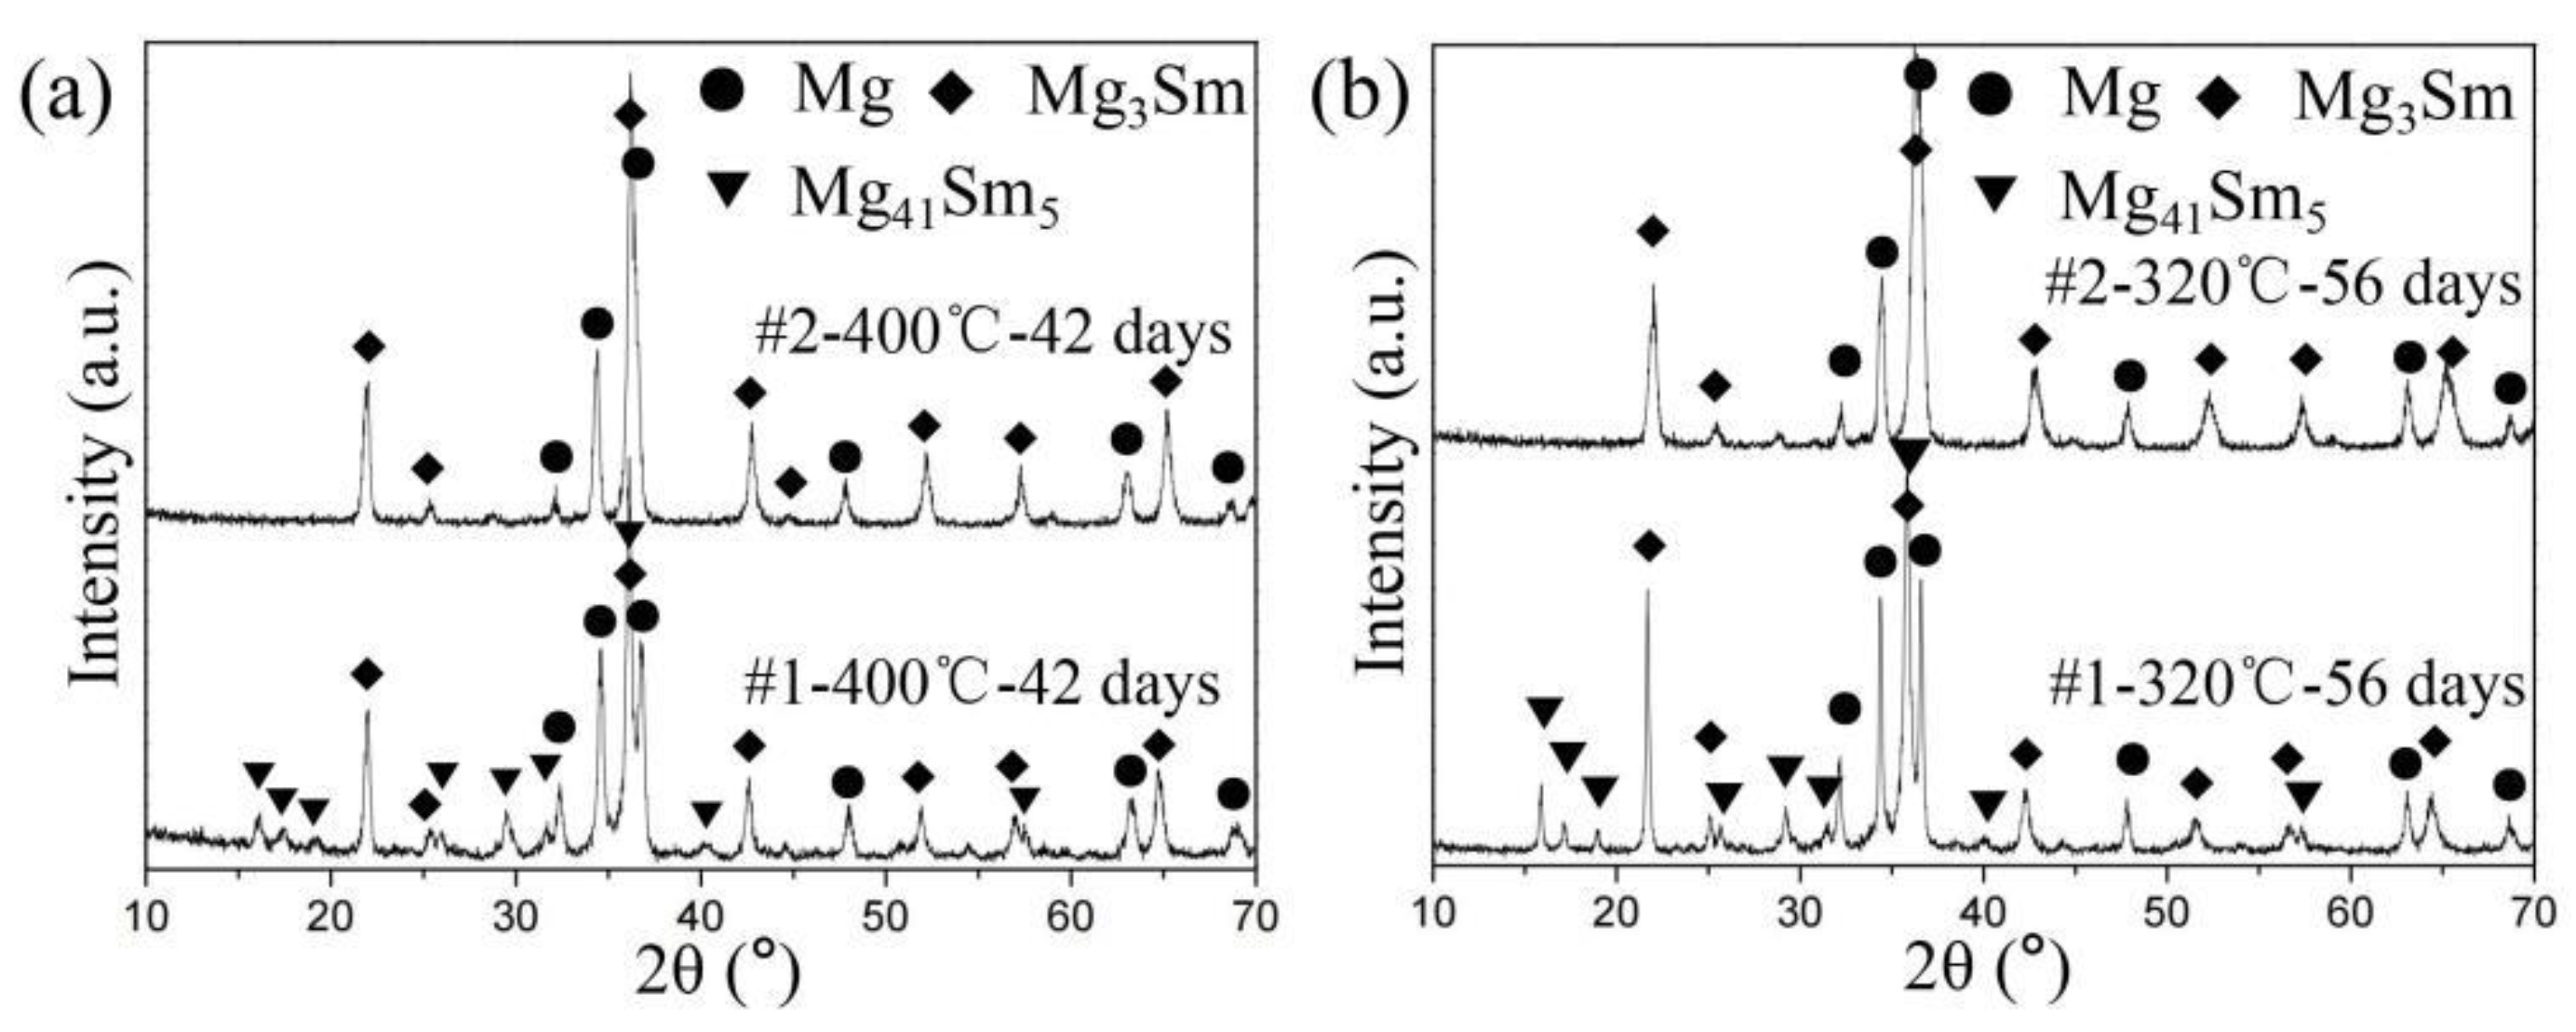
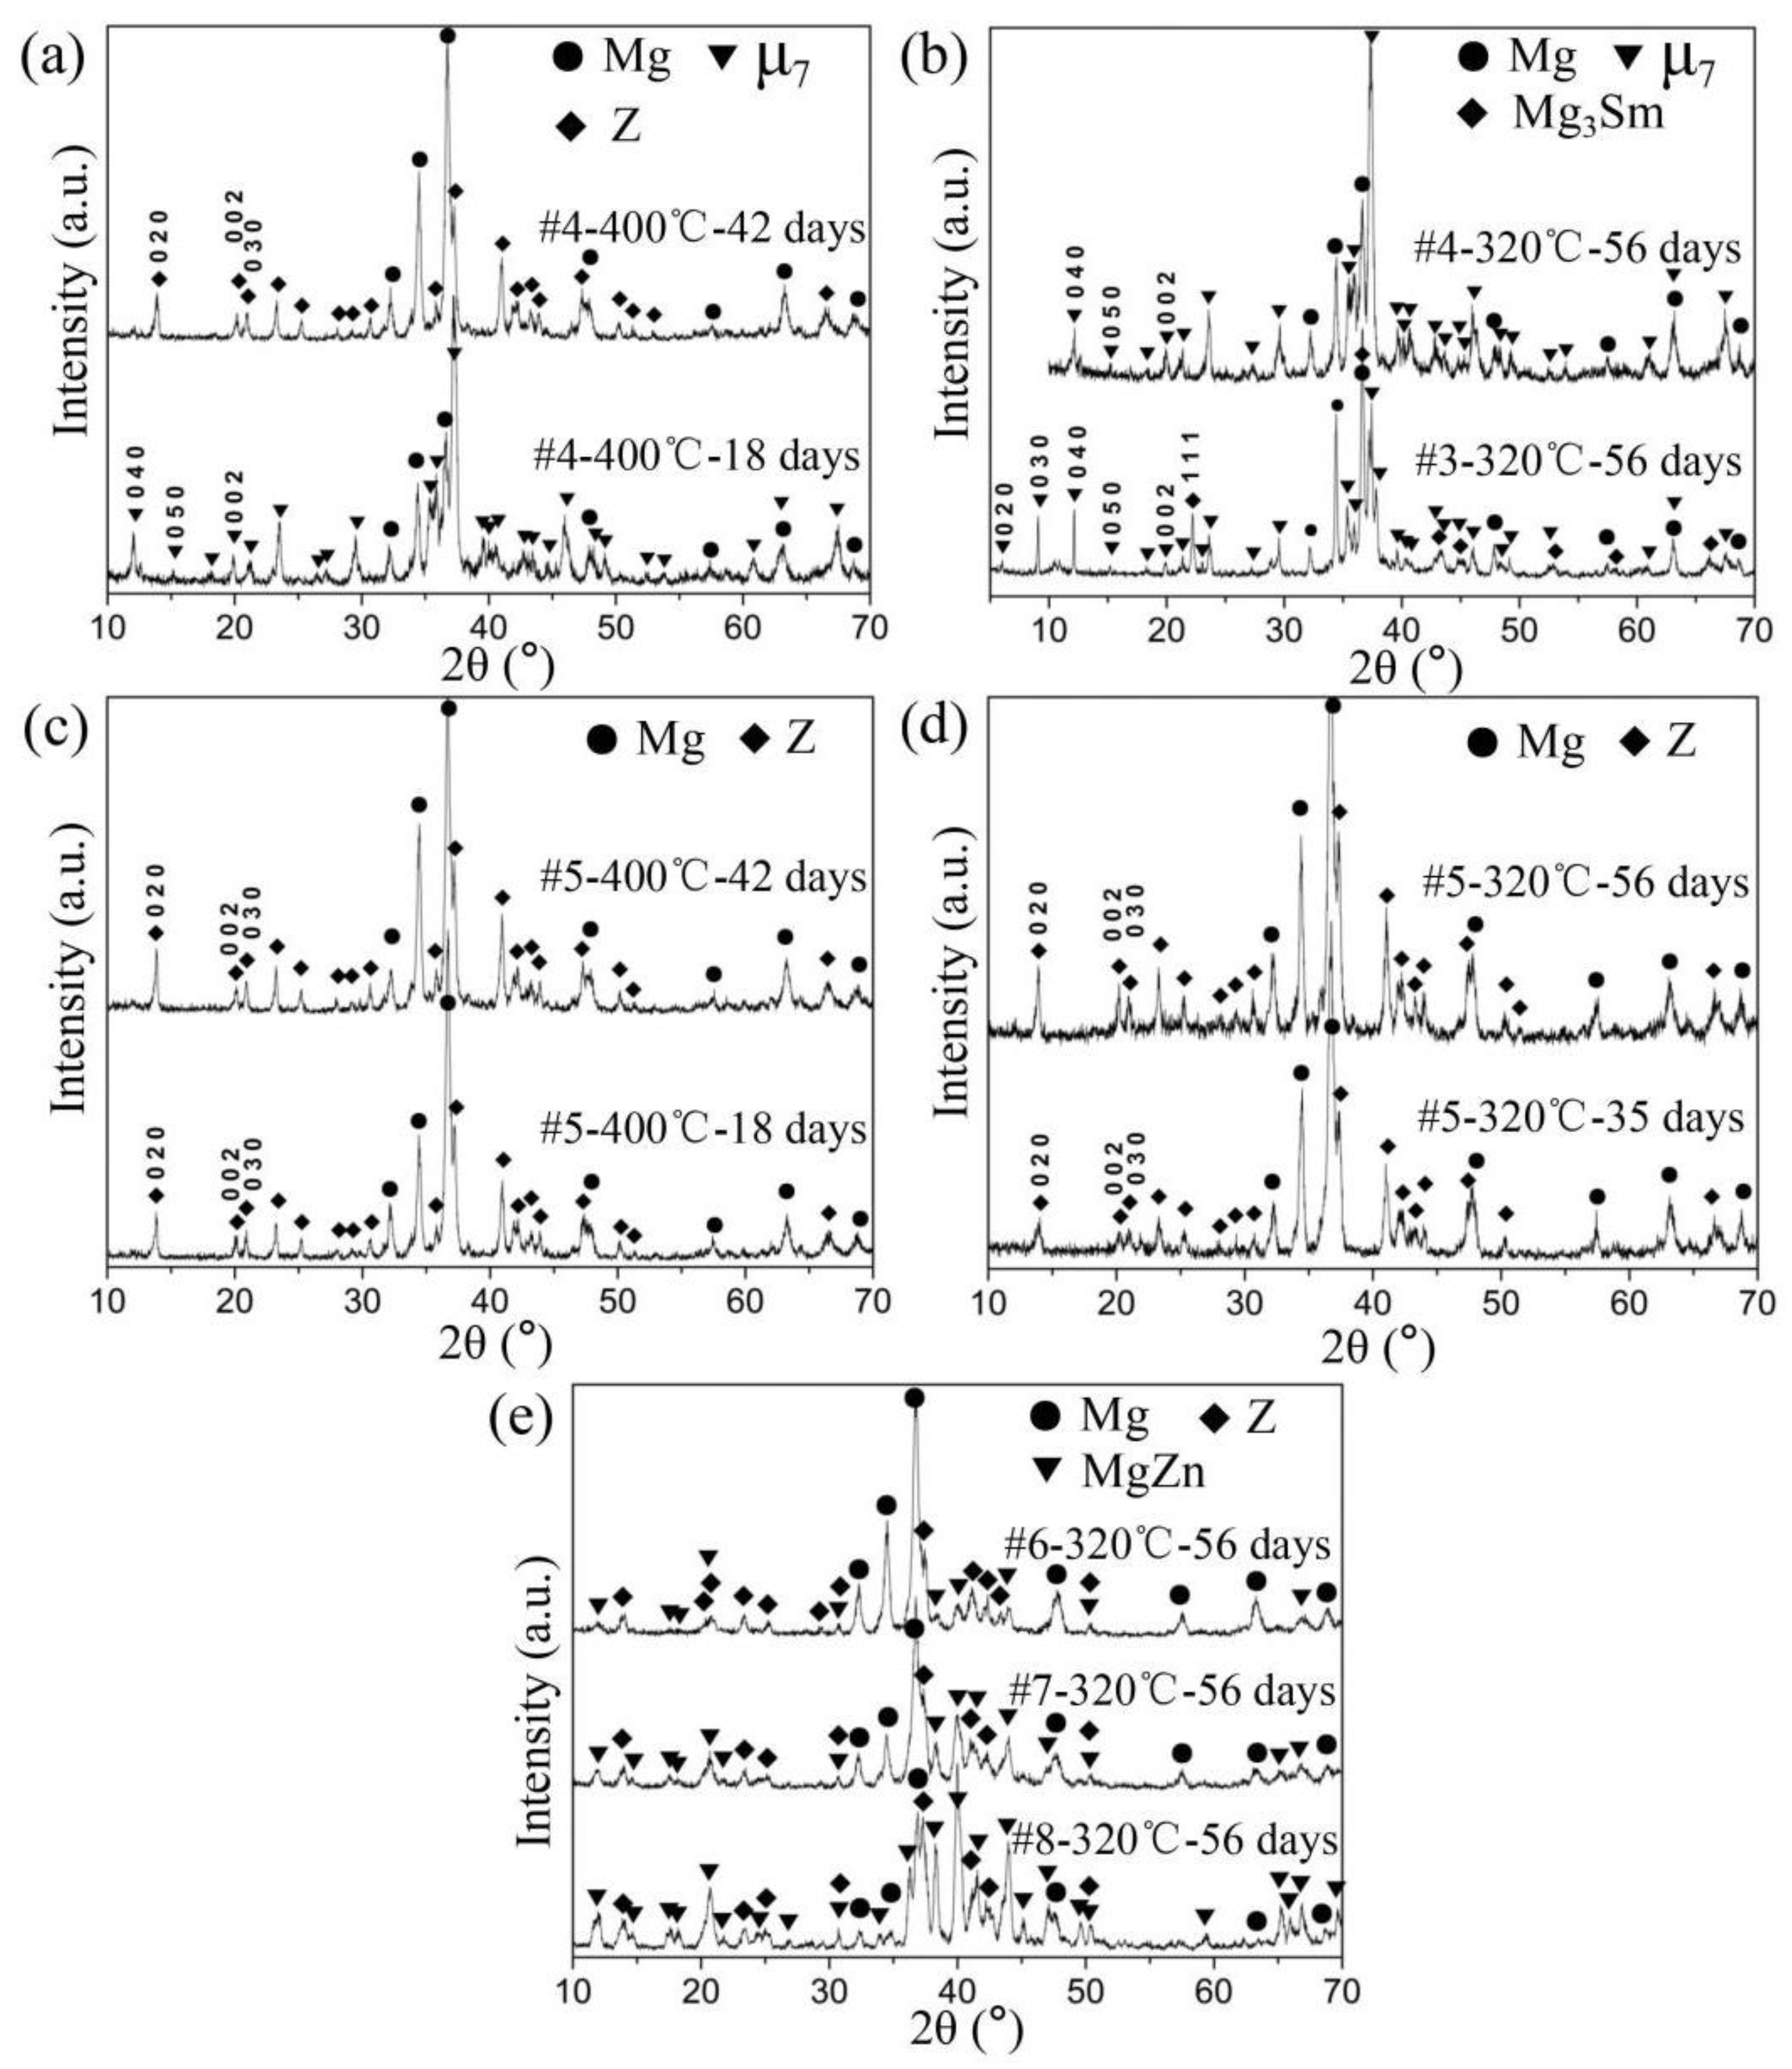
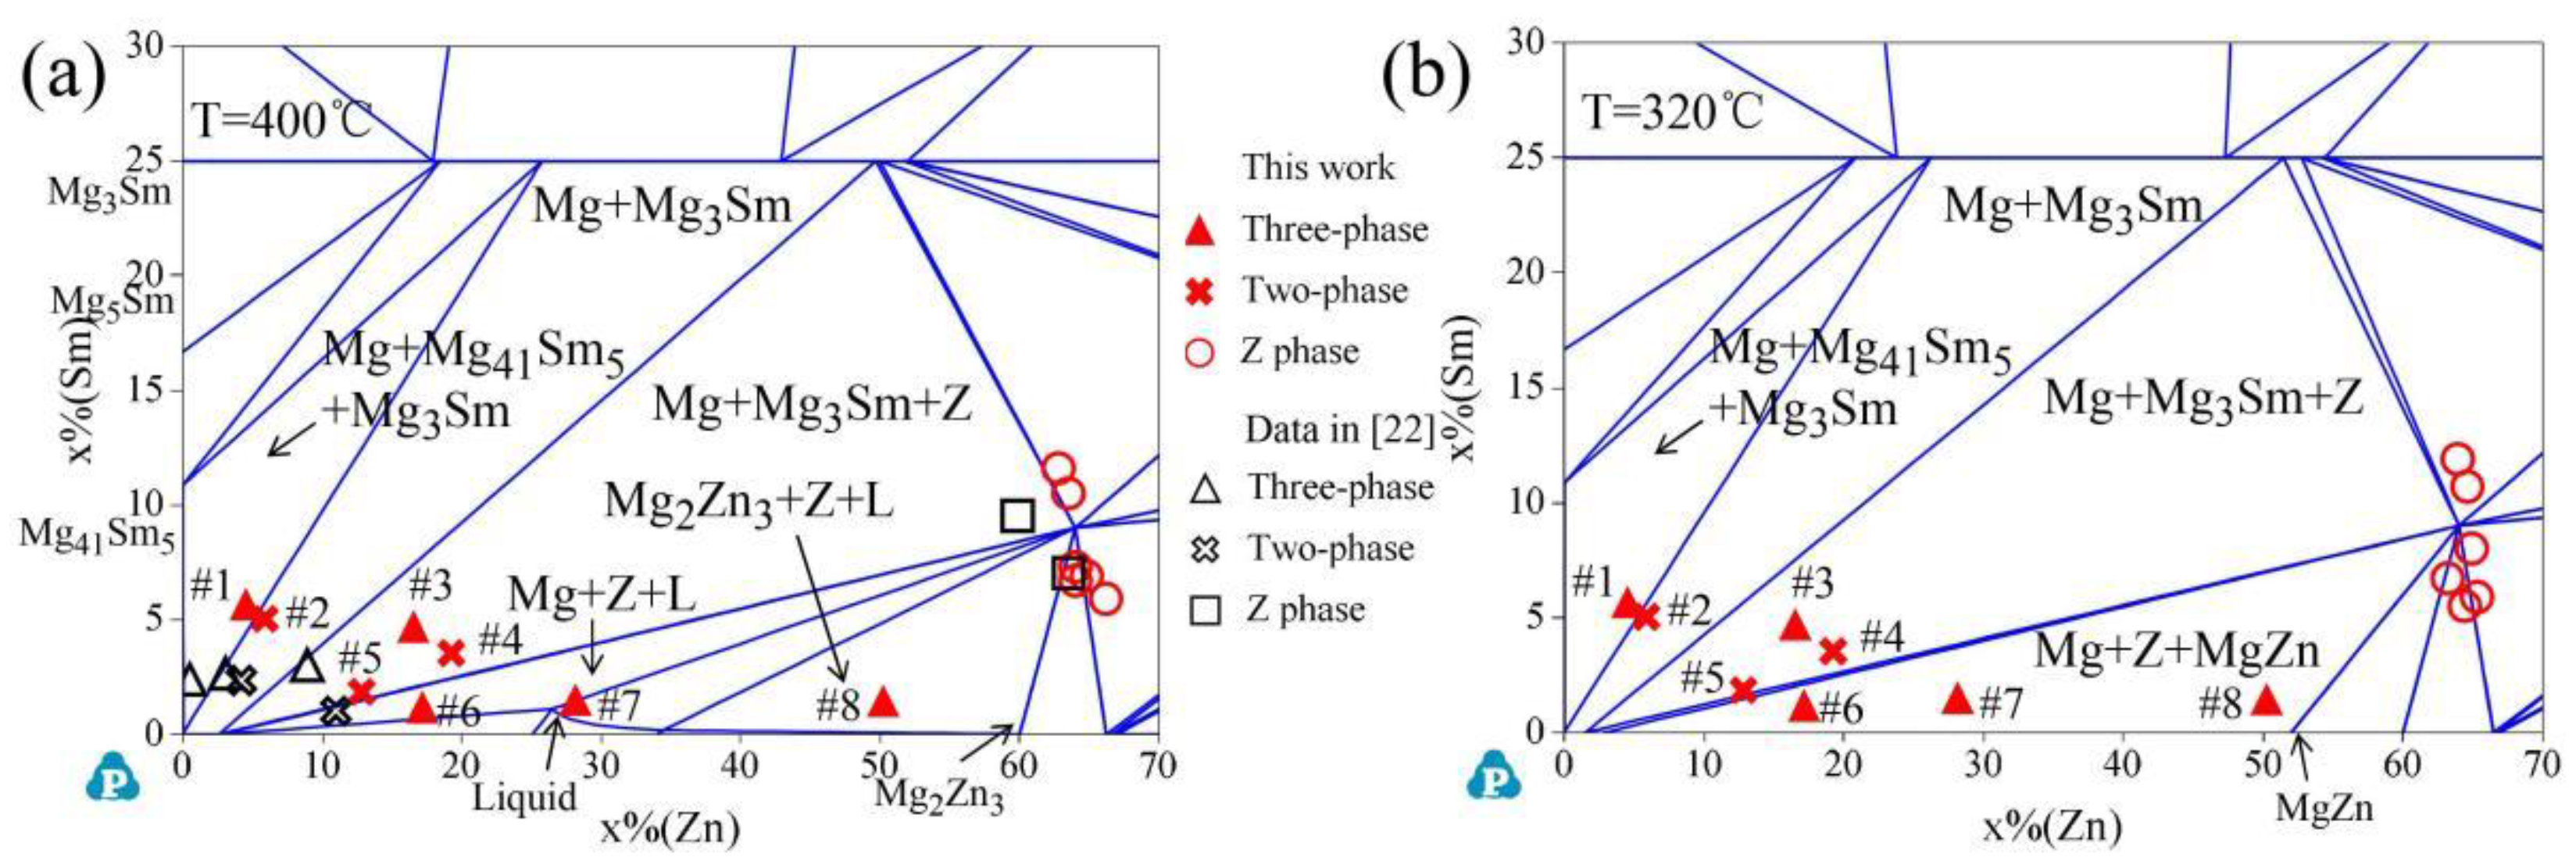
3.2. Phase Equilibria in Mg-Rich Corner at 400 and 320 °C

Figure 3 displays the microstructures of alloys #1–#2 annealed at 400 and 320 °C. Figure 3a,c are the BSE images of the annealed alloy #1, in which the blocky Mg41Sm5 is detected. The Zn contents of Mg3Sm in the annealed alloy #1 increase up to 28.3–30.2 at.%, much higher than that in the as-cast alloy. The alloy #1 should be within the (Mg) + Mg41Sm5 + Mg3Sm three-phase region. This result is also confirmed by the XRD results shown in Figure 4. With regard to alloy #2 annealed at 400 and 320 °C, the phase constitution is still (Mg) + Mg3Sm according to the XRD results displayed in Figure 4, the same as that under the as-cast condition. However, the fine eutectic Mg3Sm is observed in as-cast alloy #2 agglomerates together and grows into granules, as seen in Figure 3b. After annealing at 400 °C for 42 days, the morphology of Mg3Sm in alloy #2 is like that in alloy #1 shown in Figure 3a. Accordingly, it can be deduced that the phase equilibrium in alloy #2 at 400 °C is (Mg) + Mg3Sm, and the composition of Zn in Mg3Sm is almost unchanged after the heat treatment. Furthermore, the phase equilibrium of alloy #2 at 320 °C should be in accordance with that at 400 °C.
As displayed in Figure 5a, Mg3Sm in white, Z phase in grey and (Mg) in dark coexist in alloy #3 annealed at 400 °C for 42 days. Meanwhile, two-phase equilibrium (Mg) + Z in alloy #4 is observed in Figure 5b and confirmed by the XRD patterns shown in Figure 6a. However, hexagonal compound μ7, instead of Z phase, was detected by XRD seen in Figure 6b in alloys #3 and #4 annealed at 320 °C for 56 days. Note that the μ7 phase is also detected in alloy #4 annealed at 400 °C for 18 days, but it transforms into the Z phase when the heat treatment is extended to 42 days, as shown in Figure 6a. The above results indicate that the hexagonal compound μ7 is unstable at 400 °C and alloys #3 and #4 annealed at 320 °C for 56 days (see Figure 5d,e) are still far from the equilibrium state. It is believed that alloys #3 and #4 annealed at 320 °C could reach the equilibria of (Mg) + Mg3Sm + Z and (Mg) + Z, respectively, if the heat treatment time is long enough. In addition, the residual Mg3Sm in Figure 5e indicates that alloy #4 should be located in the (Mg) + Mg3Sm + Z region but close to (Mg) + Z region. Figure 5c and f display the BSE images of alloy #5 annealed at 400 and 320 °C, in which only (Mg) and Z phase are observed. It is worth noting that μ7 is not detected during the heat treatment according to the XRD patterns seen in Figure 6c and d. This suggests that compound μ7 is a transition phase that existed in the alloys located in (Mg) + Mg3Sm + Z region. The equilibrium in alloy #5 should be (Mg) + Z at both 400 and 320 °C.
The melting traces are observed on the surface of alloys #6–#8 after annealing at 400 °C, and the microstructures are significantly different from those under as-cast conditions. As seen in Figure 7a–c, the liquid phase in the quenching samples has solidified into the eutectic structure or the binary compound Mg7Zn3. However, the Mg7Zn3 phase is only stable at a narrow temperature range of 328–341 °C according to the Mg-Zn phase diagram. Thus, it can be deduced that the phase equilibrium at 400 °C is (Mg) + Z + liquid in alloys #6 and #7 while alloy #8 is within Mg2Zn3 + Z + liquid three-phase region. The XRD patterns of alloys #6–#8 annealed at 320 °C for 56 days are shown in Figure 6e. It indicates that these three alloys are within (Mg) + Z + MgZn three-phase region. As shown in Figure 7d–f, the phase fraction of MgZn in alloys from #6 to #8 gradually increases, corresponding to the significant rise of the diffraction intensity of MgZn.

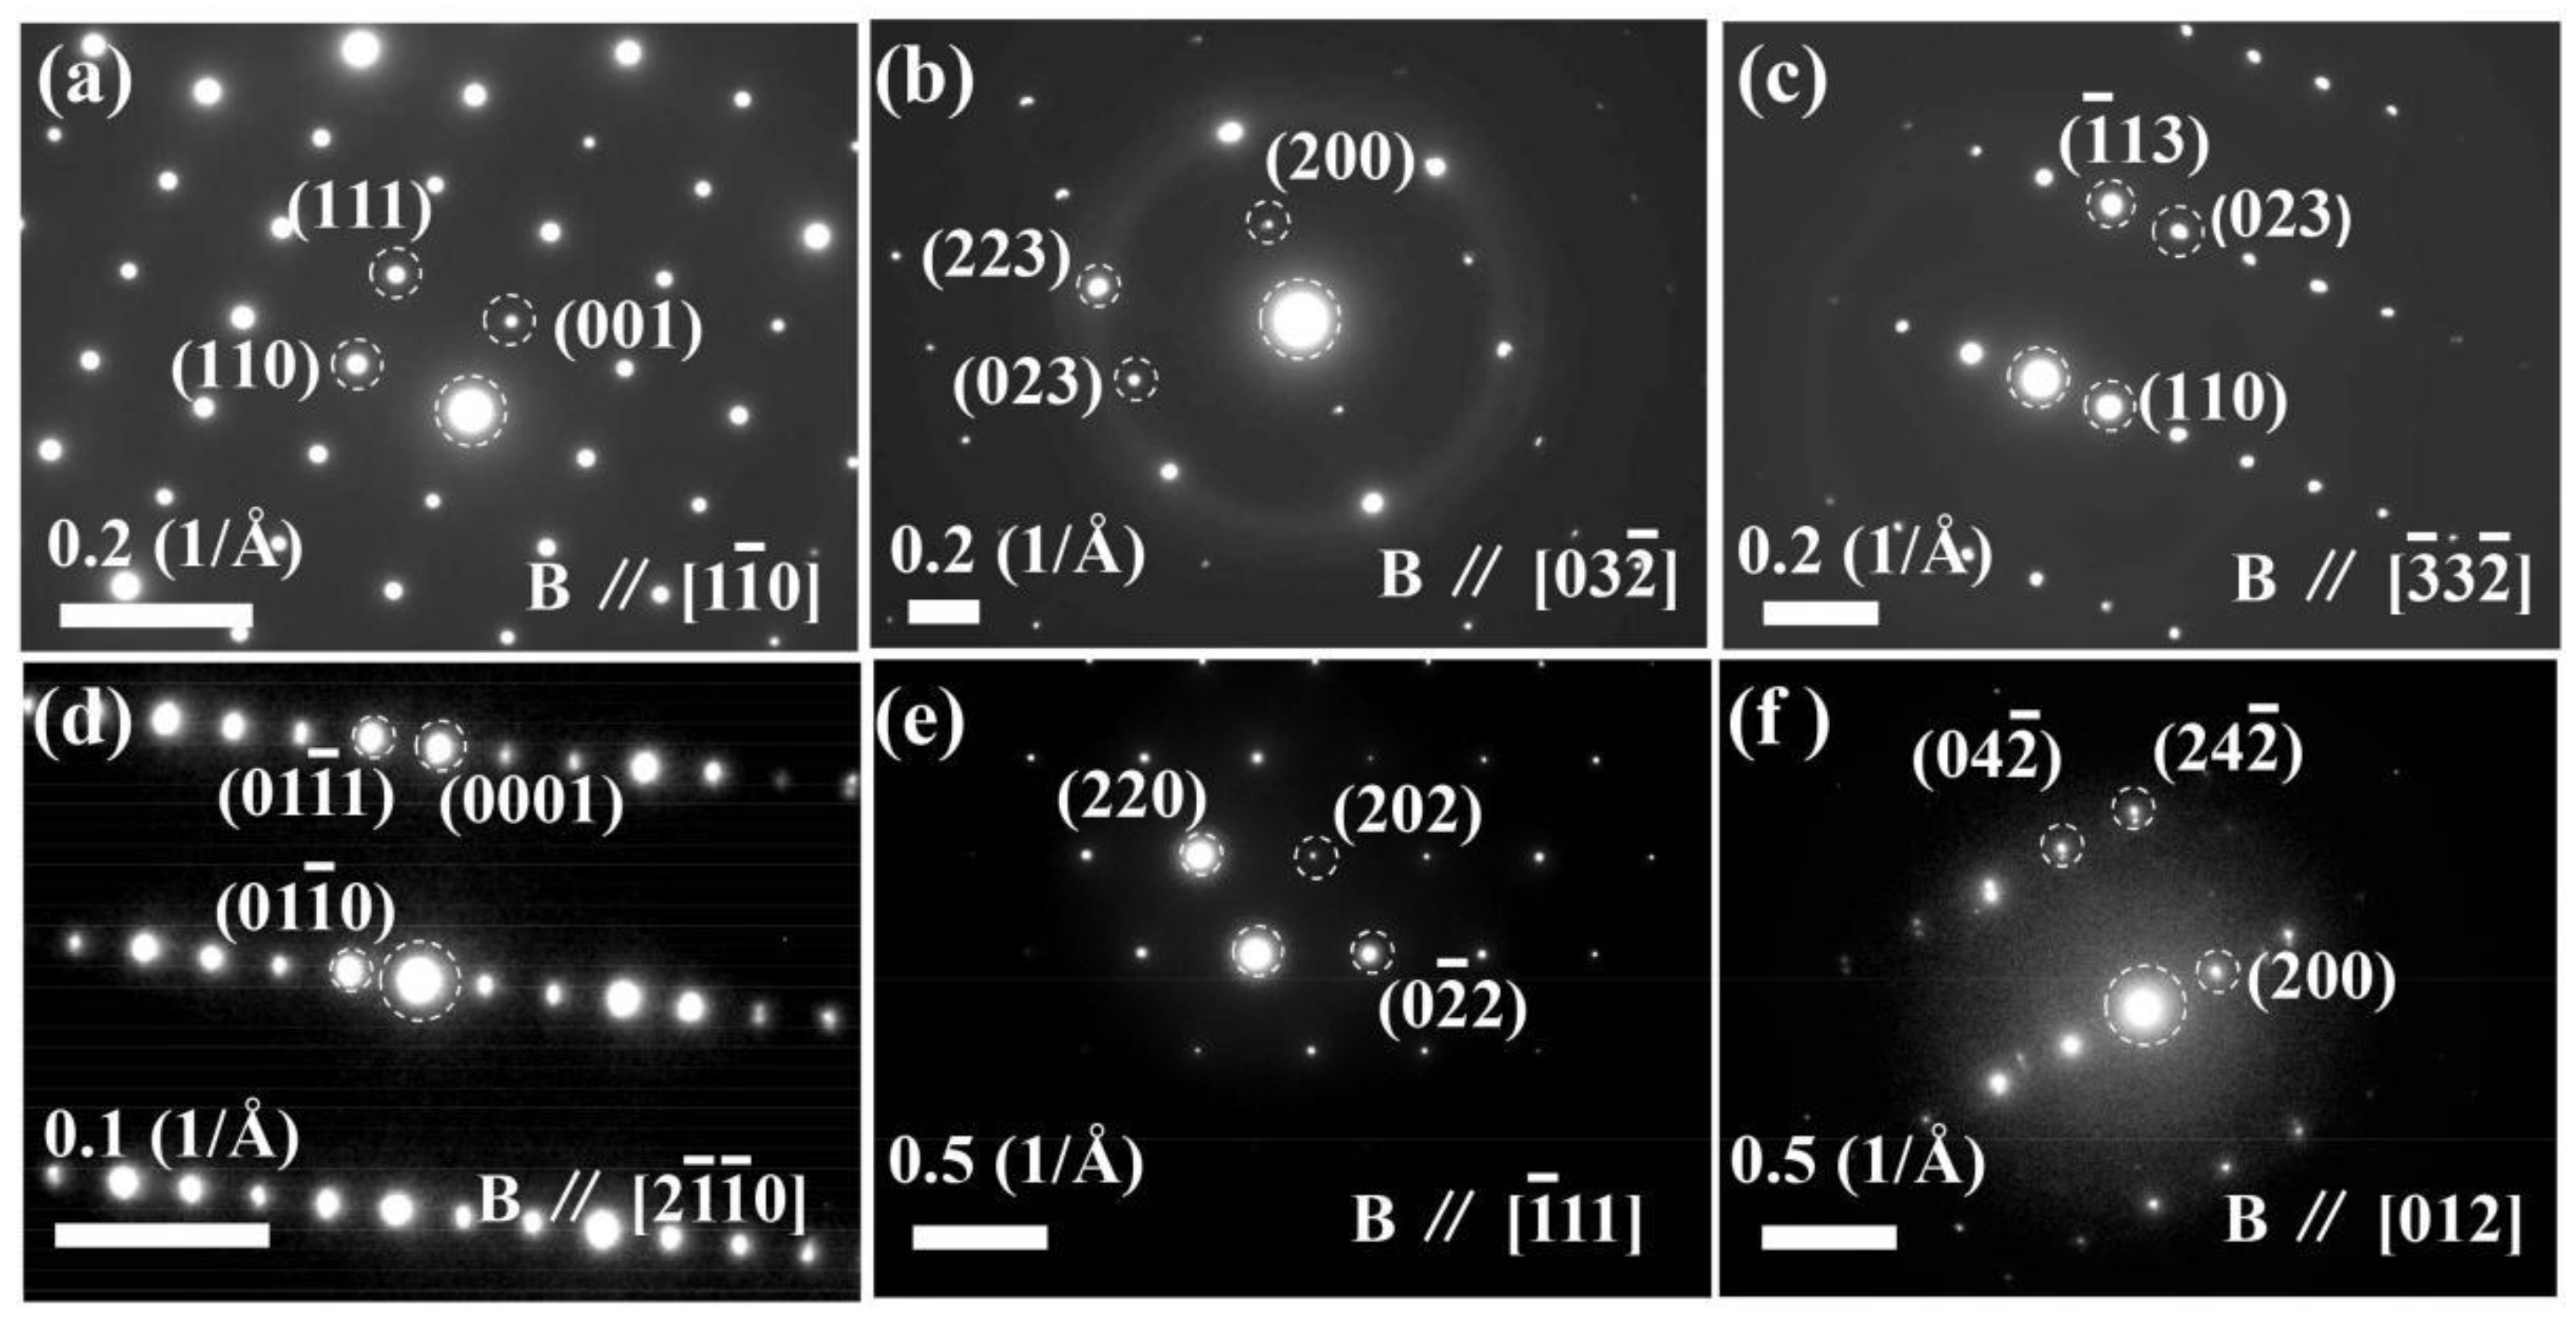
3.3. Crystal Structure of the Ternary Compounds

The ternary compound Y was firstly reported by Drits et al. [17], but the crystal structure is still unknown. In this study, the Y phase (Mg62Zn31Sm7) is observed in the as-cast alloys #3–#7. The crystal structure of the Y phase was analyzed by TEM. The SAED patterns (see Figure 8a–c) of the Y phase from three different directions could be indexed according to an orthorhombic unit cell with lattice parameters of a = 10.20 Å, b = 11.26 Å and c = 9.64 Å. It should be noted that the Y phase is unstable because its composition is located in the (Mg) + Mg3Sm + Z region and close to the tie line of (Mg) + Z. The Y phase will transform into the stable Z phase (HCP, a = 14.62 Å, c = 8.78 Å [17]) after annealing at 400 and 320 °C. The μ7 phase was detected in alloys #3 and #4 annealed at 320 for 56 days by XRD. For further confirmation, the μ7 phase was identified by TEM. The SAED pattern of ternary compound μ7, displayed in Figure 8d, gives a hexagonal structure with lattice parameters of a = 34.62 Å and c = 8.94 Å, which is close to the calculation result from the XRD pattern (a = 33.57 Å, c = 8.86 Å) and agrees with the reports by Sugiyama et al. [20].
The Mg3Sm phase is observed in alloys #1–#4. The maximum solubility of Zn in Mg3Sm is measured to be 49.2 at.% at 400 °C, which is significantly higher than that reported in the literature [17,22]. In addition, the Mg3Sm (Mg28.9Zn48.7Sm22.4) phase in alloy #3 annealed at 320 °C for 56 days (see Figure 5d) maintains eutectic morphology like that in as-cast condition, indicating that Mg3Sm owns outstanding thermal stability at 320 °C. The SAED patterns in Figure 8e and f reveal that Mg3Sm phase has an FCC structure with the lattice parameter of a = 6.696 Å. It could be concluded that the Mg3Sm phase with Zn dissolved maintains the same crystal structure compared with the binary Mg3Sm phase (a = 7.36 Å), but the ternary Mg3Sm phase has a smaller lattice constant.

3.4. Thermodynamic Calculation of the Mg-Zn-Sm System

All the thermodynamic calculations in this work were performed on the Pandat software [24]. The binary Mg-Sm [25], Mg-Zn [26] and Sm-Zn [27] were adopted to calculate the ternary phase diagram. The thermodynamic database of Mg-Zn-Sm system was constructed with CALPHAD method [28].
The Gibbs energies of pure Mg, Zn and Sm were taken from the SGTE database [29]. The solution phases, including liquid, HCP, BCC and RHOMB_C19, are described with the substitutional solution model, which is expressed as
G m φ = i x i G i 0 ,   φ + R T i x i ln x i + G i e x ,   φ
where G i 0 ,   φ is molar Gibbs energy of pure i with structure φ and G i e x ,   φ is the excess Gibbs energy formulated with a Redlich–Kister polynomial [30,31].
Mg3Sm is treated as a linear compound considering the large solubility of Zn in it. The Gibbs energy is expressed using the compound energy formalism (CEF) [32] with the model of (Mg, Zn)0.55(Mg)0.2(Sm)0.25, which can intuitively reflect the phase composition and substitution of Mg by Zn. The corresponding Gibbs energy formula is described as
G m Mg 3 Sm = y Mg G Mg : Mg : Sm 0 ,   Mg 3 Sm + y Zn G Zn : Mg : Sm 0 ,   Mg 3 Sm + 0.55 R T y Mg ln y Mg + y Zn ln y Zn + y Mg y Zn L   0 Mg ,   Zn : Mg : Sm Mg 3 Sm + y Mg y Zn L   1 Mg ,   Zn : Mg : Sm Mg 3 Sm
where y Mg and y Zn are the site fractions of Mg and Zn on the first sublattice, respectively. G Mg : Mg : Sm 0 ,   Mg 3 Sm and G Zn : Mg : Sm 0 ,   Mg 3 Sm are the Gibbs energy of the end-member phases. G Zn : Mg : Sm 0 ,   Mg 3 Sm and the ternary interaction parameter of the liquid phase are carefully modified based on the liquidus and solidus reported by Drits et al. [17]. Moreover, interaction parameters of Mg3Sm phase L   0 Mg ,   Zn : Mg : Sm Mg 3 Sm and L   1 Mg ,   Zn : Mg : Sm Mg 3 Sm are optimized considering the alloy compositions and solubility of Zn in Mg3Sm.
Since the Y phase is observed in the as-cast alloys frequently, it was also added to the thermodynamic database to help forecast the phase formation of the as-cast alloys. To further simplify the modeling, both phases Y and Z are modeled with stoichiometric formula according to their average compositions. The Gibbs energy is expressed as
G m φ = i = 1     x i G i 0 ,   φ + G f
where G f is formation Gibbs energy in the form of a + bT. The parameters a and b are optimized according to the invariant reactions of L + Mg3Sm→(Mg) + Y at 432 °C and L + Y→(Mg) + Z at 405 °C reported by Drits et al. [17].
A stoichiometric model for Mg41Sm5 [25] was adopted due to the relatively low solubility of Zn determined in this work. Furthermore, the model parameters of HCP and Mg41Sm5 were re-optimized to fit the solubility data of Sm in Mg reported by Saccone et al. [33]. All the models and parameters involved in this work are listed in Table 3.
The calculated isothermal sections of the Mg-Zn-Sm system in the Mg-rich corner at 400 and 320 °C are displayed in Figure 9a,b, respectively, and are generally in good agreement with the experimental data. The compositions of alloys #1 and #2 are located in the (Mg) + Mg41Sm5 + Mg3Sm and (Mg) + Mg3Sm phase regions. Although the alloys #3 and #4 annealed at 320 °C did not reach equilibrium during the limited time, they should be within the equilibrium region of (Mg) + Mg3Sm + Z and (Mg) + Z, respectively, according to the equilibrated phase constitution at 400 °C. Moreover, the miscibility gap between Mg3Sm and τ3 shown in the thermodynamic assessment work [23] is doubtful and needs more powerful evidence. Thus, this miscibility gap is not accepted in this work. The calculated composition of the Z phase is located in the center of the measured values in this work and the literature [22]. The compositions of alloys #4 and #5 lie near the (Mg) + Z two-phase region boundary. The three-phase equilibrium of (Mg) + Z + MgZn in alloys #6–#8 annealed at 320 °C is consistent with the calculation.
Figure 10 provides two calculated vertical sections together with the phase transition temperatures from the literature. Although a large difference in liquidus on the Mg-Sm side is shown in Figure 10a, the calculated melting point at Mg-35 wt.% Sm coincides with the thermal analysis data in the binary phase diagram [33]. Moreover, it can be seen that the calculated phase boundary generally agrees well with the experimental data from Drits et al. [17], particularly on the Mg-Zn side.
The liquidus projections without the Y phase and with the Y phase in the Mg-rich corner are displayed in Figure 11. The compositions of alloys #1–#7 are marked on the liquid surface with a gray dashed line pointing toward the apex, and thus the primary and secondary phases can be easily read. It can be seen that the predicted primary Mg solution and subsequent eutectic reaction of L(Mg) + Mg3Sm agree well with the microstructure results of as-cast alloys #1 and #2. However, large discrepancies are found in the region near the Mg-Zn side. Since the Y phase is not an equilibrium phase according to our experimental results, the equilibrium phase diagram shown in Figure 11a disagrees with the as-cast microstructures of alloys #3–#7. Therefore, the liquidus projection containing the Y phase is calculated as shown in Figure 11b. Thermodynamic calculation of Y phase formation has been conducted by suspending stable Z phase in a constrained Scheil solidification simulation to interpret the as-cast microstructures. For instance, the eutectic reaction of L(Mg) + Mg3Sm and L(Mg) + Y in the Scheil solidification simulation of alloy #3, seen in Figure 11c, corresponds to the eutectic structure of (Mg) + Mg3Sm and (Mg) + Y shown in Figure 2a. Nevertheless, the Mg7Zn3 formed at the end of the solidification simulation was not observed in the as-cast microstructure of alloy #3. It is speculated that particle compound τ (Mg36Zn50Sm14) and supersaturated Mg solid solution consumed a certain amount of Zn atoms, resulting in not enough Zn atoms for the formation of Mg7Zn3, or the Mg7Zn3 was formed but the fraction was too low to be detected. With regard to the simulation result of alloy #7 shown in Figure 11d, the phase constitution (the primary Y phase, the secondary Mg solid solution and the final Mg7Zn3 matrix) and the phase fractions are both consistent with the microstructure of the as-cast alloy #7 shown in Figure 2e. Table 4 provides the predicted invariant reactions of the Mg-Zn-Sm system in the Mg-rich corner. It can be seen that the calculated invariant reaction temperatures are basically in accordance with the data from the literature.

4. Conclusions

The phase equilibria of the Mg-Zn-Sm system in the Mg-rich corner were studied by experimental determination and thermodynamic calculation. The results are summarized as follows:
(1)
The Mg3Sm phase is a linear compound, which can dissolve up to 49.2 at.% Zn at 400 °C. Ternary compounds Y (Mg62Zn31Sm7) and τ (Mg36Zn50Sm14) are observed in the as-cast alloys. The Y phase is determined to have an orthorhombic structure with lattice parameters of a = 10.20 Å, b = 11.26 Å and c = 9.64 Å by TEM, yet the structure of τ is still unknown. The hexagonal compound μ7 is a transition phase and can only be detected during the transformation of the Y phase to the stable Z phase in the alloys located in the (Mg) + Mg3Sm + Z region.
(2)
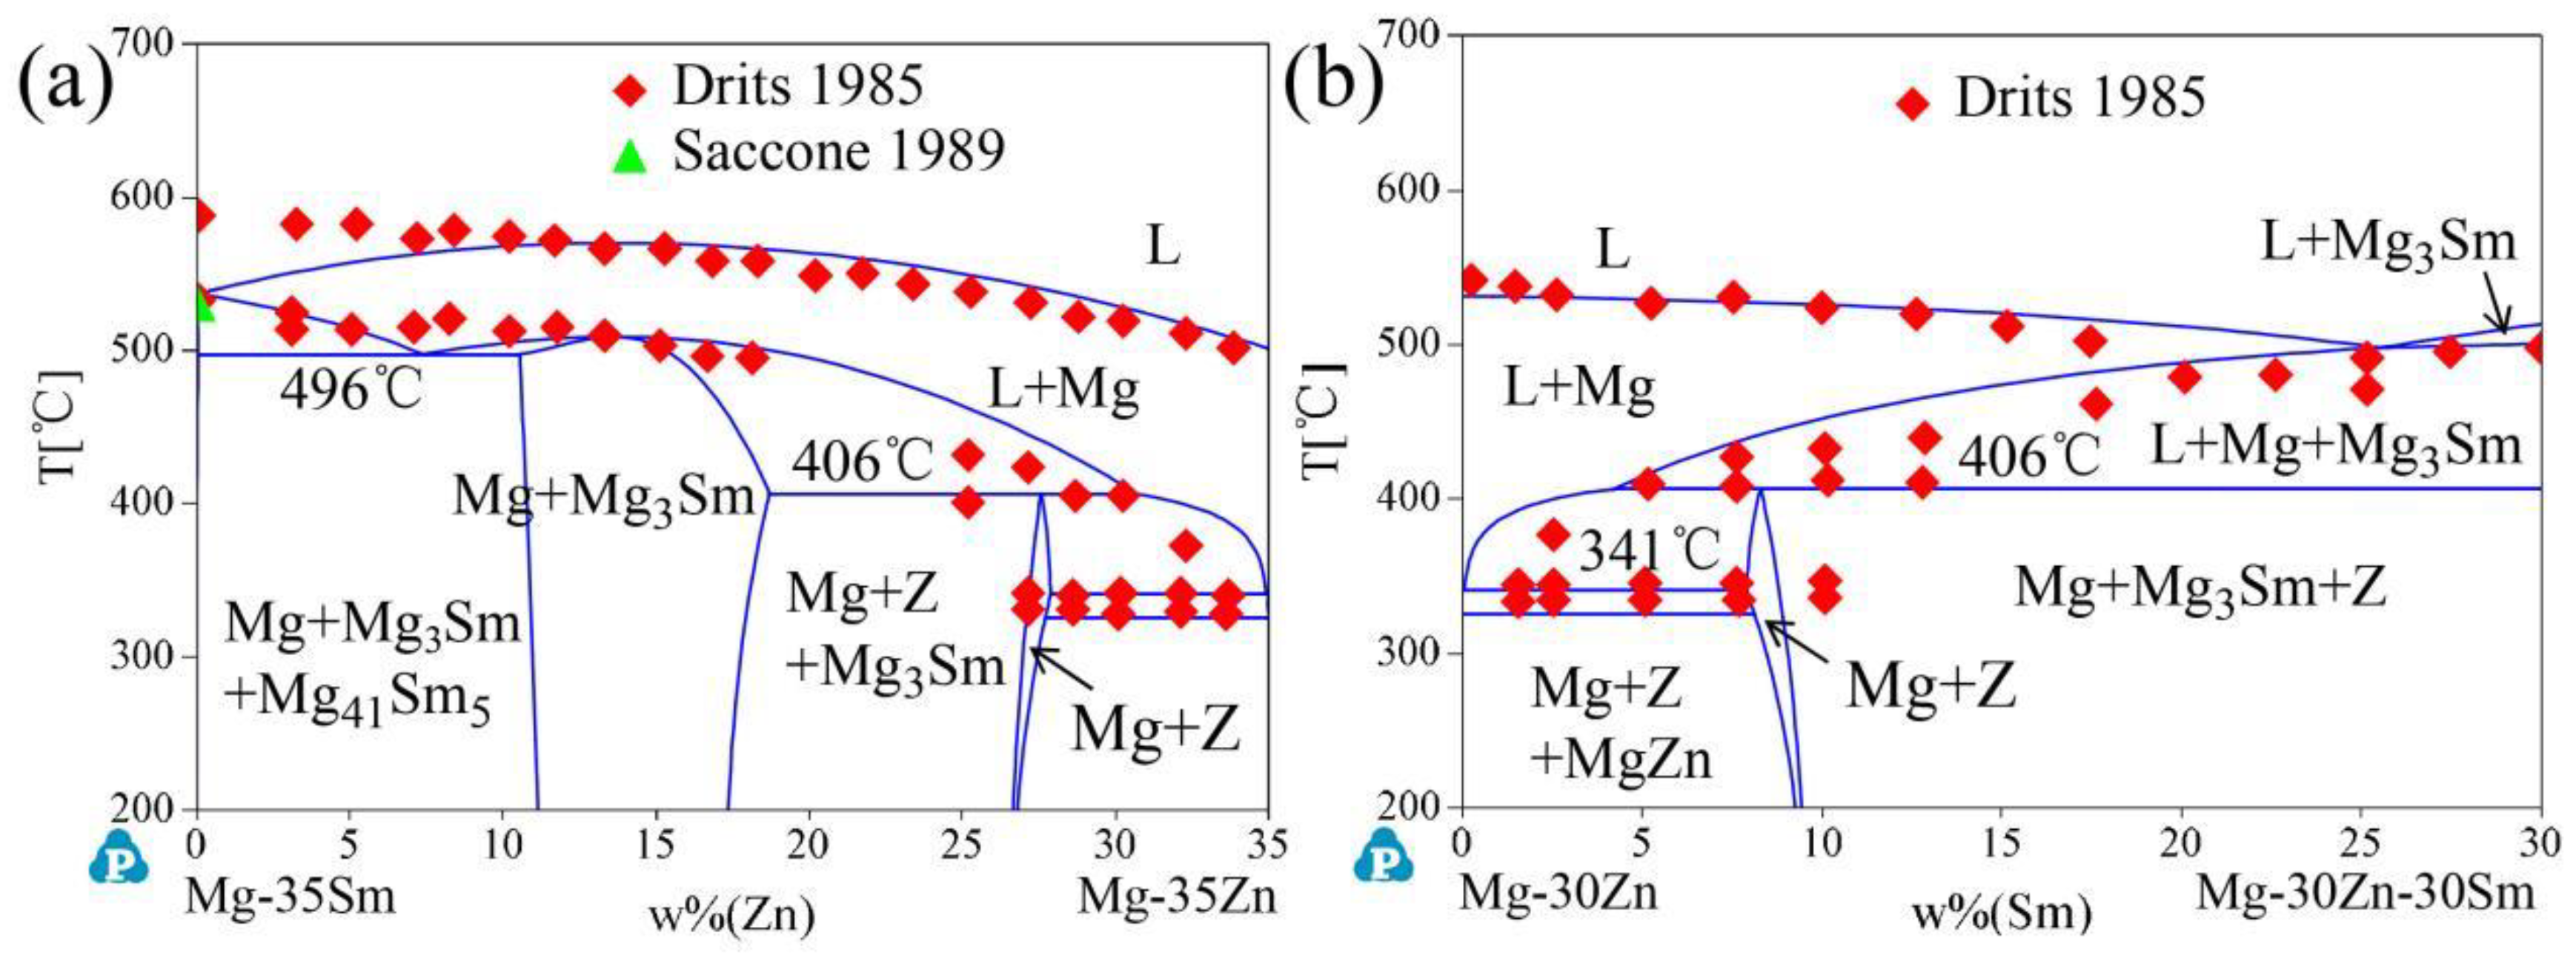
The phase equilibria (Mg) + Mg41Sm5 + Mg3Sm, (Mg) + Mg3Sm + Z and (Mg) + Z + liquid are confirmed at 400 °C in the Mg-rich corner, while the (Mg) + Z + MgZn three-phase region exists in the Mg-Zn side at 320 °C. The calculated phase diagrams agree well with the experimental data.
(3)
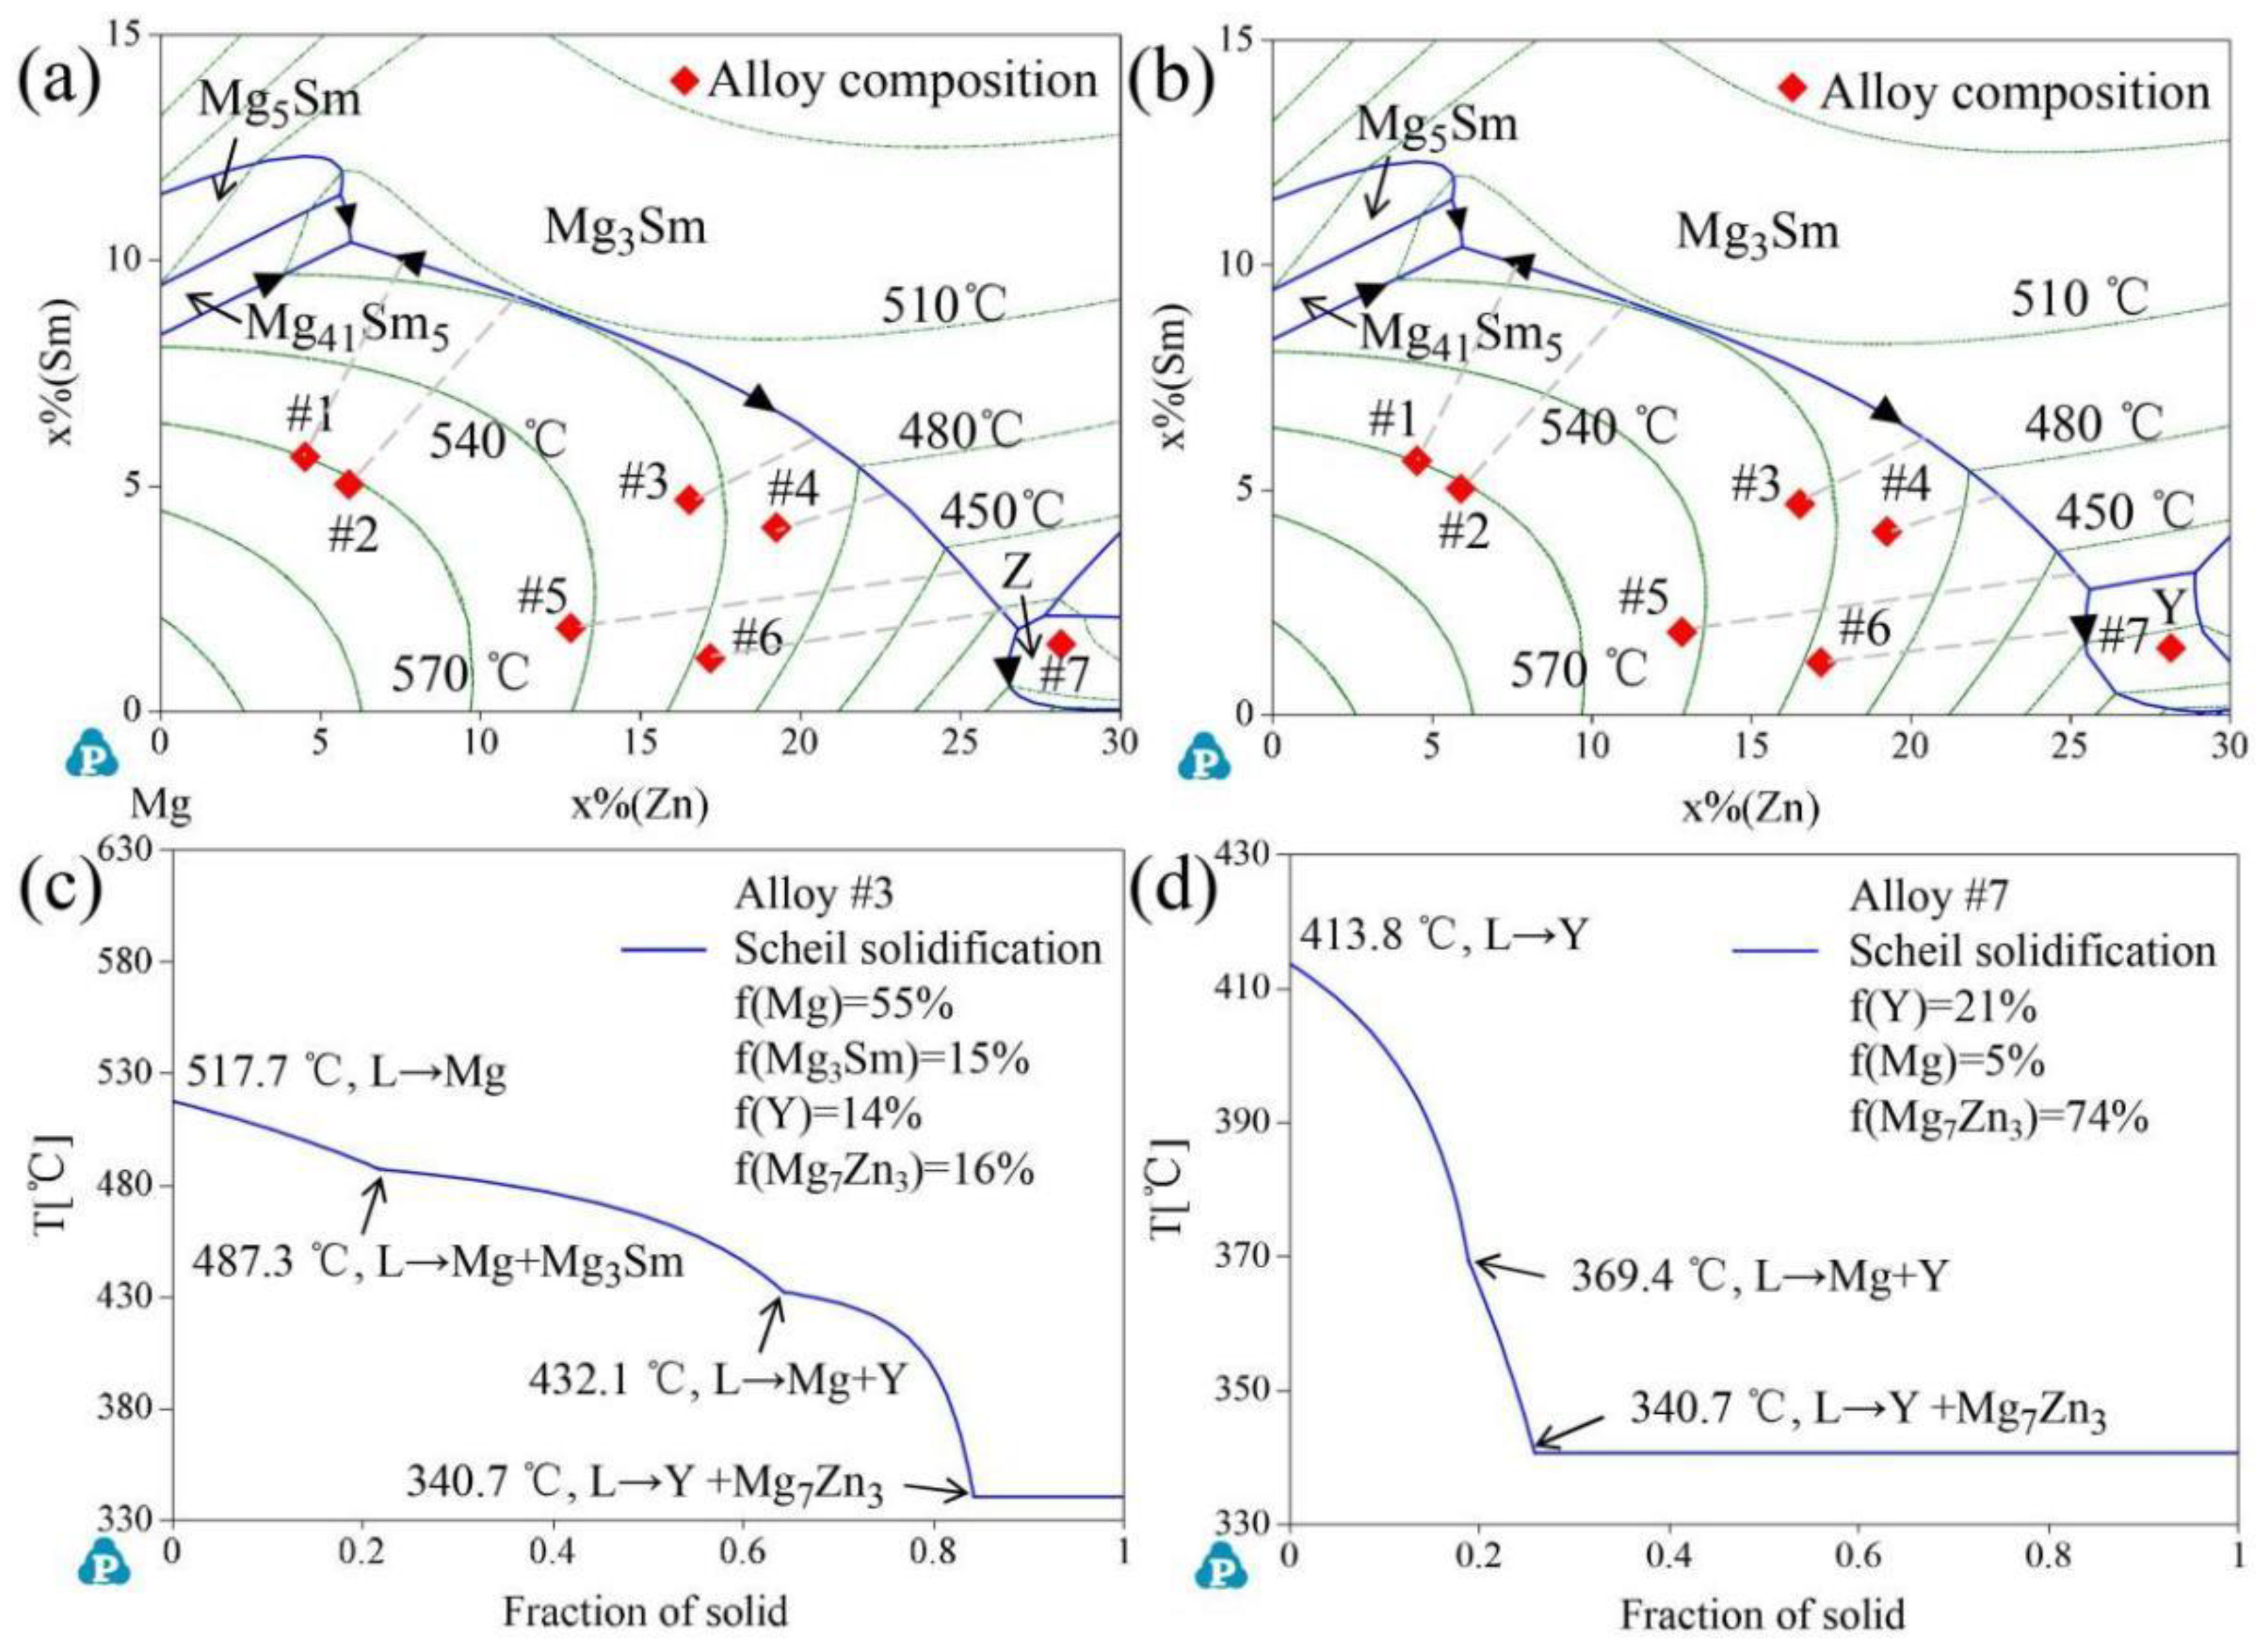
The ternary compound Y was frequently observed in the as-cast alloys, even in the alloy located in the primary crystal region of the Z phase. By suppressing the stale Z phase, the calculated liquidus projection containing the Y phase and non-equilibrium solidification simulation can reasonably explain the as-cast structure of alloys in the Mg-rich corner.

Author Contributions

Conceptualization, J.Z. and T.Y.; methodology, T.Y. and Z.M.; software, J.Z.; validation, Q.L. and H.C.; formal analysis, Q.L.; investigation, T.Y. and Z.M.; resources, G.W.; data curation, G.W.; writing—original draft preparation, T.Y.; writing—review and editing, H.C., Q.L. and G.W.; visualization, T.Y. and Z.M.; supervision, J.Z. and G.W.; project administration, J.Z. and G.W.; funding acquisition, J.Z. All authors have read and agreed to the published version of the manuscript.

Funding

This work was funded by the National Natural Science Foundation of China (Grant No. 51871143), the Science and Technology Committee of Shanghai (Grant No. 21ZR1423600) and the Open Project of State Key Laboratory of Baiyunobo Rare Earth Resources Researches and Comprehensive Utilization.

Institutional Review Board Statement

Not applicable.

Informed Consent Statement

Not applicable.

Data Availability Statement

Available upon request.

Acknowledgments

The authors gratefully acknowledge the Instrumental Analysis and Research Center of Shanghai University.

Conflicts of Interest

The authors declare no conflict of interest.

References

  1. Song, J.; Chen, J.; Xiong, X.; Peng, X.; Chen, D.; Pan, F. Research advances of magnesium and magnesium alloys worldwide in 2021. J. Magnes. Alloy. 2022, 10, 863–898. [Google Scholar] [CrossRef]
  2. Zhang, Z.; Zhang, J.H.; Wang, J.; Li, Z.H.; Xie, J.S.; Liu, S.J.; Guan, K.; Wu, R.Z. Toward the development of Mg alloys with simultaneously improved strength and ductility by refining grain size via the deformation process. Int. J. Miner. Metall. Mater. 2021, 28, 30–45. [Google Scholar] [CrossRef]
  3. Jono, Y.; Yamasaki, M.; Kawamura, Y. Quantitative evaluation of creep strain distribution in an extruded Mg-Zn-Gd alloy of multimodal microstructure. Acta Mater. 2015, 82, 198–211. [Google Scholar] [CrossRef]
  4. Ebenezer, D.; Rao, S.R. Impression Creep Behavior of an Mg-Zn-RE Alloy at Elevated Temperatures. Metall. Mater. Trans. A 2022, 53, 823–836. [Google Scholar] [CrossRef]
  5. Ishiguro, Y.; Huang, X.; Tsukada, Y.; Koyama, T.; Chino, Y. Effect of bending and tension deformation on the texture evolution and stretch formability of Mg-Zn-RE-Zr alloy. Int. J. Miner. Metall. Mater. 2022, 29, 1334–1342. [Google Scholar] [CrossRef]
  6. Kang, W.; Lu, L.; Feng, L.; Lu, F.; Gan, C.; Li, X. Effects of pre-aging on microstructure evolution and deformation mechanisms of hot extruded Mg-6Zn-1Gd-1Er Mg alloys. J. Magnes. Alloy. 2021; in press. [Google Scholar] [CrossRef]
  7. Egusa, D.; Abe, E. The structure of long period stacking/order Mg-Zn-RE phases with extended non-stoichiometry ranges. Acta Mater. 2012, 60, 166–178. [Google Scholar] [CrossRef]
  8. Hagihara, K.; Okamoto, T.; Izuno, H.; Yamasaki, M.; Matsushita, M.; Nakano, T.; Kawamura, Y. Plastic deformation behavior of 10H-type synchronized LPSO phase in a Mg-Zn-Y system. Acta Mater. 2016, 109, 90–102. [Google Scholar] [CrossRef]
  9. Hua, X.; Yang, Q.; Zhang, D.; Meng, F.; Chen, C.; You, Z.; Zhang, J.; Lv, S.; Meng, J. Microstructures and mechanical properties of a newly developed high-pressure die casting Mg-Zn-RE alloy. J. Mater. Sci. Technol. 2020, 53, 174–184. [Google Scholar] [CrossRef]
  10. Tian, Y.; Huang, H.; Yuan, G.; Ding, W. Microstructure evolution and mechanical properties of quasicrystal-reinforced Mg-Zn-Gd alloy processed by cyclic extrusion and compression. J. Alloys Compd. 2015, 626, 42–48. [Google Scholar] [CrossRef]
  11. Wang, W.Z.; Zhou, X.Z.; Zhang, L.F.; Ye, H.Q.; Yang, Z.Q. Precipitation of multi-type nano-quasicrystals in a Mg-Zn-Y alloy. J. Magnes. Alloy. 2022; in press. [Google Scholar] [CrossRef]
  12. Guan, K.; Li, B.; Yang, Q.; Qiu, X.; Tian, Z.; Zhang, D.; Zhang, D.; Niu, X.; Sun, W.; Liu, X.; et al. Effects of 1.5 wt% samarium (Sm) addition on microstructures and tensile properties of a Mg-6.0Zn-0.5Zr alloy. J. Alloys Compd. 2018, 735, 1737–1749. [Google Scholar] [CrossRef]
  13. Zhang, D.; Yang, Q.; Zhang, D.; Guan, K.; Bu, F.; Zhou, H.; Meng, J. Effects of substitution of Nd in a sand-cast Mg-2.5 Nd-0.6 Zn-0.5 Zr alloy with x wt.% Sm (x= 2.5, 4, and 6). J. Rare Earths 2017, 35, 1261–1267. [Google Scholar] [CrossRef]
  14. Che, C.; Cai, Z.; Cheng, L.; Meng, F.; Yang, Z. The microstructures and tensile properties of as-extruded Mg-4Sm-xZn-0.5 Zr (x = 0, 1, 2, 3, 4 wt%) alloys. Metals 2017, 7, 281. [Google Scholar] [CrossRef]
  15. Zhang, Y.; Huang, X.; Ya, L.; Zhenduo, M.; Ying, M.; Yuan, H. Effects of samarium addition on as-cast microstructure, grain refinement and mechanical properties of Mg-6Zn-0.4 Zr magnesium alloy. J. Rare Earths 2017, 35, 494–502. [Google Scholar] [CrossRef]
  16. Guan, K.; Meng, F.; Qin, P.; Yang, Q.; Zhang, D.; Li, B.; Sun, W.; Lv, S.; Huang, Y.; Hort, N.; et al. Effects of samarium content on microstructure and mechanical properties of Mg-0.5 Zn-0.5 Zr alloy. J. Mater. Sci. Technol. 2019, 35, 1368–1377. [Google Scholar] [CrossRef]
  17. Drits, M.E.; Rokhlin, L.L.; Abrukina, N.P. Phase equilibria in Mg-Sm-Zn system. Izv. Akad. Nauk. SSSR Met. 1985, 6, 194–200. [Google Scholar]
  18. Sugiyama, K.; Yasuda, K.; Ohsuna, T.; Hiraga, K. The structures of hexagonal phases in Mg-Zn-RE (RE = Sm and Gd) alloys. Z. Krist. Cryst. Mater. 1998, 213, 537–543. [Google Scholar] [CrossRef]
  19. Abe, E.; Takakura, H.; Singh, A.; Tsai, A.P. Hexagonal superstructures in the Zn-Mg-rare-earth alloys. J. Alloys Compd. 1999, 283, 169–172. [Google Scholar] [CrossRef]
  20. Sugiyama, K.; Yasuda, K.; Horikawa, Y.; Ohsuna, T.; Hiraga, K. Crystal structure of μ7-MgZnSm. J. Alloys Compd. 1999, 285, 172–178. [Google Scholar] [CrossRef]
  21. Abe, E.; Tsai, A.P. Quasicrystal-crystal transformation in Zn-Mg–rare-earth alloys. Phys. Rev. Lett. 1999, 83, 753. [Google Scholar] [CrossRef]
  22. Xia, X.; Sanaty-Zadeh, A.; Zhang, C.; Luo, A.A.; Zeng, X.; Chang, Y.A.; Stone, D.S. Thermodynamic modeling and experimental investigation of the magnesium-zinc-samarium alloys. J. Alloys Compd. 2014, 593, 71–78. [Google Scholar] [CrossRef]
  23. Zhu, Z.; Pelton, A.D. Thermodynamic modeling of the La-Mg-Zn, Pr-Mg-Zn and Sm-Mg-Zn system. J. Alloys Compd. 2015, 652, 415–425. [Google Scholar] [CrossRef]
  24. Cao, W.; Chen, S.L.; Zhang, F.; Wu, K.; Yang, Y.; Chang, Y.A.; Schmid-Fetzer, R.; Oates, W.A. PANDAT software with PanEngine, PanOptimizer and PanPrecipitation for multi-component phase diagram calculation and materials property simulation. Calphad 2009, 33, 328–342. [Google Scholar] [CrossRef]
  25. Jia, B.R.; Liu, L.B.; Yi, D.Q.; Jin, Z.P.; Nie, J.F. Thermodynamic assessment of the Al-Mg-Sm system. J. Alloys Compd. 2008, 459, 267–273. [Google Scholar] [CrossRef]
  26. Ghosh, P.; Mezbahul-Islam, M.D.; Medraj, M. Critical assessment and thermodynamic modeling of Mg-Zn, Mg-Sn, Sn-Zn and Mg-Sn-Zn systems. Calphad 2012, 36, 28–43. [Google Scholar] [CrossRef]
  27. Liu, X.J.; Chen, X.; Wang, C.P. Thermodynamic assessments of the Sm-Zn and Nd-Zn systems. J. Alloys Compd. 2009, 468, 115–121. [Google Scholar] [CrossRef]
  28. Luo, Q.; Zhai, C.; Sun, D.; Chen, W.; Li, Q. Interpolation and extrapolation with the CALPHAD method. J. Mater. Sci. Technol. 2019, 35, 2115–2120. [Google Scholar] [CrossRef]
  29. SGTE Unary Database. Version 5.0-Scientifific Group Thermodata Europe, Grenoble. 2009. Available online: https://www.sgte.net/en/free-pure-substance-database (accessed on 16 September 2022).
  30. Redlich, O.; Kister, A.T. Algebraic representation of thermodynamic properties and the classification of solutions. Ind. Eng. Chem. 1948, 40, 345–348. [Google Scholar] [CrossRef]
  31. Muggianu, Y.M.; Gambino, M.; Bros, J.P. Enthalpies of formation of liquid alloys bismuth-gallium-tin at 723k-choice of an analytical representation of integral and partial thermodynamic functions of mixing for this ternary-system. J. Chim. Phys. Phys.-Chim. Biol. 1975, 72, 83–88. [Google Scholar] [CrossRef]
  32. Hillert, M. The compound energy formalism. J. Alloys Compd. 2001, 320, 161–176. [Google Scholar] [CrossRef]
  33. Saccone, A.; Delfino, S.; Borzone, G.; Ferro, R. The samarium-magnesium system: A phase diagram. J. Less Common Met. 1989, 154, 47–60. [Google Scholar] [CrossRef]
Figure 1. The microstructure of as-cast alloys #1 and #2. (a,b) The BSE images and (c) XRD patterns.
Metals 12 01553 g001
Figure 2. The BSE images of as-cast alloys #3–#8 (af).
Metals 12 01553 g002
Figure 3. The BSE images of alloys #1–#2 annealed at (a,b) 400 °C for 42 days and (c,d) 320 °C for 56 days.
Metals 12 01553 g003
Figure 4. The XRD patterns of alloys #1–#2 annealed at (a) 400 °C for 42 days and (b) 320 °C for 56 days.
Metals 12 01553 g004
Figure 5. The BSE images of alloys #3–#5 (ac) annealed at 400 °C for 42 days and (df) annealed at 320 °C for 56 days.
Metals 12 01553 g005
Figure 6. The XRD patterns of alloys #3–#8 (ae) annealed at 400 °C and 320 °C.
Metals 12 01553 g006
Figure 7. The BSE images of alloys #6–#8 annealed at (ac) 400 °C for 1 day and (df) 320 °C for 56 days.
Metals 12 01553 g007
Figure 8. The SAED patterns of (ac) Y phase in as-cast alloy #3, (d) μ7 phase and (e,f) Mg3Sm in alloy #3 annealed at 320 °C for 56 days.
Metals 12 01553 g008
Figure 9. The calculated isothermal sections of the Mg-Zn-Sm system in the Mg-rich corner (a) at 400 °C and (b) at 320 °C.
Metals 12 01553 g009
Figure 10. The calculated vertical sections (a) from Mg-35Sm to Mg-35Zn (wt.%) and (b) from Mg-30Zn to Mg-30Zn-30Sm (wt.%) in comparation with experimental data from [17,33].
Metals 12 01553 g010
Figure 11. The calculated liquidus projection (a) without Y phase and (b) with Y phase. Solidification paths of the as-cast alloys (c) #3 and (d) #7.
Metals 12 01553 g011
Table 1. Summary of ternary compounds from different studies.
PhasePhase Composition (at.%)Crystal StructureLattice Parameters (Å)References
XMg51.8Zn23.3Sm24.9FCCa = 6.907[17]
Mg3SmMg34.3–47.6Zn30.9–45.4Sm19.4–26.4FCCa = 6.64–6.94[22]
YMg51.8Zn23.3Sm24.9UnknownUnknown[17]
ZMg29.1Zn60.6Sm10.3HCPa = 14.62, c = 8.78[17]
ZMg29.6–37.0Zn57.3–63.5Sm5.7–9.5HCP, P63/mmca = 14.62, c = 8.71[22]
μ3Mg28.3Zn65.2Sm6.5HCP, P63/mmca = 14.619, c = 8.708[18]
μ5Mg24.2Zn65.3Sm10.5HCP, P63/mmca = 23.5, c = 8.6[19]
μ7Mg24.7Zn63.5Sm11.8HCP, P63/mmca = 33.565, c = 8.873[20]
Table 2. The chemical compositions and phase constitutions of the alloys #1–#8.
No.Alloy Composition (at.%)Treatment ConditionPhasesPhase Composition (at.%)
MgSmZn
#1Mg-5.7Sm-4.5Zn320 °C/56 days(Mg)99.70.10.2
Mg41Sm588.610.50.9
Mg3Sm50.021.728.3
400 °C/42 days(Mg)99.60.4-
Mg41Sm588.010.21.8
Mg3Sm48.920.930.2
#2Mg-5.0Sm-5.9Zn320 °C/56 days(Mg)100--
Mg3Sm40.321.538.2
400 °C/42 days(Mg)100--
Mg3Sm41.420.737.9
#3Mg-4.7Sm-16.7Zn320 °C/56 days(Mg)98.8-1.2
Mg3Sm28.922.448.7
μ727.210.862.0
400 °C/42 days(Mg)97.8-2.2
Mg3Sm29.321.549.2
Z25.211.863.0
#4Mg-4.1Sm-19.3Zn320 °C/56 days(Mg)98.9-1.1
μ726.410.263.4
Mg3Sm29.421.549.1
400 °C/42 days(Mg)97.2-2.8
Z26.610.163.3
#5Mg-1.8Sm-12.8Zn320 °C/56 days(Mg)98.4-1.6
Z33.46.660.0
400 °C/42 days(Mg)97.0-3.0
Z30.77.162.2
#6Mg-1.2Sm-17.2Zn320 °C/56 days(Mg)97.2-2.8
Z31.75.163.2
MgZn48.6-51.4
400 °C/1 day(Mg)96.5-3.5
Z29.56.663.9
Liquid---
#7Mg-1.5Sm-28.1Zn320 °C/56 days(Mg)97.2-2.8
Z32.36.161.6
MgZn48.7-51.3
400 °C/1 day(Mg)96.3-3.7
Z29.36.664.1
Liquid---
#8Mg-1.4Sm-50.2Zn320 °C/56 days(Mg)97.0-3.0
Z29.55.465.1
MgZn48.7-51.3
400 °C/1 dayMg2Zn340.4-59.6
Z27.95.966.2
Liquid---
Table 3. Optimized thermodynamic parameters of the Mg-Zn-Sm system in this work. Values are given in SI units and correspond to 1 mol of formula units of the phases.
Liquid: substitutional solution, (Mg, Zn, Sm)1
L 0 Mg , Zn , Sm Liquid = −85,000
HCP: substitutional solution, (Mg, Zn, Sm)1
L 0 Mg , Sm HCP  = 2500 − 8.5 T
L 1 Mg , Sm HCP = −5050
Mg41Sm5: stoichiometric, (Mg)0.8913(Sm)0.1087
G     Mg : Sm Mg 41 Sm 5 = 0.8913 G     Mg 0 , HCP _ A 3 + 0.1087 G     Sm 0 , RHOMB _ C 19 − 4522.4 + 0.1076T
Mg3Sm: CEF, (Mg, Zn)0.55(Mg)0.2(Sm)0.25
G     Zn : Mg : Sm 0 , Mg 3 Sm = 0.2 G     Mg 0 , HCP _ A 3 + 0.55 G     Zn 0 , HCP _ A 3 + 0.25 G     Sm 0 , RHOMB _ C 19 − 47707.79 + 25.26 T
L   0 Mg , Zn : Mg : Sm Mg 3 Sm   = −7535.79 + 8.42 T
L   1 Mg , Zn : Mg : Sm Mg 3 Sm   = 5583.889 + 0.756 T
Y: stoichiometric, (Mg)0.62(Zn)0.31(Sm)0.07
G     Mg : Zn : Sm Y = 0.62 G     Mg 0 , HCP _ A 3 + 0.31 G     Zn 0 , HCP _ A 3 + 0.07 G     Sm 0 , RHOMB _ C 19 − 16007.76 + 6.088 T
Z: stoichiometric, (Mg)0.27(Zn)0.64(Sm)0.09
G     Mg : Zn : Sm Z = 0.27 G     Mg 0 , HCP _ A 3 + 0.64 G     Zn 0 , HCP _ A 3 + 0.09 G     Sm 0 , RHOMB _ C 19 − 24419.6 + 7.63 T
Table 4. The invariant reactions in the Mg-rich corner of the Mg-Zn-Sm system.
Invariant ReactionsT (°C)Notes/ReferenceComposition (at.%)
MgSmZn
L→(Mg) + Mg41Sm5 + Mg3Sm497.1this work83.655.9410.41
515exp. [17]87.92.89.3
502.4cal. [22]84.946.928.14
489cal. [23]---
L + Mg3Sm→(Mg) + Z406.4this work71.3926.811.82
405exp. [17]73.424.81.8
419.54cal. [22]74.1624.141.7
357cal. [23]---
L + (Mg)→Mg7Zn3 + Z340.8this work70.9129.060.03
340exp. [17]70.429.20.4
340.98cal. [22]71.0328.960.01
343cal. [23]---
L + Mg3Sm→(Mg) + Y *432.2this work71.6125.612.78
432exp. [17]73.622.14.3
434cal. [23]---
L + (Mg)→Mg7Zn3 + Y *340.7this work70.8229.120.06
* The invariant reactions with Y phase were calculated by suspending stable Z phase.
Publisher’s Note: MDPI stays neutral with regard to jurisdictional claims in published maps and institutional affiliations.

