Abstract
The current study is focused on platinum recovery from the secondary sources of end-of-life heavy-duty diesel oxidation catalysts (DOCs) and heavy-duty catalyzed diesel particulate filters (c-DPFs) in order to reduce the supply–demand gap within the European Union. The extraction of platinum was based on a hydrometallurgical single-step low acidity leaching system (HCl-H2O2-NaCl) and a calcination step that takes place before the leaching process. The parameters of calcination and leaching process were thoroughly investigated in order to optimize recovery efficiency. The optimized results proved that a calcination step (at 800 °C for 2 h) improves the recovery efficiency by a factor of 40%. In addition, optimal Pt recovery yield was achieved after 3 h of leaching at 70 °C, with a solid-to-liquid (S/L) ratio of 70 g/100 mL (70%) and 3 M HCl-1% vol H2O2-4.5 M NaCl as leaching conditions. The optimum Pt recovery yield was 95% and 75% for DOC and c-DPF, respectively. Since the secondary feedstock investigated is highly concentrated in platinum, the pregnant solution can be used as a precursor for developing new Pt-based catalytic systems.
1. Introduction
Heavy-duty vehicles include (though they are not limited to) trucks, buses, lorries, and tractors, which are vital transportation means for a country’s economy. Heavy-duty vehicles are mainly powered by diesel engines which provide technical advantages over petrol engines (higher power and less fuel consumption). The transport sector’s growth has led to a rapid increase in the fleet of heavy vehicles, increasing emissions of harmful gases. The main compounds that diesel exhaust gases contain are: carbon dioxide (CO2), oxygen (O2), nitrogen (N2), water vapor (H2O), sulfur compounds (SOx), hydrocarbons (HC) and particulate matter (PM) of sizes under 10 μm [1].
According to Euro I regulations, the first heavy-duty vehicle emissions standards of the EU, the installation of catalytic devices was not mandatory, whereas in Euro II the installation of DOCs was made obligatory. Later, in 2005, the diesel particulate filter (DPF) technology was adopted by Euro IV legislation. In Figure 1, a typical catalytic system of heavy-duty vehicles for the reduction of pollutants emissions is presented [1,2]. The catalyzed diesel particulate filter (c-DPF) collects and oxidizes carbon to remove particulate matter (PM) by more than 90%. The diesel oxidation catalyst (DOC) contributes to the oxidation reactions by converting carbon monoxide and hydrocarbons to carbon dioxide and vapor water. Particulate matter is captured by c-DPF, however, nitric oxide (NO) and nitrogen dioxide (NO2) remain to be treated by a reduction catalyst. Emissions rich in NOx are treated with a light mist of urea (diesel exhaust fluid (DEF) or AdBlue) which is injected into the hot exhaust.
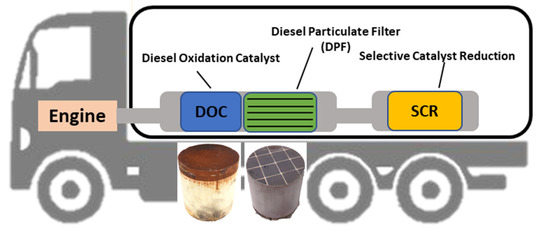
Figure 1.
A typical configuration of the diesel oxidation catalyst (DOC), catalyzed diesel particulate filter (c-DPF) and selective reduction catalyst (SCR) systems in diesel heavy-duty vehicles (HDVs) (Euro VI emission standards).
Catalytic converters were also developed to meet the increasingly stringent emissions regulations in the EU. The exhaust after-treatment devices that are applied to vehicles are diesel oxidation catalysts (DOCs), diesel particulate filters (DPFs), catalyzed diesel particulate filters (c-DPFs) and selective catalytic reduction (SCR) systems. The diesel oxidation catalysts (DOCs) are used for the oxidation of hydrocarbons and carbon monoxide to carbon dioxide and nitric oxides to nitric dioxide (Equations (1)–(3)), while SCRs are used for NOx reduction to N2. Finally, soot emissions and particulate matter are captured by DPF. The DOCs usually contain Pt as an active catalyst with excellent efficiency in oxidation reactions. Furthermore, Pd is also used either supplementary to Pt or as a substitution for it. DPFs are made of ceramic honeycomb (cordierite or silicon carbide) consisting of a honeycomb structure with alternately plugged channels, designed to capture the particulate mass emission (PM) of soot and ash. The Pt coated catalyzed diesel particulate filters (c-DPFs) contribute in the oxidation of CO and HC and the formation of NO2 [3], enhancing SCR catalytic performance. The SCR catalyst contains no PGMs, while compounds such as vanadium, tungsten, iron, or copper are used as catalysts to convert nitrogen oxide (NOx) to nitrogen (N2) and water (H2O) [4,5].
While the PGM concentration in the PGM ores reaches 0.002% per extracted kilo, in catalytic converters the average loading concentration of PGMs is 5–7 g per kg of catalytic device depending on the size of the catalyst, the type of the vehicle and the displacement of the engine. Thus, it would be more efficient and economically feasible to recover PGMs from spent catalytic converters than extracting the same amount from corresponding ores.
The main PGM ore resourses are located in areas outside Europe, such as Canada, South Africa and Russia, while in other countries resources are limited. Recently, due to Brexit, a high percentage of the global PGM production and processing (i.e., 40% of the global supply) is performed outside European Union. Moreover, there is still a growing gap between the supply and demand of PGMs worldwide, which will keep rising. Therefore, due to the high demand for PGMs and the limited primary [6] source supply, characterised by low availability outside certain resource-rich countries, PGMs were pronounced critical raw materials from EU [7].
To preserve primary sources, it is of significant importance to recover Pt from secondary PGM concentrated sources, such as spent catalysts, printed circuit boards and jewelries. Highly concentrated secondary sources, such as spent diesel catalysts, are very important to drastically reduce the environmental impact and economic criticality of PGMs.
Heavy duty vehicles’ spent catalysts and filters present a major processing challenge since they contain a high amount of soot which is made up of unburned fuel, carbon and other solid materials. The unburnt carbon and poisonous Pb and P (>18% w/w in total) which is formed due to lack of maintenance or failure of the engine, are deposited on the channel walls of the devices. Under these circumstances, i.e., high C and occasionally Pb contents, recycling companies avoid collecting and recycling these devices because expensive, energivorous or time consuming pretreatment processes would be needed to reach high extraction yields [6].
The state-of-the-art industrial method for PGM extraction from automotive catalysts is pyrometallurgy. The main steps of this method include the smelting of the ceramic catalyst by introducing fluxes and merging metal collectors at a high temperature range (1500–1900 °C) [8]. Despite the widespread use of this method, it presents various challenges. Large, high cost, specialized equipment is required, with continuous operation at high temperature ranges and high energy consumption. Moreover, pyrometallurgy exhibits high environmental impact, since toxic emissions are released during the combustion step, and metals, such as Ce, Al and Zr, are disposed in slag.
Therefore, to reduce the environmental footprint, it is crucial to develop a more environmentally friendly and sustainable method based on hydrometallurgy. The main advantage of the hydrometallurgical process versus pyrometallurgy is medium-scale batch processing, fulfilling supply and market demand. Additionally, the hydrometallurgical process takes place at lower temperatures and has lower energy demands, while selective extraction could also be successfully accomplished. Although the hydrometallurgical process has extensively been studied for recovering PGMs from three-way catalysts (TWCs), there are limited studies for Pt recovery from diesel oxidation catalysts (for example Sadia et al. [9]). Moreover, there are no published research studies for the extraction of Pt from catalyzed diesel particulate filters (c-DPFs).
The extraction of PGMs from spent TWCs has been studied extensively, mainly based on pyrometallurgical and hydrometallurgical methods. In some of these cases, pre-treatment of the catalyst was required to enhance extraction yields [6,10,11]. Thermal pretreatment of the catalyst has been used to remove organic compounds from the surface of PGM catalyst particles and reduction with H2 has been used to treat catalysts in oxide form in order to facilitate their leachability from the substrates. The most common studied lixiviant in the leaching process is hydrochloric acid (HCl), with the addition of an oxidizing agent, such as hydrogen peroxide (H2O2), nitric acid (HNO3), hypochlorite (ClO−), or perchlorate (ClO4−). Environmental imprint and safety issues must be taken into consideration using these strong acidic reagents [9]. Moreover, the introduction of an additional Cl− source has been already studied. Yakoumis et al. [10] studied the effect of NaCl, AlCl3, and CuCl2 in enhancing PGM dissolution, attempting a partial substitution of high acidity and favoring chlorocomplex species by modifying the chemical activity of chloride species. In these studies, NaCl enhanced recovery efficiency more than all the studied reagents.
In the present work, a single-step low-acidity hydrometallurgical process was applied on end of life (EoL) DOC and c-DPF devices from heavy duty vehicles in order to study the recovery/leaching efficiency of Pt. An acidic solution (HCl) and an environmentally friendly oxidizing agent (H2O2) with the addition of a Cl− source through NaCl were used as leaching reagents. A thermal pretreatment step, prior to the leaching step, was also studied in order to validate the effect of calcination in the leachability of Pt.
2. Materials and Methods
2.1. Materials
In order to study the leachability of Pt from HDV catalytic devices, a spent DOC catalyst and a spent catalyzed filter c-DPF (were collected and used for leaching treatment and characterization. Both DOC and c-DPF substrates were ceramic cordierites of the general formula M2Al3(AlSi5O18) (M: Mg, Fe). The Pt content range of DOC and c-DPF was determined with X-ray fluorescence analysis, calibrated in concentration ranges of 2900–3000 ppm and 1600–1700 ppm, respectively. For hydrometallurgical leaching experiments, leaching solution was prepared with hydrochloric acid (HCl supplied by Merk (Merck KGaA, Darmstadt, Germany), purity 37%) as a leaching agent, hydrogen peroxide (H2O2 supplied by Merk, purity 30%) as an oxidizing agent, and sodium chloride (NaCl supplied by Merk, purity 99.5%) providing Cl− anions for chlorocomplexes to be formed. Deionized water was used throughout the experiments, both for leaching and washing steps.
2.2. Methods
2.2.1. Preprocessing and Thermal Pretreatment
The spent or deactivated heavy-duty catalysts and filters (DOCs and c-DPFs), were collected from a Heavy-Duty Vehicles Service Workshop. Metallic parts were removed, and ceramic parts were grinded and milled to less than 250 μm particulate size. The powder was homogenized, having a total weight of 9 kg for DOC and 14 kg for c-DPF, while the particle size was determined with 250 μm granulometry sieving. The sieve used was made of stainless steel, with a diameter of 21 cm and an aperture size of 250 μm (Endcotts Ltd., London, UK).
Appropriate sampling was performed for elemental quantitative and qualitative analysis to take place with XRF in order to determine PGM content. Prior to elemental quantification, the samples were dried in a furnace at 120 °C for 2 h in order for the water content to be removed, avoiding interferences in the XRF measurement. The method of preprocessing and appropriate sampling has been described in detail in previous work by Yakoumis et al. [12] (Figure 2).
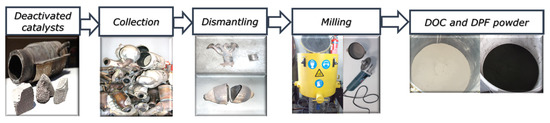
Figure 2.
Flowsheet preprocessing of DOC and c-DPF.
To study the calcination effect on catalyst leachability, catalysts and filters were subjected, in powder form, to calcination treatment in order for organic compounds to be removed. The calcination took place at 600–900 °C for 2–15 h, with a heating rate of 10 °C/min. XRF analysis was performed, before and after, thermal treatment, so that the recovery yield could be determined with high accuracy. The effect of calcination on the mass loss was also determined.
2.2.2. Leaching Procedure
Prior to leaching treatment, DOC or c-DPF samples were dried at 120 °C for 2 h. This step is of critical importance for the accurate Pt content to be determined with XRF analysis. The sample was subjected to XRF analysis before and after the leaching process, on dried powder and residue samples, respectively. A suitable amount of the catalyst, with respect to the experimental conditions and parameters, was weighed and then added to the beaker. Reagents of HCl, H2O2, NaCl and H2O were added in a variety of concentrations to obtain certain experimental conditions (HCl 2–9 M, H2O2 0.5–3% vol, NaCl 3–6 M) and an S/L ratio of 70 g/100 mL (70%). Deionized water was added for working leaching solution volume to be obtained. Leaching temperature was controlled at 70 °C for a certain time 0.5–3 h for DOC and 0.5–6 h for c-DPF, depending on corresponding conditions, under stirring with a watch glass beaker. Upon leaching, the leachate and solid residue were separated via filtration at room temperature. The wet solid residue was washed repeatedly, via filtration, to remove any acidic content and was dried overnight, in order for the water to be removed and so avoid humidity interference in XRF analysis.
The flowsheet for the proposed hydrometallurgical process for the recovery of Pt from diesel oxidation catalysts (DOCs) and catalyzed diesel particulate filters (c-DPFs) is presented in Figure 3. The DOC and c-DPF samples in powder form were calcined at 800 °C for 2 h, prior to the leaching process, to remove the deposited organic compounds and coke and enhance Pt extraction.
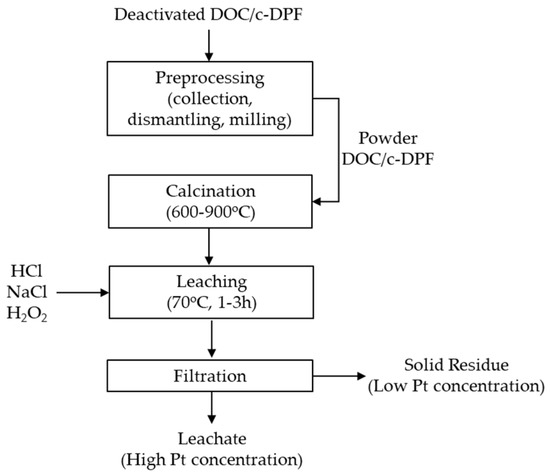
Figure 3.
Flowsheet of proposed hydrometallurgical process for Pt recovery from DOC and c-DPF.
2.3. Analytical Methods
2.3.1. Optical Microscopy
The morphology, structure and dimensions of the filters (c-DPF) and catalyst (DOC) channels and cells were determined by optical microscopy analysis. An optical microscope from AmScope in Irvine, CA, USA, the ME520 Series Optical Microscope, was used for the performed analysis. Images were obtained with a total microscope magnification of 5×.
2.3.2. Scanning Electron Microscopy (SEM) with Energy Dispersive X-ray Spectroscopy (EDS)
The morphology and catalyst distribution on the substrate surface of the catalytic powder was determined via SEM/EDS, using a QUANTA FEI SEM and EDAX detector (FEI Company, Hillsboro, OR, USA).
2.3.3. X-ray Fluorescence (XRF) Analysis
Qualitative and quantitative PGMs loading analysis of tested samples was performed with an X-ray fluorescence spectrometer (portable VANTA Olympus 2017, Waltham, MA, USA) using software (Olympus OOSA, version 3.8.540.0, 2925 Appling Road Bartlett, TN 38133 901-373-0200). X-ray fluorescence (XRF) analysis provides accurate, fast, non-destructive, repeatable measurements, and requires no chemical preparation. XRF analysis was performed on the catalyst and filter powder sample and solid residue after the leaching process in order to eliminate errors in metal content determination. Prior to XRF measurement, the dried sample was milled to obtain a certain granulometry (<250 μm). The XRF spectrometer was internally calibrated by the manufacturers, precisely measuring Pt in spent catalysts of average Pt concentrations of 900–1100 ppm. Additionally, the X-ray fluorescence (XRF) analyzer was calibrated by the authors, performing additional calibration curves in two concentration regions, one for high concentrations (600–2800 ppm) and the other for low concentrations (<600 ppm), to improve the accuracy of XRF measurements. This additional calibration would facilitate the accurate measurement and calculation of recovery yield.
Calibrating Instrumentation
The calibration curves were obtained by using 13 automotive catalyst TWC samples of varying Pt concentrations (600–2800 ppm). These 13 samples were subjected to ICP-OES spectrometry and were also subjected to XRF analysis in order to verify Pt content. According to the linear least-square approach, the calibration curve for Pt was drawn, using XRF analysis concentration curves for x-axis data and ICP-OES values for y-axis data. Therefore, the real values are determined by the line’s slope, referring to conditions prior to the leaching samples (high concentration ranges). The slope has been calculated with the assumption that 0 ppm nominal concentration shows 0 ppm in the XRF measurement. This assumption was made with the physical meaning of empty cordierite. The calibration curve is demonstrated in Figure 4 for Pt with a line slope of a = 0.9951.
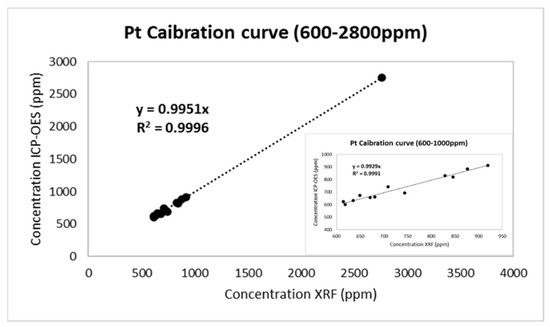
Figure 4.
Calibration curve for Pt in the loading range 600–2800 ppm.
Similarly, a calibration curve was also prepared for low Pt concentrations (<600 ppm) with samples obtained after the leaching process. New pair of values were obtained for the calibration curve. For this calibration region, the ceramic catalyst with a concentration of Pt 912 ppm was diluted with cordierite powder, so that diluted samples with low concentrations could be obtained. The granulometry of both used powders, the samples, and cordierite was the same, achieving a homogeneous dilution. The concentration of Pt on the diluted samples was calculated according to the dilution steps and the initial concentration. The diluted samples were measured via XRF analysis in manufacturing calibration modes to determine the detection limits. The first calibration mode was established by the OLYMPUS company and was appropriate for measuring samples of relatively high concentration (before leaching), named ‘HIGH VALUES’. Subsequently, the same diluted samples were measured using no calibration mode, named ‘LOW VALUES.’ Two different calibration curves for Pt were prepared and compared. The former curves were designed with x-data received from the calculated concentrations of Pt and y-data from the measured concentrations (HIGH VALUES or LOW VALUES). The optimum calibration curve was considered the one with the coefficient of determination R2 close to 1 (R2~1). According to the concentration values, the appropriate calibration mode for low Pt concentrations (Figure 5) was ‘LOW VALUES’ since there was the lowest deviation from the calculated values, indicating that for low concentration ranges ‘HIGH VALUES’ was unsuitable. The corresponding slope for low concentrations Pt (<600 ppm) is a = 1.0453.
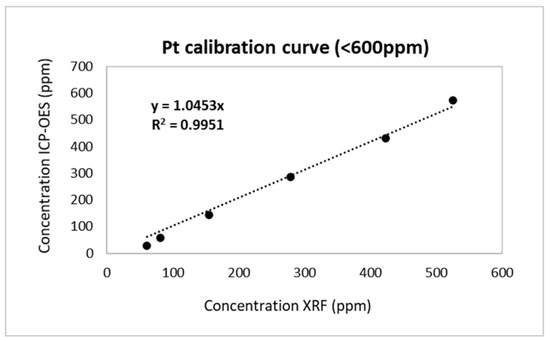
Figure 5.
Calibration curve for Pt in the loading range <600 ppm.
The samples of spent DOC and c-DPF before leaching experiments contained high concentrations of Pt; thus, the XRF analysis was performed in a loading range of 600–2800 ppm. After the leaching process, the Pt had been extracted, and samples contained low Pt concentrations in the loading region of 0–600 ppm.
2.3.4. Thermogravimetric Analysis (TGA)
Thermogravimetric analysis was conducted by CERTH (Centre for Research and Technology Hellas) to determine the optimum temperature for calcination of the spent diesel oxidation catalysts and diesel particulate filters in order to remove organic compounds. The measurements were performed in flowing air at a heating rate of 10 °C/min from 25 °C to 1000 °C. During this heating ramp, the samples remained at 1000 °C for 200 min to ensure the total removal of organic compounds.
2.3.5. X-ray Diffraction (XRD)
The samples of DOC and c-DPF before and after calcination at 800 °C for 2 h were characterized by X-ray diffraction (XRD, Bruker D-8 ADVANCE, Billerica, MA, USA) (operation modes: 5–35° 2θ range, 0.04° step size, and 2 s step time), performed by CERTH, in order to establish any structural changes that may occur after thermal pretreatment. XRD analysis was performed on DOC and c-DPF before and after the calcination step in powder form.
3. Results and Discussion
3.1. Optical Microscopy Analysis
Diesel oxidation catalytic converters consist of a monolithic honeycomb and a washcoat which contains the catalyst, as shown in Figure 6. The flue gases come into contact with the catalyst and the toxic emissions are converted into harmless ones. Microscopy images reveal a honeycomb-like structure for the DOC catalyst, consisting of small cell-size parallel channels, with a washcoat containing the Pt catalyst.
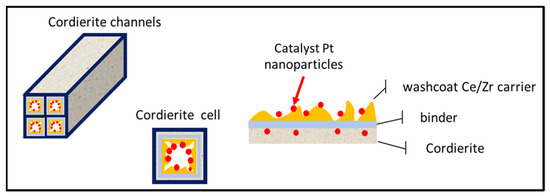
Figure 6.
Structure of a diesel oxidation catalyst.
Using the microscope images (Figure 7) of the catalysts’ internal parts, the cell walls are described in detail. The cell size of the DOC was measured as 0.1 cm × 0.1 cm, and the width of the wall was measured in the range of 0.15–0.23 mm. The washcoat was rather thinner than the cell wall and measured in the range of 0.0–0.11 mm.
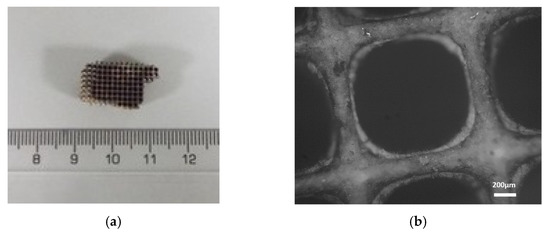
Figure 7.
(a) Small piece of the catalyst (DOC) (b) Image from the optical microscope in 5× magnification.
The catalyzed diesel particulate filters (c-DPFs) exhibit a honeycomb structure, similar to DOC catalysts, but contain alternate channels plugged at opposite ends and the channels exhibit larger diameters and porous walls. Flue gases go through the porous walls, leaving larger particles trapped within the connected channels, as shown in Figure 8.
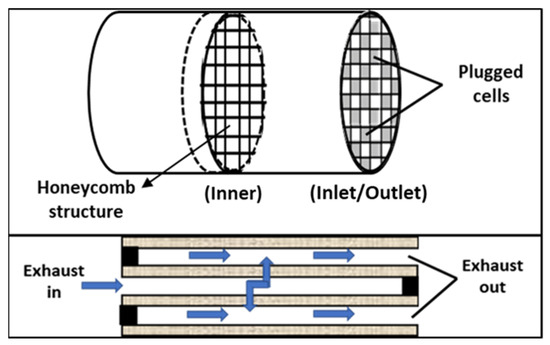
Figure 8.
Schematic representation of the structure of a diesel particulate filter (DPF).
Due to the filter’s particular structure, different cross-section parts were collected for the surface characterization, one from the inlet/outlet and one from the inner main body of the filter (Figure 9 and Figure 10). The cell of c-DPF was measured as 0.3 cm × 0.3 cm, and the width of the wall varied in the range of 0.44–0.48 mm in both samples.
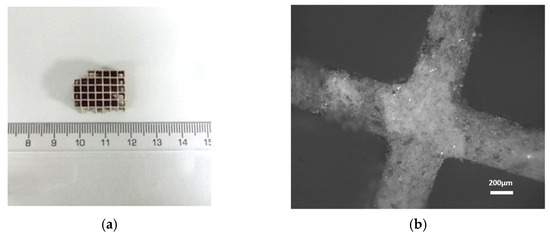
Figure 9.
(a) The analyzed small piece of the inner part of the filter (c-DPF) (b) Image from the optical microscope in 5× magnification.
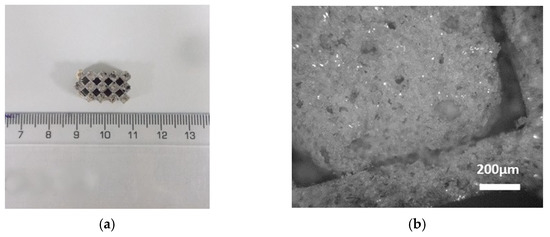
Figure 10.
(a) The analyzed small piece of the inlet or outlet surface of the filter (c-DPF). (b) Image from the optical microscope in 5× magnification.
The washcoat of the DOC catalyst was observed by optical microscopy to have a width in the range of 0.03–0.11 mm. In the case of catalyzed DPF, the washcoat fundamental elements, such as Ce and Zr, were detected with XRF analysis, however, the washcoat layer was not observed with optical microscopy. The latter finding indicates that either a very thin monolayer of Pt/Ce/Zr is formed on the cells of the c-DPF channels (Figure 11a) or the catalyst is infiltrated in the cordierite substrate (Figure 11b). This configuration of the initial mixing of the catalyst, the washcoat, and cordierite material would be reasonable, taking into consideration that the gas stream flows through the walls and is not in parallel flow in contact with the channels.
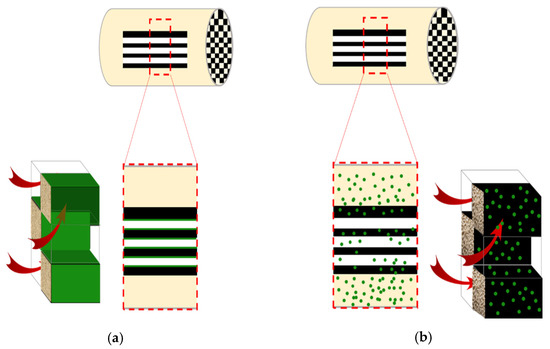
Figure 11.
Possible Pt distribution configurations on c-DPF: (a) the catalyst is homogeneously distributed on the channels surface; or (b) the catalyst is distributed on the main body of the cordierite, where it has been mixed with the washcoat and the cordierite before the cordierite preparation.
The suggested scenario was further investigated with SEM and EDS analysis in order to determine a possible interface between the substrate, the washcoat, and the catalyst metal. Two small pieces of surface and cross-sections from the c-DPF were used for the SEM–EDS analysis. Sample A from the inlet or outlet and Sample B from the inner part of the catalytic device (Figure 12). The points to be analyzed were highlighted on the pieces and corresponding SEM–EDS images are presented. For Sample A, point A is referring to vertical cross section on plugged channel and B is referring to inner surface of the channel of inlet/outlet piece. For Sample B, point A and B are referring to vertical cross section on the edges of the cells, and points C and D are referring to inner surfaces of two adjust channels. Two different pieces, from the inlet/outlet and the inner part, were used to verify the distribution of the catalyst in the case where the catalyst metal was embedded in different layers.
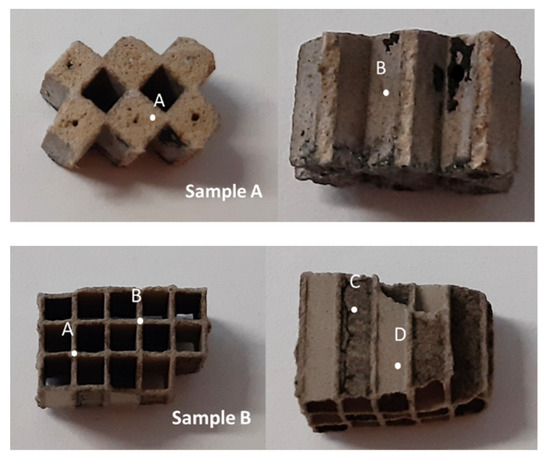
Figure 12.
Surface and horizontal cross-section from the inlet/outlet (Sample A) and the inner part of the particulate filter c-DPF.
According to the SEM images taken for both Sample A and Sample B from the inlet and outlet of the gas treatment device, there is no distinctive interlayer between the substrate and the washcoat, indicating the absence of a certain phase containing the metals (Figure 13). Moreover, a similar morphology was determined in both samples.
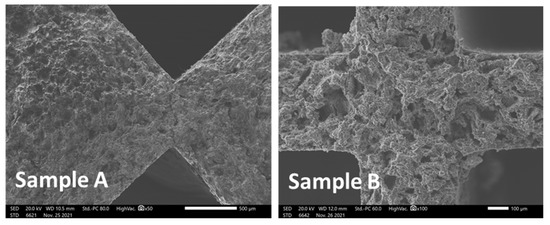
Figure 13.
SEM images of the cross-section for samples A (inlet/outlet of the filter) and B (inner part of the filter).
EDS analysis for Ce, Zr and Pt was also performed for both samples on the same points where the homogeneous distribution of the wash coat with the metals was observed for both inlet/outlet and inner part cross-sections (Figure 14).
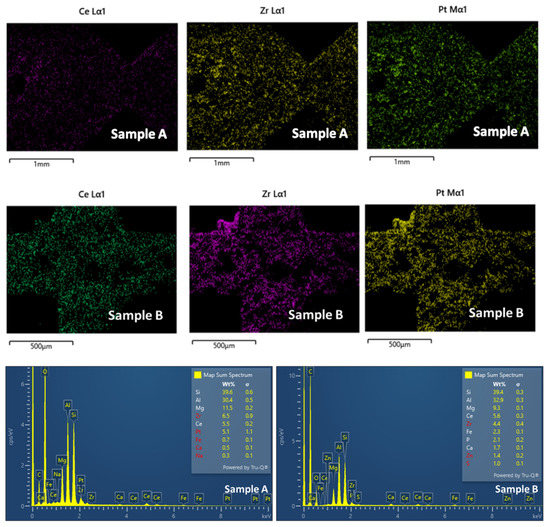
Figure 14.
EDS analysis for Ce, Zr, and Pt on the cross-section for samples A (inlet/outlet of the filter) and B (inner part of the filter).
However, according to semi-quantitative EDS analysis, Pt content was found to be higher in the piece of Sample A, from the inlet/outlet of the filter, suggesting the scenario of gradient distribution of Pt from the inlet/outlet to the inner (centre) of the filter.
A similar analysis was performed on the surfaces of the channels (Figure 15). SEM images were captured from Sample A (point B) and Sample B (points C and D).
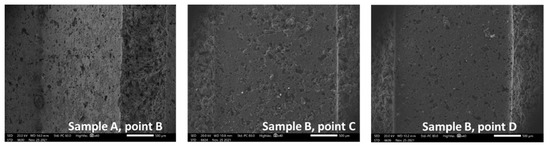
Figure 15.
SEM images of the surface of the channels from Sample A and Sample B from the inlet/outlet and the inner part of the particulate filter, respectively.
According to EDS analysis, Ce and Zr were homogeneously distributed along the channel, however, Pt content was not detected (Figure 16).
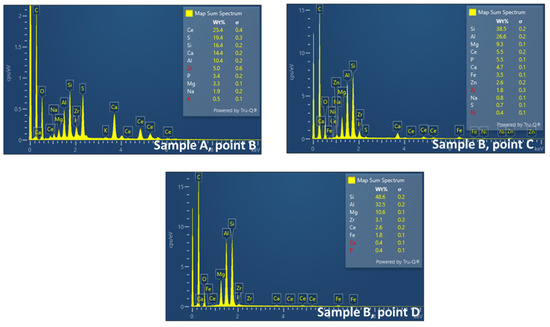
Figure 16.
EDS analysis for Ce, Zr, and Pt on the surface of the channels for Sample A, point B (inlet/outlet of the filter) and Sample B, point C and D (inner part of the filter).
The later finding provides evidence for the hypothesis that the catalyst is infiltrated in the ceramic substrate, while the Pt content is gradually distributed from the inlet/outlet to the inner part of the cordierite in order to favor gas conversion and particulate capture.
3.2. Characterization of Materials—Thermal Pretreatment
The effect of thermal pretreatment on Pt leachability was also examined. Leaching experiments were performed with thermally pretreated samples at different temperatures for DOC and c-DPF. Initially, leaching experiments were performed with un-pretreated DOC and c-DPF for extracting Pt. Figure 17 shows that the Pt recovery rate reached only 48.5% and 70.5% for the DOC and c-DPF, respectively. The low Pt extraction yield, especially in the DOC, gave rise to the need to introduce a new calcination step that would facilitate the extraction of the catalyst.
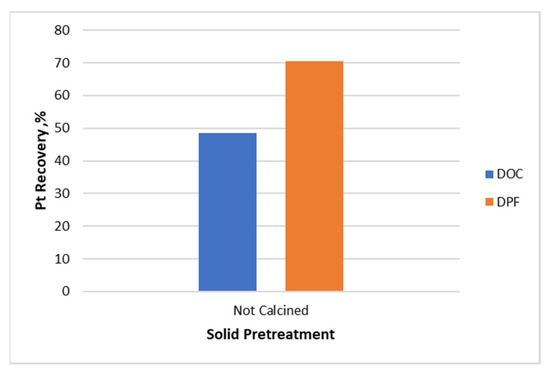
Figure 17.
Pt extraction yield from unpretreated DOC and c-DPF, respectively, with 3 M HCl, 1% vol H2O2, 4.5 M NaCl, and S/L ratio 70% at 70 °C for 3 h.
The end-of-life DOC and c-DPF contain high amounts of organic contaminants, mainly c-DPF, which may restrict the leachability of Pt in mild conditions. Thus, thermogravimetric analysis (TGA) of the catalyst and filter was performed to determine the proper calcination process, before the leaching process, to remove the carbon content and increase Pt leachability.
The TGA heating ramp of spent DOC during the calcination process under air atmosphere conditions is described in Figure 18. The TGA curve is divided into four main weight-loss regions at 25–120 °C, 120–400 °C, 400–600 °C and 600–1000 °C. The first region (25–120 °C) and the second weight loss region (120–390 °C) were attributed to the removal of the water content (1.22%), hydroxyl water and volatile organic compounds (1.39%), respectively. In the third region (390–600 °C), the decomposition and combustion of organics were performed, releasing carbon dioxide (0.93%) and the final weight-loss region (600–1000 °C) was attributed to the combustion of the coke (1.9%).
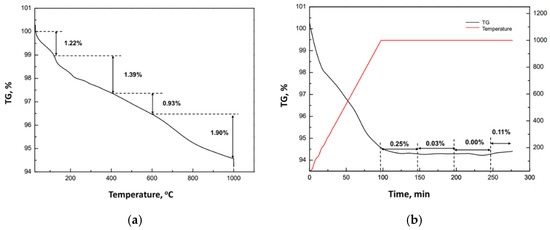
Figure 18.
(a) Thermogravimetric analysis (TGA) of DOC, under a heating rate of 10 °C/min. (b) The weight variation at 1000 °C for 200 min.
The sample remained at 1000 °C for 200 min for the removal of total organic compounds. The loss of mass was very low, and even after 150 min at 1000 °C reached almost 0.39%. The total loss of the DOC sample was 5.44% from 25 °C to 1000 °C and increased only to 5.83% after remaining for 2 h at 1000 °C, indicating that the total amount of C content had been removed.
The spent filter (c-DPF) exhibits similar performance to DOC during calcination from 25 °C to 1000 °C. In a TGA thermograph of c-DPF, four main steps were identified (Figure 19). The first (from 25 to 120 °C) corresponded to the loss of the water content of the c-DPF (0.75%). The second step (from 120 to 400 °C) took place to remove the volatile organic compounds (0.31%). In the third step (between 400–800 °C), the decomposition and combustion of organics were performed (0.82%), while the last step (from 800–1000 °C) was characterised as the combustion of the coke (0.82%). The sample of c-DPF remained at 1000 °C for 200 min. In the residence time at 1000 °C, the loss mass was 0.44%, indicating that total organic contaminants had been removed.
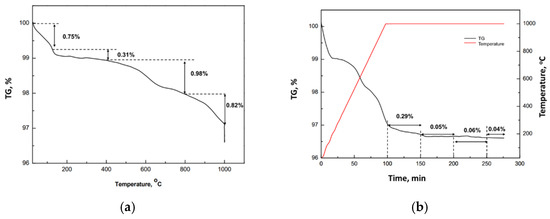
Figure 19.
(a) Thermogravimetric analysis (TGA) of the c-DPF, under a heating rate of 10 °C/min. (b) The weight variation at 1000 °C for 200 min.
In both DOC and c-DPF, the temperature range for soot and coke removal was 400–900 °C. During vehicle operation, active regeneration is performed when the accumulated soot and ash reach boundary limits. In this operation, the particulate soot is burned at 600 °C, unblocking the channels and regenerating the vehicle’s filter and favoring the regular operation of the engine [13]. According to TGA analysis of DOC and c-DPF, the total removal of coke was performed at 900 °C. Therefore, thermal pretreatment temperatures were selected at 600 °C, 800 °C and 900 °C.
The effect of calcination was observed with the naked eye while observing the color change of DOC samples which had been subject to calcination at three different temperatures (600, 800 and 900 °C). The color of raw spent DOC was dark brown and progressively changed to white at 900 °C (Figure 20).
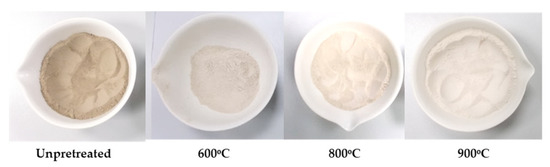
Figure 20.
Change in color of the DOC catalysts during the calcination at 600 °C, 800 °C and 900 °C, respectively.
An amount of c-DPF, also, was calcined at three different temperatures (600 °C, 800 °C, and 900 °C). Several amounts of C content were removed; thus, color variation was also observed. The color of raw spent c-DPF was black and progressively changed to light brown at 900 °C (Figure 21).
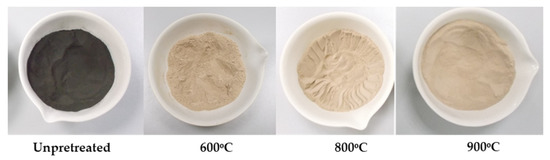
Figure 21.
Change in color of the c-DPF during calcination at 600 °C, 800 °C and 900 °C, respectively.
The optimum calcination temperature was also validated with leaching experiments both for the DOC and the c-DPF under certain leaching conditions: 3 M HCl, 4.5 M NaCl, 1% vol H2O2, and S/L ratio 70% at 70 °C for 3 h. The results presented in Figure 22 demonstrate that calcination temperature is crucial for Pt leaching.
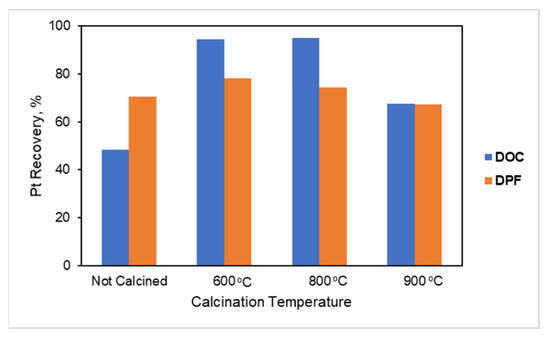
Figure 22.
Pt extraction yield from unpretreated and thermal pretreated (600 °C, 800 °C and 900 °C) DOC and c-DPF, respectively, with 3 M HCl, 1% vol H2O2, 4.5M NaCl, and S/L ratio 70% at 70 °C for 3 h.
According to Figure 22, the leaching efficiency of Pt increased after calcination at 600 °C for both c-DPF and DOC. Leaching efficiency was raised from 70.5% to 78% for c-DPF filters and from 48.5% to 94.6% for DOC catalysts. However, it was decreased to 67.2% and 67.6% for c-DPF and DOC, respectively, when the calcination took place at 900 °C, which could probably be attributed to the structural collapse of the cordierite, which might affect the contact of the metals with the leaching solvents. The extraction of Pt did not significantly change by increasing calcination temperature from 600 °C to 800 °C. Therefore, the optimum calcination temperature was 800 °C.
Although the DOC and c-DPF were calcined at 800 °C (for 2 h) to remove organic compounds and increase the contact surface area of the catalyst with the leaching solution, Pt extraction did not reach 100%. This could be in accordance with the assumption that the catalyst (Pt) might be partially infiltrated in the structure of the cordierite or that the oxide form of the catalyst prohibits the dissolution of Pt species. In that case, a reduction step would be required for Pt content to be removed. Thus, X-ray diffraction (XRD) analysis was performed to identify the formed phases before and after calcination at 800 °C of DOC and c-DPF.
As shown in Figure 23, the main crystalline phase of DOC was cordierite Mg2(Al4Si5O18), which remained stable after thermal treatment at 800 °C for 2 h, since the relative intensity of the crystal plane reflections had not changed. In the same XRD pattern, some carbonate secondary crystalline phases were observed in raw DOC and identified as magnesium aluminum hydroxide carbonate and magnesium oxide carbonate. The absence of the corresponding reflections of these phases from the XRD pattern in calcined DOC could be interpreted as carbonate decomposition of carbon dioxide.
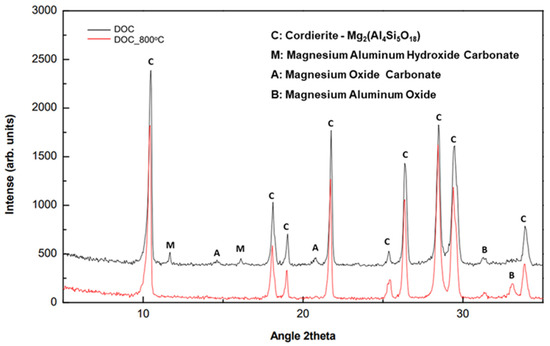
Figure 23.
XRD patterns of DOC before and after calcination at 800 °C for 2 h.
Similar behavior of c-DPF, before and after calcination at 800° C for 2 h, is presented in the XRD analysis (Figure 24). According to these findings, there were no apparent modifications in the main crystalline phase of the cordierite after thermal treatment. Weak reflections in the 2θ region at 10–20° could be attributed to the collapse of secondary carbonate phases.
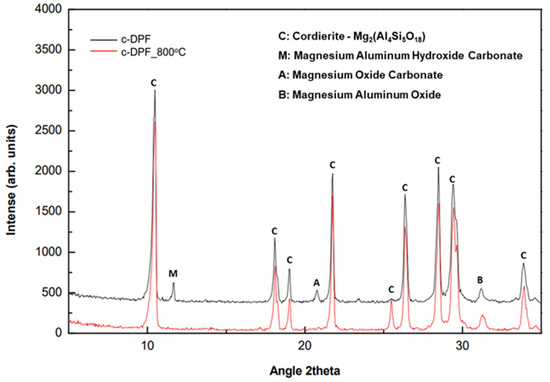
Figure 24.
XRD patterns of c-DPF before and after calcination at 800 °C for 2 h.
As shown in the XRD analysis of DOC and c-DPF before and after calcination at 800 °C (for 2 h), there were no structural changes in the materials after calcination, which could obstruct Pt extraction. The limitation of the Pt extraction yield to 95% could be due to infiltrated Pt or the oxidizing form that is prevented from being solubilized and forming chlorocomplexes.
3.3. Leaching Study
For the optimization of Pt leachability from DOC catalysts and c-DPF filters, certain parameters of the leaching process were studied. The main parameters of the hydrometallurgical process are the solid-to-liquid (S/L) ratio, the acidity of the solution (HCl concentration), the oxidizing agent concentration (H2O2), the kinetics of dissolution (time), and the addition of Cl− sources (NaCl concentration).
3.3.1. Effect of the Solid-to-Liquid Ratio
To develop an economically feasible and sustainable recycling process, the generated wastes should be eliminated. Thus, the ratio of sample mass to the solvent required was studied in the range of S/L 10–80% (10–80 g/100 mL of solution). The evaluation of the solid-to-liquid (S/L) ratio was performed in order to design a techno-economically sustainable and environmentally friendly leaching process with lower levels of generated liquid and solid waste. Leaching tests were conducted for both c-DPF and DOC systems, and the leaching solution content is described in Table 1, Table 2 and Table 3, respectively. The leaching experiments were performed at a stable temperature of 70 °C for 3 h.

Table 1.
Pt leaching efficiencies from unpretreated DOC obtained when using different S/L ratio.
Table 2.
Pt leaching efficiencies from calcined DOC obtained when using different S/L ratios.
Table 3.
Pt leaching efficiencies from calcined c-DPF when using different S/L ratios.
The effect of the amount of processed catalyst on a certain volume of leaching solution for S/L 10–70% has been studied. Tested conditions and corresponding recovery yields are presented in Table 1. The Pt recovery yield increased from 30.2% to 48.5% for S/L from 50% to 70%, however, the overall Pt recovery exhibits relatively low rates.
For that reason, leaching experiments with the calcination-treated powder were performed. Pt leaching was significantly increased by thermal pretreatment at 800 °C for 2 h. As described in Table 2, Pt extraction yields raised to 95.2% and 95.7% for the S/L ratio of 70% and 80%, respectively. Therefore, it is assumed that organic deposits hinder the extraction rate of Pt from catalysts. For that reason, thermal pretreatment was considered mandatory to enhance the metal extraction yield.
In the case of c-DPF, the extraction rate of Pt was not affected by varying the S/L ratio, although organic contaminants had been removed with the calcination step at 800 °C for 2 h. The increase of the S/L ratio from 30% to 70% resulted in a slight decrease in Pt extraction efficiency from 76.5% to 74.4%, respectively (Table 3).
In order for the process to be financially profitable and environmentally friendly, the highest S/L (80% for DOC and 70% for c-DPF) ratio should be performed, combined with the highest recovery yield.
3.3.2. Effect of the Leaching Solution Acidity
The key parameter for a leaching process to be industrialized is the acidity of the leaching solution, since generated waste is the most considerable parameter in a technological demonstration. The less concentrated the HCl solution is, the lower are water waste quantities generated in the washing and neutralizing steps. Thus, acidity should be minimized without compromising leaching yield. The HCl concentration of the leaching systems for the DOC and c-DPF was tested at 70 °C for 3 h. According to Table 4, the Pt extraction yields for DOC, with an S/L ratio of 70%, were not affected by increasing the HCl molarity in the leaching solution from 3 M to 4 M (Table 4).
Table 4.
Extraction yields of DOC for different HCl concentrations with 70% S/L ratio.
The effect of the acidity of the HCl leaching solution was also studied with respect to the S/L ratio. The S/L ratios of 70% and 80% were also investigated. According to the obtained results (Table 5), the recovery yield was preserved, indicating the constant solubility of the Pt in the HCl leaching solution.
Table 5.
Pt extraction yields from DOC for different HCl concentrations with 80% S/L ratio.
A similar study was also performed on the c-DPF for various HCl concentrations (Table 6). The rise in HCl concentration from 2 M to 6 M made an insignificant improvement on Pt recovery from 74.3% to 77%. Further increase of the acidity (to 9 M HCl) did not affect the extraction efficiency.
Table 6.
Pt extraction yields of c-DPF for different HCl concentrations.
For both c-DPF and DOC, the effect of HCl acidity was studied with respect to S/L ratios in order to determine the lowest acidic leaching conditions. A low molarity of 4 M with a high S/L ratio of 70% were found to be the most efficient conditions.
3.3.3. Effect of the H2O2 Oxidizing Agent
H2O2 contributes to the oxidation of Pt, enhancing the formation of complexes with Cl− ions in the leaching system. The validation of these parameters was performed for various H2O2 concentrations with calcined starting material and a 70% S/L ratio at 70 °C for 3 h. In Table 7 and Table 8 the values of all parameters and the Pt extraction yields for DOC and c-DPF are described in detail.
Table 7.
Pt leaching rate from DOC for different H2O2 concentrations.
Table 8.
Pt leaching rate from c-DPF for different H2O2 concentrations.
Insignificant variations in Pt recovery from the DOC catalyst are indicated by the increase in H2O2. Similar behavior is observed in the leaching process of the c-DPF. The maximum Pt recovery achieved was 96.2% with 0.5% vol H2O2 and 74.4% with 1% vol H2O2 for DOC and c-DPF, respectively.
Therefore, the optimum H2O2 concentration selected for both materials in the current study is 1% vol.
3.3.4. Effect of the Leaching Time
The kinetic analysis of Pt leaching from the DOC and c-DPF was investigated for 0.5–3 h for the DOC catalyst and 0.5–6 h for the c-DPF filter at 70 °C. The rest of the parameters remained identical for all experiments. Experimental parameters of this study are described in Table 9 and Table 10.
Table 9.
Pt leaching rate of DOC for different times.
Table 10.
Pt leaching rate of c-DPF for different times.
In the first hour of the leaching experiment, the Pt extraction yield from DOC was 94.8%. As shown in Figure 25 (Table 9), the leachability of Pt remained the same after 2 h, with Pt recovery of 95.3% and 95.1% at 3 h. A longer time of leaching was considered unnecessary since leaching yield had insignificantly increased.
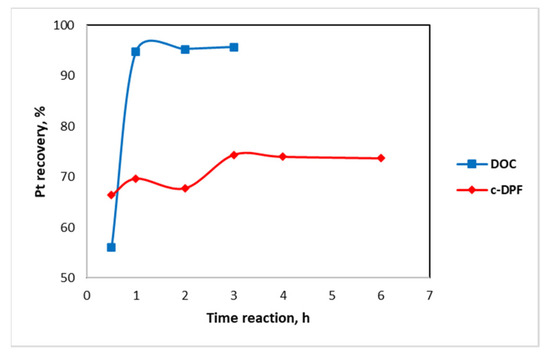
Figure 25.
Pt kinetic behavior of DOC and c-DPF for 0.5–6 leaching time with 3 M HCl, 1% vol H2O2, 4.5 M NaCl, and S/L ratio 70% at 70 °C.
On the other hand, the extraction of Pt from c-DPF is increased at a constant rate (Figure 25, Table 10). In the first hour, Pt extraction is 66.4% and is stabilized at 74.4% at the 3 h. From 2 h to 3 h, the Pt recovery rate slightly decreased from 74.4% to 73.9%, which may be attributed to the reprecipitation of the Pt.
Therefore, according to Figure 25, the leaching reaction is completed and stabilized after 2 h and 3 h for DOC and c-DPD, respectively. The time of the leaching process on an industrial scale is a determinant parameter for the sustainability of the method, thus it should be validated.
3.3.5. Effect of the Additional Cl− Content
The reagent NaCl was used as an additional source for the formation of Cl–Pt complexes without increasing the solution’s acidity. The study of this parameter was performed with calcined DOC and c-DPF at 70 °C for 3 h. The maximum Pt recovery from DOC, 95%, was achieved with 6 M NaCl, while the lower NaCl concentration 3 M reached 94.6% Pt recovery. The most efficient NaCl concentration was 4.5 M, which resulted in Pt extraction of 94.8% (Table 11).
Table 11.
Pt leaching yields of DOC for different NaCl concentrations.
In the case of c-DPF, the Pt extraction yield was almost stable for various tested NaCl concentrations (3–6 M). The higher Pt recovery (74.4%) was achieved by adding 4.5 M NaCl during the leaching experiment (Table 12).
Table 12.
Pt leaching yields of DPF for different NaCl concentrations.
Thus, 4.5 M was selected as the optimal NaCl concentration for ensuring low acidity in the leaching process.
4. Conclusions
Spent catalysts (DOCs) and filters (c-DPFs) are Pt-concentrated secondary sources. The specific automotive exhaust treatment devices contain Pt in the range of 2900–3000 ppm and 1600–1700 ppm, respectively, measured with specifically calibrated XRF devices.
Structural and elemental analyses with optical microscopy and XRF were performed to determine the distribution and content of Pt in the catalyst and filter in order to optimize the recovery process. According to these findings, Pt (doped on Ce/Zr) is impregnated in DOC walls, forming a thin layer in cordierite channels. On the other hand, in the case of c-DPF, there was a strong indication that the Pt catalyst was infiltrated in the cordierite material in order to distribute the catalyst on the bulk of the filter structure. The latter assumption was confirmed for the c-DPF filter, which was subjected to SEM-EDS analysis. According to SEM images, no washcoat was detected, while a gradual decrease of the Pt content from the inlet/outlet to the inner part (centre) of the c-DPF was observed with EDS analysis.
In order for Pt to be extracted from both materials, a single-step low acidity hydrometallurgical extraction method was applied. The effect of parameters (i.e., solid-to-liquid ratio, temperature, HCl molarity, NaCl molarity, H2O2 oxidizing agent concentration, and kinetics) was studied extensively for both systems and the experimental conditions for the highest recovery yield were determined.
Therefore, the value ranges of the recovery parameters that were studied for both material systems were:
- Solid-to-liquid (S/L) ratio: 10–70%;
- HCl concentration: 2–9 M;
- H2O2 concentration: 0.5–3% vol;
- NaCl concentration: 3–6 M; and
- Time: 0.5–6 h.
The optimum experimental conditions yielding the highest recovery are summarized and presented in Figure 26. Furthermore, the effect of calcination pretreatment on leaching efficiency was also studied. The removal of organic deposits with thermal treatment at 800 °C for two 2 h before the leaching step was investigated. The obtained extraction yields for DOC and c-DPF indicated that Pt extraction is enhanced for the DOC and c-DPF, from 48.5% to 94.6% and from 45% to 75%, respectively. Thus, the calcination step should be performed before leaching to enhance extraction (a 40% leaching efficiency increase was achieved).
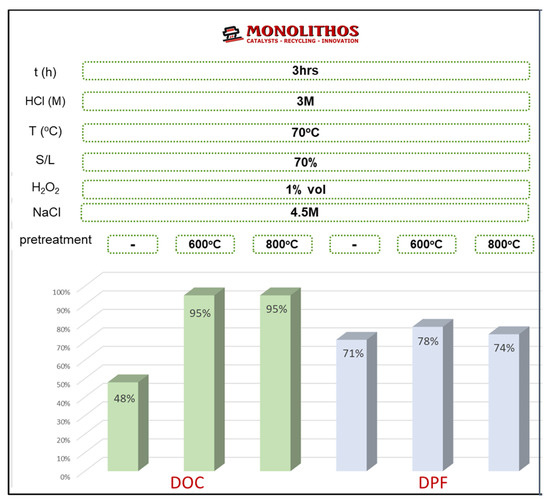
Figure 26.
Summary of recovery rates for Pt from the DOC catalysts and c-DPF filters for 3 M HCl, 4.5 M NaCl, H2O2 1% vol, and S/L 70% at 70 °C.
The Pt recovery yields reached were 95% and 75% for the DOC and c-DPF, respectively. The optimum conditions for the leaching process were S/L 70%, 3 M HCl, 1% v/v, and 4.5 M NaCl at 70 °C for 3 h. The optimized conditions for treating end-of-life catalysts and filters are very promising for up-scaling of the method to industrial capacities, since the high Pt leaching rates achieved for EoL heavy-duty emission control devices (DOCs and c-DPFs) can provide catalyst manufacturers with a reliable secondary Pt source for producing new catalysts without the need for further refinement of the system, applying the recent study of Moschovi et al. [14] for producing new catalysts from impure recycled PGM solutions.
Author Contributions
Conceptualization, I.Y.; Data curation S.P., A.-M.M.; Formal analysis: all authors; Investigation S.P., A.-M.M.; Funding Acquisition E.P., I.Y.; Methodology A.-M.M., I.Y.; Project Administration E.P.; Resources E.P.; Supervision I.Y.; Validation A.-M.M., E.P., I.Y.; Visualization E.P., I.Y.; Writing original draft: S.P., A.-M.M., E.P.; Writing review and editing: all authors. All authors have read and agreed to the published version of the manuscript.
Funding
This research was funded by EIT (European Institute of Innovation and Technology) Raw Materials CEBRA upscaling project [PA19148].
Institutional Review Board Statement
Not applicable.
Informed Consent Statement
Not applicable.
Data Availability Statement
Data available upon request from the corresponding author.
Acknowledgments
Special thanks to the Centre of Research & Technology Hellas (CERTH) for their contribution to characterization techniques: X-ray Diffraction and Thermogravimetric analysis. This study was supported by the CEBRA+ project. The CEBRA+ project (PA19148) has received funding from European Institute of Technology (EIT) for Raw Materials (EIT Raw Materials), a body of the European Union, under Horizon 2020, the EU Framework Programme for Research and Innovation.
Conflicts of Interest
The authors declare no conflict of interest.
References
- Emission Standards: Europe: Heavy-Duty Truck and Bus Engines. Available online: https://dieselnet.com/standards/eu/hd.php (accessed on 5 June 2021).
- Betsi-Argyropoulou, I.I.; Moschovi, A.M.; Polyzou, E.; Yakoumis, I. Towards ammonia free retrofitting of heavy-duty vehicles to meet euro vi standards. In Vehicle and Automotive Engineering 3; Jármai, K., Voith, K., Eds.; Springer: Singapore, 2021; pp. 206–221. [Google Scholar]
- Russell, A.; Epling, W.S. Diesel Oxidation Catalysts. Catal. Rev. 2011, 53, 337–423. [Google Scholar] [CrossRef]
- Twigg, M.V. Rôles of catalytic oxidation in control of vehicle exhaust emissions. Catal. Today 2006, 117, 407–418. [Google Scholar] [CrossRef]
- Deutschmann, O.; Konstandopoulos, A.G. Catalytic technology for soot and gaseous pollution control. In Handbook of Combustion; Lackner, M., Winter, F., Agarwal, A.K., Eds.; Wiley-VCH Verlag GmbH & Co. KGaA: Weinheim, Germany, 2010; p. hoc038. [Google Scholar]
- Ding, Y.; Zheng, H.; Li, J.; Zhang, S.; Liu, B.; Ekberg, C.; Jian, Z. Recovery of Platinum from Spent Petroleum Catalysts: Optimization Using Response Surface Methodology. Metals 2019, 9, 354. [Google Scholar] [CrossRef] [Green Version]
- Commission, E. Critical Raw Materials Resilience: Charting a Path towards Greater Security and Sustainability. Available online: https://ec.europa.eu/docsroom/documents/42849 (accessed on 11 March 2021).
- Rumpold, R.; Antrekowitsch, J. Recycling of platinum group metals from automotive catalysts by an acidic leaching process. J. S. Afr. Inst. Min. Metall. 2012. [Google Scholar]
- Ilyas, S.; Srivastava, R.R.; Kim, H.; Cheema, H. Hydrometallurgical recycling of palladium and platinum from exhausted diesel oxidation catalysts. Sep. Purif. Technol. 2020, 248, 117029. [Google Scholar] [CrossRef]
- Yakoumis, I.; Moschovi, A.; Panou, M.; Panias, D. Single-Step Hydrometallurgical Method for the Platinum Group Metals Leaching from Commercial Spent Automotive Catalysts. J. Sustain. Metall. 2020, 6, 259–268. [Google Scholar] [CrossRef]
- Yousif, A.M. Recovery and Then Individual Separation of Platinum, Palladium, and Rhodium from Spent Car Catalytic Converters Using Hydrometallurgical Technique followed by Successive Precipitation Methods. J. Chem. 2019, 2019, 1–7. [Google Scholar] [CrossRef]
- Yakoumis, I.; Moschovi, A.M.; Giannopoulou, I.; Panias, D. Real life experimental determination of platinum group metals content in automotive catalytic converters. IOP Conf. Ser. Mater. Sci. Eng. 2018, 329, 012009. [Google Scholar] [CrossRef]
- Pajdowski, P.; Puchałka, B. The Process of Diesel Particulate Filter Regeneration under Real Driving Conditions. IOP Conf. Ser. Earth Environ. Sci. 2019, 214, 012114. [Google Scholar] [CrossRef]
- Moschovi, A.; Giuliano, M.; Kourtelesis, M.; Nicol, G.; Polyzou, E.; Parussa, F.; Yakoumis, I.; Sgroi, M. First of its kind automotive catalyst prepared by recycled pgms-catalytic performance. Catalysts 2021, 11, 942. [Google Scholar] [CrossRef]
Publisher’s Note: MDPI stays neutral with regard to jurisdictional claims in published maps and institutional affiliations. |
© 2021 by the authors. Licensee MDPI, Basel, Switzerland. This article is an open access article distributed under the terms and conditions of the Creative Commons Attribution (CC BY) license (https://creativecommons.org/licenses/by/4.0/).