Abstract
In the present work, the influence of filling rate on macrosegregation in a 40-Metric Ton (MT) ingot of a high-strength low-carbon steel was studied using finite element (FE) simulation. The modelling of the filling and solidification processes were realized with a two-phase (liquid-solid) multiscale 3D model. The liquid flow induced by the pouring jet, the thermosolutal convection, and the thermomechanical deformation of the solid phase were taken into consideration. Two filling rates were examined, representing the upper and lower manufacturing limits for casting of large size ingots made of high strength steels for applications in energy and transportation industries. The evolution of solute transport, as well as its associated phenomena throughout the filling and cooling stages, were also investigated. It was found that increasing the filling rate reduced macrosegregation intensity in the upper section, along the centerline and in the mid-radius regions of the ingot. The results were analyzed in the framework of heat and mass transfer theories, liquid flow dynamics, and macrosegregation formation mechanisms.
1. Introduction
In recent years, there is an increasing demand for large size forged steel ingots in energy and transportation industries for applications in turbine shafts, trains, ships, and windmills [1]. The special steels used for such applications are produced through ingot casting. However, as the size of the ingots is increasing, so does the propensity for the occurrence of macrosegregation in the ingots. Major quality problems could thus be generated due to local changes in chemical compositions, which ultimately result in inhomogeneous microstructures and mechanical properties. While macrosegregation could be reduced or even eliminated in small to medium size ingots by homogenization treatments in the upper austenite range, it is not the case for large size ingots, even after very long holding times [2,3]. Therefore, measures must be taken to minimize the severity of this phenomenon [4]. Common measures to reduce segregation intensity include optimizing the casting process parameters [4,5], “adjusting” the chemical composition of the alloy [6], modifying the geometry of the mold and the hot-top [7]. Considering that a fully experimental-based approach is very costly, time-consuming, and difficult in the pursuit of the solidliquid interface evolution involved in large size ingot filling and solidification, numerical simulation is a valuable tool for the casting process analyses [3].
It has been reported that macrosegregation starts from the very early stage of mold filling and then expands through the entire solidification process [8]. Therefore, minimization of macrosegregation starts from a stringent control of the mold filling operation. During the filling process in industry, filling rate needs to be carefully controlled to produce high-quality castings. In fact, a too slow rate can lead to premature solidification of the molten metal, resulting in incomplete melt filling of the mold cavity; a too fast rate results in mold erosion/damage and increases the amount of entrapped air [8]. However, in most of the reported literature on ingot solidification modelling, the filling rate effects are neglected by assuming the occurrence of no phase changes in the filling stage [9], or instantaneous completion of filling [10]. Such assumptions are in contrast with the practical cases, where filling and solidification occur simultaneously and therefore influence each other [11].
Im et al. [12] numerically modeled filling and solidification of an aluminum alloy and pointed out the important effect of the residual flow on flow characteristics and solidification rate. Lee et al. [13] studied the fluid movement, temperature, and thermal stress fields during mold filling and solidification process of pure aluminum. Based on the numerical results, they found a significant influence of filling process on fluid flow, metal front migration, and heat transfer at the early stages of casting process. Kermanpur et al. [14] simulated the effect of bottom pouring rate and mold dimensions on solidification behavior of a low alloy steel in a 6-Metric Ton (MT) ingot. They showed that a constant rate and a lower mold slenderness ratio would improve the riser efficiency and reduce crack susceptibility during subsequent hot forging. Ravindran et al. [15] computationally modeled the effect of mold filling on cold shut formation, and the impact of solidification on the filling pattern and temperature field with a two-dimensional mold filling program. They reported that increasing the filling velocity could increase the melt fluidity and remedy the problem of unfilled mold cavity. Yadav et al. [11] modeled the filling and solidification of a Pb-Sn alloy in a small side-cooled cavity (50 × 60 mm2). They found that residual flow, due to filling, significantly modified the shape of the mushy zone and delayed the development of solutal convection. They associated the observed effects to less intense macrosegregation near the cold wall and a farther distance of A-segregates from the cold wall. Zhang et al. [16] performed an experimental study on two filling rates in a 40 MT steel ingot and reported that increased filling rates help to alleviate the severity of positive macrosegregation in the upper section of the casting. In most of the above analyses, however, the impact of filling rate on global solute distribution is still unclear and relevant mechanisms need further investigations, especially in large size steel ingots.
In the present work, the influence of filling rate on macrosegregation and solidification behaviors of a 40 MT high-strength low-carbon steel alloy ingot is investigated using finite element (FE) modelling. The paper builds on the previous works of the authors devoted to the model setup and verifications [17,18]. The predictability of the model was verified and confirmed by comparing with experimental measurements of the temperature profiles on the mold outer surface and the chemical distribution patterns on the longitudinal cross section of the hot-top and upper section of the ingot body [17,18]. Two filling rates (0.141 and 0.243 m3/min), representing the most encountered conditions in industry in the manufacturing cycle of large size castings, were examined. The flows induced by pouring jet, the thermosolutal convection, and the thermomechanical deformation of the solid phase were all taken into consideration; this, thereby, allows for a comprehensive analysis of the different fundamental mechanisms involved in the solidification process of large size ingots. It was found that increasing the filling rate helps to reduce macrosegregation intensity in the different regions of the ingot. The results were analyzed in the framework of heat and mass transfer theories, liquid flow dynamics and macrosegregation formation mechanisms.
2. Model Development and Boundary Conditions
The full size 40 MT model, established using the industrial bottom pour casting system (Figure 1) for reference, is shown in Figure 2a,b. The geometrical characteristics of the ingot consist in a steel cylinder of 250 cm in height and 150 cm in average diameter with 24 flutings on the exterior surface, as presented in Figure 2b. The mold consists of a big-end-up cast iron taper with 24 corrugations on the interior surface, 70 cm in height hot-top with insulating refractory tiles lined inside, and insulating exothermic refractory board over laid on the melt top (Figure 2c).
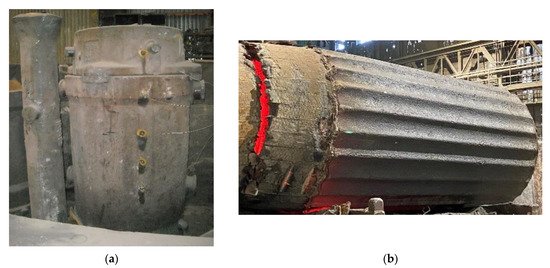
Figure 1.
Industrial casting system and ingot: (a) 40 MT ingot bottom pour casting system; (b) 40 MT steel ingot after demolding.
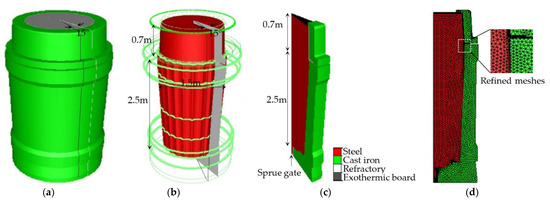
Figure 2.
40 MT casting models established for FE modelling: (a) Model established in reference to actual casting system with the segmentation illustration for 1/24 section; (b) ingot in the model with transparent mold and segmentation illustration for 1/24 section; (c) used 15° model representing 1/24 of casting system; (d) meshes used for spatial discretization of the part and mold component.
For finite element modelling (FEM), a 15° model (1/24) was used according to the rotational symmetry of the 24 flutings, as illustrated in Figure 2c. 3D tetrahedral linear finite elements with an average grid size of 35 mm (46,870 and 182,100 elements in the 1/24 steel part and casting system, respectively), as shown in Figure 2d, were implemented for the spatial discretization of the part and mold components. About 35 mm element size was used as it can provide a compromise between computational accuracy and efficiency, based on mesh sensitivity analyses [19]. Finer meshes (10 mm) were used at the ingot borders, as shown in the enlarged image on the right of Figure 2d of the ingot/mold interface region framed in gray square, for more accurate prediction of temperature gradients in the early cooling stages.
The three-dimensional simulations of mold filling and solidification were realized in the finite element modelling (FEM) code Thercast® (Transvalor S.A., Biot, France), based on volume-averaged solid-liquid two-phase thermomechanical models [20]. Due to the combination of multi-scale phenomena, the FEM model consists of two parts: a macroscopic part with momentum, mass, heat, solute conservation equations, and a microscopic part that describes local solute transport. All the relevant governing equations and the assumptions made for the numerical model are provided in the Appendix A. In the resolution stage, a coupled computation of different fields was performed so that equations were solved iteratively using a prescribed time step.
The chemical composition of the investigated steel is given in Table 1. For the simulations, the liquid steel temperature was 1570 °C (with a superheat of 75 °C) which was bottom poured into the 50 °C mold. Two average filling rates (assumed constant during mold filling process) of 0.141 and 0.243 m3/min, corresponding to the filling times of 38 and 22 min, were investigated. Therefore, the modeled cases were identified in the rest of the manuscript as 38 M and 22 M, respectively. After the filling operation, the steel melt cooled naturally inside the mold until complete solidification of the ingot. The unilateral contact condition (i.e., separation between the casting and the mold wall) was applied to the casting-mold interface for the thermomechanical analysis. Heat transfer was mainly through conduction before the air gap formation (ingot and mold separation) due to solid shrinkage, and then through convection after that. Predicted patterns of carbon segregation ratio, RC, were constructed based on the relation: RC = (ωC − )/, where ωC is the local carbon concentration and is its nominal concentration value. Considering the model complexity for such large size ingots, effects of grain sedimentation, small disturbances in the fields (such as dispersion fluxes), mold deformation, the interaction between the air in the mold and the steel melt during mold filling process, were neglected.

Table 1.
Nominal composition of the studied steel (wt.%).
The input material parameters, such as density, solid/liquid fraction, specific heat capacity, and their temperature dependence were determined by means of the computational thermodynamic software, Thermo-Calc® (Thermo-Calc Software) [21] with TCFE7 Steels/Fe-alloys database. The thermal conductivity of the steel was assumed to follow Miettinen’s model as a function of temperature and phase fraction [22]. The applicability of the software and model was verified before being applied to the investigated steel. Steel thermomechanical properties, such as Yield stress, Young’s modulus, strain hardening exponent, strain–rate sensitivity coefficient and their variations with temperature were extracted from experimental tension tests performed at temperatures of 25–1300 °C and strain rates of 10−3 and 10−4/s. Steel thermodiffusional properties, such as the equilibrium partition coefficient and the slopes of liquidus lines were calculated for each element based on linearized binary phase diagrams with respect to iron. The solutal expansion and the diffusion coefficient in the liquid of each element were obtained from literature. The thermophysical properties of all other materials were obtained from Thermo-Calc® calculations, literature, experimental measurements, or from the industry. Details of the methodology used for the determination of all the material parameters were published in a recent article [17].
3. Results and Discussion
3.1. Macrosegregation Pattern
Figure 3 shows the predicted evolution of segregation ratio patterns of carbon on the longitudinal section for the two filling rate cases. It is seen that the variation of filling rate gave rise to different large-scale compositional distribution in the course of solidification. At 1.5 h, in 38 M with lower filling rate (0.141 m3/min), solute rejection occurred in the bulk liquid [11]; a solutal gradient was developed in the radial and vertical directions of the entire casting, as presented in Figure 3a. As solidification proceeded, a positively segregated zone in the upper center region [16] and solute-enriched bands between the ingot axis and the mold wall formed progressively [2], as seen in Figure 3b. Under higher filling rate condition (i.e., 22 M), in contrast, the radial and vertical solutal gradients were much less in intensity and extent in the first solidification phase; this less macrosegregation trend was maintained till the end of solidification, as compared in Figure 3a–d,e–h. Weaker accumulation of solutes, in the ingot body, along the centerline and in the mid-radius regions, occurred in the higher filling rate case (22 M).
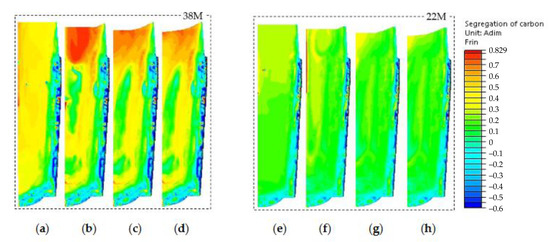
Figure 3.
Predicted macrosegregation ratio patterns of carbon in the solidification process at times of: (a,e) 1.5 h; (b,f) 5.5 h; (c,g) 10.5 h; (d,h) end of solidification.
Based on the above results, it can be said that higher filling rates generate lower macrosegregation intensity in the ingot body, along the centerline and in the mid-radius solute-enriched bands. This finding is of importance from a practical point of view for reducing the extent of macrosegregation in large size ingots. This also indicates that the solidification process of the ingot body, induced by different filling rates, plays a key role in the compositional variations, as will be discussed in the following sections.
3.2. Liquid Movement
As reported in Figure 4, varied liquid movement was created during the casting processes as a function of the filling rate. In the course of mold filling, as seen in Figure 4a,e with mold cavity illustrated in dashed lines, higher filling rates led to higher rising velocity of the liquid level. The ingot axial up-flow, the melt surface lateral flow toward the mold wall, and the clockwise vortex near the melt surface took place for both cases. Such features have been reported to be due to the combined effects of the pouring jet, the inertia effect of the residual flow, and their impact on the mold wall [23]. The results show that higher filling rate decreased the size of the melt surface vortex, pushed the vortex toward the outer radius, and created farther descending fluid flow along the melt front. Particularly, under the higher filling rate condition (i.e., 22 M), the incoming melt from the center impinged on the lateral flow, creating a hump on the molten steel surface (Figure 4e). The liquid flow features indicate larger momentum produced by higher filling rate. This predicted higher kinetic energy in the bulk liquid with increased filling rate agrees with the reported results based on Reynolds number calculation [16].
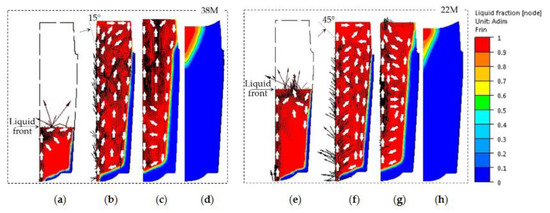
Figure 4.
Liquid fraction patterns combined with velocity vectors predicted by 38 M and 22 M for times of: (a,e) 12 min; (b,f) end of filling; (c,g) 1.5 h; (d,h) 10.5 h.
Results reported in Figure 4b,f show that all the above-mentioned features were still present at the end of the filling process for the examined conditions. In addition, the centerline up-flow stream began to branch from the ingot axis, taking on an open umbrella shape. Higher filling rate went along with larger deviation angle, passing from 15° for 38 M to 45° for 22 M. Given that the up-flow branching commenced when the bulk liquid touched the top-laid board, this axial flow deviation could be related to the impact of the up-flow liquid on the top board. The increase of the deviation angle for the higher filling rate could be correlated with the higher kinetic energy, and the resultant stronger impact of the pouring jet to the mold top. Further examination of Figure 4b,f revealed that the fluid streams deviated laterally only in the ingot body and forced the superheated fluid to flow more strongly toward the mold wall, affecting the radial thermal gradient in the ingot body.
At 1.5 h, Figure 4c,g, a clear difference is seen between the studied cases. At the lower filling rate (38 M, Figure 4c), slight trails of clockwise vortex in the hot-top and the disappearance of the deviated streams in the ingot body suggest a reduction in the residual flow. A downward flow was remarked, moving from the upper hot region to the bottom cold zone along the centerline in the lower part of the ingot, indicating the development of thermal convection, as also reported by Yadav et al. [11]. Furthermore, lateral streams from the periphery (denser region) to the center (less dense region) was observed in the lower part of the ingot body. This could be related to the development of solutal convection under the action of density gradient. All the above features indicate the dominance of natural convection as the main heat transfer mode for the 38 M condition.
At the higher filling rate (22 M, Figure 4g), important axial up-flow, strong lateral deviated streams in the ingot body, and large clockwise movement in the hot-top are all observed, which are characteristics of a strong residual flow. The above features in the liquid movement indicate that higher filling rate gave rise to preponderance of residual flow over longer times and delayed the occurrence of thermal and then solutal convections in the early stages of the solidification process.
On the basis of the above findings, it could be said that the significant difference in solutal distributions in the early solidification stage, as shown in Figure 3a,e, should result from the varied liquid movement created by different filling rates. The decrease of the centerline solutal gradient in higher filling rate case is probably due to the larger deviation from the centerline up-flow stream, which weakened the solutal accumulation along the ingot axis. The stronger residual flow, its longer dominant time, and the delayed development of thermosolutal convection could be identified as the root causes of the smaller solutal gradient. In agreement with the findings of Qian et al. [7], the less ordered down-stream movement of the liquid metal along the solidification front, next to the mold wall, could be the main cause for the less severe segregation in the mid-radius band in the higher filling rate case, as shown in Figure 3. This stream would pass through the lower liquid fraction, remelt, and consequently channel the mushy zone, thereby influencing the mass transfer and the formation of the positive segregated bands close to the chill zone.
3.3. Solidification Speed
Further examination of Figure 4 revealed that the solidification speed was affected by mold filling rate. In the first solidification phase, solidification progressed more slowly in the higher filling rate case, while in the later solidification stage, solidification was accelerated and completed earlier when filling rate was increased.
From Figure 4a,e, it is seen that for the two studied cases, solidification took place at the mold bottom corner before the end of the filling stage. Then, the solid skin grew inward and upward due to the rapid extraction of the initial superheat from the cold mold wall. However, it was noted that the solid shell heights next to the mold wall increased with the increase of filling rate. This could be due to the larger liquid level rising velocity, which brought hot melt in contact with the larger cold inner surface of the mold in a given time, and ultimately led to the formation of a higher solid shell.
In addition, a comparison between Figure 4b,f revealed that increasing the filling rate resulted in the formation of a thinner solid layer along the cold wall at the end of the filling process. The solid shell thicknesses next to the mold wall occupied about 7.5% and 6.5% of the total mass for 38 M and 22 M, respectively. These findings are in agreement with those reported by Im et al. [12], who pointed out the association of higher residual flow with the decrease of the local solidification rate during the initial stages of solidification. This delay in solidification could be related to the continuous supply of hot molten steel to the wall side due to the longer action of lateral residual flow after filling. It must be noted that no solid layers formed in the hot-top for both studied cases. This can be related to the insulation of the side refractory tiles laid inside the mold.
However, it was revealed that the solidification rate increased with increasing the filling rate after the initial phase of the solidification process. For instance, at 1.5 h (see Figure 4c,g), the solid shell in the hot-top grew shorter (i.e., larger liquid fraction) in 38 M. Furthermore, after 10.5 h, when the ingot solidification was very advanced, as seen in Figure 4d,h, larger liquid fraction and deeper liquid pool (larger red area) were found in the smaller filling rate case (i.e., 38 M).
Analysis of the total solidification time also indicates the acceleration tendency of the solidification process under higher filling rate conditions. Specially, as shown in Figure 5a, it took 15 h 21 min (55,312 s) for 38 M to complete the solidification, which was 26 min longer than 22 M (53,735 s, i.e., 14 h 55 min, Figure 5b).
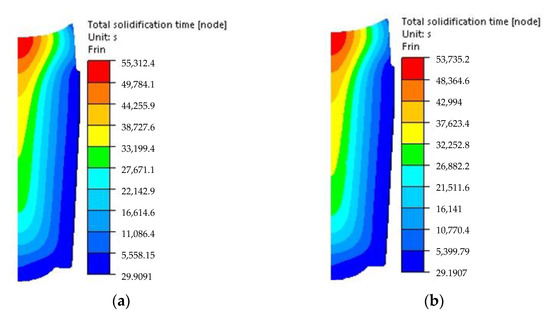
Figure 5.
Predicted solidification time: (a) 38 M; (b) 22 M.
Zhang and Bao [23] reported in a recent publication that when higher filler rates are used, the shrinkage cavity increases, i.e., lower volume of the ingot is produced. The results reported in Figure 6 indicate that final casting volume (V) for 38 M reached 92.5% of the total mold vacant volume (V0), while it was 91.7% for 22 M. Thus, the acceleration in the solidification process in the higher filling rate case has probably its origin in a larger volume contraction. Finally, considering that solidification rate determines the time available for solutal diffusion and accumulation, and thus the macrosegregation intensity. Therefore, a more rapid solidification process should be one of the sources for the reduced macrosegregation severity when higher filling rates are employed.
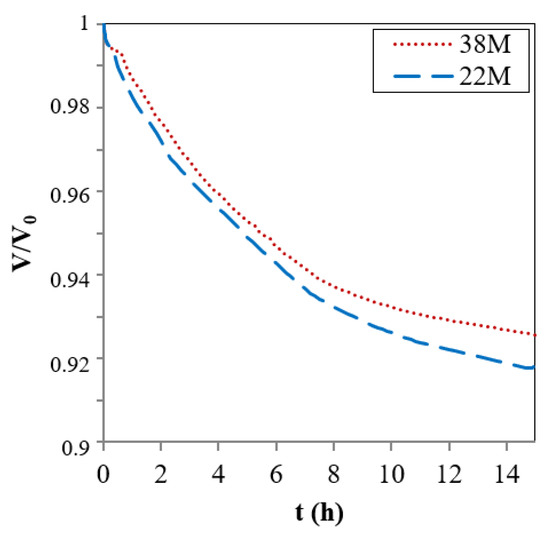
Figure 6.
Time-dependent ratio of instantaneous casting volume V to the initial mold vacant one V0.
3.4. Temperature Field
The global temperature fields predicted by the simulations are shown in Figure 7. At the end of filling, as displayed in Figure 7a,d, larger red regions above the 1550 °C isotherm were left for the higher filling rate condition. This finding further confirms the effect of smaller dissipation rate of the superheat due to stronger residual flow in higher filling rate case in the first hours. The slower superheat extraction under higher filling rate condition resulted in slightly smaller temperature gradient regions next to the mold chill wall and the base.
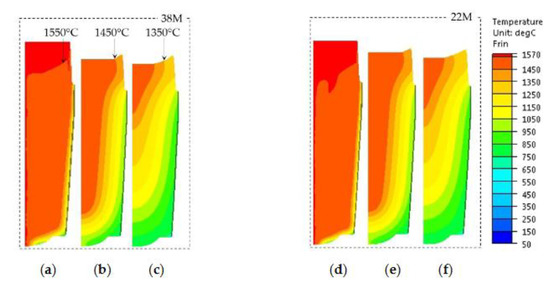
Figure 7.
Temperature fields predicted by 38 M and 22 M at times of: (a,d) end of filling; (b,e) 5.5 h; (c,f) 10.5 h.
Further analysis of Figure 7 indicated that independent of filling rate, the horizontal isotherms tended to incline more and more as the solidification proceeded, and the spacing between the adjacent isotherms widened. However, in the intermediate stage of solidification (Figure 7b,e), the temperature regions next to the hot-top wall and enclosed by isotherms of 1450 and 1350 °C were wider at higher filling rate (i.e., smaller temperature gradient). After 10.5 h, in Figure 7c,f, the 1350 °C isotherm in 22 M moved farther away from the isotherm 1250 °C, which is next to the wall side, indicating smaller temperature gradient under higher filling rate conditions. Similar findings on the decrease of thermal gradient at higher filling rates have been reported by Aboutalebi [24] and more recently by Wang et al. [25,26]. However, they are different from those of Prescotte and Incropera [27] who did not observe a noticeable change on vertical thermal gradient when inlet filling conditions were changed. The difference could be due to the fact that contributions from thermomechanical deformation were not considered in Prescotte and Incropera study.
It must be noted that the smaller temperature gradient for the higher filling rate can also contribute to reduced solute segregation in the casting body of the ingot, as observed in Figure 3. As reported from other works [16,23,28,29,30], temperature gradient occurs concomitantly with density gradient. This affects the development of solutal convection and thus solute distribution in the solidification process, thereby influencing the formation of macrosegregation. Therefore, the occurrence of the lower temperature gradient with increased filling rate produces delayed solutal convection, which contributes to smaller solute accumulation (i.e., lower macrosegregation intensity) in the ingots.
4. Conclusions
Higher filling rate helps to decrease the segregation severity in the upper section of the ingot body, along the centerline, and in the solute-enriched bands between the ingot centerline and the mold wall. The lower intensity of the segregation in the ingot with higher filling rate could be attributed to three sources:
- Higher kinetic energy in the bulk liquid, longer action of residual flow, and delayed development of thermosolutal convection in the early stages of the solidification process;
- Accelerated solidification process;
- Decreased temperature gradient.
The current work fills the gap in the literature about the impact of filling rate on the global macrosegregation formation in large size ingots. These findings could be used in the industry to improve the quality of large-size ingot production made of high value-added steels or other alloys which are prone to macrosegregation.
Author Contributions
Conceptualization, M.J. and C.Z.; methodology, C.Z.; software, C.Z. and A.L.; validation, C.Z. and A.L.; formal analysis, C.Z., A.L. and J.-B.M.; investigation, C.Z.; resources, M.J. and J.-B.M.; data curation, C.Z.; writing—original draft preparation, C.Z.; writing—review and editing, A.L., M.J. and J.-B.M.; visualization, C.Z.; supervision, M.J.; project administration, M.J.; funding acquisition, M.J. and J.-B.M. All authors have read and agreed to the published version of the manuscript.
Funding
This research was funded by [Natural Sciences, Consortium de recherche et d’innovation en transformation métallique (CRITM)] grant number [2018-053] and [Natural Sciences and Engineering Research Council of Canada (NSERC) in the form of a Collaborative Research and Development Grant (CRD)] grant number [536444].
Data Availability Statement
Not applicated.
Acknowledgments
Finkl Steel-Sorel Co. for providing the technical data, casting facility, material and extensive technical discussions, and the financial support from the Natural Sciences, Consortium de recherche et d’innovation en transformation métallique (CRITM) and Natural Sciences and Engineering Research Council of Canada (NSERC) in the form of a Collaborative Research and Development Grant (CRD) are gratefully acknowledged.
Conflicts of Interest
The authors declare no conflict of interest; One of the authors, Jean-Benoit Morin, is an employee of a company.
Appendix A
The three-dimensional simulations of mold filling and solidification were realized in the finite element (FE) code Thercast®, based on volume-averaged solid-liquid two-phase thermomechanical models [19]. Due to the combination of multi-scale phenomena, the FEM simulation model consists of two parts: a macroscopic part with momentum, mass, heat, solute conservation equations, and a microscopic part that describes local solute transport. Before simulation, some assumptions were made to simplify the numerical model:
(1) The liquid was incompressible Newtonian with laminar flow, in which the gravity-driven natural convection loops were created by local density variation, reflecting both the thermal convection flows induced by thermal expansion and temperature gradients and solutal convection flows induced by solutal expansion and concentration gradients:
Here, ρl is the liquid density, ρ0 is the density taken at the reference temperature Tref (imposed equal to the liquidus temperature), βT and are the thermal and solutal expansion coefficients, respectively, T is the temperature, is the solute concentration in liquid, and is the initial solute concentration for solute element i.
(2) The mush region was considered as an isotropic porous solid medium, with the permeability, Kperm, saturated with liquid:
in which d2 is the average secondary dendrite arm spacing, fl denotes the volumetric liquid fraction.
(3) Microscopic diffusion in the liquid was perfect. The diffusion of carbon in the solid was complete (Level Rule behavior), while the diffusion of other solutes in the solid was null (Scheil equation).
(4) Local temperature was a function of the liquid concentration composition and the liquidus slope :
where Tm is the melting temperature of the pure iron (principal element) and N is the number of solute elements in the steel.
(5) The heat flux was determined by the Fourier law and given by the sum of natural convection and radiation contributions:
where n denotes the outward normal unit vector, h (W/m/°C) is the heat transfer coefficient, and Text is the external temperature, εT is the steel emissivity (=0.8), σT is the Stephan-Boltzmann constant (σT = 5.776 × 10⁻⁸ W/m2/K). Heat transfer coefficient h depends on time or the interface temperature between the part and the mold, simulating the casting/mold contact or loss of contact (formation of air gap) during the cooling of the metal.
(6) The solute flux followed Fick’s law:
where is the diffusion coefficient of the chemical element i in the liquid.
Based on the above assumptions, the analyses of fluid flow, temperature, and solute distribution in a solidifying material state the conservations of mass, momentum, energy and solute. A coupled computation of the stress fields was also performed.
The thermal problem treatment was based on the resolution of the heat transfer equation (energy conservation):
where ρ (kg/m3) denotes the density, T (°C) is the temperature, λ (W/m/°C) is the thermal conductivity, and H (J) is the enthalpy, which is defined as:
where Cp (J/kg/°C) is the specific heat, fl is the volume fraction of liquid, Lf (J/kg) is the specific latent heat of fusion.
Redistribution of each solute i was governed by solute conservation equation:
The mechanical equilibrium was governed by the momentum conservation equation:
where s is the Cauchy stress tensor, p is pressure, g is the gravitational acceleration, v is the average velocity.
To simulate the cooling of the material from the liquid state to the mushy state and then to the solid state, a hybrid constitutive model was used, and the averaged mass balance was metal state dependent.
In the liquid state, the alloy was treated as a thermo-Newtonian fluid using Arbitrary Lagrangian-Eulerian (ALE) formulation. The behavior was dealt with by the Navier-Stokes equation with temperature-dependent terms:
where is the Von Mises equivalent flow stress, ηl is dynamic viscosity of the liquid, T is the temperature, is the equivalent plastic strain rate.
In the solid state (below the solidus temperature Ts), the metal was assumed to be thermo-elasto-viscoplastic and treated in a Lagrangian formulation. The law II of Kozlowski et al. was reformulated as follows:
where Ks is the viscoplastic consistency in the solid, is the equivalent plastic strain, n the strain hardening coefficient, and m the strain rate sensitivity coefficient.
The mushy state was approximated as a single continuum that behaved as a generalized non-Newtonian (viscoplastic) fluid. Two different behaviors of the metal in mushy state were distinguished by coherency temperature Tconf, which is the temperature at which liquid volumetric fraction fl = 0.3.
Above the Tconf temperature, the semi-liquid material at high liquid fraction was treated as the liquid circulating in a solid skeleton. A Norton-Hoff type thermo-viscoplastic (-vp) behavior was considered:
where Kvp is the viscoplastic consistency of the material. The strain rate tensor was split into a viscoplastic component and a thermal component. The solidification shrinkage was calculated from the equation: Δεtr = (ρs − ρl)/ρl, where ρs and ρl denote densities at the solidus and liquidus temperature, respectively. The continuity equation (equation of conservation of mass) is:
where α is the coefficient of linear thermal expansion.
Below the Tconf temperature, the semi-solid metal at low liquid fraction was assumed to obey a thermo-elasto-viscoplastic (evp) constitutive behavior proposed by the Perzyna law with threshold type:
The strain rate tensor was split into an elastic part, a viscoplastic part, and a thermal part. The continuity equation (equation of conservation of mass) therefore becomes:
here, , E is the Young’s modulus (MPa), v is the Poisson’s coefficient.
References
- Scarabello, D.; Ghiotti, A.; Bruschi, S. FE modelling of large ingot hot forging. Int. J. Mater. Form. 2010, 3 (Suppl. 1), 335–338. [Google Scholar] [CrossRef]
- Loucif, A.; Fredj, E.B.; Harris, N.; Shahriari, D.; Jahazi, M.; Lapierre-Boire, L.-P. Evolution of A-type macrosegregation in large size steel ingot after multistep forging and heat treatment. Metall. Mater. Trans. B 2018, 49, 1046–1055. [Google Scholar] [CrossRef]
- Pickering, E.J. Macrosegregation in steel ingots: The applicability of modelling and characterisation techniques. ISIJ Int. 2013, 53, 935–949. [Google Scholar] [CrossRef] [Green Version]
- Zulaida, Y.M.; Suryana. Macrosegregation and dendritic structure formation in different solute composition. AIP Conf. Proc. 2016, 1746, 020011. [Google Scholar] [CrossRef]
- Zhang, C.; Jahazi, M.; Tremblay, R. Simulation and experimental validation of the effect of superheat on macrosegregation in large-size steel ingots. Int. J. Adv. Manuf. Technol. 2020, 107, 167–175. [Google Scholar] [CrossRef]
- Su, H.; Wang, H.; Zhang, J.; Guo, M.; Liu, L.; Fu, H. Influence of melt superheating treatment on solidification characteristics and rupture life of a third-generation Ni-based single-crystal superalloy. Metall. Mater. Trans. B 2018, 49, 1537–1546. [Google Scholar] [CrossRef]
- Qian, S.; Hu, X.; Cao, Y.; Kang, X.; Li, D. Hot top design and its influence on feeder channel segregates in 100-ton steel ingots. Mater. Des. 2015, 87, 205–214. [Google Scholar] [CrossRef]
- Campbell, J. Complete Casting Handbook: Metal Casting Processes, Metallurgy, Techniques and Design, 1st ed.; Butterworth-Heinemann, Elsevier Ltd.: Burlington, MA, USA, 2011; pp. 105–153. [Google Scholar]
- Tavakoli, R.; Babea, R.; Davami, P. Numerical simulation of liquid/gas phase flow during mold filling. Comput. Methods Appl. Mech. Eng. 2006, 196, 697–713. [Google Scholar] [CrossRef]
- Chakraborty, S.; Dutta, P. Three-dimensional double-diffusive convection and macrosegregation during non-equilibrium solidification of binary mixtures. Int. J. Heat Mass Transf. 2003, 46, 2115–2134. [Google Scholar] [CrossRef]
- Yadav, A.; Pathak, N.; Kumar, A.; Dutta, P.; Sarkar, S. Effects of the filling process on the evolution of the mushy zone and macrosegregation in alloy casting. Model. Simul. Mater. Sci. 2009, 17, 035006. [Google Scholar] [CrossRef]
- Im, I.T.; Kim, W.S.; Lee, K.S. A unified analysis of filling and solidification in casting with natural convection. Int. J. Heat Mass Transf. 2001, 44, 1507–1515. [Google Scholar] [CrossRef]
- Lee, J.; Mok, M.; Hong, C.P. Straightforward numerical analysis of casting process rectangular mold: From filling to solidification. ISIJ Int. 1999, 39, 1252–1261. [Google Scholar] [CrossRef] [Green Version]
- Kermanpur, A.; Eskandari, M.; Purmohamad, H.; Soltani, M.A.; Shateri, R. Influence of mould design on the solidification of heavy forging ingots of low alloy steels by numerical simulation. Mater. Des. 2010, 31, 1096–1104. [Google Scholar] [CrossRef]
- Ravindran, K.; Lewis, R.W. Finite element modelling of solidification effects in mould filling. Finite Elem. Anal. Des. 1998, 31, 99–116. [Google Scholar] [CrossRef]
- Zhang, C.; Loucif, A.; Jahazi, M.; Tremblay, R.; Lapierre, L.-P. On the effect of filling rate on positive macrosegregation patterns in large size cast steel ingots. Appl. Sci. 2018, 8, 1878. [Google Scholar] [CrossRef] [Green Version]
- Zhang, C.; Shahriari, D.; Loucif, A.; Melkonyan, H.; Jahazi, M. Influence of thermomechanical shrinkage on macrosegregation during solidification of a large-sized high-strength steel ingot. Int. J. Adv. Manuf. Technol. 2018, 99, 3035–3048. [Google Scholar] [CrossRef]
- Zhang, C.; Jahazi, M. On the impact of microsegregation model on the thermophysical and solidification behaviors of a large size steel ingot. Metals 2020, 10, 74. [Google Scholar] [CrossRef] [Green Version]
- Zhang, C. Influence of Casting Process Parameters on Macrosegregation in Large Size Steel Ingots Using Experimentation and Simulation. Ph.D. Thesis, École de Technologie Supérieure, Montreal, QC, Canada, March 2020. [Google Scholar]
- Thercast 8.2®; Transvalor, S.A.: Biot, France.
- Andersson, J.O.; Helander, T.; Höglund, L.; Shi, P.F.; Sundman, B. Thermo-Calc & DICTRA, Computational tools for materials science. Calphad 2002, 26, 273–321. [Google Scholar] [CrossRef]
- Miettinen, J. Calculation of solidification-related thermophysical properties for steels. Metall. Mater. Trans. B 1997, 28, 281–297. [Google Scholar] [CrossRef]
- Zhang, C.; Bao, Y.; Wang, M. Influence of casting parameter on shrinkage porosity of a 19ton steel ingot. Metall. Ital. 2016, 1, 37–44. [Google Scholar]
- Aboutalebi, M.R. Modelling of Turbulent Transport Phenomena and Solidification in Continuous Casting Systems. Ph.D. Thesis, Department of Mining and Metallurgical Engineering, McGill University, Montreal, QC, Canada, February 1994. [Google Scholar]
- Wang, X.; Ma, N.; Bliss, D.F.; Isele, G.W.; Becla, P. Combining static and rotating magnetic fields during modified vertical bridgman crystal growth. J. Thermophys. Heat Transf. 2007, 21, 736–743. [Google Scholar] [CrossRef]
- Wang, B.; Yang, Y.; Tang, W. Microstructure refinement of AZ91D alloy solidified with pulsed magnetic field. Trans. Nonferrous Met. Soc. China 2008, 18, 536–540. [Google Scholar] [CrossRef]
- Prescott, P.J.; Incropera, F.P. The effect of turbulence on solidification of a binary metal alloy with electromagnetic stirring. Trans. ASME 1995, 117, 716–724. [Google Scholar] [CrossRef]
- Vives, C.; Perry, C. Effects of electromagnetic stirring during the controlled solidification of tin. Int. J. Heat Mass Transf. 1986, 29, 21–33. [Google Scholar] [CrossRef]
- Hachani, L.; Saadi, B.; Wang, X.D.; Nouri, A.; Zaidat, K.; Belgacem-Bouzida, A.; Ayouni-Derouiche, L.; Raimondi, G.; Fautrelle, Y. Experimental analysis of the solidification of Sn–3 wt.% Pb alloy under natural convection. Int. J. Heat Mass Transf. 2012, 55, 1986–1996. [Google Scholar] [CrossRef]
- Liu, S.F.; Liu, L.Y.; Kang, L.G. Refinement role of electromagnetic stirring and strontium in AZ91 magnesium alloy. J. Alloys Compd. 2008, 450, 546–550. [Google Scholar] [CrossRef]
Publisher’s Note: MDPI stays neutral with regard to jurisdictional claims in published maps and institutional affiliations. |
© 2021 by the authors. Licensee MDPI, Basel, Switzerland. This article is an open access article distributed under the terms and conditions of the Creative Commons Attribution (CC BY) license (https://creativecommons.org/licenses/by/4.0/).