Article

Effect of Bottom Blowing Mode on Fluid Flow and Mixing Behavior in Converter

1
State Key Laboratory of Advanced Metallurgy, University of Science and Technology Beijing, Xueyuan Road 30, Beijing 100083, China
2
Technology and Research Center, Xinyu Iron and Steel Co., Ltd., Metallurgical Road 1, Xinyu 338001, China
*
Author to whom correspondence should be addressed.
Metals 2022, 12(1), 117; https://doi.org/10.3390/met12010117
Submission received: 18 November 2021 / Revised: 23 December 2021 / Accepted: 1 January 2022 / Published: 7 January 2022
(This article belongs to the Special Issue Oxygen Steelmaking Process)

Abstract

:
Bottom blowing agitation plays a crucial role in improving the reaction kinetics condition of molten bath during the steelmaking process. Herein, the influence of bottom blowing mode on the flow and mixing characteristics of molten bath and the abrasion characteristics of refractory lining in a 6:1 scaled-down model of a 100 t converter were investigated using physical and numerical simulations together. Eight bottom blowing modes were designed (uniform, three-point linear co-direction, three-point linear unco-direction, two-point linear, circumferential linear, A-type, V-type, and triangle alternating). The results indicated that bottom blowing mode has a significant effect on the local flow field at the inner ring of bottom tuyeres, the velocity interval distribution, and the turbulent kinetic energy, which in turn determines the tracer diffusion path and rate as well the mixing time of molten bath. Reasonable non-uniform bottom blowing modes promote the interaction between the various stirring sub-zones of the molten bath. Among them, the three-point linear co-direction mode and A-type mode have the highest mixing efficiency under the conditions of bottom blowing and combined blowing, respectively, which is superior to the uniform mode. In addition, the bottom blowing mode changed the location and degree of abrasion of the refractory lining, and the total abrasion of the non-uniform mode was reduced. The average value and fluctuation degree of integral wall shear stress for the A-type mode were minimal.

1. Introduction

The top and bottom combined blowing converters are now widely used worldwide in the main process of steelmaking. Among them, the interaction between the top blowing supersonic oxygen jet and the molten bath is the basis for most complex physical and chemical reactions, and the bottom blowing gas plays an important role in the stirring and mixing of the molten bath [1,2,3,4]. Efficient bottom blowing agitation is beneficial to improving the reaction kinetics condition of the molten bath, homogenizing the composition and temperature of the molten steel, promoting the carbon–oxygen reaction equilibrium, enhancing the dephosphorization efficiency and reducing the degree of overoxidation, etc., thereby improving the quality level of the molten steel and the production efficiency.
In recent decades, many researchers have studied the optimization of the bottom blowing process using physical and numerical simulations. Improving the mixing efficiency of the molten bath can be achieved through the following three methods: (1) designing the arrangement of bottom blowing tuyeres [5,6,7,8,9,10,11,12,13,14,15,16,17,18,19,20], (2) optimizing the number of bottom blowing tuyeres [7,21,22,23,24], and (3) controlling the gas flow rate of each or all bottom blowing tuyeres [25,26,27,28,29,30,31,32,33,34].
Roth [5] and Stišovic [6] studied the mixing characteristics of the bottom blowing metallurgical reactor through a cold model. The results indicated that increasing the eccentricity of bottom elements within a certain limit can improve the mixing effect of the molten bath. Li et al. [7] recognized that the mixing time increased as the angle of the bottom tuyeres decreased, and 45° was suggested for the angle. Singh et al. [8] applied the physical and numerical models to investigate the pitch to circle diameter ratio (PCD) on the mixing time. They found that the bottom blowing and combined blowing conditions achieved the best mixing efficiency when the PCDs were 0.56 and 0.40, respectively. Considering the interaction between the circulatory fluxes of the top blowing jet and the bottom blowing stream, Smirnov et al. [9] reported that the PCD should be controlled within the range of 0.66–0.80. Furthermore, some researchers [10,11,12] have also obtained different values of the PCD for the best mixing efficiency. The essential reasons for the difference in results are the furnace type and the impact cavity dimension induced by the top blowing supersonic oxygen jet. Choudhary et al. [13] performed water model experiments to optimize the bottom tuyere configuration and showed that the mixing time was shortest for the eight-tuyere symmetric non-equiangular arrangement. However, Lai et al. [14] recognized that the asymmetric and concentrated bottom system was more conducive to the mixing of the molten bath. Additionally, Ballal et al. [15] reported that the asymmetric arrangement led to more severe wear of bottom refractory lining. To further improve the mixing efficiency of molten bath, some researchers [16,17,18,19,20] have studied the influence of side blowing on the flowing characteristics. The results showed that a reasonable side blowing tuyere arrangement can significantly enhance the horizontal flow trend, reduce the volume of the dead zone, and improve the overall stirring effect of the molten bath. Zhou et al. [20] found that side blowing streams can remarkably change the distribution of wall shear stress.
Olivares [21] and Ajmani [22] found that the mixing time decreased as the number of bottom blowing tuyeres increased through water model experiments. However, Li et al. [7] reported that the mixing time tended to decrease and then increase as the number of bottom tuyeres increased by numerical simulation. The above results are not consistent due to the limitation of the number range of bottom blowing tuyeres. Odenthal et al. [23] recognized that the mixing time will first decrease, then increase, and then decrease with the increase in the number of bottom tuyeres using numerical simulation and theoretical analysis. Wang et al. [24] concluded that the number of bottom tuyeres should be controlled at 4–6, and bottom blowing intensity should be maintained within the range of 0.10–0.15 m3·t−1·min−1.
Li et al. [25] carried out physical and numerical simulations to investigate the influence of total bottom flow rate on the mixing characteristics. The results indicated that the mixing time first decreases and then increases with the increase in the total bottom flow rate. When the bottom flow rate is too large, the bottom blowing stream penetrates the molten bath, resulting in low mixing energy utilization, which is not conducive to effective stirring and mixing of the molten bath. Xue et al. [26] reported that the global flow field and dead zone of the molten bath were not significantly improved after the bottom flow rate increased to a certain extent due to the limitation of the specific bottom tuyere arrangement. Accordingly, some researchers [27,28,29,30,31,32,33,34] have studied the influence of bottom blowing mode on the mixing and stirring of different metallurgical reactors (basic oxygen furnace, electric arc furnace, ladle furnace). Yao et al. [31] found that reasonable non-uniform gas supply modes are beneficial to improve the mixing in the converter molten bath. Singh et al. [32] performed water model experiments to study the effects of bottom blowing mode on mixing time under the combined blowing condition. The results showed that the mixing time of the linear flow gradient is the shortest, but due to the limitations of the physical model, it is impossible to observe flow field and velocity distribution in the molten bath. Chu et al. [33] developed a half-converter model and found that the mixing efficiency of the linear fixed total flow rate is highest under the bottom blowing condition, followed by the linear fixed maximal flow rate, V-type, and uniform modes. The results of Quiyoom et al. [34] showed that compared with the linear flow scheme, the W-type and V-type bottom blowing schemes can generate radial flow in the molten bath, which is more helpful to improve the mixing efficiency, but their study was limited to simulating pure bottom blowing. The aforementioned studies show that bottom blowing mode will inevitably change the fluid flow and energy distribution of the molten bath, which in turn affects the erosion of the refractory lining. However, there are few reports on the influence of bottom blowing mode on the erosion of the wall surface. In general, it is the most convenient and low-cost method to improve the dynamics of the molten bath by changing the bottom blowing mode during the actual steelmaking process. Therefore, it is necessary to conduct a systematic and comprehensive study on the influence of various types of non-uniform bottom blowing modes on the flow and mixing characteristics of the molten bath, as well as the abrasion characteristics of the refractory lining, under bottom blowing and combined blowing conditions.
In this paper, the influence of bottom blowing mode on the flow and mixing characteristics of molten bath and the abrasion characteristics of refractory lining was investigated using physical and numerical simulations together. Eight bottom blowing modes were designed (uniform, three-point linear co-direction, three-point linear unco-direction, two-point linear, circumferential linear, A-type, V-type, and triangle alternating). The effects of bottom blowing mode on the variation of the flow field and velocity field, velocity interval distribution, turbulent kinetic energy, tracer diffusion, mixing time, and wall shear stress were analyzed, which provides a theoretical basis for improving the dynamics condition of molten bath in an actual steelmaking converter.

2. Hydraulic Model

2.1. Experimental Principle

An industrial size converter of 100 tons was used as a prototype to design the hydraulic model. A geometric similarity ratio of 6:1 was chosen. Water and compressed air were selected to simulate the molten steel and bottom blowing inert gas, respectively. The modified Froude number (Fr’) was chosen to ensure that the hydrodynamics of the physical model were similar to that of the prototype.
F r m = F r p = ρ g u 2 g d ( ρ l ρ g )
Considering the length of the supersonic core region (Ls) and the distance from the hypothetical subsonic nozzle to the end of the supersonic core region (x), the oxygen lance height determined based on the geometric similarity was modified [35]. As shown in Equations (2) and (3), the corresponding correction term (Ls-x) was subtracted from the lance height of the model. The main geometrical parameters of the prototype and model involved in the experimental procedure, as well as the operational parameters, are shown in Table 1.
L s = 5.78 d t ( P 0 2 )
x = 6.39 u 0 d e c

2.2. Experimental Setup and Method

The schematic diagram of the experimental device for hydraulic simulation is shown in Figure 1a. Among them, the converter model was made of acrylic, and the Laval nozzle and the bottom components were precisely machined from brass. The arrangement of the bottom tuyere is consistent between the model and the prototype. Six bottom tuyeres are arranged on 0.35 D and 0.60 D (D is the diameter of the molten bath) in a rectangular axis-symmetrical manner. The specific arrangement is shown in Figure 1b.
Mixing time is an important and intuitive parameter to measure the degree of stirring and mixing of the molten bath, which can comprehensively reflect the uniformity of the molten steel composition and temperature as well as the chemical reaction rate, etc. When compressed air was blown into the molten bath for a period of time and the flow field reached a quasi-steady state, 30 mL of saturated KCl solution was then added to the molten bath through a tracer guide tube. The DJ 800 multifunctional detection system and DJS-1C platinum black conductivity electrode were used to monitor the change of the tracer inside the molten bath over time. As shown in Figure 1b, four conductivity electrodes are evenly arranged on the circumference of the furnace bottom with a PCD of 0.60, alternating with the bottom blowing tuyeres. When the conductivity of the monitoring point changes within ±1%, it can be approximated that the liquid phase has reached the full mixing state. The mixing time was taken as the average of four monitoring points; each group of experimental conditions was repeated four times, and the arithmetic average was taken as the final value.

2.3. Bottom Blowing Mode

A reasonable energy flow gradient is conducive to improving the overall mixing efficiency of the molten bath [33]. In this paper, fully considering the effect of each bottom gas flow rate combination on the overall mixing and fluid flow of the molten bath, eight bottom blowing mode cases were designed. The total flow rate was maintained at 1.44 m3·h−1 for each case. Among them, Case 1 is the uniform mode and the gas flow rate of each tuyere is equal, which is the most common in practical industrial production. Other non-uniform bottom blowing modes include two categories: continuous mode (Cases 2 to 5) and interval mode (Cases 6 to 8). Among them, there are different linear gradients in the bottom flow rates in the continuous mode. The bottom flow rates in the interval mode are interrupted or alternating. The specific types and parameters of the bottom blowing mode are shown in Table 2.

3. Numerical Model

The corresponding mathematical model was established based on the size of the physical model. The software ANSYS Fluent 2021 R1 was used for the calculation to study the influence of the bottom blowing mode on the flow and mixing characteristics of molten bath as well as the abrasion characteristics of refractory lining.

3.1. Modeling Assumptions

Due to the complexity of the converter steelmaking process, according to the experimental conditions of the water model, the following assumptions were used in order to simplify the model calculation:
(1)
Air is treated as a compressible Newtonian fluid, water is treated as an incompressible Newtonian fluid, and the other fluid physical parameters are constants.
(2)
The flow in the model is isothermal.
(3)
The model calculation is a three-dimensional, full-scale, transient process.

3.2. Governing Equations and Turbulent Model

The volume of fluid (VOF) model was used to solve the air–water two-phase fluid in the molten bath [30,31,36]. Moreover, the concept of phase volume fraction α is introduced, and the different phases are treated as immiscible fluids. The phase volume fraction is a continuous function of time and space. In each unit control body, the phases satisfy the following equation.
q = 1 n α q = 1
If the qth fluid’s volume fraction in the cell is denoted as αq, then the following three conditions are possible: (1) αq = 0, and the cell is empty of the qth fluid; (2) αq = 1, and the cell is full of the qth fluid; and (3) 0 < αq < 1, and the cell contains the interface between the fluid and one or more other fluids.
The physical properties of each fluid were calculated by the average phase volume. For instance, the density and viscosity of the fluid in each cell satisfy the following equations.
ρ = α g ρ g + α l ρ l
μ = α g μ g + α l μ l
In the VOF method, all variables were calculated based on Reynolds-averaged Navier–Stokes (RANS) equations. Among them, the continuity equation and the momentum conservation equation are as follows.
ρ t + ρ u = 0
t ρ u + ρ u u = P + τ = + ρ g + f σ
The solution of the tracer diffusion and mixing time was calculated through the species transport model [37].
t ( ρ Y ) + ρ u Y = J
The standard k-ε turbulent model was used to solve flow field of the molten bath. The turbulent kinetic energy k and the turbulent energy dissipation rate ε equations are as follows.
( ρ k ) t + ( ρ k u i ) x i = x j μ + μ t σ k k x j + G k + G b ρ ε Y M
( ρ ε ) t + ( ρ ε u i ) x i = x j μ + μ t σ ε ε x j + C 1 ε ε k ( G k + C 3 ε G b ) C 2 ε ρ ε 2 k
The turbulent viscosity μt can express the relationship between turbulent kinetic energy k and the turbulent energy dissipation rate ε, as shown in Equation (12)
μ t = ρ C μ k 2 ε

3.3. Solution Procedure

Figure 2 depicts the simplified schematic diagram of the full-scale converter model scaled down by one-sixth. In this study, to improve the calculation efficiency for the mixing time, Model A and Model B were developed. Firstly, the top blowing free jet was calculated using Model A, with a calculation time of approximately 3 s to make it reach a steady state. The cross-sectional interpolation of data including velocity, pressure, turbulent kinetic energy, and turbulent kinetic energy dissipation rate from Model A to the inlet of Model B was then carried out using the profile method [25,37], followed by a long-time transient calculation.
To ensure the accuracy of the numerical simulation results, the computational domains of Model A and Model B were all divided by hexahedral structured grids, with a quantity of about 300,000 and 500,000, respectively. Local mesh refinement processing was performed on the Laval nozzle, bottom tuyere, and the area near the gas–liquid interface. The top inlet of Model A and the bottom inlet of Model B both adopted the mass-flow-inlet boundary conditions. The top inlet of Model B adopted the velocity boundary condition, and the corresponding data were imported using the profile boundary condition. Furthermore, the outlets of Model A and Model B both adopted pressure boundary conditions. A standard wall function was selected to model the velocity near the wall and a no-slip wall condition was used at the wall [38]. The pressure–velocity coupling scheme was done with the pressure implicit with splitting of operators (PISO) scheme. The interpolation of the pressure values was achieved with the pressure staggering option (PRESTO!) algorithm. The compressive interface-capturing scheme for arbitrary meshes (CICSAM) was adopted to track the free interface. A second-order upwind scheme was used to discretize the transport equations. The initial calculation time step size of Model B was 1 × 10⁻⁵ s. Thereafter, an adaptive time step method based on the global Courant number of 1 was chosen. The convergence criterion was that the variables residuals were less than 1 × 10⁻³. When the flow field of the molten bath reached a quasi-steady state (the calculation time is about 20 s), the tracer was added and calculated by the species transport model. Four monitoring points were defined at the same locations as the conductivity electrode of the water model to track the changes of the tracer concentration.

4. Results and Discussion

4.1. Model Validation

The top blowing jet plays an important role in the impact cavity and the stirring of the molten bath. Since the inlet of Model B adopted the profile method, it is necessary to validate its accuracy. Among them, dynamic pressure is a key parameter to characterize the impact capability of the top blowing jet [39]. It can be seen from Figure 3a that when the model lance height is 120 mm, the dynamic pressures of Model A and Model B at the gas–liquid interface are in reasonably good agreement, indicating that this method can accurately transfer the data extracted from Model A to Model B. As can be seen from Figure 3b, the tracer curve profiles obtained from the numerical simulation and hydraulic experiment for Case 1 under the bottom blowing condition are basically the same. Moreover, the validity of Model B was verified by comparing the mixing times under different blowing conditions for Case 1. As can be seen from Figure 3c, the mixing times of the hydraulic experiment and numerical simulation were 48.2 s and 55.0 s under the bottom blowing condition, respectively, with an error of 12.3%, and 45.2 s and 50.5 s under the combined blowing condition, respectively, with an error of 10.4%. In general, the mathematical model established in this paper is effective within the allowable range of error.

4.2. Comparison of Flow Field between Bottom blowing and Combined Blowing Conditions

Figure 4 shows the flow field of the longitudinal section of the molten bath under the bottom blowing and combined blowing conditions for Case 1. As can be seen from Figure 4a, the bottom blowing gas enters the molten bath and forms a length of rising inverted conical plume under the combined actions of inertial force, buoyancy, gravity, and resistance. The kinetic energy exchange between the gas and liquid phases takes place around the plume zones. Driven by the high-speed bottom blowing airflows, the surrounding molten steel moves to the plume zones and forms circulation loops. The white line marked with 0.5 in the figure is the gas-liquid interface with a liquid phase volume fraction of 0.5. When the high-speed bottom blowing airflows reach the gas–liquid interface, the liquid surface will be penetrated to form spout eyes. The top layer of molten steel flows around the spout eyes, forming a radial flow trend, which strengthens the circulation effect. Two fully developed main circulation loops are formed on both sides of the longitudinal section, and two underdeveloped secondary circulation loops are formed in the middle of the two plume zones. Moreover, the position of the vortex is marked with a cross cursor. The velocity is relatively lower in the vortex area, near the wall surface, and at the center bottom of the molten bath. In particular, the center bottom region is large and the velocity is relatively small; it is easy to form a large area of the dead zone. The cause of the above situations may be that the collision induced by the two equivalent circulation loops in the middle, as well as excessive stirring energy, is dissipated. Therefore, the overall mixing of the molten bath can be improved by changing the size of the circulation loops or enhancing the horizontal flow, etc.
It can be seen from Figure 4b that the flow field of the molten bath under the combined blowing condition is significantly different from that under the bottom blowing condition. Among them, under the action of the top blowing jet, an impact cavity will be formed on the liquid surface, and the cavities are relatively scattered under this simulation condition [40]. Due to the suction of the impact cavity, the bottom blowing stream will slightly deflect to the middle, and the liquid phase flows upward along the bottom of the cavity and then flows toward the wall surface, further enhancing the flow of the molten bath. The existence of the impact cavity makes the flow field on the surface of the molten bath form a flow trend centered on the cavity, which is obviously different from the flow field under the bottom blowing condition. In addition, due to the interaction of the top blowing jet and bottom blowing stream, the velocity of the combined blowing molten bath is considerably increased compared to that of the bottom blowing condition, and the position of the vortex is also changed. The position of the vortex on both sides moves up, and the position of the center vortex moves down, which will affect the fluctuation of the liquid level and the oscillation of the molten bath The above research shows that there are significant differences in the flow field and mixing characteristics of the molten bath under the bottom blowing and combined blowing conditions. Therefore, it is necessary to systematically study the influence of the bottom blowing mode on fluid flow and mixing characteristics under different blowing conditions.

4.3. Flow Characteristics of Molten Bath

The bottom blowing mode has a significant impact on the global fluid flow of the molten bath, which in turn determines the overall dynamics of the molten bath. Given the complexity of the turbulent flow field of the combined blowing molten bath, in order to clearly observe the influence of the bottom blowing mode on the change of the molten bath flow field, the bottom blowing working condition was selected for analysis in this section.
Figure 5 depicts the velocity contours and velocity fields (20 s) that were used to explain the flow field characteristics at a vessel cross-section height of Y = 0.2 m among the eight cases. Case 1 is a uniform mode. The gas flow rates of the six bottom tuyeres are kept equal, and the total energy is equally divided by the bottom streams. Each stream is independently distributed at the bottom of the molten bath, and the molten bath is divided into six virtual stirring sub-zones simultaneously. Furthermore, similar circulation loops are produced by the same streams, and collision between the same circulation loops can cause strong energy attenuation and dissipation [29]. The mixing effect of each stirring sub-zone is good due to the presence of the high-speed bottom blowing airflow, while the mixing between the stirring sub-zones mainly depends on the vortex flow at the virtual cell interface, which is a key factor in determining the overall mixing effect of the molten bath. Therefore, seven non-uniform bottom blowing modes were designed to induce different flow energy gradients in the molten bath, which helps to change the fluid flow, enhance the horizontal flow trend, and thus promote mixing and mass transfer efficiency between the stirring sub-zones. It can be seen from Figure 5 that the bottom blowing mode mainly affects the fluid flow in the inner ring area of the six bottom tuyeres. As the area where the stirring sub-zones intersect each other, the change of the flow field in this part is of great significance to the improvement of the overall dynamic conditions of the molten bath. In the three-point linear co-direction mode (Case 2), the flow energy on the left side of the molten bath was remarkably higher than that on the right side, and the flow field formed a long obvious horizontal flow along the X-axis direction. In Case 3, the three-point linear unco-direction mode produced a diagonal energy gradient in the molten bath. The flow field formed two sections of horizontal flow from the high-energy area to the low-energy area along the X-axis direction. In Case 4, a significant energy difference along the Z-axis was created by the two-point linear mode, which strengthens the fluid flow trend of the molten bath along the Z-axis direction. However, due to the short distance between the bottom blowing tuyeres on both sides of the Z = 0 axis, the collision and energy dissipation between the streams are enhanced to a certain extent. In Case 5, the circumferential linear mode made the molten bath form a certain degree of flow energy gradient in both the X-axis and Z-axis directions, thereby strengthening the flow tendency of the fluid in the radial direction. The A-type flow gradient in Case 6 caused the molten bath to form a state of medium-high energy and left-right low energy. The flow field of the molten bath formed two strong horizontal flows from the center to both sides along the X-axis direction. Contrary to Case 6, Case 7 is a V-type mode, where the flow energy on both sides of the molten bath is significantly higher than that in the middle, thus creating a flow trend from the periphery to the center. Theoretically, this flow field is not conducive to promoting the overall mixing of the molten bath. Similar to Case 5, in Case 8, the energy gradients of different degrees were formed in the X-axis and Z-axis directions. However, the energy gradients of this mode are interlaced, and the difference between the primary and secondary streams is obvious.
To further quantify the effect of the bottom blowing mode on the flow characteristics of the molten bath, statistics and analysis were carried out on the volume fraction of the liquid phase velocity interval distribution of the molten bath under different bottom blowing modes. As can be seen from Figure 6, the liquid phase volume with a velocity less than 0.02 m·s−1 is defined as the dead zone. The liquid phase volume with a velocity in the range 0.02–0.05 m·s−1 is defined as the weak flow zone. The average velocity of the liquid phase in the molten bath for the eight cases is close to 0.05 m·s−1. Therefore, the liquid phase volume with a velocity higher than 0.05 m·s−1 is defined as the active flow zone.
As can be seen from Table 3, the bottom blowing mode has a significant effect on the molten steel velocity interval distribution ratio, the average velocity, and the average turbulent kinetic energy. The fluidity of the dead zone is weak. Therefore, the reduction of the dead zone volume is beneficial to enhancing the homogenization of the molten steel temperature and composition. The increase in the average velocity is conducive to the improvement of the overall kinetic energy of the molten bath. In addition, the higher average turbulent kinetic energy helps the interaction between the stirring sub-zone interfaces, thereby improving the overall mixing efficiency of the molten bath. The analysis revealed that the proportion of the active flow zone is mainly determined by the bottom gas flow rate of each branch. For example, the proportions of the active flow zone in Case 2 and Case 3 are 40.22% and 40.44%, respectively, which are very close. Furthermore, the proportions of the active flow zone in Case 4 and Case 8 are 37.25% and 37.44%, respectively, showing similar patterns. Among them, the dynamic characteristics of the molten bath in Case 2 are the best. Compared with the uniform mode (Case 1), the dead zone ratio is reduced from 11.63% to 7.42%, which is a reduction of 36.20%. The average velocity increased from 0.04758 m·s−1 to 0.05013 m·s−1, an increase of 5.36%. The average turbulent kinetic energy increased by 12.50% from 0.00152 m2·s−2 to 0.00171 m2·s−2. The reason may be that the primary and secondary stirring regions are created by the three-point linear co-direction mode (Case 2), breaking the transmission barrier between the stirring sub-zones. In addition, a part of the dead zone is transformed into weak flow zones, which is also conducive to the formation of a fully developed overall flow field in the molten bath. However, not all non-uniform bottom blowing modes are beneficial to improving the dynamics of the molten bath. In Cases 4, 7, and 8, the dead zone ratios increased, and the average velocity and average turbulent kinetic energy decreased, all of which are caused by the bottom blowing modes themselves. The above analysis shows that only a reasonable flow energy gradient can promote the formation of the global flow field of the molten bath. Otherwise, it may cause weaker local flow and affect the overall mixing effect of the molten bath. According to Table 3, the order of the dynamic characteristics of the molten bath of each case, from strong to weak, is as follows: Case 2 > Case 6 > Case 5 > Case 3 > Case 1 > Case 8 > Case 4 > Case 7.

4.4. Mixing Characteristics of Molten Bath

Good mixing characteristics of molten bath have an important effect on the homogenization of molten steel composition and temperature, the equilibrium state of carbon–oxygen reactions, the dephosphorization efficiency, the degree of peroxidation, and the cleanliness of molten steel. Based on this, this paper carried out a three-dimensional full-scale transient mixing time simulation and studied the influence of the bottom blowing mode on the liquid phase mixing characteristics.
Figure 7 depicts the tracer concentration distribution at different times (10 s, 20 s, 30 s, 40 s, 50 s) for two different height cross-sections (Y = 0.05 m, Y = 0.2 m) under the bottom blowing condition. The red, orange, yellow, green, and blue colors in the figure represent descending concentration levels. At 10 s, the tracer of each scheme was mainly distributed on the left side of the molten bath and showed a small difference in diffusion. Compared with the liquid surface, the tracer at the bottom of the molten bath diffused slowly, indicating that the flow velocity and turbulent diffusion at the bottom are relatively slow, which is not conducive to rapid mass transfer. At 20 s, the tracer had spread to the central part of the molten bath. In the three-point linear co-direction mode (Case 2), the red concentration distribution had occupied two-thirds of the molten bath, and the overall diffusion rate was significantly higher than in other cases. In addition, through the concentration distribution of the tracer in the X-axis and Z-axis directions, it can be concluded that the distribution of the tracer in Cases 3, 4, 5, and 8 was poorly symmetric along the X-axis. The above phenomenon shows that these four modes cause the molten bath to form different radial flow energy gradients, which in turn changes the diffusion path and distribution of the tracer. At 30 s, except for Case 7, the blue concentration distribution had disappeared, and the tracer had basically diffused to all parts of the molten bath. Compared with the uniform mode (Case 1), the diffusion rates of the tracer along the X-axis in Cases 2, 3, 5, and 6 were obviously enhanced, which promotes the overall mixing efficiency of the molten bath. There is no significant change in the diffusion of the tracer along the X-axis in Case 4 and Case 8, which is similar to Case 1. At 40 s, Case 2 and Case 6 had basically reached a complete mixing state, and there were only partial unmixing areas. The unmixing areas in Case 3 and Case 5 were distributed on the negative semi-axis of the Z-axis and the positive semi-axis of the X-axis, respectively, which is significantly different from the uniform mode. The main reason is that the overall turbulent diffusion trend and flow field direction of the molten bath under these two cases have changed, which in turn affects the diffusion path of the tracer. In the 40 to 50 s time period, the presence of a smaller liquid phase velocity and a larger dead zone may cause the tail of the tracer curve at the monitoring point to be elongated, which is very unfavorable for the complete mixing of the final stage of the molten bath. It can be seen that Case 2 and Case 6 were already in a complete mixing state, while Case 7 had a large unmixing region. This corresponds well to the velocity interval distribution of the molten bath in Section 4.3.
Further, to quantify the influence of the bottom blowing mode on the mixing characteristics of the liquid phase, the mixing times of eight cases under the bottom blowing and combined blowing conditions were compared. It can be seen from Figure 8a that under bottom blowing conditions, the mixing times arranged in order of cases from low to high are in the following sequence: Case 2 < Case 6 < Case 5 < Case 3 < Case 1 < Case 8 < Case 4 < Case 7. Taking the hydraulic experiment results as an example for analysis, the mixing time of Case 2 is the shortest at 39.1 s; compared with the mixing time of 48.2 s in the uniform mode (Case 1), the mixing efficiency is increased by 18.88%. The main reason is that the three-point linear co-direction mode (Case 2) creates a significant flow energy gradient along the X-axis of the molten bath, which promotes the flow trend of the fluid along the X-axis. This not only facilitates the interaction between the stirring sub-zones but also helps to reduce the dead zone volume, increasing the average flow velocity and turbulent energy of the molten bath, which in turn improves the overall kinetic characteristics of the molten bath. The mixing time of Case 7 is the longest at 62.3 s, and the mixing efficiency is reduced by 29.25%. The main reason is that the V-type mode (Case 7) causes the molten bath to form low energy in the middle and high energy on both sides, and the fluid forms a flow trend along the periphery to the center. However, the circulation loops in the middle of the molten bath are not fully developed, which not only leads to an increase in the volume of the dead zone but also deteriorates the overall dynamics of the molten bath.
It can be seen from Figure 8b that under combined blowing conditions, the mixing times arranged in order of cases from low to high are in the following sequence: Case 6 < Case 3 < Case 2 < Case 5 < Case 8 < Case 1 < Case 4 < Case 7. the mixing time of Case 6 is the shortest at 31.5 s; compared with the mixing time of 45.2 s in the uniform mode (Case 1), the mixing efficiency is increased by 30.31%. The main reason is that the existence of the top blowing jet causes the molten bath to form a flow field that flows around the impact cavity as the center, and the A-type mode (Case 6) forms a high energy gradient in the middle and low on both sides, further strengthening the flow trend of the fluid from the middle to the periphery. The top blowing jet and the bottom blowing stream cooperate with each other, and the energies are superimposed onto each other, which reduces the energy collision loss, thereby helping to improve the overall mixing efficiency of the molten bath. The mixing time of Case 7 is the longest of 58.7 s, and the mixing efficiency is reduced by 29.87%. The main reason is that the flow trend formed by the V-type mode (Case 7) is opposite to that generated by the top blowing jet, resulting in mutual energy suppression, which not only reduces the energy utilization rate but also causes more splashing. It is not conducive to the efficient mixing of the molten bath.
The mixing times of the numerical simulation are higher than those of the hydraulic experiment under the same working conditions. The reasons for the above situation may be: (1) The addition of the tracer in the numerical simulation was through the patch method, and the initial state velocity of the tracer was 0. However, the tracer entered the molten bath under the action of gravity through the guide tube in the water model, and there was a certain initial velocity, which helps the tracer to diffuse; (2) to get a quasi-steady state flow field in the water model, a blowing process was performed for 3 min before the tracer was added into the molten bath. However, considering the cost of numerical simulation calculation time, only 20 s of injection was performed before the species transport model was started; and (3) it may be caused by the limitations of the standard k-ε turbulent model itself. Moreover, the error range of hydraulic experiment and numerical simulation results is 8.8–14.2% under the bottom blowing condition, and the error range is 6.3–11.9% under the combined blowing condition. The error in mixing time becomes smaller. The reason may be that the top blowing jet impact produces a strong splashing effect, and the droplets mixed with the tracer will be ejected from the outlet of the calculation domain, which will promote the mixing of the tracer and make the mixing time closer to the experiment result to a certain extent.
In addition, it can be seen from Figure 9 that compared with the traditional uniform mode (Case 1), under the bottom blowing condition, the continuous mode (Cases 2 to 5) is beneficial to reducing the mixing time of the molten bath, while the interval mode (Cases 6 to 8) is not conducive to reducing the mixing time. Under the combined blowing condition, both the continuous and interval modes are beneficial to improving the mixing efficiency of the molten bath, but the effect of the continuous mode is better than that of the interval mode. In general, the continuous mode is better than the interval mode and the uniform mode. Furthermore, compared with the bottom blowing condition, the non-uniform mode under the combined blowing condition is more conducive to improving the mixing efficiency of the molten bath to a certain extent.

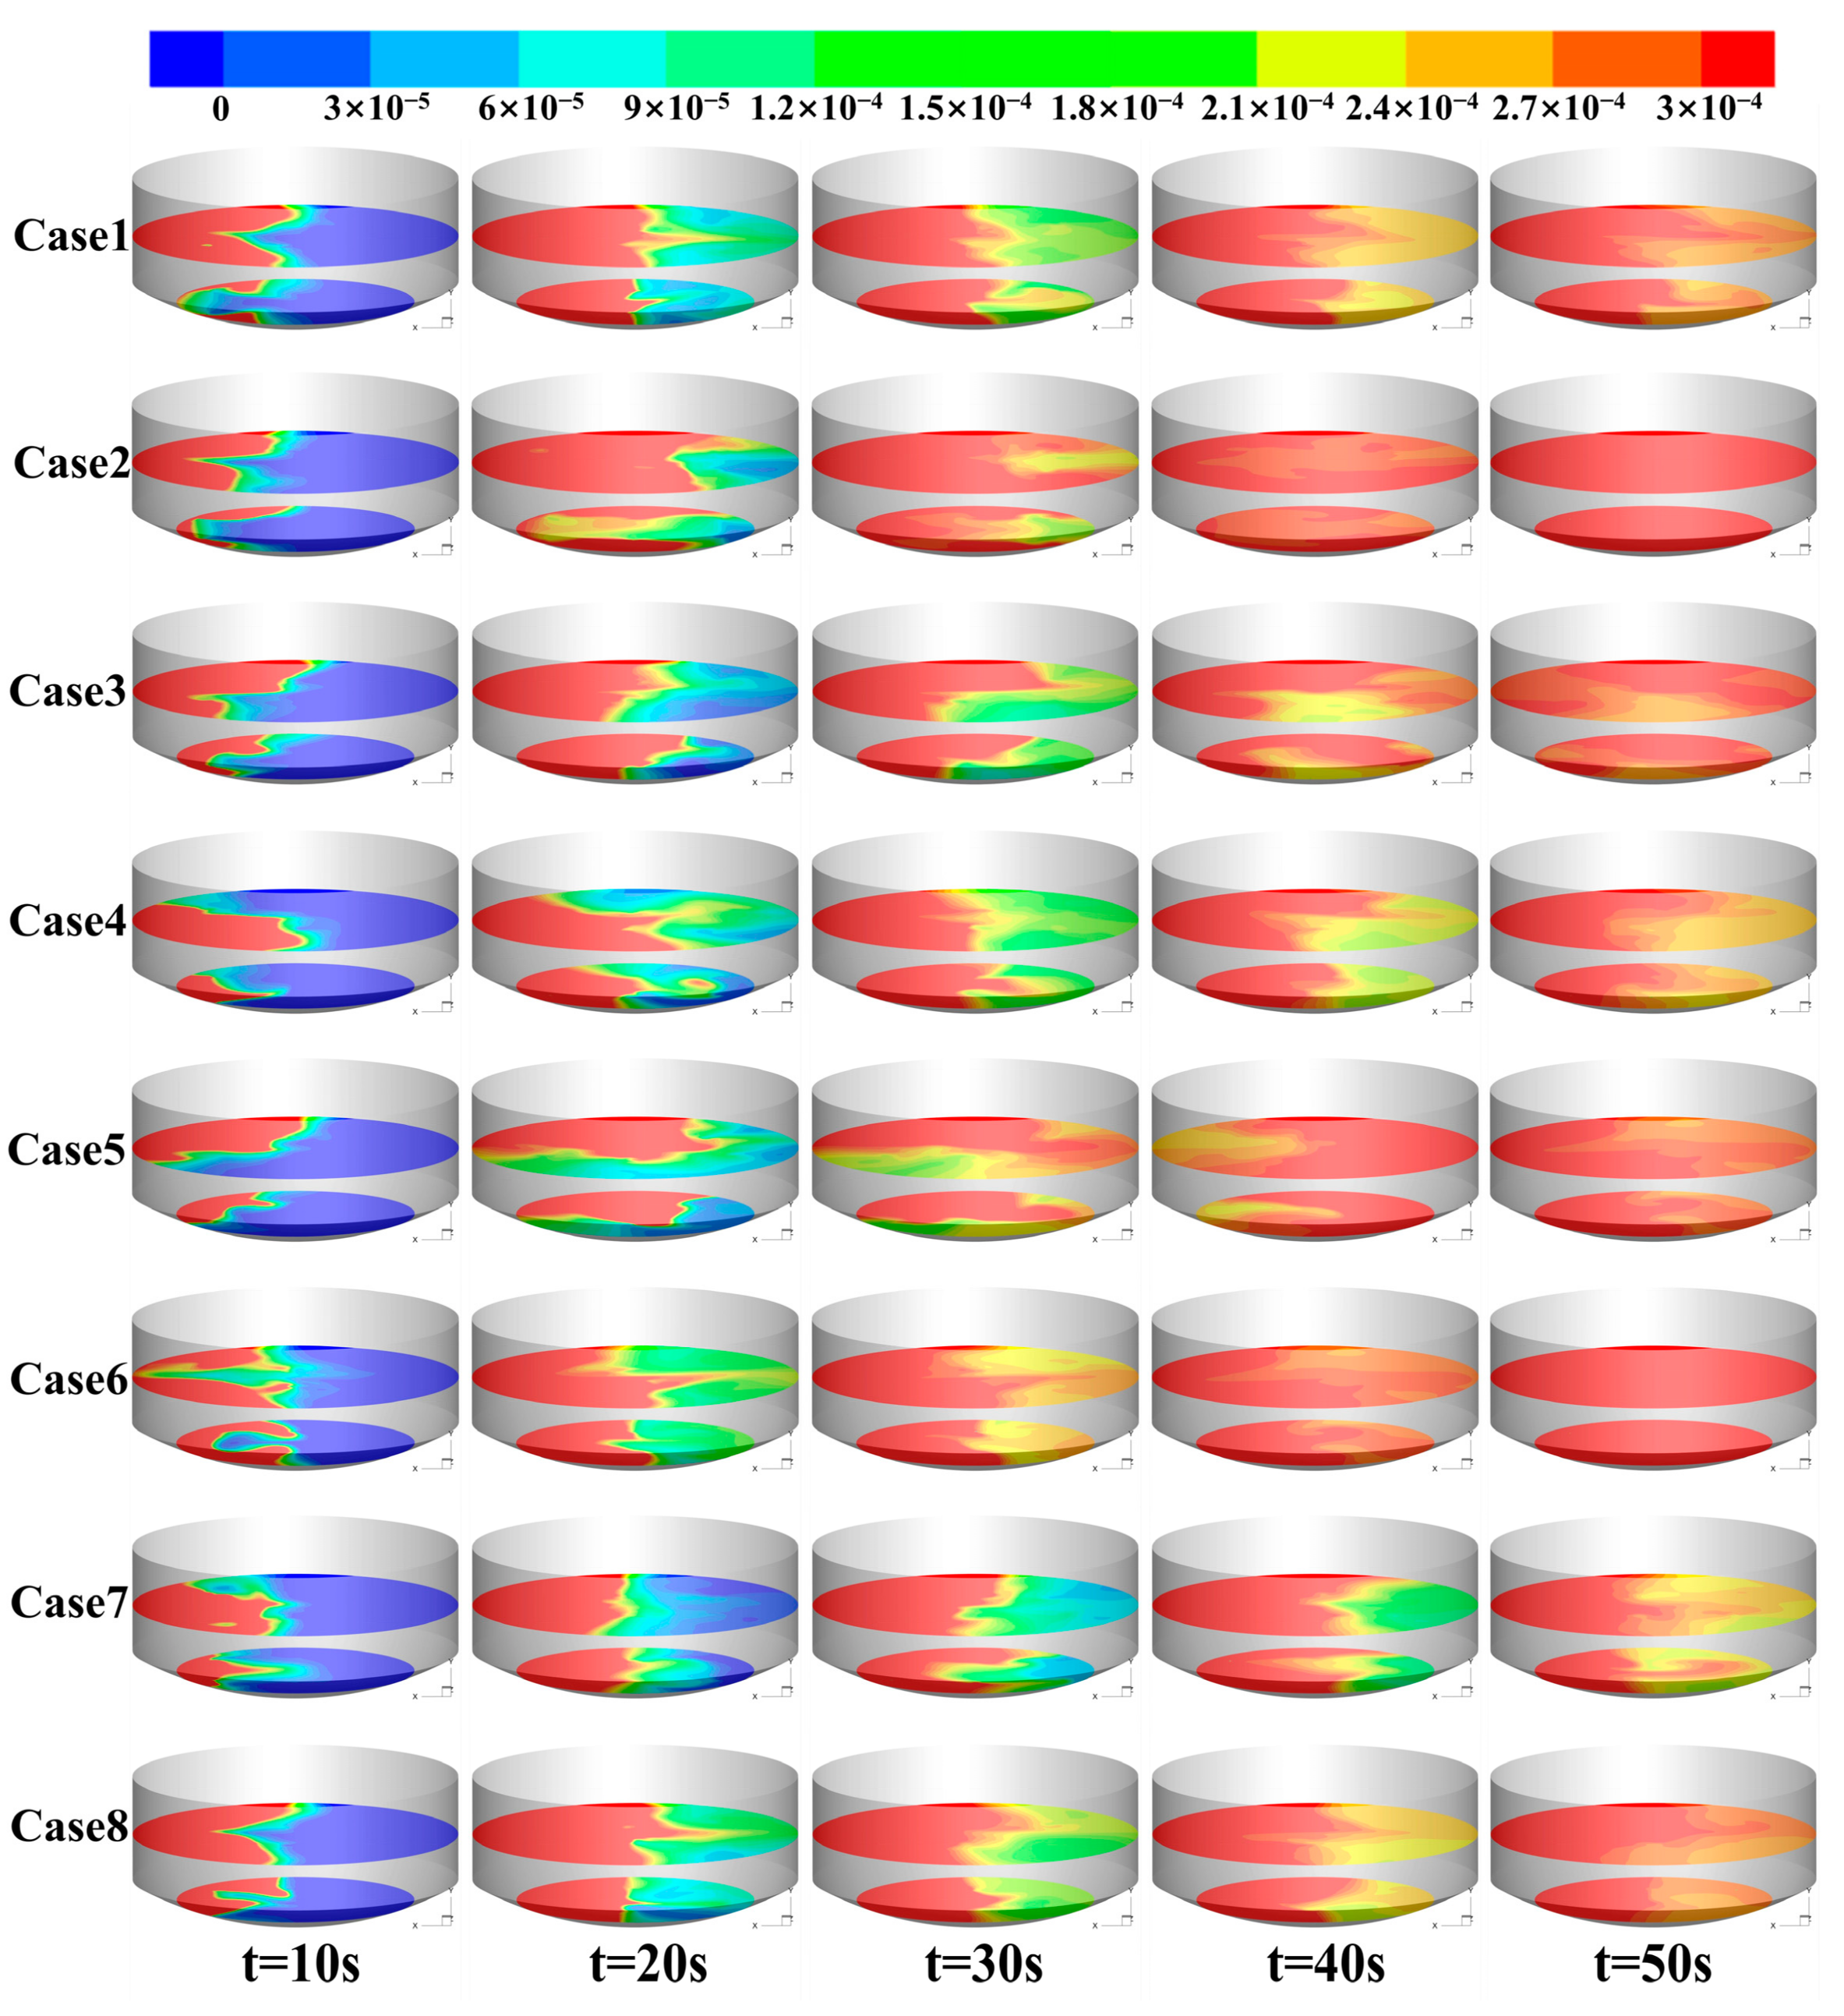
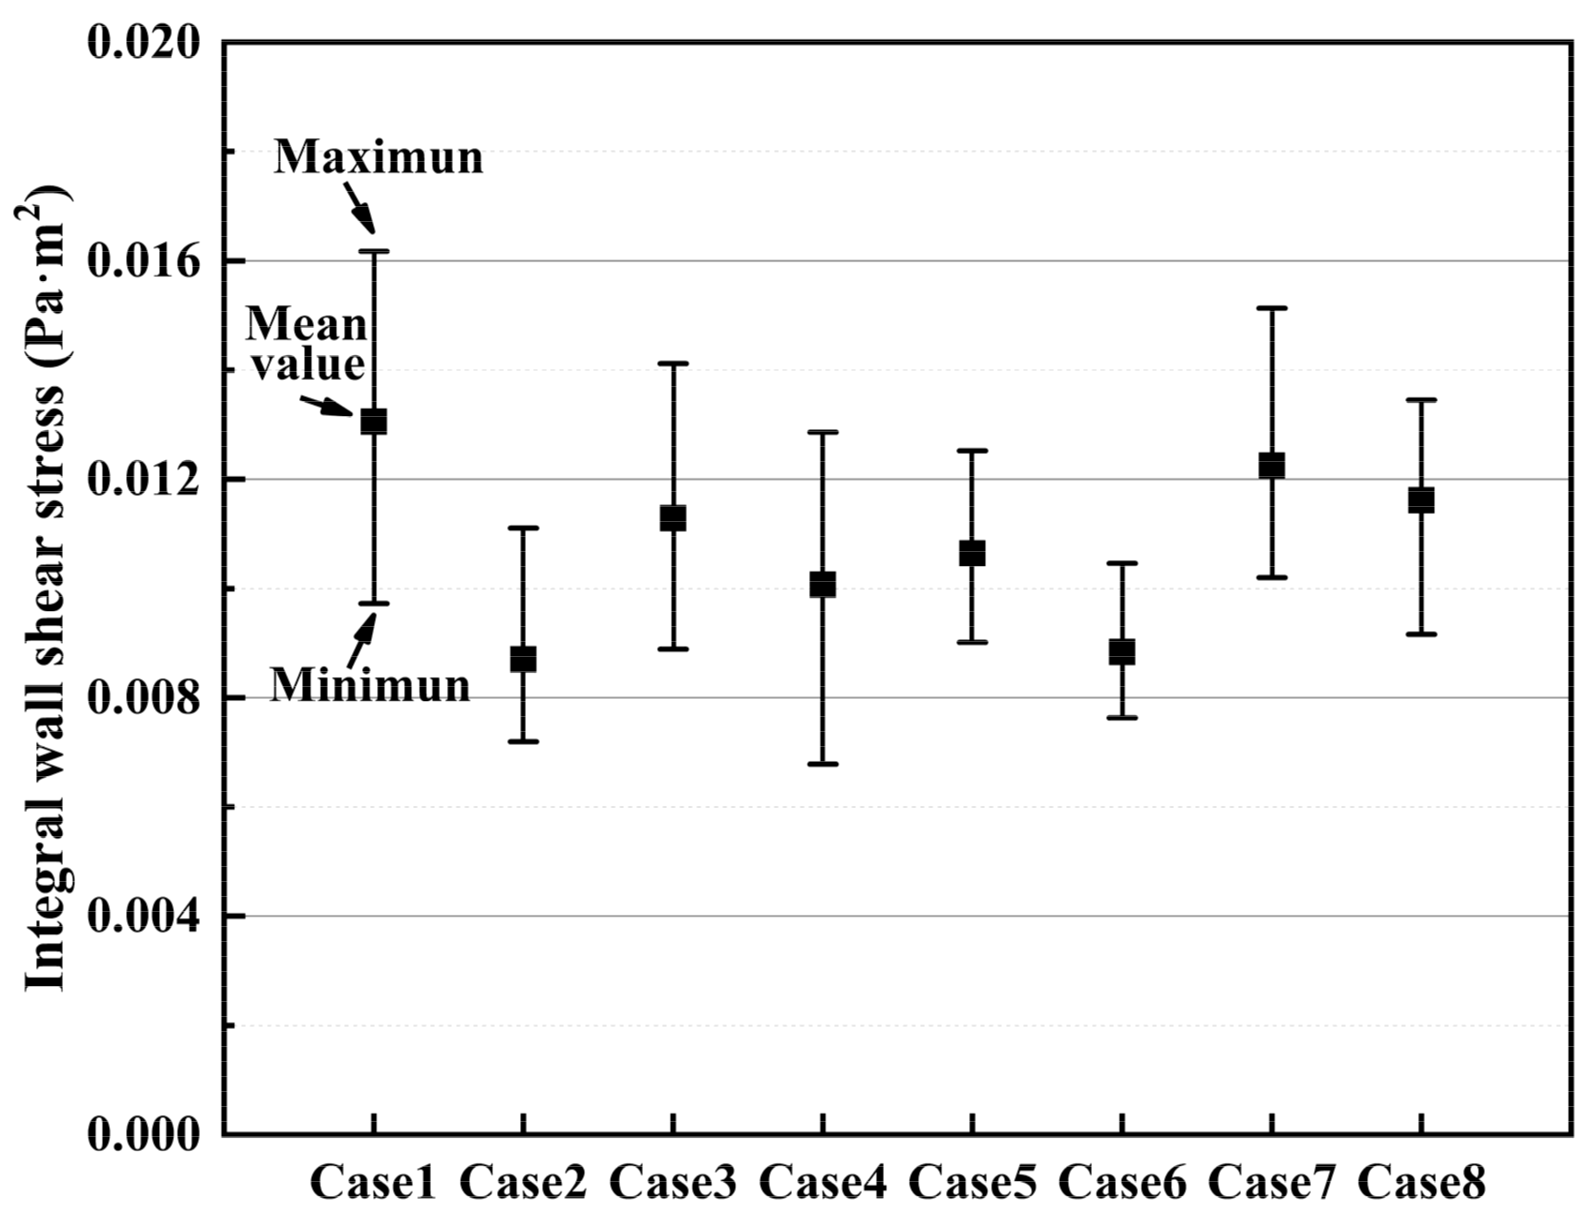
4.5. Abrasion Characteristics of Refractory Lining

The erosion of refractory lining is very important to the operational stability and service life of the converter during the steelmaking process. The non-uniform bottom blowing mode can change the flow field and turbulent kinetic energy distribution of the molten bath, which in turn affects the erosion of the refractory lining by the high-temperature melts [41]. In this paper, the influence of the bottom blowing mode on the mechanical abrasion of the refractory lining was systematically studied by analyzing the distribution of wall shear stress, which provides a theoretical basis for selecting the bottom blowing mode under actual production.
It can be seen from Figure 10 that the abrasion of the refractory lining of the furnace mainly occurs near the gas–liquid interface, which is caused by the energetic melts periodically wiped up and down along the wall furnace due to the oscillation of the molten bath during the blowing process. Among them, the bottom blowing mode has an important influence on the abrasion degree and position of the refractory lining. The distribution of the wall surface erosion can be clearly observed through the wall shear stress contour. Taking Cases 1, 2, and 3 as examples, the wall surface abrasion of the uniform mode (Case 1) is uniformly distributed, and there are mainly four severe local erosion zones, which are the wall surfaces near the four tuyeres on 0.60 D. In addition, since the two tuyeres on 0.35 D are far away from the furnace wall, the erosion effect of the bottom streams on the refractory lining is relatively weak. The three-point linear co-direction mode (Case 2) mainly has one severe local erosion zone, which is the wall surface near the #3 and #4 tuyeres. Due to the increased flow rates of the #3 and #4 tuyeres and their close distance, the two erosion zones unite almost into one. The three-point linear unco-direction mode (Case 3) mainly has two severe local erosion zones, which are the wall surfaces near #3 and #6 tuyeres. In addition, other cases also show different degrees of erosion characteristics. It can be found that the abrasion position of the wall surface is closely related to the tuyere position, and the tuyere closer to the wall will cause a more severe abrasion effect. Furthermore, with an increase in the bottom blowing flow rate, the local abrasion of the wall surface near the tuyere will be further intensified.
To further quantify the effect of the bottom blowing mode on the abrasion of the furnace wall, the blowing period of 20 to 90 s was selected, and the wall shear stress was integrated with a 2 s interval to characterize the abrasion of the whole wall surface, which can be expressed as:
τ d A = i = 1 n τ i A i
Figure 11 depicts the distribution of the minimum, maximum, and average values of the integral wall shear stress for each case. It can be found that the bottom blowing mode has a significant effect on the shear stress of the whole wall surface. Compared with the uniform mode, the total wall shear stress of the non-uniform mode is reduced to a certain extent. The reason may be that the non-uniform mode causes the molten bath to produce obvious primary and secondary plume zones. Although the high flow rate plume enhances the wall abrasion characteristics, the non-uniform bottom blowing mode reduces the energy collision and dissipation between the streams and between the streams and the wall surface. Therefore, the total wall shear stress of the non-uniform mode shows a weakening trend. Among them, the A-type mode (Case 6) has the smallest average value and fluctuation, and the degree of total wall surface abrasion is reduced by 30.0% compared with the uniform mode, which is very beneficial for reducing the consumption of refractories. However, it should be noted that the uneven wall surface abrasion will be caused by the non-uniform blowing mode. Therefore, when the non-uniform blowing mode is adopted in actual production, on the one hand, it is necessary to focus on the maintenance of the local abrasion zones. On the other hand, the tuyeres with higher and lower gas flow rates are interchanged after every heat to reduce any preferential abrasion of the wall surface refractory. The above measures can avoid the shape change of the converter lining over a long period, which in turn affects the flow and mixing characteristics of the molten bath.
Through the above comprehensive analysis, it is of great significance to choose suitable bottom blowing modes to improve the dynamic characteristics of the molten bath. Among them, the A-type bottom blowing mode (Case 6) can be used in the combined blowing stage, and the three-point linear co-direction mode (Case 2) can be used in the post-mixing stage during the actual converter steelmaking process. The two modes cooperate with each other to maintain the best reaction kinetics conditions for the entire blowing process. On the one hand, it can improve production quality and smelting efficiency. On the other hand, it can also reduce the consumption of refractory materials and production costs.

5. Conclusions

In this paper, a hydraulic experiment and a numerical simulation were carried out to study the effects of bottom blowing mode on the flow and mixing characteristics of molten bath, as well as the abrasion characteristics of refractory lining in a 100-ton converter. The following conclusions have been drawn.
(1) The flow field of the combined blowing converter is significantly different from that of the bottom blowing converter. The existence of the scattered impact cavities not only have a certain suction effect on the bottom plumes but also form a fluid flow trend centered on the cavities, which changes the vortex position of the circulation loop and the volume of the dead zone in the molten bath.
(2) The bottom blowing mode mainly affects the local flow field at the location of the inner ring of the bottom tuyeres. Under the bottom blowing condition, the hydrodynamic characteristics of the three-point linear co-direction mode (Case 2) are the best, which creates a strong overall flow trend along the X-axis and promotes interaction between the stirring sub-zones, with the smallest molten steel dead zone volume and the highest average velocity and turbulent kinetic energy.
(3) The bottom blowing mode changes the diffusion path and rate of the tracer. Under the bottom blowing and combined blowing conditions, the three-point linear co-direction mode (Case 2) and the A-type mode (Case 6) show the best mixing efficiency. Compared with the uniform mode (Case 1), the mixing time is reduced by 18.88% and 30.31%, respectively. Moreover, the mixing efficiency of the continuous mode is better than that of the interval mode and the uniform mode.
(4) The bottom blowing mode has a significant impact on the abrasion degree and position of the wall furnace. The total wall shear stress of the non-uniform mode is reduced to a certain extent. Among them, the average value and fluctuation of the integral wall shear stress of the A-type mode (Case 6) are the smallest, and the abrasion of the whole surface wall is reduced by 30.00% compared with the uniform mode (Case 1).

Author Contributions

Conceptualization, J.S. and W.L.; methodology, J.Z.; software, J.S.; validation, J.S., X.F. and Q.L.; formal analysis, J.Z.; investigation, J.S.; resources, Q.L.; data curation, J.S.; writing—original draft preparation, J.S. and J.Z.; writing—review and editing, J.S. and Q.L.; visualization, J.S. and W.L.; supervision, Q.L.; project administration, X.F. and Q.L.; funding acquisition, Q.L. All authors have read and agreed to the published version of the manuscript.

Funding

This work was financially supported by the National Natural Science Foundation of China (grant no. 51974023) and the Jiangxi Provincial Department of Science and Technology (grant no. 20171ACE50020).

Institutional Review Board Statement

Not applicable.

Informed Consent Statement

Not applicable.

Data Availability Statement

Data sharing is not applicable.

Conflicts of Interest

The authors declare no conflict of interest.

Nomenclature

SymbolDescription
Frm, FrpModified Froude number of model and prototype
uVelocity of gas, m·s−1
gGravitational acceleration, m·s−2
dGeometric feature size, m
dtThroat diameter of the Laval nozzle, mm
deOutlet diameter of the Laval nozzle, mm
P0Stagnation pressure of the Laval nozzle, atm
u0Outlet velocity of the Laval nozzle, m·s−1
cVelocity of sound, m·s−1
u Velocity vector of the fluid
PStatic pressure of the fluid, MPa
fσSurface tension of the fluid, N·m−3
YMass fraction of the species
JDiffusion flux of the species
KTurbulent kinetic energy, m2·s−2
GkTurbulent kinetic energy generated by the average velocity gradient, kg·m−1·s−3
GbTurbulent kinetic energy generated by the buoyancy, kg·m−1·s−3
YMTurbulent dissipation rate generated by compressible turbulent pulsation, kg·m−1·s−3
C3ε, σk, σε and CμEmpirical constants [42], and their respective values are 1.44, 1.92, 0.8, 1.0, 1.3, and 0.09
AArea of the wall surface, m2
Greek symbols
ρg, ρlDensities of gas and liquid, kg·m−3
μDynamic viscosity of the fluid, Pa·s
αPhase volume fraction
τ = Viscous stress term of the fluid
εTurbulent energy dissipation rate, m2·s−3
τShear stress, Pa
Subscripts
g, lGas and liquid phases

References

  1. Cao, L.L.; Wang, Y.N.; Liu, Q.; Feng, X.M. Physical and mathematical modeling of multiphase flows in a converter. ISIJ Int. 2018, 58, 573–584. [Google Scholar] [CrossRef] [Green Version]
  2. Cao, L.L.; Liu, Q.; Sun, J.K.; Lin, W.H.; Feng, X.M. Effect of Slag Layer on the Multiphase Interaction in a Converter. JOM 2019, 71, 754–763. [Google Scholar] [CrossRef]
  3. Dogan, N.; Brooks, G.A.; Rhamdhani, M.A. Comprehensive model of oxygen steelmaking part 1: Model development and validation. ISIJ Int. 2011, 51, 1086–1092. [Google Scholar] [CrossRef] [Green Version]
  4. Li, G.H.; Wang, B.; Liu, Q.; Tian, X.Z.; Zhu, R.; Hu, L.N.; Cheng, G.G. A process model for BOF process based on bath mixing degree. Int. J. Miner. Metall. Mater. 2010, 17, 715–722. [Google Scholar] [CrossRef]
  5. Roth, C.; Peter, M.; Schindler, M.; Koch, K. Cold model investigations into the effects of bottom blowing in metallurgical reactors. Steel Res. 1995, 66, 325–330. [Google Scholar] [CrossRef]
  6. Stišovic, T.; Koch, K. Bottom blowing investigations on a cold model reactor to optimise mixing behaviour in metallurgical processes. Steel Res. 2002, 73, 373–377. [Google Scholar] [CrossRef]
  7. Li, Y.; Lou, W.T.; Zhu, M.Y. Numerical simulation of gas and liquid flow in steelmaking converter with top and bottom combined blowing. Ironmak. Steelmak. 2013, 40, 505–514. [Google Scholar] [CrossRef]
  8. Singh, V.; Kumar, J.; Bhanu, C.; Ajmani, S.K.; Dash, S.K. Optimisation of the bottom tuyeres configuration for the BOF vessel using physical and mathematical modelling. ISIJ Int. 2007, 47, 1605–1612. [Google Scholar] [CrossRef] [Green Version]
  9. Smirnov, A.N.; Sharandin, K.N.; Lebedev, E.N. Physical simulation of metal mixing in a converter with hybrid injection. Steel Transl. 2010, 40, 796–799. [Google Scholar] [CrossRef]
  10. Yang, L.B.; Liu, L.; Jiao, X.L.; Tong, P.Q. Study and application of bottom blowing technique of combined blowing converter. J. Iron Steel Res. Int. 2014, 21, 41–45. [Google Scholar] [CrossRef]
  11. Wu, W.J.; Yu, H.X.; Wang, X.H.; Li, H.B.; Liu, K. Optimization on bottom blowing system of a 210 t converter. J. Iron Steel Res. Int. 2015, 22, 80–86. [Google Scholar] [CrossRef]
  12. Quiyoom, A.; Ajmani, S.K.; Buwa, V.V. Optimization of bottom tuyere configuration for Basic Oxygen Furnace steelmaking through experiments and CFD simulations. Chem. Eng. J. 2018, 346, 127–142. [Google Scholar] [CrossRef]
  13. Choudhary, S.K.; Ajmani, S.K. Evaluation of bottom stirring system in BOF steelmaking vessel using cold model study and thermodynamic analysis. ISIJ Int. 2006, 46, 1171–1176. [Google Scholar] [CrossRef] [Green Version]
  14. Lai, Z.Y.; Xie, Z.; Zhong, L.C. Influence of bottom tuyere configuration on bath stirring in a top and bottom combined blown converter. ISIJ Int. 2008, 48, 793–798. [Google Scholar] [CrossRef] [Green Version]
  15. Ballal, N.B.; Ghosh, A. A water model study of bottom-blown oxygen steelmaking processes. Metall. Trans. B 1981, 12, 525–534. [Google Scholar] [CrossRef]
  16. Zhong, L.C.; Wang, X.; Zhu, Y.X.; Chen, B.Y.; Huamg, B.C.; Ke, J.X. Bath mixing behaviour in top-bottom-side blown converter. Ironmak. Steelmak. 2010, 37, 578–582. [Google Scholar]
  17. Wuppermann, C.; Giesselmann, N.; Rückert, A.; Odenthal, H.J.; Pfeifer, H.; Hovestädt, E. A novel approach to determine the mixing time in a water model of an AOD converter. ISIJ Int. 2012, 52, 1817–1823. [Google Scholar] [CrossRef] [Green Version]
  18. Liu, F.H.; Sun, D.B.; Zhu, R.; Dong, K.; Bai, R.G. Effect of side-blowing arrangement on flow field and vanadium extraction rate in converter steelmaking process. ISIJ Int. 2018, 58, 852–859. [Google Scholar] [CrossRef] [Green Version]
  19. Cheng, R.; Zhang, L.J.; Yin, Y.B.; Zhang, J.M. Effect of side blowing on fluid flow and mixing phenomenon in gas-stirred ladle. Metals 2021, 11, 369. [Google Scholar] [CrossRef]
  20. Zhou, X.B.; Ersson, M.; Zhong, L.C.; Jönsson, P.G. Numerical and physical simulations of a combined top-bottom-side blown converter. Steel Res. Int. 2015, 86, 1328–1338. [Google Scholar] [CrossRef]
  21. Olivares, O.; Elias, A.; Sánchez, R.; Díaz-Cruz, M.; Morales, R.D. Physical and mathematical models of gas-liquid fluid dynamics in LD converters. Steel Res. 2002, 73, 44–51. [Google Scholar] [CrossRef]
  22. Ajmani, S.K.; Chatterjee, A. Cold model studies of mixing and mass transfer in steelmaking vessels. Ironmak. Steelmak. 2005, 32, 515–527. [Google Scholar] [CrossRef]
  23. Odenthal, H.J.; Falkenreck, U.; Schlüter, J. CFD simulation of multiphase melt flows in steelmaking converters. In Proceedings of the European Conference on Computational Fluid Dynamics, Delft, The Netherlands, 5–8 September 2006. [Google Scholar]
  24. Wang, X.H.; Li, J.Z.; Liu, F.G. Technological progress of BOF steelmaking in period of development mode transition. Steelmaking 2017, 33, 1–11. [Google Scholar]
  25. Li, M.M.; Li, L.; Li, Q.; Zou, Z.S. Modeling of mixing behavior in a combined blowing steelmaking converter with a filter-based Euler-Lagrange model. JOM 2018, 70, 2051–2058. [Google Scholar] [CrossRef]
  26. Xue, R.; Zhang, Y.C.; Zhang, C.J.; Wang, C.J.; Liu, Z.Y. Numerical simulation of influence of bottom blowing gas supply mode on converter mixing effect. China Metall. 2020, 30, 13–20. [Google Scholar]
  27. Odenthal, H.J.; Grygorov, P.; Reifferscheid, M.; Schlüter, J. Advanced blowing and stirring conditions in the BOF process. Iron Steel Technol. 2014, 11, 142–155. [Google Scholar]
  28. Wei, G.S.; Zhu, R.; Wang, Y.; Dong, K.; Wu, X.T.; Liu, R.Z.; Chen, F.W. Simulation and application of pulsating bottom-blowing in EAF steelmaking. Ironmak. Steelmak. 2018, 45, 847–856. [Google Scholar] [CrossRef]
  29. Tang, H.Y.; Liu, J.W.; Zhang, S.; Guo, X.C.; Zhang, J.Q. A novel dual plugs gas blowing mode for efficient ladle metallurgy. Ironmak. Steelmak. 2019, 46, 405–415. [Google Scholar] [CrossRef]
  30. Yang, Z.S.; Yang, L.Z.; Cheng, T.; Chen, F.; Zheng, F.Q.; Wang, S.; Guo, Y.F. Fluid flow characteristic of EAF molten steel with different bottom-blowing gas flow rate distributions. ISIJ Int. 2020, 60, 1957–1967. [Google Scholar] [CrossRef] [Green Version]
  31. Yao, L.J.; Zhu, R.; Dong, K.; Wei, G.S.; Zhao, F.; Tang, Y.X. Influence of the non-uniform bottom blowing gas supply mode on the dynamic conditions of molten pool during the converter steelmaking process. Ironmak. Steelmak. 2021, 48, 180–190. [Google Scholar] [CrossRef]
  32. Singh, V.; Lenka, S.N.; Ajmani, S.K.; Bhanu, C.; Pathak, S. A novel bottom stirring scheme to improve BOF performance through mixing and mass transfer modelling. ISIJ Int. 2009, 49, 1889–1894. [Google Scholar] [CrossRef] [Green Version]
  33. Chu, K.Y.; Chen, H.H.; Lai, P.H.; Wu, H.C.; Liu, Y.C.; Lin, C.C.; Lu, M.J. The effects of bottom blowing gas flow rate distribution during the steelmaking converter process on mixing efficiency. Metall. Mater. Trans. B 2016, 47, 948–962. [Google Scholar] [CrossRef]
  34. Quiyoom, A.; Golani, R.; Singh, V.; Buwa, V.V. Effect of differential flow schemes on gas-liquid flow and liquid phase mixing in a Basic Oxygen Furnace. Chem. Eng. Sci. 2017, 170, 777–789. [Google Scholar] [CrossRef]
  35. Huang, B.; Sun, Y.H.; Bai, X.F.; Zhao, C.L.; Luo, L.; Tian, Z.H. Simulate on agitating and mass transfer effect of 300 t dephosphorization slag-steel interface. Iron Steel 2017, 52, 38–44. [Google Scholar]
  36. Wang, Y.N.; Cao, L.L.; Cheng, Z.F.; Blanpain, B.; Guo, M.X. Mathematical methodology and metallurgical application of turbulence modelling: A review. Metals 2021, 11, 1297. [Google Scholar] [CrossRef]
  37. Zhou, X.B.; Ersson, M.; Zhong, L.C.; Yu, J.K.; Jönsson, P. Mathematical and physical simulation of a top blown converter. Steel Res. Int. 2014, 85, 273–281. [Google Scholar] [CrossRef]
  38. Launder, B.E.; Spalding, D.B. The numerical computation of turbulent flows. Comput. Methods Appl. Mech. Eng. 1974, 3, 269–289. [Google Scholar] [CrossRef]
  39. Li, Q.; Li, M.M.; Kuang, S.B.; Zou, Z.S. Computational study on the behaviours of supersonic jets and their impingement onto molten liquid free surface in BOF steelmaking. Can. Metall. Q. 2014, 53, 340–351. [Google Scholar] [CrossRef]
  40. Sun, J.K.; Zhang, J.S.; Lin, W.H.; Feng, X.M.; Liu, Q. Effect of impact cavity shape induced by supersonic oxygen jet on the dynamic characteristics of molten bath in converter. Steel Res. Int. 2021, 92, 2100179. [Google Scholar] [CrossRef]
  41. Li, Q.; Li, M.M.; Kuang, S.B.; Zou, Z.S. Understanding characteristic of abrasion of refractory lining caused by bath oscillation in BOF steelmaking. JOM 2016, 68, 3126–3133. [Google Scholar] [CrossRef]
  42. Launder, B.E.; Spalding, D.B. Mathematical Models of Turbulence; Academic Press: London, UK, 1972; p. 124. [Google Scholar]
Figure 1. Schematic diagrams of (a) the hydraulic experiment device and (b) the arrangement of the bottom tuyeres and tracer monitoring points.
Metals 12 00117 g001
Figure 2. Schematic diagram of the numerical simulation.
Metals 12 00117 g002
Figure 3. Validation of the model in terms of (a) dynamic pressure, (b) tracer curve, and (c) mixing time.
Metals 12 00117 g003
Figure 4. Comparison of the flow field in longitudinal section of the molten bath under (a) bottom blowing condition and (b) combined blowing condition.
Metals 12 00117 g004
Figure 5. Effect of bottom blowing mode on the flow field of molten bath in the eight cases.
Metals 12 00117 g005aMetals 12 00117 g005b
Figure 6. Velocity interval distribution of liquid phase in molten bath (Case 1).
Metals 12 00117 g006
Figure 7. Distribution of the tracer concentration at 10 s, 20 s, 30 s, 40 s, and 50 s among the eight cases (bottom blowing condition).
Metals 12 00117 g007
Figure 8. Mixing time of the eight cases under (a) bottom blowing condition and (b) combined blowing condition.
Metals 12 00117 g008
Figure 9. Effect of bottom blowing mode on the mixing time under different blowing conditions.
Metals 12 00117 g009
Figure 10. Wall shear stress contour in the eight cases.
Metals 12 00117 g010
Figure 11. Comparison of the integral wall shear stress in the eight cases.
Metals 12 00117 g011
Table 1. Geometrical and operational conditions of the prototype and model.
ItemsPrototypeModel
Similarity ratio61
Bath diameter (mm)4382730.33
Bath depth (mm)1360226.67
Laval nozzle throat diameter (mm)38.46.40
Laval nozzle exit diameter (mm)49.98.32
Laval nozzle throat length (mm)101.67
Laval nozzle divergent length (mm)9015
Laval nozzle number44
Bottom tuyere number66
Liquid phase density (kg·m−3)71001000
Top blowing gas density (kg·m−3)1.431.29
Bottom blowing gas density (kg·m−3)1.621.29
Oxygen lance height (mm)1350120
Top gas flow rate (m3·h−1)22,00073
Single bottom gas flow rate (m3·h−1)18, 24, 30, 42, 48, 54,
60, 66, 72, 78, 84
0.09, 0.12, 0.15, 0.21, 0.24, 0.27,
0.30, 0.33, 0.36, 0.39, 0.42
Table 2. Bottom blowing mode conditions of the eight cases.
Bottom Blowing ModeFlow Rate Per Tuyere (m3·h−1)
#1#2#3#4#5#6
Case 1Uniform modeUniform0.240.240.240.240.240.24
Case 2Continuous modeThree-point linear co-direction0.120.240.360.360.240.12
Case 3Three-point linear unco-direction0.120.240.360.120.240.36
Case 4Two-point linear0.360.360.360.120.120.12
Case 5Circumferential linear0.090.150.210.270.330.39
Case 6Interval modeA-type0.150.420.150.150.420.15
Case 7V-type0.300.120.300.300.120.30
Case 8Triangle alternating0.120.360.120.360.120.36
Table 3. Distribution of molten steel velocity interval distribution ratio, average velocity, and average turbulent kinetic energy in the eight cases.
ItemsCase 1Case 2Case 3Case 4Case 5Case 6Case 7Case 8
Dead zone (%)11.637.4210.1912.799.087.9614.8812.19
Weak flow zone (%)46.8752.3749.3749.9749.9552.7448.7850.37
Active flow zone (%)41.4940.2240.4437.2540.9739.3036.3437.44
Average velocity (m·s−1)0.047580.050130.047990.046730.048280.049370.045830.04709
Average turbulent kinetic energy (m2·s−2)0.001520.001710.001580.001470.001610.001640.001460.00149
Publisher’s Note: MDPI stays neutral with regard to jurisdictional claims in published maps and institutional affiliations.

