Abstract
The aim of this paper is to determine the optimal input parameters for the process in order to ensure the maximum formable wall angle is obtained in a conical frustum with a varying wall angle fabricated using Single Point Incremental Forming (SPIF). The test material was 0.8-mm-thick Ti-6Al-4V titanium alloy sheets, and the test used a tungsten carbide tool with a rounded tip with a radius of 4 mm. Complete workpieces were heated using hot oil with a temperature of about 200 °C, and in addition, the high rotation speed of the forming tool generated an amount of friction heat. The input parameters were tool rotational speed, feed rate, step size, and tool rotation direction. Various oil pressures were used to improve both the accuracy of the components formed and the friction heating process. On the basis of calculations performed by means of the response surface methodology, split-plot I-optimal design responses were obtained by means of polynomial regression models. Models were fitted using REstricted Maximum Likelihood (REML), and p-values are derived using the Kenward–Roger approximation. Observation of the fracture surface of Ti-6Al-4V drawpieces showed that the destruction is as a result of ductile fracture mode. Tool rotational speed and step size are the most significant factors that affect the axial force, followed by feed rate. It was also found that step size is the most significant factor that affects the in-plane SPIF force.
1. Introduction
Single-point incremental forming (SPIF), proposed by Iseki [1], is a flexible method of sheet metal forming that does not require the use of dies adapted to the shape of the product. The SPIF method and its variation, two-point incremental forming (TPIF), can be used to produce products with complex shapes, both convex and concave, using shank tools with rounded tips. These tools move along the programmed trajectory, gradually sinking into the formed sheet [2,3]. A milling machine or a numerically controlled lathe with at least three controlled axes is required to operate the SPIF process. Incremental sheet forming (ISF) methods that use a robotic arm to drive the working spindle have also been developed.
Due to the point character of the contact of the tool with the deformed sheet, the processing speed in this method is lower than in conventional sheet metal forming (SMF) methods that require the production of a die and punch [4]. However, die-less ISF is more effective when machining prototype parts, small-series components, and highly customised parts such as medical implants. Due to the local nature of plastic deformation, the deformation achievable in SPIF is greater than with conventional SMF. Comparison of the conventional SMF process intended to form a pyramid-shaped part with SPIF can be found in a paper by Petek et al. [5]. Over the years, many varieties of SPIF have been proposed for forming hard-to-deform alloys in cold forming conditions such as warming sheet material using hot air blowers [6] or using a furnace [7], electrically assisted ISF [8,9], laser-assisted ISF [10,11], and friction-assisted ISF [12].
During the forming process, due to the elastic–plastic deformation conditions, the forming process is prone to instability and the part is subject to springback [13,14] and pillow effect [15,16,17]. After forming, skirt springback occurs due to the elastic recovery of the sheet. Elimination of shape errors is achieved by optimisation of the tool trajectory in order to compensate for the elastic recovery of the sheet material. There are many studies designed to increase the accuracy of ISF carried out in cold and hot forming conditions. The process conditions of SPIF depend on many parameters that can interactively affect the surface finish, shape and dimensional accuracy of the drawpieces, wall thickness and the possibility of producing large sheet deformations. These parameters include: tool rotational speed, tool diameter, feed rate, step depth and lubrication conditions. Numerous investigations designed to optimise forming conditions using Analysis of Variance (ANOVA), Taguchi design of experiment, regression analysis, Non-dominated Sorting Genetic Algorithm (NSGA) and Response Surface Methodology (RSM) can be found in the literature. Honarpisheh et al. [18] studied the interaction and main effect of the process parameters viz. rotational speed, tool diameter, step down, on the wall and fracture depth in SPIF of 1050 aluminium alloy sheets using the ANOVA method and a multi-response optimisation. Kurra et al. [19] investigated SPIF of extra deep drawing steel sheets using the Box–Behnken design. They evaluated the effect of process parameters on surface roughness and manufacturing time using ANOVA, NSGA and RSM approaches. Szpunar et al. [20] developed the mathematical relations between feed rate, pitch, spindle speed and surface roughness on the inner surfaces of Grade 2 titanium drawpieces defined using the RSM and Central Composite Design (CCD). It was found that step size directly affects the surface roughness on the inner surface of the component. Truncated cone specimens formed with high values of tool rotational speed showed poor surface qualities. Vahdani et al. [9] employed Design of Experiment (DoE) and ANOVA to study the formability of Ti-6Al-4V titanium alloy sheet. The results showed that SPIF of the study material can be improved by electric hot incremental sheet forming. The electric current and the lubricant type have a significant effect on the maximum achievable forming depth. Najm and Paniti [21] used artificial neural networks to explore and estimate the relative importance of SPIF parameters during forming of AlMn1Mg1 aluminium alloy sheets. One of the key findings is that tool characteristics (surface roughness, tool tip shape and tool material) play an essential role in the accuracy of the final component. Maji and Kumar [22] developed RSM and an Adaptive Neuro-Fuzzy Inference System (ANFIS) with a non-dominated sorting genetic algorithm to predict the outcome of SPIF components. They found that surface roughness (Ra) was most significantly affected by step height. Moreover, the formable wall angle and deformed sheet thickness were mostly affected by feed rate. Grün et al. [12] applied one-factor-at-a-time (OFAT) and DoE methods to investigate the strength of the correlations between the kinematics of the tool and the formability of the Ti6Al4V sheets in friction stir ISF. Tool rotation speed was found to be the dominant friction stir SPIF parameter. Step depth and feed rate had a minor impact.
There are other reports investigating process parameters directly without using any statistical procedures. Durante et al. [23] studied the influence of tool rotation in SPIF of 7075-T0 aluminium alloy pyramid frustums in terms of forming forces, surface roughness and forming temperature. Temperature measurement highlights different heating of the sheet and in particular a proportional dependence on the speed of rotation because of the relative motion between the sheet and tool. Hussain et al. [24] studied the effect of feed rate, tool diameter, pitch, and friction conditions on the formability of a commercially pure (CP) titanium sheet varying wall angle conical frustum (VWACF). It was found that friction at the tool/blank interface does not affect the formability of CP titanium sheet. A decrease in the feed rate increases the formability. Racz et al. [25] chose the most highly recommended incremental forming process for Ti-6Al-4V titanium alloy cranioplasty plates using a decision-making method based upon AHP (analytic hierarchy process). They concluded that the accuracy of the wall angle was not significantly influenced by the tool diameter and toolpath strategy. This can be explained by the fact that the low plasticity of the Ti-6Al-4V titanium alloy does not lead to a significant degree of springback. Mohanraj and Elangovan [26] investigated the effect of process parameters such as tool rotational speed, feed rate, step depth and tool diameter on the geometrical accuracy and thinning in SPIFed Ti-6Al-4V aerospace components both experimentally and using the finite element method (FEM). Palumbo et al. [27] formed Ti-6Al-4V truncated cones with the aim of investigating the effect of both the tool diameter/pitch ratio (D/p) and the wall angle on the formability of the material. An analysis of shape errors, and thinning measurements highlighted the fact that the parameter D/p plays a key role in SPIF. Naranjo et al. [28] conducted a numerical campaign to study the formability of Ti-6Al-4V VWACF in a warm SPIF process. The effect of temperature on formability was experimentally evaluated in terms of the maximum achieved wall angle. Increase in temperature improved formability however the temperature did not significantly influence the surface finish of drawpieces. The effects of the forming temperature on material failure and more particularly on geometric accuracy while forming a Ti-6Al-4V denture prosthesis were investigated by Sbayti et al. [29]. The numerical models conducted showed that SPIF of a denture base made of the one of the most frequently used alloys for biomedical applications has the potential for real medical applications. In another paper, Sbayti et al. [30] numerically investigated the effect of tool diameter and temperature on the failure and geometric accuracy of the acetabular component of a hip prosthesis made of Ti-6Al-4V titanium alloy. The emerging trends and development of SPIF in titanium and its alloys can be found in review papers by Oleksik et al. [31] and Trzepieciński et al. [32].
In this manuscript, an I-optimal split-plot algorithm was used to build a response surface design for SPIF of Ti-6Al-4V alloy. Due to the poor room-temperature formability of a Ti-6Al-4V alpha-beta titanium alloy, deformation under high temperature is needed [29]. The main reason for its poor formability is low ductility at room temperature due to the hexagonal close-packed (HCP) structure in α-phase. To overcome this limitation, the SPIF experiments were conducted in warm conditions. Several authors have developed systems for heating the sheet at the tool contact point by the Joule effect [8,9], friction stir heating [12], laser-assisted heating [10,11], or by employing heat bands [33]. The non-uniform heating drawback of these methods and poor efficiency of the heat bands method is overcome in this paper by using combined oil-based and friction stir rotation-assisted heating of the workpiece. The input parameters were tool rotational speed, feed rate, step size, and tool rotation direction. To further improve sheet formability, a variable oil pressure in the die cavity is considered. The mathematical relations are defined from the response surfaces to predict both the maximum formable wall angle of the conical frustum with a varying wall angle and the components of the forming force.
2. Materials and Methods
2.1. Material
Ti-6Al-4V titanium alloy sheet metal 0.8 mm thick was used as the test material. At room temperature the microstructure of Ti-6Al-4V alloy mainly consists of hexagonal closed packed (HCP) for the α and body centred cubic (BCC) for the β phases, respectively [34,35]. This two-phase (α-β) Ti-based alloy is the most frequently used Ti-based alloy in a variety of applications, including blades, discs and rings of turbines and constructional elements of airplanes. Ti-6Al-4V material is also commonly used as biocompatible implants in medicine applications. It has high corrosion resistance, good weldability, excellent strength, and low modulus of elasticity. However, due to its complex microstructure at room temperature, this alloy is commonly formed at elevated temperatures. The chemical composition of Ti-6Al-4V alloy is given in Table 1 according to ISO 5832/3 [36].

Table 1.
Chemical composition of Ti-6Al-4V (wt.%).
2.2. Experimental Setup
The tests for forming the drawpieces under combined oil-based and friction stir rotation-assisted heating in warm SPIF were carried out with the use of a die consisting of a housing and a blankholder ensuring the fixing of the displacement of the workpiece flange. Structural diagram and view of the experimental setup are shown in Figure 1a,b, respectively. The sheet metal clamp was secured by means of a set of screws. An electric oil heater (Tempco Electric Heater Corp., Wood Dale, IL, USA) was placed in the die cavity and the oil pressure was kept constant during forming by means of a valve. The forming device was mounted on the bed of a PS95 vertical CNC milling machine (Makino Milling Machine Co. Ltd., Tokyo, Japan). A workpiece with a diameter (TIMET Titanium Metals Corp., Toronto, OH, Canada) of 100 mm was used to form conical frustums with varying wall angles (Figure 2). A tungsten carbide tool (HHT – Hartmetall GmbH & Co. KG, Dornstadt, Germany) with a rounded tip with a radius of 4 mm was mounted in the face mill through an ER32 collet chuck (Haimer GmbH, Igenhausen, Germany). A grease-free dry anti-friction spray of MoS2 (WEICON GmbH & Co. KG, Münster, Germany) was used in the experiments. This lubricant is pressure and temperature resistant from −185 °C to 400 °C. Surfaces were cleaned and degreased prior to application.
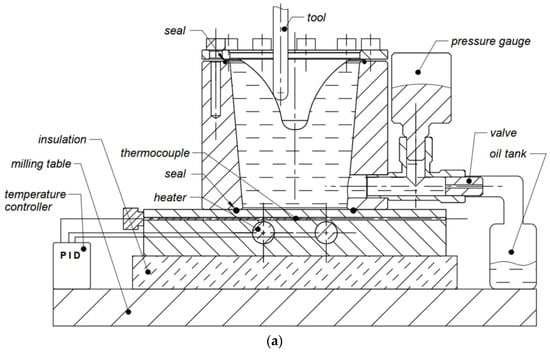
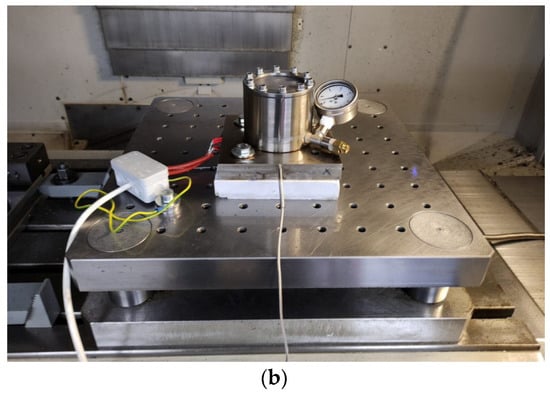
Figure 1.
(a) Structural diagram and (b) view of experimental setup.
Figure 2.
Geometry and dimensions of varying wall angle conical frustums (dimensions in mm).
The experiments stopped after fracture of the part. Height of drawpieces h was measured using height gauge. The maximum formable wall angle α was determined based on the drawpiece height h:
The axial force Fz and the horizontal components of the forming force Fx and Fy were measured by a high-accuracy piezoelectric dynamometer (Kistler Holding AG, Winterthur, Switzerland) with a maximum sample rate per channel of 200 kHz. Based on the two horizontal components of the forming force Fx and Fy, the in-plane force Fxy was determined according to the formula:
The tool indented into the workpiece followed a spiral path. The tool trajectory (Figure 3) was generated using NX CAM software (version 1938, Siemens Digital Industries Software, Plano, TX, USA) based on the numerical model of the desired shape of the drawpiece.
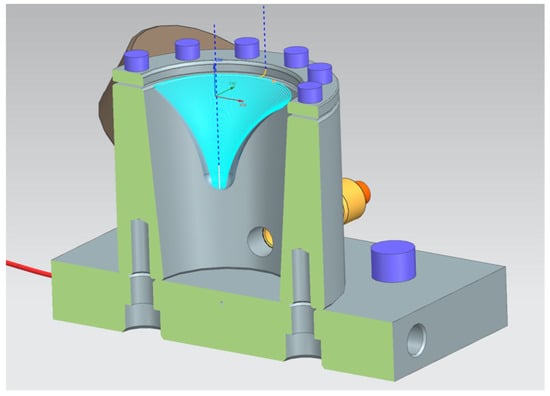
Figure 3.
Toolpath trajectory generated in NX CAM software.
2.3. Plan of Experiments
Split-plot I-optimal design (Design Expert, version 12, Stat-Ease Inc., Minneapolis, MN, USA) was used to determine the input parameters of the SPI process in order to maximise the wall angle and to minimise the in-plane and axial forming force components. Design of industrial experiments with complete randomisation is limited due to cost constrains. The split-plot design, which involves a restricted randomisation, often provides a reasonable alternative [37]. Split-plot designs were originally used in agriculture where plots of land were subdivided in relatively large portions known as whole plots. Each of the levels of the whole-plot factors were then randomly assigned to these plots. Whole plots were further divided into smaller portions known as subplots, to which subplot factors were applied [37]. In split-plot design, the hard-to-change factors act as whole-plot factors and easy-to-change factors belong to sub-plots. I-optimal designs are noted for their integrated variance. In I-optimal design, the computational model adjusts the response surface that determines the optimal conditions, by minimising the mean differences (variances) of the predicted numerical data of the independent variables. The model assumes the forecast of missing combinations of independent variables of the experiment using the actual plan of the experiment used for optimisation [38].
Initial range of input parameters for split-plot I-optimal design was determined in the preliminary experimental studies of VWACF forming. A reasonable range of parameters was determined considering the following problems. A rotational speed of the tool that was too high caused excessive heating not only of the sheet but also of the tool. Therefore, excessive build-up was observed in the tool tip surface. The maximum value of the feed rate (2000 mm/min) was limited by the inertia of the MHWT (machine–holder–workpiece–tool) system, causing strong vibrations when tool moving along a trajectory with small radius. In addition, the feed must be considered together with the rotational speed to ensure proper friction-assisted heating of the sheet metal. The device is structurally adjusted (sealing, valve type) to work under a maximum oil pressure of 4 bar. Step size greater than 0.5 mm caused premature cracking of the drawpieces due to insufficient local heating of the material by tool interaction.
The predominant input factors and range of their variation, which have most influence on the maximum formable wall angle and components of the forming force, were identified from preliminary experiments. The input parameters were oil pressure p, tool rotational speed n, feed rate f, step size ap and direction of tool rotation (Table 2). The last parameter was selected based on the study of Szpunar et al. [20], who found that the direction of tool rotation in relation to the feed direction (anticlockwise and clockwise—Figure 4) influenced the possibility of receiving drawpieces without the risk of cracking.
Table 2.
Factors and levels used in the split-plot I-optimal design *.
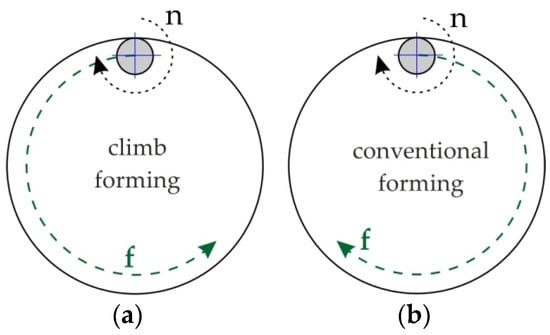
Figure 4.
Spindle rotation: (a) anticlockwise; and (b) clockwise.
The split-plot I-optimal design was composed of five levels, and 25 experiments (Table 3) were carried out to optimise the input variables. The points of the split-plot I-optimal design in the workspace are presented in Figure 5.
Table 3.
Plan of experiments for split-plot I-optimal design (“+”—clockwise direction, “−”—counterclockwise direction of tool rotation).
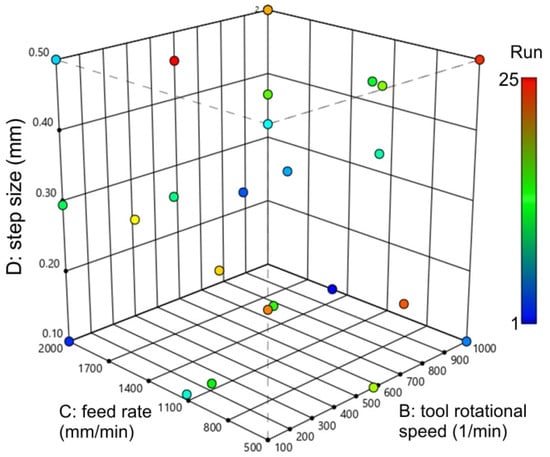
Figure 5.
Points of the split-plot I-optimal design in the workspace.
3. Results and Discussion
3.1. Split-Plot I-Optimal Design with RSM
Analysis of variance was used to determine the relationships between the input variables and the specific output variable: maximum formable wall angle, in-plane forming force Fxy and axial forming force Fz (Figure 6). Analysis of variance explains the probability with which the selected factors may be the cause of differences between the observed group means. The aim of the statistical analysis was to determine the significance of the influence of individual parameters on the selected output variables using Fisher’s test at a significance level α = 0.05. Based on the statistical tables for F (0.05), an analysis of the significance of individual variables was performed. On the basis of the calculations performed by means of the RSM, optimal responses were obtained by means of polynomial regression models. Models are fitted using REstricted Maximum Likelihood (REML) and p-values are derived using the Kenward–Roger approximation. Table 4 shows the results of the experimental tests based on the split-plot I-optimal design.
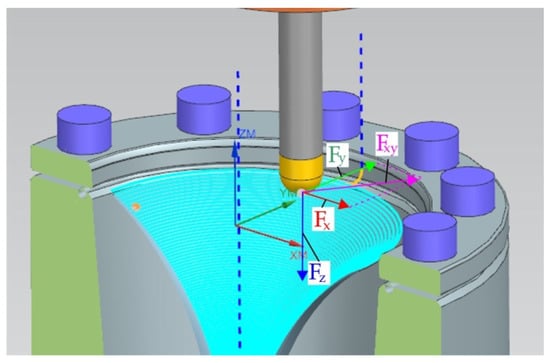
Figure 6.
Force components in SPIF.
Table 4.
Results of the SPIF forming.
The experiments stopped after fracture of the part. The highest wall angle α = 66° was obtained for run no. 15. The drawpiece fracture was observed on the side surface of the cone slightly below the drawpiece bottom (Figure 7). The greater the wall angle, the greater the tensile stresses in the drawpiece wall in the direction of downward movement of the tool. Simultaneously with the increase in value of the wall angle, the share of circumferential stresses acting on the edge of the bottom of the drawpiece decreases. Figure 8 and Figure 9 show SEM micrographs of a fracture surface of Ti-6Al-4V VWACF. Observation of the fracture surfaces of Ti-6Al-4V drawpieces showed that the destruction is a result of the ductile fracture mode (Figure 8c and Figure 9b). Ductile cracking occurs by nucleation and void growth and usually begins with particles of a different phase [39]. During ductile fracture, the formation and joining of cracks takes place due to the plastic flow of the workpiece material. An underside view of the fracture surface, related to the inner surface of the sheet, shows dimples similar to the ones due to ductile fracture under tensile stress [40]. Microcracks in the subsurface layer are observed on the inner surface of the drawpiece (Figure 8b). Due to the severe impact of the tool tip, the formability of the material in the subsurface layer in contact with the tool has decreased. As a result of the reduction in formability, the material in the subsurface layer was susceptible to fracture. The outer part of the fracture surface (the part in contact with the outer surface of the drawpiece), presents small, partially formed dimples typical of shear load conditions (Figure 8a and Figure 9d) [40]. This can be explained by various stress states. On the inner side of the part, the tip of the tool pushes the material downward making tensile stress predominant, while, on the outer side, the circumferential movement of the bottom tool and the related shear effect generate shear-type surface fracture [41]. As mentioned, the fracture is first stretched due to the meridional tensile stresses due to the downward movement of the tool, and then expanded in the horizontal direction.
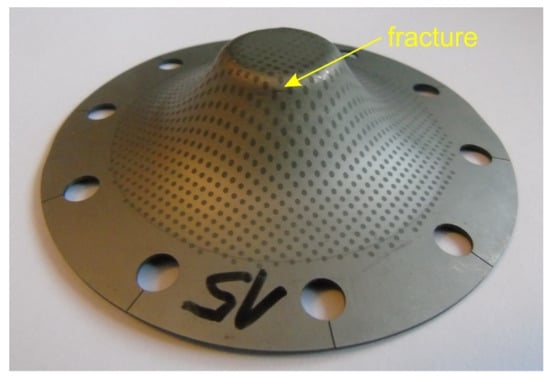
Figure 7.
Fractured VWACF produced in run 15.
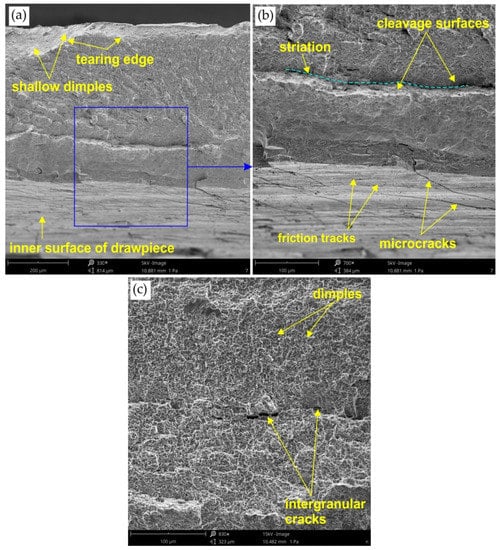
Figure 8.
SEM micrographs of the fracture surface of VWACF produced in run 15: (a) cross-section of the fractured surface, (b) view of the near-edge inner surface of the drawpiece, (c) magnification of the ductile fracture area.
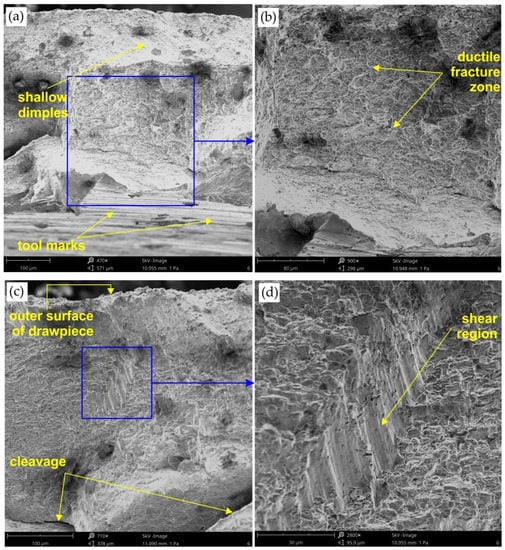
Figure 9.
SEM micrographs of the fracture surface of VWACF (maximum formable wall angle α = 45°): (a) cross-section of the fractured surface, (b) view of the near-edge inner surface of the drawpiece, (c,d) magnification of the ductile fracture area.
The total force F and components of the total force Fxy and Fz for the VWACF with the highest wall angle obtained, α = 66°, are shown in Figure 10. As can be observed, the values of the total force components vary cyclically. The initial stages of the forming process show a very fast increase in the axial force value. At the same time, the in-plane force value was several times smaller. As the downward movement of the tool increased, the value of the drawpiece radius decreased and the tool began to affect the inner surface of the drawpiece with a more and more lateral surface. Meanwhile, at the beginning of the forming process, the lower surface of the tool tip was the most heavily loaded and caused a rapid increase in axial force.
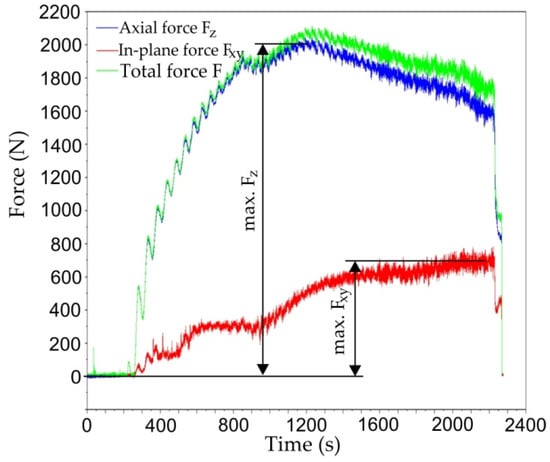
Figure 10.
Total force F and components of total force Fxy and Fz for the VWACF produced with run 15.
3.2. Maximum Formable Wall Angle
To analyse the effects of the input control factors on the maximum formable wall angle, a model of the response was developed. The adequacy of the RSM models that were built was checked through REML and the coefficient of determination R2. REML analysis is based on an iterative procedure for estimating the effects of constant and variance components. This procedure begins by defining an initial set of sample parameters, which then are used to estimate the next set of parameters, to replace the set of initial values. The procedure is iterative until convergence is achieved. Then the values of the parameters obtained in the next step differ so little from those obtained in the previous step in such a way that the amount of this difference does not exceed the value of the convergence criterion adopted [42]. The effects of tool rotational speed, feed rate, step size, oil pressure and direction of tool rotation were analysed based on different plots.
Table 5 shows the results of REML analysis for maximum formable wall angle. In REML, whole plots are further divided into smaller portions known as subplots, to which subplot factors were applied [37]. The subplot F-value of 35.53 implied the model is significant. Statistically insignificant factors that affect the process were above the p-value of 0.1. A p-value of 0.05–0.1 indicates marginally significant factors, and a p-value below 0.05 indicates that the factor is significant in the process. Feed rate and tool rotational speed are key parameters that affect the maximum formable wall angle. This is in line with the research findings by Durante et al. [43]. A faster tool rotational speed improves the sheet formability [44]. As Kumar et al. [44] concluded, the formability increase is due to both a positive reduction of the friction effects at the tool sheet interface and localised heating of the sheet material. Although oil pressure is a statistically insignificant factor in the whole model according to the variance components that were estimated using REML the interaction between oil pressure and both tool rotational speed and direction of tool rotation in the subplot is significant. Therefore, to maintain hierarchy, oil pressure was added in the final model.
Table 5.
REML analysis of the maximum formable wall angle.
Table 6 presents the restricted maximum likelihood analysis results of the maximum formable wall angle at a confidence interval of 95%. The capability of the REML model is higher than 0.98 indicating that this model fits well with the experimental data. Moreover, the adjusted R2 value of 0.9957 was in reasonable agreement with the R2 value of 0.9852. The final equation in terms of coded factors is as follows:
αmax = 51.27 + 3.37a + 4.1B − 3.14C + 1.67D + 2.06E + 2.46aB + 2.04aE − 2.64BC + 1.83BE + 1.02CD − 1.83CE + 1.83DE + 3.14B2 − 1.44D2
Table 6.
Fit statistics for REML analysis of the maximum formable wall angle.
The function that describes maximum formable wall angle (αmax) is given in Equations (4) and (5) in terms of actual factors:
- -
- clockwise direction of tool rotation:
αmax = 44.95474 − 0.675055a − 0.008857B + 0.005483C + 26.08930D + 0.003382aB − 0.000013BC − 0.002245CD + 0.000021B2 − 54.62115D2
- -
- counterclockwise direction of tool rotation:
αmax = 36.14228 + 1.74114a − 0.002936B + 0.005024C + 38.08526D + 0.003382aB − 0.000013BC − 0.002245CD + 0.000021B2 − 54.62115D2
A comparison of the experimental values of the maximum formable wall angle with the values predicted by the REML model is presented in Figure 11. The strong correlation between the predicted and actual values is confirmed by a proportional, close distribution of points along the regression line. The distribution of externally studentized residuals along the horizontal line (Figure 12a,b) shows that the distribution of residuals in the model is normal. The normal distribution of the residuals is necessary to verify the significance of the parameters obtained.
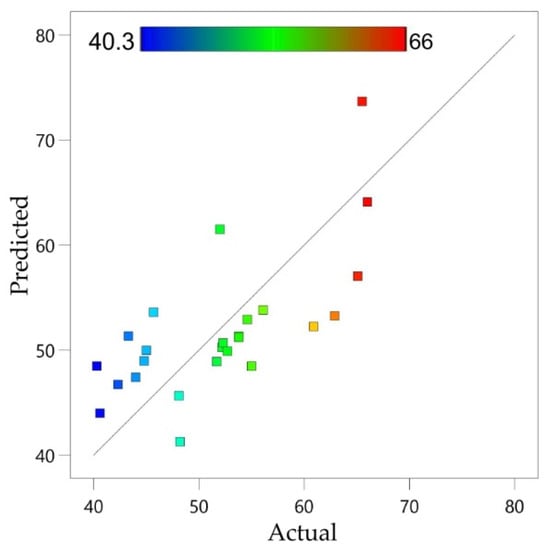
Figure 11.
Predicted versus actual response for maximum formable wall angle (units in °).
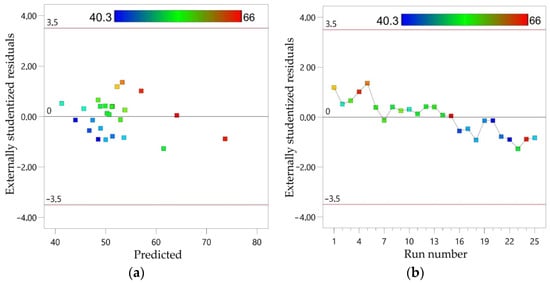
Figure 12.
Externally studentized residuals with reference to: (a) predicted and (b) run number for maximum formable wall angle.
In general, an increase in oil pressure and simultaneously in tool rotational speed increases the maximum formable wall angle (Figure 13a,b). In the case of the anticlockwise direction of tool rotation, larger maximum formable wall angles are obtainable (Figure 13b). This is due to the fact that a higher oil pressure increases the pressure of the sheet against the tool, thus increasing the actual contact surface. Thus, the increased contact area causes more intensive heat generation.
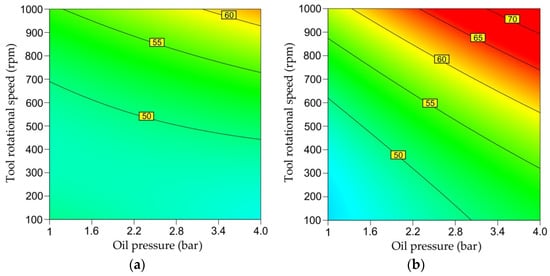
Figure 13.
Plots showing the effect of oil pressure and tool rotational speed on maximum formable wall angle αmax for (a) clockwise and (b) anticlockwise direction of tool rotation.
Under these conditions, the high rotational speed of the tool is able to heat the material more and increase its formability. Increasing the tool rotational speed for a given level of feed rate increases the maximum achievable forming angle (Figure 14a,b). The values of maximum formable wall angle during SPIF with a counterclockwise direction of tool rotation (Figure 15b) for the same value of feed rate and step size are greater than during SPIF with a clockwise direction of tool rotation (Figure 15a). A decrease in feed rate leads to an increase in maximum formable wall angle.
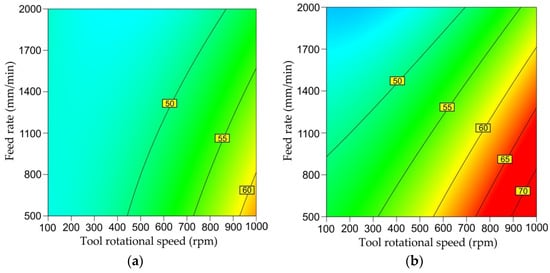
Figure 14.
Plots showing the effect of tool rotational speed and feed rate on maximum formable wall angle αmax for (a) clockwise and (b) anticlockwise direction of tool rotation.
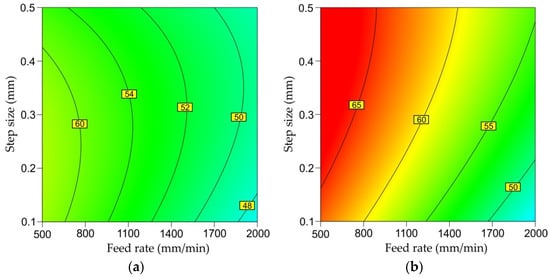
Figure 15.
Plots showing the effect of feed rate and step size on maximum formable wall angle αmax for (a) clockwise and (b) anticlockwise direction of tool rotation.
3.3. In-Plane Force Fxy
The results of REML analysis for in-plane force Fxy are shown in Table 7. The subplot F-value of 28.31 implied that the model was significant. Step size is the most significant factor that affects the in-plane force in SPIF. To complete the part, the tool needs to travel continuously inside the profile, and this required more pushing of the material during forming. The reaction of the material will be greater with high step size values, finally increasing both the in-plane and axial forces [45]. Tool rotational speed and the direction of tool rotation have a significant effect; however, this is slightly smaller than step size. Among all the parameters, the analysis shows that feed rate has the least influence on the in-plane force value. Direction of tool rotation is a statistically insignificant factor in the whole model according to the variance components that were estimated using REML.
Table 7.
REML analysis of the in-plane force.
Table 8 presents the statistics of restricted maximum likelihood analysis of the in-plane force at a confidence interval of 95%. The capability of the REML model is higher than 0.90, indicating that this model fits well with the experimental data. Moreover, the adjusted R2 value of 0.8614 was in reasonable agreement with the predicted R2 value.
Table 8.
Fit statistics of REML analysis of the in-plane force.
The final equation in terms of coded factors is as follows:
Fxy = 655.44 − 62.87B + 54.95C + 217.94D + 48.24E − 128.24C2
The function that describes the in-plane force (Fxy) is given in Equations (7) and (8) in terms of actual factors:
- -
- clockwise direction of tool rotation:
Fxy = −208.51375 − 0.178402B + 1.01061C + 935.29813D − 0.000361C2
- -
- counterclockwise direction of tool rotation:
Fxy = −146.07492 − 0.178402B + 1.01061C + 935.29813D − 0.000361C2
Figure 16 shows a comparison of the experimental values of the in-plane force with the values predicted by the REML model. The in-plane force values are evenly distributed around the diagonal. Similarly, externally studentized residuals are proportionally distributed throughout the range of predicted values of in-plane force (Figure 17a). A studentized residual is the quotient resulting from the division of a residual by an estimate of its standard deviation. The normal distribution of the externally studentized residuals is proved by Figure 17b: the residuals lie close to a straight line.
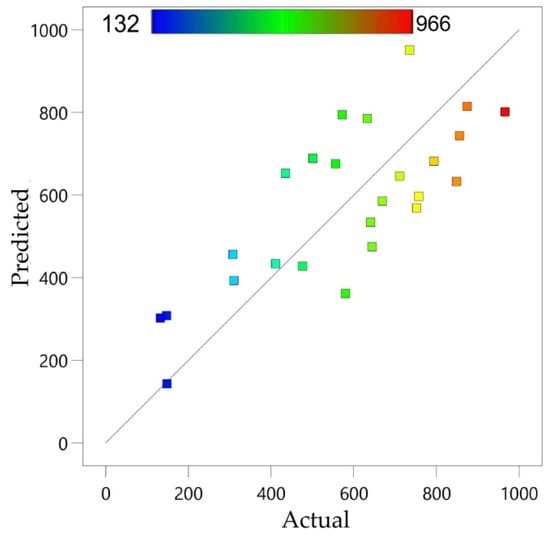
Figure 16.
Predicted versus actual response for in-plane force Fxy (units in N).
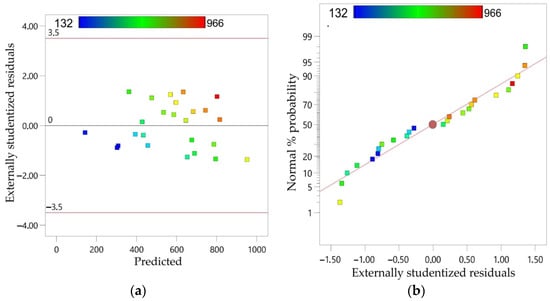
Figure 17.
(a) Externally studentized residuals with reference to predicted Fxy values; and (b) normal % probability plot of externally studentized residuals.
Reducing the rotational speed of the tool for both directions of tool rotation analysed causes an increase in the in-plane force (Figure 18a,b). The highest in-plane force values are predicted by the REML model in the middle range of feed rate changes and for the lowest tool rotational speed. This phenomenon is observed for both directions of tool rotation. However, in the case of the anticlockwise direction (Figure 18b), the predicted in-plane forces are higher than that for the clockwise direction (Figure 18a).
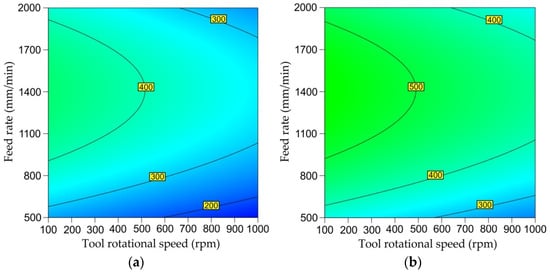
Figure 18.
Plots showing the effect of the tool rotational speed and feed rate on the in-plane force Fxy for the (a) clockwise and (b) anticlockwise direction of tool rotation; step size 0.1 mm.
A very similar trend of the isolines of values of in-plane force is observed after increasing the step size to 0.5 mm (Figure 19a,b). The maximum value of in-plane force is predicted for a feed rate of around 1400 rpm. This conclusion is in line with the results of Baharudin et al. [45]. In the case of the anticlockwise direction of tool rotation (Figure 18b), the area of high in-plane force values extends to the tool rotation range of 100–700 rpm. This proves the increased resistance to movement of the anticlockwise rotating tool. Under these conditions, the tool rotates in the opposite direction to the tool feed, intensifying the frictional interaction of the tool tip with the inner surface of the drawpiece.
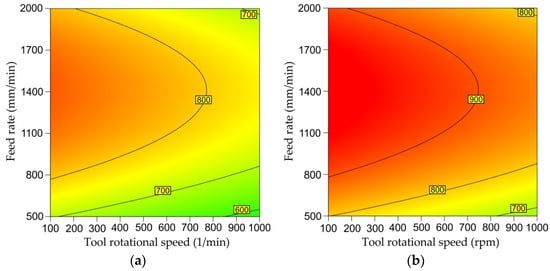
Figure 19.
Plots showing the effect of the tool rotational speed and feed rate on in-plane force Fxy for (a) clockwise and (b) anticlockwise direction of tool rotation; step size 0.5 mm.
3.4. Axial Force Fz
Table 9 shows the results of the REML analysis for the axial force Fz. The subplot F-value of 44.58 implied that the model was significant. Tool rotational speed and step size are key parameters that affect the axial force, followed by feed rate. The results of the investigations of Baharudin et al. [45] also showed that the rotation spindle speed was the most dominant parameter affecting the forming forces, followed by feed rate. The interaction between oil pressure and step size in the subplot is significant. Therefore, to maintain hierarchy, oil pressure was included in the final REML model. Direction of tool rotation, as an insignificant parameter, was excluded from the subplot.
Table 9.
REML analysis of the axial force Fz.
Table 10 presents the statistics of REML analysis results of the axial force at a confidence interval of 95%. The capability of the REML model is higher than 0.94, indicating that this model fits well with the experimental data. Moreover, the adjusted R2 value of 0.9172 was in reasonable agreement with the R2 value of 0.9483. From the REML results for the responses, it was inferred that the statistical model developed was adequate. Therefore, this model can be used to predict axial force in the design space.
Table 10.
Fit statistics of the REML analysis of the axial force.
The final equation in terms of coded factors is as follows:
Fz = 2035.37 + 7.28a − 194.57B + 103.26C + 403.61D − 115.13aD + 74.46BC − 122.30D2
The function that describes axial force (Fz) is given in Equation (10) in terms of actual factors:
Fz = 1060.64434 + 117.61102a − 0.675077B + 0.027296C + 4827.63140D − 375.50316aD + 0.000199BC − 3146.10137D2
A comparison of the experimental values of the axial force with the values predicted by the REML model is presented in Figure 20a. The high correlation between the predicted and actual values is confirmed by a proportional, close distribution of points along the regression line. The distribution of externally studentized residuals along the horizontal line (Figure 20b) shows that the distribution of residuals in the model is normal. The normal distribution of the residuals is necessary to verify the significance of the parameters obtained.
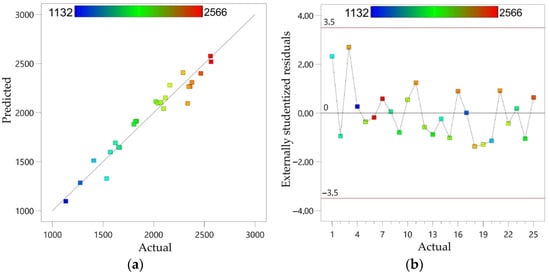
Figure 20.
(a) Predicted versus actual response for axial forming force (units in N) and (b) externally studentized residuals with reference to actual response.
The change in oil pressure at a constant step size value did not have a significant effect on the axial force (Figure 21a,b). However, at the lowest tool rotational speed analysed of 100 rpm with an increase in step size, the axial force increased at a faster rate (Figure 21a) than during forming with the highest tool rotational speed analysed of 1000 rpm (Figure 21b). In general, the smallest axial forces resulting from the pressure of the sheet against the tool occur for the smallest pressure and the smallest step size. The high concentration of isolines in Figure 22a,b proves the strong influence of tool rotational speed and feed rate on the axial force. The interactional effects of these two parameters are inversely proportional. The greatest axial force predicted by the REML model occurs when forming with the lowest tool rotation speed and at the same time with the highest feed rate. SPIF with high tool rotational speed and at the same time low feed rate led to a low axial force.
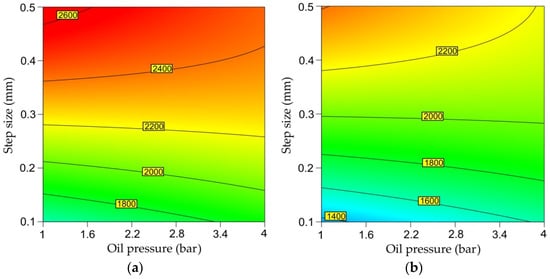
Figure 21.
Plots showing the effect of oil pressure and step sizes on axial force Fz for tool rotational speed of (a) 100 rpm and (b) 1000 rpm.
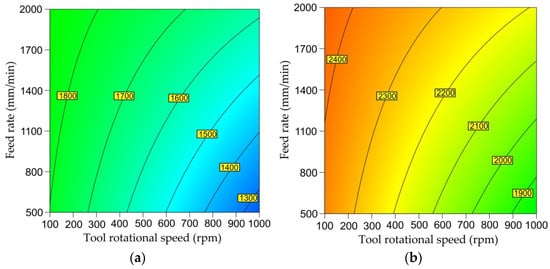
Figure 22.
Plots showing the effect of tool rotational speed and feed rate on axial force Fz for step sizes of (a) 0.1 mm and (b) 0.5 mm.
3.5. Numerical Optimisation
Desirability-based optimisation of the forming parameters was performed based on the desirability of multiple responses [20,44]. The optimisation procedure combines individual desirabilities into a single number and then searches for the greatest overall desirability [20]. Maximum forming angle is an output response that needs to be maximised, and therefore the higher the better is selected as an optimisation constraint. Limitations and constraints for the optimisation of the maximum formable wall angle are shown in Table 11. As an optimal value, the solution with the highest desirability value is chosen.
Table 11.
Limits used and goals for optimisation (“+” – clockwise direction, “−“– counterclockwise direction of tool rotation).
Optimisation outcomes are shown in Figure 23. The higher up the ramp, the better the desirability [20]. Considering maximum formable wall angle as output response, the best optimised value of this parameter is 64.19°, which can be obtained when formed with 1000 rpm spindle speed, 2000 mm/min feed rate, 0.38 mm step size, 4 bar oil pressure, and counterclockwise direction of tool rotation.
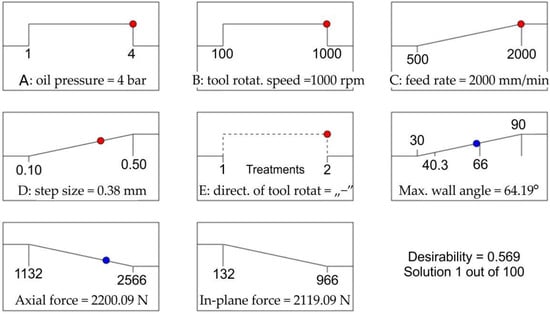
Figure 23.
Ramp plot for optimal responses.
The synergistic effect of high feed rate and tool rotational speed result in the most intensive friction stir rotation-assisted heating in SPIF. A high value of oil pressure presses the sheet against the tool tip, and as it is commonly known, greater pressure causes greater friction force. The temperature in the contact zone is the basic parameter that determines the possibility of forming α + β Ti-6Al-4V titanium alloy. Moreover, the toolpath climb strategy, in which the tool and the toolpath move in opposite directions, was seen to provide higher formability in terms of a maximum forming wall angle. This strategy, similar to climb milling, provides a more intense friction interaction between the sheet and the tool than the conventional SPIF strategy.
4. Conclusions
In this paper, a split-plot I-optimal design was used to determine the input parameters for the warm SPIF process on Ti-6Al-4V sheets in order to maximise the formable wall angle and to predict the in-plane and axial forming force components. Models were fitted using REstricted Maximum Likelihood (REML), and p-values are derived using the Kenward–Roger approximation. The following main conclusions can be drawn from the research:
- Observation of the fracture surface of Ti-6Al-4V drawpieces showed that the destruction is the result of a ductile fracture mode. An underside view of the fracture surface, related to the inner surface of the sheet, shows dimples similar to the ones due to ductile fracture under tensile stress. The outer part of the fracture surface presents small, partially formed dimples typical of shear load conditions.
- A simultaneous increase in oil pressure and tool rotational speed increases the maximum formable wall angle. In the case of the anticlockwise direction of tool rotation, larger maximum formable wall angles are obtainable.
- Feed rate and tool rotational speed are key parameters that affect the maximum formable wall angle.
- The high tool rotational speed is able to heat the material more and increase its formability. Increasing the tool rotational speed for a given level of feed rate increases the maximum achievable forming angle.
- Step size is the most significant factor that affects the in-plane SPIF force. Tool rotational speed and the direction of tool rotation have a significant effect; however, it is slightly smaller than step size.
- Tool rotational speed and step size are the most significant factors that affect the axial force, followed by feed rate.
- The change in oil pressure at a constant step size value did not have a significant effect on the axial force.
Future research should determine the influence of process parameters, in particular oil pressure and direction of tool rotation, on the shape and dimensional accuracy of the drawpieces. In addition, the effect of process parameters on the surface roughness parameters (Ra and Rz) of the inner and outer surfaces of drawpieces will be examined. Future studies, including the evaluation of residual stress gradients during both climbing and conventional SPIF, are therefore necessary to obtain a better understanding of the processes and behaviours affecting warm forming of Ti-6Al-4V Ti-based alloy sheets.
Author Contributions
Conceptualization, T.T. and M.S.; methodology, T.T., M.S. and R.O.; validation, M.S. and R.O.; formal analysis, T.T., M.S. and R.O.; investigation, T.T., M.S. and R.O.; data curation, T.T. and M.S.; writing—original draft preparation, T.T.; writing—review and editing, T.T. All authors have read and agreed to the published version of the manuscript.
Funding
This research received no external funding.
Institutional Review Board Statement
Not applicable.
Informed Consent Statement
Not applicable.
Data Availability Statement
The data presented in this study are available on request from the corresponding author.
Conflicts of Interest
The authors declare no conflict of interest.
References
- Iseki, H.; Naganawa, T.; Kato, K. Flexible and Incremental Sheet Metal Bulging Using a Path-Controlled Spherical Roller: 2nd Report, Vertical Wall Surface Forming of Rectangular Shell Using Multistage Incremental Forming with Spherical and Cylindrical Rollers. Trans. Jpn. Soc. Mech. Eng. Ser. C 1996, 62, 1600–1605. [Google Scholar] [CrossRef][Green Version]
- Milutinović, M.; Lendjel, R.; Baloš, S.; Zlatanović, D.L.; Sevšek, L.; Pepelnjak, T. Characterisation of Geometrical and Physical Properties of a Stainless Steel Denture Framework Manufactured by Single-Point Incremental Forming. J. Mater. Res. Technol. 2021, 10, 605–623. [Google Scholar] [CrossRef]
- Behera, A.K.; de Sousa, R.A.; Ingarao, G.; Oleksik, V. Single Point Incremental Forming: An Assessment of the Progress and Technology Trends from 2005 to 2015. J. Manuf. Process. 2017, 27, 37–62. [Google Scholar] [CrossRef]
- Żaba, K.; Głodzik, M.; Puchlerska, S.; Pociecha, D.; Nowosielski, M.; Kwiatkowski, M. Analysis of the formability in the incremental sheet forming process. In Proceedings of the 24th International Conference on Metallurgy and Materials-Metal, Brno, Czech Republic, 3–5 June 2015; pp. 1–6. [Google Scholar]
- Petek, A.; Gantar, G.; Pepelnjak, T.; Kuzman, K. Economical and Ecological Aspects of Single Point Incremental Forming versus Deep Drawing Technology. Key Eng. Mater. 2007, 344, 931–938. [Google Scholar] [CrossRef]
- Leonhardt, A.; Kurz, G.; Victoria-Hernández, J.; Kräusel, V.; Landgrebe, D.; Letzig, D. Experimental Study on Incremental Sheet Forming of Magnesium Alloy AZ31 with Hot Air Heating. Procedia Manuf. 2018, 15, 1192–1199. [Google Scholar] [CrossRef]
- Ortiz, M.; Penalva, M.; Iriondo, E.; de Lacalle, L.N.L. Accuracy and Surface Quality Improvements in the Manufacturing of Ti-6Al-4V Parts Using Hot Single Point Incremental Forming. Metals 2019, 9, 697. [Google Scholar] [CrossRef]
- Honarpisheh, M.; Abdolhoseini, M.J.; Amini, S. Experimental and Numerical Investigation of the Hot Incremental Forming of Ti-6Al-4V Sheet Using Electrical Current. Int. J. Adv. Manuf. Technol. 2016, 83, 2027–2037. [Google Scholar] [CrossRef]
- Vahdani, M.; Mirnia, M.J.; Bakhshi-Jooybari, M.; Gorji, H. Electric Hot Incremental Sheet Forming of Ti-6Al-4V Titanium, AA6061 Aluminum, and DC01 Steel Sheets. Int. J. Adv. Manuf. Technol. 2019, 103, 1199–1209. [Google Scholar] [CrossRef]
- Göttmann, A.; Diettrich, J.; Bergweiler, G.; Bambach, M.; Hirt, G.; Loosen, P.; Poprawe, R. Laser-Assisted Asymmetric Incremental Sheet Forming of Titanium Sheet Metal Parts. Prod. Eng. 2011, 5, 263–271. [Google Scholar] [CrossRef]
- Göttmann, A.; Bailly, D.; Bergweiler, G.; Bambach, M.; Stollenwerk, J.; Hirt, G.; Loosen, P. A Novel Approach for Temperature Control in ISF Supported by Laser and Resistance Heating. Int. J. Adv. Manuf. Technol. 2013, 67, 2195–2205. [Google Scholar] [CrossRef]
- Grün, P.A.; Uheida, E.H.; Lachmann, L.; Dimitrov, D.; Oosthuizen, G.A. Formability of Titanium Alloy Sheets by Friction Stir Incremental Forming. Int. J. Adv. Manuf. Technol. 2018, 99, 1993–2003. [Google Scholar] [CrossRef]
- Khan, M.S.; Coenen, F.; Dixon, C.; El-Salhi, S.; Penalva, M.; Rivero, A. An Intelligent Process Model: Predicting Springback in Single Point Incremental Forming. Int. J. Adv. Manuf. Technol. 2015, 76, 2071–2082. [Google Scholar] [CrossRef]
- Zhang, Z.; Zhang, H.; Shi, Y.; Moser, N.; Ren, H.; Ehmann, K.F.; Cao, J. Springback Reduction by Annealing for Incremental Sheet Forming. Procedia Manuf. 2016, 5, 696–706. [Google Scholar] [CrossRef][Green Version]
- Bai, L.; Li, Y.; Yang, M.; Lin, Y.; Yuan, Q.; Zhao, R. Modeling and Analysis of Single Point Incremental Forming Force with Static Pressure Support and Ultrasonic Vibration. Materials 2019, 12, 1899. [Google Scholar] [CrossRef] [PubMed]
- Najm, S.M.; Paniti, I. Study on Effecting Parameters of Flat and Hemispherical End Tools in SPIF of Aluminium Foils. Teh. Vjesn. 2020, 27, 1844–1849. [Google Scholar] [CrossRef]
- Paniti, I.; Viharos, Z.J.; Harangozó, D.; Najm, S.M. Experimental and Numerical Investigation of Single Point Incremental Forming of Aluminium Alloy Foils. Acta Imeko 2020, 9, 25. [Google Scholar] [CrossRef]
- Honarpisheh, M.; Jobedar, M.M.; Alinaghian, I. Multi-Response Optimization on Single-Point Incremental Forming of Hyperbolic Shape Al-1050/Cu Bimetal Using Response Surface Methodology. Int. J. Adv. Manuf. Technol. 2018, 96, 3069–3080. [Google Scholar] [CrossRef]
- Kurra, S.; HR, N.; Regalla, S.; Gupta, A.K. Parametric Study and Multi-Objective Optimization in Single-Point Incremental Forming of Extra Deep Drawing Steel Sheets. Proc. Inst. Mech. Eng. Part B J. Eng. Manuf. 2016, 230, 825–837. [Google Scholar] [CrossRef]
- Szpunar, M.; Ostrowski, R.; Trzepieciński, T.; Kaščák, Ľ. Central Composite Design Optimisation in Single Point Incremental Forming of Truncated Cones from Commercially Pure Titanium Grade 2 Sheet Metals. Materials 2021, 14, 3634. [Google Scholar] [CrossRef] [PubMed]
- Najm, S.M.; Paniti, I. Artificial Neural Network for Modeling and Investigating the Effects of Forming Tool Characteristics on the Accuracy and Formability of Thin Aluminum Alloy Blanks When Using SPIF. Int. J. Adv. Manuf. Technol. 2021, 114, 2591–2615. [Google Scholar] [CrossRef]
- Maji, K.; Kumar, G. Inverse Analysis and Multi-Objective Optimization of Single-Point Incremental Forming of AA5083 Aluminum Alloy Sheet. Soft Comput. 2020, 24, 4505–4521. [Google Scholar] [CrossRef]
- Durante, M.; Formisano, A.; Langella, A.; Capece Minutolo, F.M. The Influence of Tool Rotation on an Incremental Forming Process. J. Mater. Process. Technol. 2009, 209, 4621–4626. [Google Scholar] [CrossRef]
- Hussain, G.; Gao, L.; Zhang, Z.Y. Formability Evaluation of a Pure Titanium Sheet in the Cold Incremental Forming Process. Int. J. Adv. Manuf. Technol. 2008, 37, 920–926. [Google Scholar] [CrossRef]
- Racz, S.G.; Breaz, R.E.; Tera, M.; Gîrjob, C.; Biriș, C.; Chicea, A.L.; Bologa, O. Incremental Forming of Titanium Ti6Al4V Alloy for Cranioplasty Plates—Decision-Making Process and Technological Approaches. Metals 2018, 8, 626. [Google Scholar] [CrossRef]
- Mohanraj, R.; Elangovan, S. Incremental Sheet Metal Forming of Ti-6Al-4V Alloy for Aerospace Application. Trans. Can. Soc. Mech. Eng. 2020, 44, 56–64. [Google Scholar] [CrossRef]
- Palumbo, G.; Brandizzi, M.; Cervelli, G.; Fracchiolla, M. Investigations about the Single Point Incremental Forming of Anisotropic Titanium Alloy Sheets. Adv. Mater. Res. 2011, 264–265, 188–193. [Google Scholar] [CrossRef]
- Naranjo, J.; Miguel, V.; Martínez, A.; Coello, J.; Manjabacas, M.C.; Valera, J. Influence of Temperature on Alloy Ti6Al4V Formability during the Warm SPIF Process. Procedia Eng. 2017, 207, 866–871. [Google Scholar] [CrossRef]
- Sbayti, M.; Bahloul, R.; Belhadjsalah, H. Numerical Modeling of Hot Incremental Forming Process for Biomedical Application. In Design and Modeling of Mechanical Systems—III; Haddar, M., Chaari, F., Benamara, A., Chouchane, M., Karra, C., Aifaoui, N., Eds.; Lecture Notes in Mechanical Engineering; Springer International Publishing: Cham, Switzerland, 2018; pp. 881–891. ISBN 978-3-319-66696-9. [Google Scholar]
- Sbayti, M.; Ghiotti, A.; Bahloul, R.; Belhadjsalah, H.; Bruschi, S. Finite Element Analysis of Hot Single Point Incremental Forming of Hip Prostheses. MATEC Web Conf. 2016, 80, 14006. [Google Scholar] [CrossRef]
- Oleksik, V.; Trzepieciński, T.; Szpunar, M.; Chodoła, Ł.; Ficek, D.; Szczęsny, I. Single-Point Incremental Forming of Titanium and Titanium Alloy Sheets. Materials 2021, 14, 6372. [Google Scholar] [CrossRef] [PubMed]
- Trzepieciński, T.; Oleksik, V.; Pepelnjak, T.; Najm, S.M.; Paniti, I.; Maji, K. Emerging Trends in Single Point Incremental Sheet Forming of Lightweight Metals. Metals 2021, 11, 1188. [Google Scholar] [CrossRef]
- Ambrogio, G.; Filice, L.; Manco, G.L. Warm Incremental Forming of Magnesium Alloy AZ31. CIRP Ann. 2008, 57, 257–260. [Google Scholar] [CrossRef]
- Pederson, R. Microstructure and Phase Transformation of Ti-6Al-4V. Licentiate Thesis, Luleå University of Technology, Luleå, Sweden, May 2002. [Google Scholar]
- Villa, M.; Brooks, J.W.; Turner, R.P.; Wang, H.; Boitout, F.; Ward, R.M. Microstructural Modeling of the α + β Phase in Ti-6Al-4V: A Diffusion-Based Approach. Metall. Mater. Trans. 2019, 50, 2898–2911. [Google Scholar] [CrossRef]
- ISO 5832-3:2016; Implants for Surgery—Metallic Materials—Part 3: Wrought Titanium 6-Aluminium 4-Vanadium Alloy. International Organization for Standardization: Geneva, Switzerland, 2016.
- Jones, B.; Goos, P. I-Optimal Versus D-Optimal Split-Plot Response Surface Designs. J. Qual. Technol. 2012, 44, 85–101. [Google Scholar] [CrossRef]
- Balicki, S. Optymalizacja procesów jednostkowych w technologii organicznej. Przemysł Chem. 2021, 5, 490–497. [Google Scholar] [CrossRef]
- Turnage, S.A.; Darling, K.A.; Rajagopalan, M.; Whittington, W.R.; Tschopp, M.A.; Peralta, P.; Solanki, K.N. Quantifying Structure-Property Relationships during Resistance Spot Welding of an Aluminum 6061-T6 Joint. Available online: https://arxiv.org/ftp/arxiv/papers/1605/1605.04251.pdf (accessed on 4 November 2021).
- ASM International. ASM Handbook Volume 12: Fractography; ASM International: Materials Park, OH, USA, 2001. [Google Scholar]
- Valoppi, B.; Zhang, Z.; Deng, M.; Ghiotti, A.; Bruschi, S.; Ehmann, K.F.; Cao, J. On the Fracture Characterization in Double-Sided Incremental Forming of Ti6Al4V Sheets at Elevated Temperatures. Procedia Manuf. 2017, 10, 407–416. [Google Scholar] [CrossRef]
- Radkiewicz, P.; Zieliński, M.W. Hierarchiczne modele liniowe. Co nam dają i kiedy warto je stosować. Psychol. Społeczna 2010, 5, 217–233. [Google Scholar]
- Durante, M.; Formisano, A.; Lambiase, F. Formability of polycarbonate sheets in single-point incremental forming. Int. J. Adv. Manuf. Technol. 2016, 102, 2049–2062. [Google Scholar] [CrossRef]
- Kumar, S.P.; Elangovan, S.; Mohanraj, R. Experimental study on single point incremental forming of Inconel 718. Trans. Can. Soc. Mech. Eng. 2020, 44, 179–188. [Google Scholar] [CrossRef]
- Baharudin, B.T.H.T.; Azpen, Q.M.; Sulaima, S.; Mustapha, F. Experimental Investigation of Forming Forces in Frictional Stir Incremental Forming of Aluminum Alloy AA6061-T6. Metals 2017, 7, 484. [Google Scholar] [CrossRef]
Publisher’s Note: MDPI stays neutral with regard to jurisdictional claims in published maps and institutional affiliations. |
© 2022 by the authors. Licensee MDPI, Basel, Switzerland. This article is an open access article distributed under the terms and conditions of the Creative Commons Attribution (CC BY) license (https://creativecommons.org/licenses/by/4.0/).